Climate change and Allergy in Washington, DC USA
•
1 gostou•965 visualizações

Climate change-mediated effects on the environment in may worsen the burden allergies in the Washington, DC, area, with significant health and economic impact, and amplifying feedbacks in the form of pharmaceutical use. Temperature change in our nation’s capital are changing the plant behavior in such a way to lengthen and increase pollen exposure for residents. Work is under way to understand the true impact of these changes in our cities, however, there is indirect evidence that changes in allergic disease are likely, and good evidence that increased allergic disease severity results in significant economic loss for communities.
![Change in plant behavior, Washington, DC
Cherry Trees will experience peak bloom 29 days sooner by 2080
Looking at the tree population in Washington, DC, shows that there has been gradual
advancing of first flowering, estimated to be 4.5 days from 1970 to 1999. An analysis
performed of one of the region’s most econimically important tree species, cherry trees,
predicts up to a 29 day acceleration in the timing of cherry blossoms by 2080 1, with a
peak bloom date of March 4. The current Washington, DC, cherry blossom festival runs
from March 20 - April 14.
Oak Trees (Quercus species)
The author has an interest in this species as a known precipitant of severe allergic
rhinitis and conjunctivities and even seasonal asthma. In 2013 there was a significant
spike in tree pollen count levels (2870 grains/cubic meter), the highest in 12 of the last
1
Chung U, Mack L, Yun JI, Kim S-H. Predicting the timing of cherry blossoms in Washington, DC and
Mid-Atlantic States in response to climate change. PloS one. 2011;6(11):e27439. Available at: http://
www.plosone.org/article/info:doi/10.1371/journal.pone.0027439#s1 [Accessed May 22, 2013].](data:image/gif;base64,R0lGODlhAQABAIAAAAAAAP///yH5BAEAAAAALAAAAAABAAEAAAIBRAA7)
Recomendados
Mais conteúdo relacionado
Mais procurados
Mais procurados (20)
Destaque
Destaque (8)
Semelhante a Climate change and Allergy in Washington, DC USA
Semelhante a Climate change and Allergy in Washington, DC USA (20)
Mais de Ted Eytan, MD, MS, MPH
Mais de Ted Eytan, MD, MS, MPH (20)
Último
Último (20)
Climate change and Allergy in Washington, DC USA
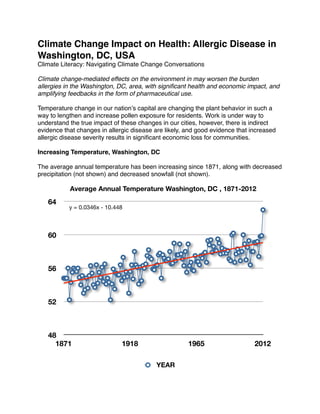
- 1. Climate Change Impact on Health: Allergic Disease in Washington, DC, USA Climate Literacy: Navigating Climate Change Conversations Climate change-mediated effects on the environment in may worsen the burden allergies in the Washington, DC, area, with significant health and economic impact, and amplifying feedbacks in the form of pharmaceutical use. Temperature change in our nation’s capital are changing the plant behavior in such a way to lengthen and increase pollen exposure for residents. Work is under way to understand the true impact of these changes in our cities, however, there is indirect evidence that changes in allergic disease are likely, and good evidence that increased allergic disease severity results in significant economic loss for communities. Increasing Temperature, Washington, DC The average annual temperature has been increasing since 1871, along with decreased precipitation (not shown) and decreased snowfall (not shown). Average Annual Temperature Washington, DC , 1871-2012 64 y = 0.0346x - 10.448 60 56 52 48 1871 1918 1965 YEAR 2012
- 2. Change in plant behavior, Washington, DC Cherry Trees will experience peak bloom 29 days sooner by 2080 Looking at the tree population in Washington, DC, shows that there has been gradual advancing of first flowering, estimated to be 4.5 days from 1970 to 1999. An analysis performed of one of the region’s most econimically important tree species, cherry trees, predicts up to a 29 day acceleration in the timing of cherry blossoms by 2080 1, with a peak bloom date of March 4. The current Washington, DC, cherry blossom festival runs from March 20 - April 14. Oak Trees (Quercus species) The author has an interest in this species as a known precipitant of severe allergic rhinitis and conjunctivities and even seasonal asthma. In 2013 there was a significant spike in tree pollen count levels (2870 grains/cubic meter), the highest in 12 of the last 1 Chung U, Mack L, Yun JI, Kim S-H. Predicting the timing of cherry blossoms in Washington, DC and Mid-Atlantic States in response to climate change. PloS one. 2011;6(11):e27439. Available at: http:// www.plosone.org/article/info:doi/10.1371/journal.pone.0027439#s1 [Accessed May 22, 2013].
- 3. 15 pollen seasons. In addition, 2012 saw a pollen count peak that occurred three weeks earlier than normal (3/28/2012, expected 4/18/2012).23 The actual health impact of changing pollen behavior is under intense study through programs sponsored by the US Environmental Protection Agency and beyond.45 In some cases, and earlier peak may mean a season that ends earlier. On the other hand, a higher peak may mean increased severity of symptoms. A study of Quercus species in Spain showed, “Results indicate that under a doubled CO2 scenario at the end of the 21st century Quercus pollination season could start on average one month earlier and airborne pollen concentrations will increase by 50% with respect to current levels, with higher values in Mediterranean inland areas.”6 Negative Impact on Health and Related Losses It is generally believed that increased pollen counts over longer periods of time will increase sensitization (creation and building of the immune response that causes allergic symptoms), allergic symptoms, and worsening of allergic airway disease.7 This analysis focuses on allergy only, which by itself has significant impacts on health and productivity. Well done studies of the impact of various chronic coniditions in the workplace rank allergy higher than diabetes and cancer in overall costs to employers 2 Samenow J. Tree pollen spikes to highest level since 2010. The Washington Post. 2013. Available at: http://www.washingtonpost.com/blogs/capital-weather-gang/wp/2013/04/19/tree-pollen-spikes-to-highestlevel-since-2010/ [Accessed June 16, 2013]. 3 Samenow J. Worst of tree pollen season may be over. The Washington Post. 2013. Available at: http:// www.washingtonpost.com/blogs/capital-weather-gang/wp/2013/04/22/tree-pollen-may-have-peakedlower-levels-arriving/ [Accessed June 16, 2013]. 4 US EPA ERC. Extramural Research - Global Change Research Program. Available at: http:// www.epa.gov/ncer/science/globalclimate/ [Accessed June 16, 2013]. 5 US EPA ERC. Research Project Database | NCER | ORD | US EPA. Available at: http://cfpub.epa.gov/ ncer_abstracts/index.cfm/fuseaction/recipients.display/rfa_id/503/records_per_page/ALL [Accessed June 16, 2013]. 6 García-Mozo H, Galán C, Jato V. Quercus pollen season dynamics in the Iberian peninsula: response to meteorological parameters and possible consequences of climate change. Annals of Agricultural …. 2006. Available at: http://www.uco.es/aerobiologia/publicaciones/modelling/climate_change/ Quercus_AAEM_def.pdf [Accessed June 16, 2013]. 7 Blando J, Bielory L, Nguyen V, Diaz R, Jeng HA. Anthropogenic Climate Change and Allergic Diseases. Atmosphere. 2012;3(4):200–212. Available at: http://www.mdpi.com/2073-4433/3/1/200 [Accessed June 16, 2013].
- 4. due to lost productivity and absenteism, and much higher than asthma, due to the number of people affected.8 Total Employer Costs /Employee/Condition/Year $USD - (Across All Employees) $400.00 247 71 $300.00 246 271 32 266 159 $200.00 54 76 $100.00 23 75 91 $0 Hypertension Diabetes Medical 100 48 7 61 Cancer 54 Heart Disease Behavioral Health Absence+STD 20 29 Allergy 9 19 Asthma Presenteeism (Lost Productivity) A typical regimen for the author during peak season looks like this. The cost of the medications themselves is added to the cost of the time involved to administer them, in addition to supplemental medical care that is required for symptoms. An Amplifying Feedback The photograph below was taken at a local drug store in Washington, DC, during the 2012 peak pollen season. It shows the 8 Goetzel RZ, Long SR, Ozminkowski RJ, et al. Health, Absence, Disability, and Presenteeism Cost Estimates of Certain Physical and Mental Health Conditions Affecting U.S. Employers. Journal of Occupational and Environmental Medicine. 2004;46(4):398–412. Available at: http:// content.wkhealth.com/linkback/openurl?sid=WKPTLP:landingpage&an=00043764-200404000-00013 [Accessed October 19, 2010].
- 5. cleaned out shelves of allergy relief medications. The demand for these medications, stimulated by pollen in the atmosphere, in turn feeds back to the production and transport system for these medications. The manufacture of pharmaceuticals accounts for 14% of carbon dioxide production in health care in the United States (21% in the UK)9 , and health care in the United States is responsible for 8% of the carbon dioxide production in the United States.10 Therefore, increased demand for medications and medical care increases the production of carbon dioxide, which feeds back into the climate system. Conclusion As the climate system is sensitive to human perturbations, so is the human immune system to the climate system, which reacts to changes in pollen counts with increased and prolonged reactions to airborne allergens. Plant behavior is changing in the Washington, DC area, which will create downstream effects on human health and ultimately amplifying feedback on the climate system itself. While the current Washington, DC sustainability plan links to a strategic plan for addressing asthma in the District by managing air quality 11, it is unclear how the impact of allergic illnesses resulting from changes in plant behavior can be mitigated in the future. 9 Harvie J, Schettler T, Mikkelsen L, Flora C. Common Drivers Common Solutions. 2011. Available at: http://129.186.33.245/staff/cflora/Commondrivers.pdf [Accessed February 20, 2012]. 10 Chung JW, Meltzer DO. Estimate of the Carbon Footprint of the US Health Care Sector. JAMA. 2009;302(18):1970–1972. Available at: http://jama.ama-assn.org [Accessed December 2, 2009]. 11 Sustainable DC Plan | sustainable. Available at: http://sustainable.dc.gov/finalplan [Accessed June 16, 2013].