Mission Measurement Social Value Index (SVI) Scorecard
•
2 gostaram•3,603 visualizações

The Social Value Index and its components - the Social Value Score™ and Social Value Scorecard™ - identify and quantify three core insights: 1) the social value drivers of a specific industry that influence consumer demand and determine if a brand’s social impact efforts are relevant to their consumers; 2) the ratings and rankings of key competitors within an industry so a brand can see how successfully it is using social impact to influence consumer purchase compared to its peers; and 3) the estimated revenue increase, in dollars, for improving its Social Value Score™.
Recomendados

Recomendados
Mais conteúdo relacionado
Mais de Sustainable Brands
Mais de Sustainable Brands (20)
Último
Último (20)
Mission Measurement Social Value Index (SVI) Scorecard
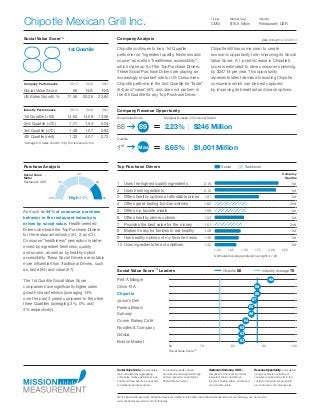
- 1. Social Traditional Social Value ScoreTM Company Analysis 1st Quartile 88Company Performance 2013 2012 2011 Social Value Score 88 N/A N/A US Sales Growth % 17.58 20.26 23.64 Industry Performance 2013 2012 2011 1st Quartile (>83) 14.63 14.09 13.58 2nd Quartile (>75) 1.01 1.54 5.04 3rd Quartile (>70) -1.48 1.07 0.84 4th Quartile (rest) 1.32 4.07 2.73 *Average US Sales Growth % by Social Value Score Social Value Score is a proprietary rank, calculated by aggregating companies’ relative performance on social purchase drivers, as opposed to traditional purchase drivers. The industry specific drivers are derived and weighted through primary research conducted by Mission Measurement. Restaurant Industry: QSR is comprised of the most prominent restaurant chains operating in the US; including public, private and non-US restaurants. Revenue Opportunity is calculated using econometric modeling of consumer choice trade-offs in the context of reported annual spend per consumer, and company size. ©2014 Mission Measurment. All Rights Reserved. Additional information about Mission Measurement’s methodology can be found at www.missionmeasurement.com/methodolgy Chipotle Mexican Grill Inc. 1 Uses the highest quality ingredients 2.19 1st 2 Uses fresh ingredients 2.15 1st 3 Offers healthy options at affordable prices 1.81 1st 4 Offers great-tasting food and drinks 1.62 2nd 5 Offers my favorite meals 1.58 1st 6 Offers healthy dinner options 1.53 1st 7 Provides the best value for the money 1.51 2nd 8 Makes it easy for families to eat healthy 1.49 1st 9 Has healthy options of my favorite meals 1.46 1st 10 Uses ingredients free of additives 1.42 1st Chipotle continues to be a 1st Quartile performer on “ingredient quality, freshness and source” as well as “healthiness accessibility”, which make up 8 of the Top Purchase Drivers. These Social Purchase Drivers are playing an increasingly important role for US Consumers. Chipotle performs in the 2nd Quartile for “taste” (#4) and “value” (#7); and does not perform in the 4th Quartile for any Top Purchase Driver. Chipotle still has some room to create economic opportunity from improving its Social Value Score. A 1-point increase in Chipotle’s score is estimated to drive consumer spending by $247 M per year. This opportunity represents latent demand in existing Chipotle consumers which can be best captured by improving its breakfast and snack options. As much as 44% of consumer purchase behavior in the restaurant industry is driven by social value. Health-oriented Drivers dominate the Top Purchase Drivers for the restaurant industry (#1, 2, and 3). Consumer “healthiness” perception is deter- mined by ingredient freshness, quality and source, as well as by healthy-option accessibility. These Social Drivers are notably more influential than Traditional Drivers, such as, taste (#4) and value (#7). The 1st Quartile Social Value Score companies have significantly higher sales growth characteristics (averaging 14% over the past 3 years) compared to the other three Quartiles (averaging 3%, 0%, and 3% respectively). Top Purchase DriversPurchase Analysis Company Revenue Opportunity Normalized: Average preference weight is 1.00 Company Quartile Social Value Meter Restaurant: QSR Social Value Score Quartile Marginal Increase in Consumer Spend 1.00 1.25 1.50 1.75 2.00 2.25 Ticker Market Cap Industry CMG $16.5 billion Restaurant: QSR Pret A Manger Chick-fil-A Chipotle Jason’s Deli Panera Bread Subway Corner Bakery Café Noodles & Company Qdoba Boston Market Chipotle 88 Industry Average 76Social Value ScoreTM Leaders 60 70 80 90 100 Social Value ScoreTM 88 86 87 83 83 92 86 88 84 83 88 1st 2.23% | $246 Million 8.65% | $1,001 Million 89 Max Data through 12-31-2013 10% 20 50 40 High 30 10% 20 50 40 Good30 10% 20 50 40 Good 32% 30 Low Fair Good High 10% 20 50 40 High 44% 30 Low Fair Good High 10% 20 50 40 High 44% 30 10% 20 50 40 Good 36% 30