SlideShare uma empresa Scribd logo
1 de 50
Baixar para ler offline
Chapter 1
Optimization using
optim() in R
An in-class activity to apply Nelder-Mead and Simulated Annealing in
optim() for a variety of bivariate functions.
# SC1 4/18/2013
# Everyone optim()!
# The goal of this exercise is to minimize a function using R's optim().
# Steps:
# 0. Break into teams of size 1 or 2 students.
# 1. Each team will choose a unique function from this list:
# Test functions for optimization
# http://en.wikipedia.org/wiki/Test_functions_for_optimization
# 1a. Claim the function by typing your names into the function section below.
# 1b. Click on "edit" on Wikipedia page to copy latex math for function
# and paste between dollar signs $f(x)$
# 2. Following my "Sphere function" example:
# 2a. Define function()
# 2b. Plot the function
# 2c. Optimize (minimize) the function
# 2d. Comment on convergence
# 3. Paste your work into your function section.
# 4. I'll post this file on the website for us all to enjoy, as well as create
# a lovely pdf with images of the functions.
2 Optimization using optim() in R
1.1 Sphere function
f(x) = n
i=1 x2
i
########################################
# Sphere function
# Erik Erhardt
# $f(boldsymbol{x}) = sum_{i=1}^{n} x_{i}^{2}$
# name used in plot below
f.name <- "Sphere function"
# define the function
f.sphere <- function(x) {
# make x a matrix so this function works for plotting and for optimizing
x <- matrix(x, ncol=2)
# calculate the function value for each row of x
f.x <- apply(x^2, 1, sum)
# return function value
return(f.x)
}
# plot the function
# define ranges of x to plot over and put into matrix
x1 <- seq(-10, 10, length = 101)
x2 <- seq(-10, 10, length = 101)
X <- as.matrix(expand.grid(x1, x2))
colnames(X) <- c("x1", "x2")
# evaluate function
y <- f.sphere(X)
# put X and y values in a data.frame for plotting
df <- data.frame(X, y)
# plot the function
library(lattice) # use the lattice package
wireframe(y ~ x1 * x2 # y, x1, and x2 axes to plot
, data = df # data.frame with values to plot
, main = f.name # name the plot
, shade = TRUE # make it pretty
, scales = list(arrows = FALSE) # include axis ticks
, screen = list(z = -50, x = -70) # view position
)
# optimize (minimize) the function using Nelder-Mead
1.1 Sphere function 3
out.sphere <- optim(c(1,1), f.sphere, method = "Nelder-Mead")
out.sphere
## $par
## [1] 3.754e-05 5.179e-05
##
## $value
## [1] 4.092e-09
##
## $counts
## function gradient
## 63 NA
##
## $convergence
## [1] 0
##
## $message
## NULL
# optimize (minimize) the function using Simulated Annealing
out.sphere <- optim(c(1,1), f.sphere, method = "SANN")
out.sphere
## $par
## [1] 0.0001933 -0.0046280
##
## $value
## [1] 2.146e-05
##
## $counts
## function gradient
## 10000 NA
##
## $convergence
## [1] 0
##
## $message
## NULL
###
# comments based on plot and out.*
4 Optimization using optim() in R
# The unique minimum was found within tolerance.
## values of x1 and x2 at the minimum
# $par
# [1] 3.754010e-05 5.179101e-05
#
## value of the function at the minimum
# $value
# [1] 4.091568e-09
#
## convergence in 63 iterations
# $counts
# function gradient
# 63 NA
#
## 0 = convergence successful
# $convergence
# [1] 0
#
## no news is good news
# $message
# NULL
Sphere function
−10
−5
0
5
10 −10
−5
0
5
10
0
50
100
150
200
x1
x2
y
1.2 Sphere function with stochastic noise 5
1.2 Sphere function with stochastic noise
########################################
# Sphere function with stochastic noise
# Christian Gunning
# name used in plot below
f.name <- "Sphere function with stochastic noise at each iteration"
# define the function
f.sphere1 <- function(x) {
# make x a matrix so this function works for plotting and for optimizing
x <- matrix(x, ncol=2)
# calculate the function value for each row of x
# f.x <- apply(x, 1, function(y) {ret<- sum(y^2) })
f.x <- apply(x, 1, function(y) {ret<- sum(y^2)+rnorm(1,mean=1,sd=abs(mean(y))^(1/10))}
# return function value
return(f.x)
}
# plot the function
# define ranges of x to plot over and put into matrix
x1 <- seq(-10, 10, length = 101)
x2 <- seq(-10, 10, length = 101)
X <- as.matrix(expand.grid(x1, x2))
colnames(X) <- c("x1", "x2")
# evaluate function
y <- f.sphere1(X)
# put X and y values in a data.frame for plotting
df <- data.frame(X, y)
# plot the function
library(lattice) # use the lattice package
wireframe(y ~ x1 * x2 # y, x1, and x2 axes to plot
, data = df # data.frame with values to plot
, main = f.name # name the plot
, shade = TRUE # make it pretty
, scales = list(arrows = FALSE) # include axis ticks
, screen = list(z = -50, x = -70) # view position
)
# optimize (minimize) the function using Nelder-Mead
out.NM <- optim(c(1,1), f.sphere1, method = "Nelder-Mead")
out.NM
6 Optimization using optim() in R
## $par
## [1] 0.875 1.150
##
## $value
## [1] 0.2255
##
## $counts
## function gradient
## 321 NA
##
## $convergence
## [1] 10
##
## $message
## NULL
# optimize (minimize) the function using Simulated Annealing
out.sann <- optim(c(1,1), f.sphere1, method = "SANN")
out.sann
## $par
## [1] -0.7529 -0.3134
##
## $value
## [1] -1.036
##
## $counts
## function gradient
## 10000 NA
##
## $convergence
## [1] 0
##
## $message
## NULL
1.2 Sphere function with stochastic noise 7
Sphere function with stochastic noise at each iteration
−10
−5
0
5
10 −10
−5
0
5
10
0
50
100
150
200
x1
x2
y
8 Optimization using optim() in R
1.3 Rosenbrock function
########################################
# Rosenbrock function
# Mary Rose Paiz
# name used in plot below
f.name <- "Rosenbrock Function"
# define the function
f.rosenbrock <- function(x) {
x1 <- x[,1]
x2 <- x[,2]
# calculating f.x
term1 <- (x2 - (x1)^2)^2
term2 <- (x1 - 1)^2
f.x <- (100*term1 + term2)
# return function value
return(f.x)
}
# plot the function
# define ranges of x to plot over and put into matrix
x1 <- seq(-1.5, 2.0, length = 101)
x2 <- seq(.5, 3.0, length = 101)
X <- as.matrix(expand.grid(x1, x2))
colnames(X) <- c("x1", "x2")
# evaluate function
y <- f.rosenbrock(X)
# put X and y values in a data.frame for plotting
df <- data.frame(X, y)
# plot the function
library(lattice) # use the lattice package
wireframe(y ~ x1 * x2 # y, x1, and x2 axes to plot
, data = df # data.frame with values to plot
, main = f.name # name the plot
, shade = TRUE # make it pretty
, scales = list(arrows = FALSE) # include axis ticks
, screen = list(z = -75, x = -50) # view position
)
1.3 Rosenbrock function 9
# optimize (minimize) the function using Nelder-Mead
out.rosenbrock <- optim(c(1,1), f.rosenbrock, method = "Nelder-Mead")
## Error: incorrect number of dimensions
out.rosenbrock
## Error: object ’out.rosenbrock’ not found
# optimize (minimize) the function using Simulated Annealing
out.rosenbrock <- optim(c(1,1), f.rosenbrock, method = "SANN")
## Error: incorrect number of dimensions
out.rosenbrock
## Error: object ’out.rosenbrock’ not found
Rosenbrock Function
−1.5
−1.0
−0.5
0.0
0.5
1.0
1.5
2.0
0.5
1.0
1.5
2.0
2.5
3.0
200
400
600
800
1000
1200
x1
x2
y
10 Optimization using optim() in R
1.4 Beale’s function
f(x, y) = (1.5 − x + xy)2
+ 2.25 − x + xy2 2
+ 2.625 − x + xy3 2
.
########################################
# Beale's function
# Alvaro
#$$f(x,y) = left( 1.5 - x + xy right)^{2} + left( 2.25 - x + xy^{2}right)^{2} + left(2.62
#Minimum:
#$$f(3, 0.5) = 0
#-4.5 le x,y le 4.5$$
# name used in plot below
f.name <- "Beale's function"
# define the function
f.beale <- function(mx) {
mx <- matrix(mx, ncol=2)
x<- mx[,1]
y<- mx[,2]
f.x<- (1.5 - x +x*y)^2 + (2.25-x+(x*y)^2)^2 + (2.625-x+(x*y)^3)^2
return(f.x)
}
# plot the function
# define ranges of x to plot over and put into matrix
x1 <- seq(-4.5, 4.5, length = 101)
x2 <- seq(-4.5, 4.5, length = 101)
X <- as.matrix(expand.grid(x1, x2))
colnames(X) <- c("x1", "x2")
# evaluate function
y <- log10(f.beale(X))
# put X and y values in a data.frame for plotting
df <- data.frame(X, y)
# plot the function
library(lattice) # use the lattice package
wireframe(y ~ x1 * x2 # y, x1, and x2 axes to plot
, data = df # data.frame with values to plot
, main = f.name # name the plot
1.4 Beale’s function 11
, shade = TRUE # make it pretty
, scales = list(arrows = FALSE) # include axis ticks
, screen = list(z = 0, x = 0) # view position
)
# optimize (minimize) the function using Nelder-Mead
out.beale <- optim(c(1,1), f.beale, method = "Nelder-Mead")
out.beale
## $par
## [1] 2.4814 0.2284
##
## $value
## [1] 0.286
##
## $counts
## function gradient
## 83 NA
##
## $convergence
## [1] 0
##
## $message
## NULL
# optimize (minimize) the function using Simulated Annealing
out.beale <- optim(c(1,1), f.beale, method = "SANN")
out.beale
## $par
## [1] 2.4830 0.2269
##
## $value
## [1] 0.2861
##
## $counts
## function gradient
## 10000 NA
##
## $convergence
## [1] 0
##
## $message
## NULL
12 Optimization using optim() in R
###
# comments based on plot and out.*
# The unique minimum was found within tolerance.
Beale's function
−4 −2 0 2 4
−4
−2
0
2
4
0
2
4
6
x1
x2
y
1.5 Goldstein-Price function 13
1.5 Goldstein-Price function
f(x, y) = 1 + (x + y + 1)2
19 − 14x + 3x2
− 14y + 6xy + 3y2
30 + (2x −
########################################
# Goldstein-Price function
# Barnaly Rashid
#GoldsteinPrice function:
#$f(x,y) = left(1+left(x+y+1right)^{2}left(19-14x+3x^{2}-14y+6xy+3y^{2}right)righ
f.name <- "Goldstein-Price function"
# define the function
f.goldprice <- function(x1x2) {
# calculate the function value for x1 and x2
x1x2 <- matrix(x1x2,ncol=2)
a <- 1+(x1x2[,1]+x1x2[,2]+1)^2*(19-14*x1x2[,1]+3*x1x2[,1]^2-14*x1x2[,2]+6*x1x2[,1]*x1x
b <- 30 + (2*x1x2[,1]-3*x1x2[,2])^2*(18-32*x1x2[,1]+12*x1x2[,1]^2+48*x1x2[,2]-36*x1x2[
f.x <- a*b
# return function value
return(f.x)
}
# matrix(x1x2,ncol=2)
#plot the function
# define ranges of x to plot over
x1 <- seq(-1.5, 1.5, length = 101)
x2 <- seq(-1.5, 1.5, length = 101)
X <- as.matrix(expand.grid(x1, x2))
colnames(X) <- c("x1", "x2")
#y <- f.goldprice(X[,1],X[,2])
y <- f.goldprice(X)
# put X and y values in a data.frame for plotting
df <- data.frame(X, y)
library(lattice) # use the lattice package
14 Optimization using optim() in R
wireframe(y ~ x1 * x2 # y, x1, and x2 axes to plot
, data = df # data.frame with values to plot
, main = f.name # name the plot
, shade = TRUE # make it pretty
, scales = list(arrows = FALSE) # include axis ticks
, screen = list(z = -50, x = -70) # view position
)
# optimize (minimize) the function using Nelder-Mead
out.gold <- optim(c(0,-1), f.goldprice, method = "Nelder-Mead")
out.gold
## $par
## [1] 0 -1
##
## $value
## [1] 3
##
## $counts
## function gradient
## 57 NA
##
## $convergence
## [1] 0
##
## $message
## NULL
# optimize (minimize) the function using Simulated Annealing
out.gold <- optim(c(0,-1), f.goldprice, method = "SANN")
out.gold
## $par
## [1] 0 -1
##
## $value
## [1] 3
##
## $counts
## function gradient
## 10000 NA
##
1.5 Goldstein-Price function 15
## $convergence
## [1] 0
##
## $message
## NULL
Goldstein−Price function
−1.5
−1.0
−0.5
0.0
0.5
1.0
1.5 −1.5
−1.0
−0.5
0.0
0.5
1.0
1.5
1e+05
2e+05
3e+05
x1
x2
y
16 Optimization using optim() in R
1.6 Booth’s function
f(x) = (x + 2y − 7)2
+ (2x + y − 5)2
########################################
# Booth's function
# Olga Vitkovskaya
# $f(boldsymbol{x}) = (x + 2y -7)^{2}+(2x + y -5)^{2}$
# name used in plot below
f.name <- "Booth's function"
# define the function
f.booths <- function(xy) {
# make x a matrix so this function works for plotting and for optimizing
xy <- matrix(xy, ncol=2)
# calculate the function value for each row of x
f.row <- function(this.row) {
(this.row[1] + 2 * this.row[2] -7)^2 + (2 * this.row[1] + this.row[2] -5)^2
}
f.x <- apply(xy, 1, f.row)
# return function value
return(f.x)
}
# plot the function
# define ranges of x to plot over and put into matrix
x.plot <- seq(-10, 10, length = 101)
y.plot <- seq(-10, 10, length = 101)
grid.plot <- as.matrix(expand.grid(x.plot, y.plot))
colnames(grid.plot) <- c("x", "y")
# evaluate function
z.plot <- f.booths(grid.plot)
# put X, y and z values in a data.frame for plotting
df <- data.frame(grid.plot, z.plot)
# plot the function
library(lattice) # use the lattice package
1.6 Booth’s function 17
p <- wireframe(z.plot ~ x * y # y, x1, and x2 axes to plot
, data = df # data.frame with values to plot
, main = f.name # name the plot
, shade = TRUE # make it pretty
, scales = list(arrows = FALSE) # include axis ticks
, screen = list(z = -50, x = -70) # view position
)
plot(p)
# optimize (minimize) the function using Nelder-Mead
out.booth1 <- optim(c(1,1), f.booths, method = "Nelder-Mead")
out.booth1
## $par
## [1] 0.9999 3.0001
##
## $value
## [1] 4.239e-08
##
## $counts
## function gradient
## 69 NA
##
## $convergence
## [1] 0
##
## $message
## NULL
# optimize (minimize) the function using Simulated Annealing
out.booth2 <- optim(c(1,1), f.booths, method = "SANN")
out.booth2
## $par
## [1] 1.004 3.003
##
## $value
## [1] 0.0002215
##
## $counts
## function gradient
## 10000 NA
##
18 Optimization using optim() in R
## $convergence
## [1] 0
##
## $message
## NULL
Booth's function
−10
−5
0
5
10 −10
−5
0
5
10
0
500
1000
1500
2000
2500
x
y
z.plot
1.7 Booth’s function 19
1.7 Booth’s function
f(x, y) = (x + 2y − 7)2
+ (2x + y − 5)2
.
########################################
# Booth's function
# {Katherine Freeland)
# Booth's Function: $f(x,y) = left( x + 2y -7right)^{2} + left(2x +y - 5right)^{2}.q
# Minimum: $f(1,3) = 0</math>, for <math>-10 le x,y le 10</math>.$
f.booth <- function(xy){
xy <- matrix(xy, ncol=2)
f.x <- ((xy[,1] + (2*xy[,2]) - 7)^2) + ((2*xy[,1]+ xy[,2]-5)^2)
return(f.x)
}
x <- seq(-5, 5, length=101)
y <- seq(-5, 5, length=101)
mat <- as.matrix(expand.grid(x, y))
colnames(mat) <- c("x", "y")
f.x <- f.booth(mat)
df <- data.frame(mat, f.x)
library(lattice) # use the lattice package
wireframe(f.x ~ x * y # f.x, x, and y axes to plot
, data = df # data.frame with values to plot
, main = "Booth Function" # name the plot
, shade = TRUE # make it pretty
, scales = list(arrows = FALSE) # include axis ticks
, screen = list(z = -50, x = -70) # view position
)
# optimize (minimize) the function using Nelder-Mead
out.booth <- optim(c(1,1), f.booth, method = "Nelder-Mead")
out.booth
## $par
## [1] 0.9999 3.0001
##
## $value
## [1] 4.239e-08
20 Optimization using optim() in R
##
## $counts
## function gradient
## 69 NA
##
## $convergence
## [1] 0
##
## $message
## NULL
out.booth2 <- optim(c(1,1), f.booth, method = "SANN")
out.booth2
## $par
## [1] 1.000 3.002
##
## $value
## [1] 1.658e-05
##
## $counts
## function gradient
## 10000 NA
##
## $convergence
## [1] 0
##
## $message
## NULL
1.7 Booth’s function 21
Booth Function
−4
−2
0
2
4 −4
−2
0
2
4
0
200
400
600
800
x
y
f.x
22 Optimization using optim() in R
1.8 Bukin function N. 6
f(x, y) = 100 |y − 0.01x2| + 0.01 |x + 10|
########################################
# Bukin function N. 6
# {Zhanna G.}
# $f(x,y) = 100sqrt{left|y - 0.01x^{2}right|} + 0.01 left|x+10 right|$
f.name <- "Bukin_6 function"
# define the function
f.bukin <- function(xy) {
xy <- matrix(xy, ncol=2)
# calculate the function value for each row of x
f.xy <- 100*sqrt(abs(y-0.01*(x)^2)) + 0.01*abs(x+10)
# return function value
return(f.xy)
}
x <- seq(-15, -5, length = 101)
y <- seq(-3, 3, length = 101)
X <- as.matrix(expand.grid(x, y))
#X
colnames(X) <- c("x", "y")
Z <- f.bukin(X)
#Z
df <- data.frame(X, Z)
#head(df)
# plot the function
library(lattice) # use the lattice package
wireframe(Z ~ x * y # y, x, and z axes to plot
, data = df # data.frame with values to plot
, main = f.name # name the plot
, shade = TRUE # make it pretty
, scales = list(arrows = FALSE) # include axis ticks
, screen = list(z = -50, x = -70) # view position
)
1.8 Bukin function N. 6 23
Bukin_6 function
−14
−12
−10
−8
−6
−3
−2
−1
0
1
2
3
50
100
150
200
x
y
Z
24 Optimization using optim() in R
1.9 Ackley’s function
f(x, y) = −20 exp −0.2 0.5 (x2 + y2) −exp (0.5 (cos (2πx) + cos (2πy)))+
20 + e.
########################################
# Ackley's function
# Rob Hoy
# $<math>f(x,y) = -20expleft(-0.2sqrt{0.5left(x^{2}+y^{2}right)}right)-expleft(0.5left
# name used in plot below
f.name <- "Ackley's function"
# define the function
f.ackley <- function(X) {
m <- matrix(X, ncol=2)
# calculate the function value
t1 <- (-20*(exp(-.2*sqrt(.5*(m[,1]^2+m[,2]^2)))))
t2 <- (exp(.5*(cos(2*pi*m[,1]) + cos(2 * pi * m[,2]))))
z <- t1 - t2 + 20 + exp(1)
# return function value
return(z)
}
# define ranges of x and y to plot
x <- seq(-10, 10, length = 101)
y <- seq(-10, 10, length = 101)
# make x and y a matrix, plotting and opt.
X <- as.matrix(expand.grid(x, y))
colnames(X) <- c("x", "y")
# evaluate function
z <- f.ackley(X)
# Create dataframe for graphing
df.ack <-data.frame(X,z)
# plot the function
library(lattice) # use the lattice package
wireframe(z ~ x * y # z, x, and y axes to plot
, data = df.ack # data.frame with values to plot
, main = f.name # name the plot
1.9 Ackley’s function 25
, shade = TRUE # make it pretty
, scales = list(arrows = FALSE) # include axis ticks
, screen = list(z = -50, x = -70) # view position
)
# optimize (minimize) the function using Nelder-Mead
out.ackley1 <- optim(c(-1,1), f.ackley, method = "Nelder-Mead")
out.ackley1
## $par
## [1] -0.9685 0.9685
##
## $value
## [1] 3.574
##
## $counts
## function gradient
## 45 NA
##
## $convergence
## [1] 0
##
## $message
## NULL
# optimize (minimize) the function using Simulated Annealing
out.ackley2 <- optim(c(1,1), f.ackley, method = "SANN")
out.ackley2
## $par
## [1] 0.001159 0.003890
##
## $value
## [1] 0.01192
##
## $counts
## function gradient
## 10000 NA
##
## $convergence
## [1] 0
##
## $message
## NULL
26 Optimization using optim() in R
#The first one was faster, but it appears to me that the second one is actually the more accur
Ackley's function
−10
−5
0
5
10 −10
−5
0
5
10
5
10
15
x
y
z
1.10 Matyas function 27
1.10 Matyas function
f(x, y) = 0.26 x2
+ y2
− 0.48xy.
########################################
# Matyas function
# Josh Nightingale
# $f(x,y) = 0.26 left( x^{2} + y^{2}right) - 0.48 xy.$
# name used in plot below
f.name <- "Matyas function"
# define the function
f.matyas <- function(XY) {
# make x a matrix so this function works for plotting and for optimizing
XY <- matrix(XY, ncol=2)
x <- XY[,1]
y <- XY[,2]
# calculate the function value for each row of x
f.xy <- (0.26 * (x^2 + y^2)) - (0.48 * x * y)
return(f.xy)
}
# plot the function
# define ranges of x to plot over and put into matrix
x <- seq(-10, 10, length = 101)
y <- seq(-10, 10, length = 101)
XY <- as.matrix(expand.grid(x, y))
colnames(XY) <- c("x", "y")
# evaluate function
z <- f.matyas(XY)
# put X and y values in a data.frame for plotting
df <- data.frame(XY, z)
# plot the function
library(lattice) # use the lattice package
wireframe(z ~ x * y # z, x, and y axes to plot
, data = df # data.frame with values to plot
, main = f.name # name the plot
, shade = TRUE # make it pretty
, scales = list(arrows = FALSE) # include axis ticks
#, screen = list(z = 3, x = 5) # view position
)
28 Optimization using optim() in R
# optimize (minimize) the function using Nelder-Mead
out.matyas <- optim(c(1,1), f.matyas, method = "Nelder-Mead")
out.matyas
## $par
## [1] 8.526e-05 7.856e-05
##
## $value
## [1] 2.796e-10
##
## $counts
## function gradient
## 69 NA
##
## $convergence
## [1] 0
##
## $message
## NULL
# optimize (minimize) the function using Simulated Annealing
out.matyas <- optim(c(1,1), f.matyas, method = "SANN")
out.matyas
## $par
## [1] 0.02710 0.01713
##
## $value
## [1] 4.442e-05
##
## $counts
## function gradient
## 10000 NA
##
## $convergence
## [1] 0
##
## $message
## NULL
1.10 Matyas function 29
Matyas function
−10
−5
0
5
10
−10
−5
0
5
10
0
20
40
60
80
100
x
y
z
30 Optimization using optim() in R
1.11 Levi function N. 13
f(x, y) = sin2
(3πx)+(x − 1)2
1 + sin2
(3πy) +(y − 1)2
1 + sin2
(2πy) .
########################################
# Levi function N. 13
# Claire L
# $f(x,y) = sin^{2}left(3pi xright)+left(x-1right)^{2}left(1+sin^{2}left(3pi yright)
# name used in plot below
f.name <- "Levi function"
# define the function
f.levi <- function(X) {
# make x a matrix so this function works for plotting and for optimizing
# x <- matrix(x, ncol=1)
# y <- matrix(y, ncol=1)
X <- matrix(X, ncol=2)
# calculate the function value for each row of x
f.xy <- (sin(3*pi*X[,1]))^2 + ((X[,1]-1)^2)*(1+(sin(3*pi*X[,2]))^2) + ((X[,2]-1)^2)*(1+(sin(
# return function value
return(f.xy)
}
# plot the function
# define ranges of x to plot over and put into matrix
x <- seq(-5, 5, length = 101)
y <- seq(-5, 5, length = 101)
X <- as.matrix(expand.grid(x, y))
colnames(X) <- c("x", "y")
# evaluate function
z <- f.levi(X)
# put X and y and z values in a data.frame for plotting
df <- data.frame(X,z)
# plot the function
#It works! :)
library(lattice) # use the lattice package
wireframe(z ~ x * y
, data = df # data.frame with values to plot
, main = f.name # name the plot
, shade = TRUE # make it pretty
, scales = list(arrows = FALSE) # include axis ticks
1.11 Levi function N. 13 31
, screen = list(z = -50, x = -70) # view position
)
# optimize (minimize) the function using Nelder-Mead
out.levi <- optim(c(1,1), f.levi, method = "Nelder-Mead", )
out.levi
## $par
## [1] 1 1
##
## $value
## [1] 1.35e-31
##
## $counts
## function gradient
## 103 NA
##
## $convergence
## [1] 0
##
## $message
## NULL
# optimize (minimize) the function using Simulated Annealing
out.levi <- optim(c(1,1), f.levi, method = "SANN")
out.levi
## $par
## [1] 1 1
##
## $value
## [1] 1.35e-31
##
## $counts
## function gradient
## 10000 NA
##
## $convergence
## [1] 0
##
## $message
## NULL
32 Optimization using optim() in R
#optimize with lower and upper bounds.
out.levi <- optim(c(1,1), f.levi, method = "L-BFGS-B", lower=-1, upper=1)
out.levi
## $par
## [1] 1 1
##
## $value
## [1] 1.35e-31
##
## $counts
## function gradient
## 1 1
##
## $convergence
## [1] 0
##
## $message
## [1] "CONVERGENCE: NORM OF PROJECTED GRADIENT <= PGTOL"
Levi function
−4
−2
0
2
4 −4
−2
0
2
4
20
40
60
80
100
120
x
y
z
1.12 Three-hump camel function 33
1.12 Three-hump camel function
f(x, y) = 2x2
− 1.05x4
+ x6
6 + xy + y2
########################################
# Three-hump camel function
# Mohammad
# Optimization
#$f(x,y) = 2x^{2} - 1.05x^{4} + frac{x^{6}}{6} + xy + y^{2}$
#$-5le x,y le 5$
# name used in plot below
f.name <- "Three-hump camel function"
# define the function
f.camel <- function(input) {
# make x a matrix so this function works for plotting and for optimizing
input <- matrix(input, ncol=2)
# calculate the function value for each row of x
f.x <- (2*input[,1]^2) - (1.05*input[,1]^4) + (input[,1]^6)/6 +
input[,1]*input[,2] + input[,2]^2;
# f.x <- apply(x^2, 1, sum)
# return function value
return(f.x)
}
# plot the function
# define ranges of x to plot over and put into matrix
x <- seq(-5, 5, length = 101)
y <- seq(-5, 5, length = 101)
X <- as.matrix(expand.grid(x, y))
colnames(X) <- c("x", "y")
# evaluate function
z <- f.camel(X)
# put X and y values in a data.frame for plotting
df <- data.frame(X, z)
# plot the function
library(lattice) # use the lattice package
wireframe(z ~ x * y # y, x1, and x2 axes to plot
, data = df # data.frame with values to plot
, main = f.name # name the plot
, shade = TRUE # make it pretty
34 Optimization using optim() in R
, scales = list(arrows = FALSE) # include axis ticks
, screen = list(z = -30, x = -70) # view position
)
# optimize (minimize) the function using Nelder-Mead
out.camel <- optim(runif(2,-5,5), f.camel, method = "L-BFGS-B", lower=c(-5,-5),
upper=c(5,5))
out.camel
## $par
## [1] 6.440e-08 -1.416e-08
##
## $value
## [1] 7.583e-15
##
## $counts
## function gradient
## 12 12
##
## $convergence
## [1] 0
##
## $message
## [1] "CONVERGENCE: REL_REDUCTION_OF_F <= FACTR*EPSMCH"
Three−hump camel function
−4
−2
0
2
4
−4
−2
0
2
4
0
500
1000
1500
2000
x
y
z
1.13 Easom function 35
1.13 Easom function
f(x, y) = − cos(x) cos(y) exp(−((x − π)2
+ (y − π)2
))
########################################
# Easom function
# Maozhen Gong
#f(x,y)=-cos(x)cos(y)exp(-((x-pi)^2+(y-pi)^2))
f.name<-"Easom function"
#define the function
f.easom<-function(x){
# make x a matrix so this function works for plotting and for optimizing
x <- matrix(x, ncol=2)
# calculate the function value for each row of x
f.x<-apply(x,1,function(x) {-prod(cos(x)/exp((x-pi)^2))})
# return function value
return(f.x)
}
# plot the function
# define ranges of x to plot over and put into matrix
x1 <- seq(-10, 10, length = 101)
x2 <- seq(-10, 10, length = 101)
X <- as.matrix(expand.grid(x1, x2))
colnames(X) <- c("x1", "x2")
# evaluate function
y <- f.easom(X)
# put X and y values in a data.frame for plotting
df <- data.frame(X, y)
# plot the function
library(lattice) # use the lattice package
wireframe(y ~ x1 * x2 # y, x1, and x2 axes to plot
, data = df # data.frame with values to plot
, main = f.name # name the plot
, shade = TRUE # make it pretty
, scales = list(arrows = FALSE) # include axis ticks
, screen = list(z = -50, x = -70) # view position
36 Optimization using optim() in R
)
# optimize (minimize) the function using Nelder-Mead
out.sphere <- optim(c(3,3), f.easom, method = "Nelder-Mead")
out.sphere
## $par
## [1] 3.142 3.142
##
## $value
## [1] -1
##
## $counts
## function gradient
## 51 NA
##
## $convergence
## [1] 0
##
## $message
## NULL
# optimize (minimize) the function using Simulated Annealing
out.sphere <- optim(c(3,3), f.easom, method = "SANN")
out.sphere
## $par
## [1] 3 3
##
## $value
## [1] -0.9416
##
## $counts
## function gradient
## 10000 NA
##
## $convergence
## [1] 0
##
## $message
## NULL
1.13 Easom function 37
Easom function
−10
−5
0
5
10 −10
−5
0
5
10
−0.8
−0.6
−0.4
−0.2
0.0
x1
x2
y
38 Optimization using optim() in R
1.14 Cross-in-tray function
########################################
# Cross-in-tray function
1.15 Eggholder function 39
1.15 Eggholder function
f(x, y) = − (y + 47) sin y + x
2 + 47 − x sin |x − (y + 47)|
########################################
# Eggholder function
# Rogers F Silva
# $f(x,y) = - left(y+47right) sin left(sqrt{left|y + frac{x}{2}+47right|}right)
# Minimum: $f(512, 404.2319) = -959.6407$, for $-512le x,y le 512$.
# $f(boldsymbol{x}) = sum_{i=1}^{n} x_{i}^{2}$
# name used in plot below
f.name <- "Eggholder function"
# define the function
f.egg <- function(x) {
# make x a matrix so this function works for plotting and for optimizing
x <- matrix(x, ncol=2)
# calculate the function value for each row of x
x1 = x[,1];
x2 = x[,2];
f.x <- -(x2+47)*sin(sqrt(abs(x2+x1/2+47))) - x1*sin(sqrt(abs(x1-(x2+47))))
# return function value
return(f.x)
}
# plot the function
# define ranges of x to plot over and put into matrix
x1 <- seq(-512, 512, length = 129)
x2 <- seq(-512, 512, length = 129)
X <- as.matrix(expand.grid(x1, x2))
colnames(X) <- c("x1", "x2")
# evaluate function
y <- f.egg(X)
# put X and y values in a data.frame for plotting
df <- data.frame(X, y)
# plot the function
library(lattice) # use the lattice package
wireframe(y ~ x1 * x2 # y, x1, and x2 axes to plot
, data = df # data.frame with values to plot
, main = f.name # name the plot
40 Optimization using optim() in R
, shade = TRUE # make it pretty
, scales = list(arrows = FALSE) # include axis ticks
, screen = list(z = -70, x = -50) # view position
)
# optimize (minimize) the function using Nelder-Mead
out.egg <- optim(c(500,400), f.egg, method = "Nelder-Mead", control = list(trace = TRUE))
## Nelder-Mead direct search function minimizer
## function value for initial parameters = -846.569207
## Scaled convergence tolerance is 1.26149e-05
## Stepsize computed as 50.000000
## BUILD 3 -76.457443 -895.756940
## LO-REDUCTION 5 -733.894449 -895.756940
## SHRINK 9 16.755533 -895.756940
## LO-REDUCTION 11 -46.997041 -895.756940
## SHRINK 15 6.846694 -895.756940
## LO-REDUCTION 17 -89.531642 -895.756940
## LO-REDUCTION 19 -601.209387 -895.756940
## LO-REDUCTION 21 -743.937706 -895.756940
## HI-REDUCTION 23 -871.318184 -895.756940
## REFLECTION 25 -892.034514 -911.383876
## SHRINK 29 -540.115854 -911.383876
## LO-REDUCTION 31 -876.357680 -911.383876
## HI-REDUCTION 33 -900.076804 -911.383876
## HI-REDUCTION 35 -905.934548 -911.383876
## EXTENSION 37 -906.836013 -918.289594
## LO-REDUCTION 39 -911.383876 -918.289594
## EXTENSION 41 -915.300166 -927.479612
## EXTENSION 43 -918.289594 -934.086287
## EXTENSION 45 -927.479612 -950.554116
## LO-REDUCTION 47 -934.086287 -950.554116
## REFLECTION 49 -949.824192 -956.159307
## LO-REDUCTION 51 -950.554116 -956.186073
## LO-REDUCTION 53 -955.918016 -956.186073
## HI-REDUCTION 55 -956.159307 -956.713849
## HI-REDUCTION 57 -956.186073 -956.775840
## HI-REDUCTION 59 -956.713849 -956.846279
## HI-REDUCTION 61 -956.775840 -956.854776
## LO-REDUCTION 63 -956.846279 -956.897279
## HI-REDUCTION 65 -956.854776 -956.900910
## HI-REDUCTION 67 -956.897279 -956.909283
## HI-REDUCTION 69 -956.900910 -956.909283
## REFLECTION 71 -956.908722 -956.911104
## HI-REDUCTION 73 -956.909283 -956.915023
1.15 Eggholder function 41
## EXTENSION 75 -956.911104 -956.917960
## HI-REDUCTION 77 -956.915023 -956.917960
## LO-REDUCTION 79 -956.916157 -956.917960
## HI-REDUCTION 81 -956.917804 -956.917960
## HI-REDUCTION 83 -956.917950 -956.918158
## HI-REDUCTION 85 -956.917960 -956.918187
## HI-REDUCTION 87 -956.918158 -956.918205
## HI-REDUCTION 89 -956.918187 -956.918215
## LO-REDUCTION 91 -956.918205 -956.918221
## Exiting from Nelder Mead minimizer
## 93 function evaluations used
out.egg
## $par
## [1] 482.4 432.9
##
## $value
## [1] -956.9
##
## $counts
## function gradient
## 93 NA
##
## $convergence
## [1] 0
##
## $message
## NULL
# optimize (minimize) the function using Simulated Annealing
out.egg <- optim(c(500,400), f.egg, method = "SANN", control = list(trace = TRUE))
## sann objective function values
## initial value -846.569207
## iter 1000 value -965.388229
## iter 2000 value -976.124930
## iter 3000 value -976.861171
## iter 4000 value -976.910951
## iter 5000 value -976.910951
## iter 6000 value -976.910951
## iter 7000 value -976.910951
## iter 8000 value -976.910951
42 Optimization using optim() in R
## iter 9000 value -976.910951
## iter 9999 value -976.910951
## final value -976.910951
## sann stopped after 9999 iterations
out.egg
## $par
## [1] 522.1 413.3
##
## $value
## [1] -976.9
##
## $counts
## function gradient
## 10000 NA
##
## $convergence
## [1] 0
##
## $message
## NULL
Eggholder function
−400
−200
0
200
400
−400
−200
0
200
400
−500
0
500
1000
x1
x2
y
1.16 Holder table function 43
1.16 Holder table function
########################################
# Holder table function
44 Optimization using optim() in R
1.17 McCormick function
########################################
# McCormick function
1.18 Schaffer function N. 2 45
1.18 Schaffer function N. 2
f(x, y) = 0.5 +
sin2
(x2−y2
)−0.5
(1+0.001(x2+y2))
2 .
########################################
# Schaffer function N. 2
# Yonghua
# * Schaffer function N. 2:
# :: <math>f(x,y) = 0.5 + frac{sin^{2}left(x^{2} - y^{2}right) - 0.5}{left(1 + 0.00
# :Minimum: <math>f(0, 0) = 0</math>, for <math>-100le x,y le 100</math>.
f.name <- "Schaffer function No.2"
# define the function
f.shaffer2 <- function(x) {
# make x a matrix so this function works for plotting and for optimizing
x <- matrix(x, ncol=2)
f.x <- x
f.x <- cbind(x, rep(0,nrow(x)))
# calculate the function value for each row of x
#for (ii in 1:nrow(x)) {
# f.x[ii,3] <- 0.5 + (sin((f.x[ii,1])^2+(f.x[ii,2])^2)-0.5)/(1+0.001*((f.x[ii,1])^2+
ret.val <- 0.5 + (sin((f.x[,1])^2+(f.x[,2])^2)-0.5)/(1+0.001*((f.x[,1])^2+(f.x[,2]
# return function value
return(ret.val)
}
# plot the function
# define ranges of x to plot over and put into matrix
x1 <- seq(-100, 100, length = 101)
x2 <- seq(-100, 100, length = 101)
X <- as.matrix(expand.grid(x1, x2))
colnames(X) <- c("x1", "x2")
# evaluate function
y <- f.shaffer2(X)
#colnames(y) <- c("x1", "x2", "y")
46 Optimization using optim() in R
# put X and y values in a data.frame for plotting
df <- data.frame(X, y)
library(lattice) # use the lattice package
wireframe(y ~ x1 * x2 # y, x1, and x2 axes to plot
, data = df # data.frame with values to plot
, main = f.name # name the plot
, shade = TRUE # make it pretty
, scales = list(arrows = FALSE) # include axis ticks
, screen = list(z = -50, x = -70) # view position
)
# optimize (minimize) the function using Nelder-Mead
out.schaffer <- optim(c(100,100), f.shaffer2, method = "Nelder-Mead")
out.schaffer
## $par
## [1] 89.77 99.95
##
## $value
## [1] 0.4959
##
## $counts
## function gradient
## 85 NA
##
## $convergence
## [1] 0
##
## $message
## NULL
# optimize (minimize) the function using Simulated Annealing
out.schaffer <- optim(c(100,100), f.shaffer2, method = "SANN")
out.schaffer
## $par
## [1] 90.6 102.6
##
## $value
## [1] 0.4961
##
## $counts
1.18 Schaffer function N. 2 47
## function gradient
## 10000 NA
##
## $convergence
## [1] 0
##
## $message
## NULL
Schaffer function No.2
−100
−50
0
50
100−100
−50
0
50
100
−0.5
0.0
0.5
x1
x2
y
48 Optimization using optim() in R
1.19 Schaffer function N. 4
########################################
# Schaffer function N. 4
1.20 Styblinski-Tang function 49
1.20 Styblinski-Tang function
f(x) =
n
i=1 x4
i −16x2
i +5xi
2 .
########################################
# Styblinski-Tang function
# Kathy
# $f(boldsymbol{x}) = frac{sum_{i=1}^{n} x_{i}^{4} - 16x_{i}^{2} + 5x_{i}}{2}.quad$
f.name <- "Styblinski-Tang function"
f.styblinski <- function(x) {
# make x a matrix so this function works for plotting and for optimizing
x <- matrix(x, ncol=2)
# calculate the function value for each row of x
f.x <- (apply((x^4 - 16 * x^2 + 5 *x) , 1, sum))/2
# return function value
return(f.x)
}
# plot the function
# define ranges of x to plot over and put into matrix
x1 <- seq(-4.9, 5, length = 101)
x2 <- seq(-4.9, 5, length = 101)
X <- as.matrix(expand.grid(x1, x2))
colnames(X) <- c("x1", "x2")
# evaluate function
y <- f.styblinski(X)
# put X and y values in a data.frame for plotting
df <- data.frame(X, y)
# plot the function
library(lattice) # use the lattice package
wireframe(y ~ x1 * x2 # y, x1, and x2 axes to plot
, data = df # data.frame with values to plot
, main = f.name # name the plot
, shade = TRUE # make it pretty
, scales = list(arrows = FALSE) # include axis ticks
, screen = list(z = 50, x = -70) # view position
)
50 Optimization using optim() in R
Styblinski−Tang function
−4
−2
0
2
4
−4
−2
0
2
4
−50
0
50
100
150
200
250
x1
x2
y

Mais conteúdo relacionado

Mais procurados

Detection of retinal blood vessel
Detection of retinal blood vesselDetection of retinal blood vessel
Detection of retinal blood vesselMd Mintu Pk
 
Computer Vision transformations
Computer Vision  transformationsComputer Vision  transformations
Computer Vision transformationsWael Badawy
 
Emily Denton - Unsupervised Learning of Disentangled Representations from Vid...
Emily Denton - Unsupervised Learning of Disentangled Representations from Vid...Emily Denton - Unsupervised Learning of Disentangled Representations from Vid...
Emily Denton - Unsupervised Learning of Disentangled Representations from Vid...Luba Elliott
 
Moving object detection
Moving object detectionMoving object detection
Moving object detectionManav Mittal
 
Nonnegative Matrix Factorization
Nonnegative Matrix FactorizationNonnegative Matrix Factorization
Nonnegative Matrix FactorizationTatsuya Yokota
 
CVPR 2018 Paper Reading MobileNet V2
CVPR 2018 Paper Reading MobileNet V2CVPR 2018 Paper Reading MobileNet V2
CVPR 2018 Paper Reading MobileNet V2Khang Pham
 
Optic flow estimation with deep learning
Optic flow estimation with deep learningOptic flow estimation with deep learning
Optic flow estimation with deep learningYu Huang
 
Disentangled Representation Learning of Deep Generative Models
Disentangled Representation Learning of Deep Generative ModelsDisentangled Representation Learning of Deep Generative Models
Disentangled Representation Learning of Deep Generative ModelsRyohei Suzuki
 
Matching with Invariant Features
Matching with Invariant FeaturesMatching with Invariant Features
Matching with Invariant Featureszukun
 
Comparison of image segmentation
Comparison of image segmentationComparison of image segmentation
Comparison of image segmentationHaitham Ahmed
 
Convolutional Neural Network (CNN)
Convolutional Neural Network (CNN)Convolutional Neural Network (CNN)
Convolutional Neural Network (CNN)Muhammad Haroon
 
03 digital image fundamentals DIP
03 digital image fundamentals DIP03 digital image fundamentals DIP
03 digital image fundamentals DIPbabak danyal
 
Image Texture Analysis
Image Texture AnalysisImage Texture Analysis
Image Texture Analysislalitxp
 
Image segmentation 2
Image segmentation 2 Image segmentation 2
Image segmentation 2 Rumah Belajar
 
Features image processing and Extaction
Features image processing and ExtactionFeatures image processing and Extaction
Features image processing and ExtactionAli A Jalil
 

Mais procurados (20)

Image denoising
Image denoising Image denoising
Image denoising
 
Detection of retinal blood vessel
Detection of retinal blood vesselDetection of retinal blood vessel
Detection of retinal blood vessel
 
Super resolution
Super resolutionSuper resolution
Super resolution
 
Computer Vision transformations
Computer Vision  transformationsComputer Vision  transformations
Computer Vision transformations
 
Emily Denton - Unsupervised Learning of Disentangled Representations from Vid...
Emily Denton - Unsupervised Learning of Disentangled Representations from Vid...Emily Denton - Unsupervised Learning of Disentangled Representations from Vid...
Emily Denton - Unsupervised Learning of Disentangled Representations from Vid...
 
Moving object detection
Moving object detectionMoving object detection
Moving object detection
 
Image segmentation
Image segmentation Image segmentation
Image segmentation
 
Nonnegative Matrix Factorization
Nonnegative Matrix FactorizationNonnegative Matrix Factorization
Nonnegative Matrix Factorization
 
CVPR 2018 Paper Reading MobileNet V2
CVPR 2018 Paper Reading MobileNet V2CVPR 2018 Paper Reading MobileNet V2
CVPR 2018 Paper Reading MobileNet V2
 
Optic flow estimation with deep learning
Optic flow estimation with deep learningOptic flow estimation with deep learning
Optic flow estimation with deep learning
 
Disentangled Representation Learning of Deep Generative Models
Disentangled Representation Learning of Deep Generative ModelsDisentangled Representation Learning of Deep Generative Models
Disentangled Representation Learning of Deep Generative Models
 
Matching with Invariant Features
Matching with Invariant FeaturesMatching with Invariant Features
Matching with Invariant Features
 
Module 31
Module 31Module 31
Module 31
 
Comparison of image segmentation
Comparison of image segmentationComparison of image segmentation
Comparison of image segmentation
 
Convolutional Neural Network (CNN)
Convolutional Neural Network (CNN)Convolutional Neural Network (CNN)
Convolutional Neural Network (CNN)
 
03 digital image fundamentals DIP
03 digital image fundamentals DIP03 digital image fundamentals DIP
03 digital image fundamentals DIP
 
Lec15 sfm
Lec15 sfmLec15 sfm
Lec15 sfm
 
Image Texture Analysis
Image Texture AnalysisImage Texture Analysis
Image Texture Analysis
 
Image segmentation 2
Image segmentation 2 Image segmentation 2
Image segmentation 2
 
Features image processing and Extaction
Features image processing and ExtactionFeatures image processing and Extaction
Features image processing and Extaction
 

Destaque

Revista Lanbide 2002
Revista Lanbide 2002Revista Lanbide 2002
Revista Lanbide 2002Leire Hetel
 
Quasi newton
Quasi newtonQuasi newton
Quasi newtontokumoto
 
A simplex nelder mead genetic algorithm for minimizing molecular potential en...
A simplex nelder mead genetic algorithm for minimizing molecular potential en...A simplex nelder mead genetic algorithm for minimizing molecular potential en...
A simplex nelder mead genetic algorithm for minimizing molecular potential en...Aboul Ella Hassanien
 
Optimization In R
Optimization In ROptimization In R
Optimization In Rsyou6162
 
Comparative study of algorithms of nonlinear optimization
Comparative study of algorithms of nonlinear optimizationComparative study of algorithms of nonlinear optimization
Comparative study of algorithms of nonlinear optimizationPranamesh Chakraborty
 
Nelder Mead Search Algorithm
Nelder Mead Search AlgorithmNelder Mead Search Algorithm
Nelder Mead Search AlgorithmAshish Khetan
 
H2O World - GLM - Tomas Nykodym
H2O World - GLM - Tomas NykodymH2O World - GLM - Tomas Nykodym
H2O World - GLM - Tomas NykodymSri Ambati
 
Simulated annealing.ppt
Simulated annealing.pptSimulated annealing.ppt
Simulated annealing.pptKaal Nath
 
Using Gradient Descent for Optimization and Learning
Using Gradient Descent for Optimization and LearningUsing Gradient Descent for Optimization and Learning
Using Gradient Descent for Optimization and LearningDr. Volkan OBAN
 
Simulated Annealing - A Optimisation Technique
Simulated Annealing - A Optimisation TechniqueSimulated Annealing - A Optimisation Technique
Simulated Annealing - A Optimisation TechniqueAUSTIN MOSES
 
Simulated Annealing
Simulated AnnealingSimulated Annealing
Simulated AnnealingJoy Dutta
 
Simulated annealing -a informative approach
Simulated annealing -a informative approachSimulated annealing -a informative approach
Simulated annealing -a informative approachRanak Ghosh
 

Destaque (15)

Revista Lanbide 2002
Revista Lanbide 2002Revista Lanbide 2002
Revista Lanbide 2002
 
Cap 4 parte_elizabeth
Cap 4 parte_elizabethCap 4 parte_elizabeth
Cap 4 parte_elizabeth
 
Optimization tutorial
Optimization tutorialOptimization tutorial
Optimization tutorial
 
Quasi newton
Quasi newtonQuasi newton
Quasi newton
 
A simplex nelder mead genetic algorithm for minimizing molecular potential en...
A simplex nelder mead genetic algorithm for minimizing molecular potential en...A simplex nelder mead genetic algorithm for minimizing molecular potential en...
A simplex nelder mead genetic algorithm for minimizing molecular potential en...
 
Optimization In R
Optimization In ROptimization In R
Optimization In R
 
Comparative study of algorithms of nonlinear optimization
Comparative study of algorithms of nonlinear optimizationComparative study of algorithms of nonlinear optimization
Comparative study of algorithms of nonlinear optimization
 
CV TKD
CV TKDCV TKD
CV TKD
 
Nelder Mead Search Algorithm
Nelder Mead Search AlgorithmNelder Mead Search Algorithm
Nelder Mead Search Algorithm
 
H2O World - GLM - Tomas Nykodym
H2O World - GLM - Tomas NykodymH2O World - GLM - Tomas Nykodym
H2O World - GLM - Tomas Nykodym
 
Simulated annealing.ppt
Simulated annealing.pptSimulated annealing.ppt
Simulated annealing.ppt
 
Using Gradient Descent for Optimization and Learning
Using Gradient Descent for Optimization and LearningUsing Gradient Descent for Optimization and Learning
Using Gradient Descent for Optimization and Learning
 
Simulated Annealing - A Optimisation Technique
Simulated Annealing - A Optimisation TechniqueSimulated Annealing - A Optimisation Technique
Simulated Annealing - A Optimisation Technique
 
Simulated Annealing
Simulated AnnealingSimulated Annealing
Simulated Annealing
 
Simulated annealing -a informative approach
Simulated annealing -a informative approachSimulated annealing -a informative approach
Simulated annealing -a informative approach
 

Semelhante a optim function

Functional Programming with Groovy
Functional Programming with GroovyFunctional Programming with Groovy
Functional Programming with GroovyArturo Herrero
 
you need to complete the r code and a singlepage document c.pdf
you need to complete the r code and a singlepage document c.pdfyou need to complete the r code and a singlepage document c.pdf
you need to complete the r code and a singlepage document c.pdfadnankhan605720
 
R (Shiny Package) - Server Side Code for Decision Support System
R (Shiny Package) - Server Side Code for Decision Support SystemR (Shiny Package) - Server Side Code for Decision Support System
R (Shiny Package) - Server Side Code for Decision Support SystemMaithreya Chakravarthula
 
Let’s Talk About Ruby
Let’s Talk About RubyLet’s Talk About Ruby
Let’s Talk About RubyIan Bishop
 
#Covnet model had been defined class ConvNetNew(torch.nn.Module).pdf
#Covnet model had been defined class ConvNetNew(torch.nn.Module).pdf#Covnet model had been defined class ConvNetNew(torch.nn.Module).pdf
#Covnet model had been defined class ConvNetNew(torch.nn.Module).pdfcomputersmartdwarka
 
[1062BPY12001] Data analysis with R / week 2
[1062BPY12001] Data analysis with R / week 2[1062BPY12001] Data analysis with R / week 2
[1062BPY12001] Data analysis with R / week 2Kevin Chun-Hsien Hsu
 
Emerging Languages: A Tour of the Horizon
Emerging Languages: A Tour of the HorizonEmerging Languages: A Tour of the Horizon
Emerging Languages: A Tour of the HorizonAlex Payne
 
Functional programming in ruby
Functional programming in rubyFunctional programming in ruby
Functional programming in rubyKoen Handekyn
 
Rails-like JavaScript Using CoffeeScript, Backbone.js and Jasmine
Rails-like JavaScript Using CoffeeScript, Backbone.js and JasmineRails-like JavaScript Using CoffeeScript, Backbone.js and Jasmine
Rails-like JavaScript Using CoffeeScript, Backbone.js and JasmineRaimonds Simanovskis
 
PyData NYC 2019
PyData NYC 2019PyData NYC 2019
PyData NYC 2019Li Jin
 
Lecture on Rubinius for Compiler Construction at University of Twente
Lecture on Rubinius for Compiler Construction at University of TwenteLecture on Rubinius for Compiler Construction at University of Twente
Lecture on Rubinius for Compiler Construction at University of TwenteDirkjan Bussink
 
R tutorial for a windows environment
R tutorial for a windows environmentR tutorial for a windows environment
R tutorial for a windows environmentYogendra Chaubey
 
An overview of Python 2.7
An overview of Python 2.7An overview of Python 2.7
An overview of Python 2.7decoupled
 

Semelhante a optim function (20)

Functional Programming with Groovy
Functional Programming with GroovyFunctional Programming with Groovy
Functional Programming with Groovy
 
you need to complete the r code and a singlepage document c.pdf
you need to complete the r code and a singlepage document c.pdfyou need to complete the r code and a singlepage document c.pdf
you need to complete the r code and a singlepage document c.pdf
 
R (Shiny Package) - Server Side Code for Decision Support System
R (Shiny Package) - Server Side Code for Decision Support SystemR (Shiny Package) - Server Side Code for Decision Support System
R (Shiny Package) - Server Side Code for Decision Support System
 
Let’s Talk About Ruby
Let’s Talk About RubyLet’s Talk About Ruby
Let’s Talk About Ruby
 
#Covnet model had been defined class ConvNetNew(torch.nn.Module).pdf
#Covnet model had been defined class ConvNetNew(torch.nn.Module).pdf#Covnet model had been defined class ConvNetNew(torch.nn.Module).pdf
#Covnet model had been defined class ConvNetNew(torch.nn.Module).pdf
 
[1062BPY12001] Data analysis with R / week 2
[1062BPY12001] Data analysis with R / week 2[1062BPY12001] Data analysis with R / week 2
[1062BPY12001] Data analysis with R / week 2
 
Emerging Languages: A Tour of the Horizon
Emerging Languages: A Tour of the HorizonEmerging Languages: A Tour of the Horizon
Emerging Languages: A Tour of the Horizon
 
cluster(python)
cluster(python)cluster(python)
cluster(python)
 
CoffeeScript
CoffeeScriptCoffeeScript
CoffeeScript
 
Functional programming in ruby
Functional programming in rubyFunctional programming in ruby
Functional programming in ruby
 
Slides
SlidesSlides
Slides
 
Rails-like JavaScript Using CoffeeScript, Backbone.js and Jasmine
Rails-like JavaScript Using CoffeeScript, Backbone.js and JasmineRails-like JavaScript Using CoffeeScript, Backbone.js and Jasmine
Rails-like JavaScript Using CoffeeScript, Backbone.js and Jasmine
 
PyData NYC 2019
PyData NYC 2019PyData NYC 2019
PyData NYC 2019
 
Lecture on Rubinius for Compiler Construction at University of Twente
Lecture on Rubinius for Compiler Construction at University of TwenteLecture on Rubinius for Compiler Construction at University of Twente
Lecture on Rubinius for Compiler Construction at University of Twente
 
RHadoop の紹介
RHadoop の紹介RHadoop の紹介
RHadoop の紹介
 
NCCU: Statistics in the Criminal Justice System, R basics and Simulation - Pr...
NCCU: Statistics in the Criminal Justice System, R basics and Simulation - Pr...NCCU: Statistics in the Criminal Justice System, R basics and Simulation - Pr...
NCCU: Statistics in the Criminal Justice System, R basics and Simulation - Pr...
 
An introduction to Ruby
An introduction to RubyAn introduction to Ruby
An introduction to Ruby
 
R tutorial for a windows environment
R tutorial for a windows environmentR tutorial for a windows environment
R tutorial for a windows environment
 
An overview of Python 2.7
An overview of Python 2.7An overview of Python 2.7
An overview of Python 2.7
 
A tour of Python
A tour of PythonA tour of Python
A tour of Python
 

Último

Virtual-Orientation-on-the-Administration-of-NATG12-NATG6-and-ELLNA.pdf
Virtual-Orientation-on-the-Administration-of-NATG12-NATG6-and-ELLNA.pdfVirtual-Orientation-on-the-Administration-of-NATG12-NATG6-and-ELLNA.pdf
Virtual-Orientation-on-the-Administration-of-NATG12-NATG6-and-ELLNA.pdfErwinPantujan2
 
Food processing presentation for bsc agriculture hons
Food processing presentation for bsc agriculture honsFood processing presentation for bsc agriculture hons
Food processing presentation for bsc agriculture honsManeerUddin
 
4.16.24 21st Century Movements for Black Lives.pptx
4.16.24 21st Century Movements for Black Lives.pptx4.16.24 21st Century Movements for Black Lives.pptx
4.16.24 21st Century Movements for Black Lives.pptxmary850239
 
HỌC TỐT TIẾNG ANH 11 THEO CHƯƠNG TRÌNH GLOBAL SUCCESS ĐÁP ÁN CHI TIẾT - CẢ NĂ...
HỌC TỐT TIẾNG ANH 11 THEO CHƯƠNG TRÌNH GLOBAL SUCCESS ĐÁP ÁN CHI TIẾT - CẢ NĂ...HỌC TỐT TIẾNG ANH 11 THEO CHƯƠNG TRÌNH GLOBAL SUCCESS ĐÁP ÁN CHI TIẾT - CẢ NĂ...
HỌC TỐT TIẾNG ANH 11 THEO CHƯƠNG TRÌNH GLOBAL SUCCESS ĐÁP ÁN CHI TIẾT - CẢ NĂ...Nguyen Thanh Tu Collection
 
Influencing policy (training slides from Fast Track Impact)
Influencing policy (training slides from Fast Track Impact)Influencing policy (training slides from Fast Track Impact)
Influencing policy (training slides from Fast Track Impact)Mark Reed
 
ICS2208 Lecture6 Notes for SL spaces.pdf
ICS2208 Lecture6 Notes for SL spaces.pdfICS2208 Lecture6 Notes for SL spaces.pdf
ICS2208 Lecture6 Notes for SL spaces.pdfVanessa Camilleri
 
Field Attribute Index Feature in Odoo 17
Field Attribute Index Feature in Odoo 17Field Attribute Index Feature in Odoo 17
Field Attribute Index Feature in Odoo 17Celine George
 
Active Learning Strategies (in short ALS).pdf
Active Learning Strategies (in short ALS).pdfActive Learning Strategies (in short ALS).pdf
Active Learning Strategies (in short ALS).pdfPatidar M
 
AUDIENCE THEORY -CULTIVATION THEORY - GERBNER.pptx
AUDIENCE THEORY -CULTIVATION THEORY -  GERBNER.pptxAUDIENCE THEORY -CULTIVATION THEORY -  GERBNER.pptx
AUDIENCE THEORY -CULTIVATION THEORY - GERBNER.pptxiammrhaywood
 
Karra SKD Conference Presentation Revised.pptx
Karra SKD Conference Presentation Revised.pptxKarra SKD Conference Presentation Revised.pptx
Karra SKD Conference Presentation Revised.pptxAshokKarra1
 
Music 9 - 4th quarter - Vocal Music of the Romantic Period.pptx
Music 9 - 4th quarter - Vocal Music of the Romantic Period.pptxMusic 9 - 4th quarter - Vocal Music of the Romantic Period.pptx
Music 9 - 4th quarter - Vocal Music of the Romantic Period.pptxleah joy valeriano
 
What is Model Inheritance in Odoo 17 ERP
What is Model Inheritance in Odoo 17 ERPWhat is Model Inheritance in Odoo 17 ERP
What is Model Inheritance in Odoo 17 ERPCeline George
 
THEORIES OF ORGANIZATION-PUBLIC ADMINISTRATION
THEORIES OF ORGANIZATION-PUBLIC ADMINISTRATIONTHEORIES OF ORGANIZATION-PUBLIC ADMINISTRATION
THEORIES OF ORGANIZATION-PUBLIC ADMINISTRATIONHumphrey A Beña
 
GRADE 4 - SUMMATIVE TEST QUARTER 4 ALL SUBJECTS
GRADE 4 - SUMMATIVE TEST QUARTER 4 ALL SUBJECTSGRADE 4 - SUMMATIVE TEST QUARTER 4 ALL SUBJECTS
GRADE 4 - SUMMATIVE TEST QUARTER 4 ALL SUBJECTSJoshuaGantuangco2
 
ISYU TUNGKOL SA SEKSWLADIDA (ISSUE ABOUT SEXUALITY
ISYU TUNGKOL SA SEKSWLADIDA (ISSUE ABOUT SEXUALITYISYU TUNGKOL SA SEKSWLADIDA (ISSUE ABOUT SEXUALITY
ISYU TUNGKOL SA SEKSWLADIDA (ISSUE ABOUT SEXUALITYKayeClaireEstoconing
 
How to Add Barcode on PDF Report in Odoo 17
How to Add Barcode on PDF Report in Odoo 17How to Add Barcode on PDF Report in Odoo 17
How to Add Barcode on PDF Report in Odoo 17Celine George
 
ENGLISH 7_Q4_LESSON 2_ Employing a Variety of Strategies for Effective Interp...
ENGLISH 7_Q4_LESSON 2_ Employing a Variety of Strategies for Effective Interp...ENGLISH 7_Q4_LESSON 2_ Employing a Variety of Strategies for Effective Interp...
ENGLISH 7_Q4_LESSON 2_ Employing a Variety of Strategies for Effective Interp...JhezDiaz1
 
MULTIDISCIPLINRY NATURE OF THE ENVIRONMENTAL STUDIES.pptx
MULTIDISCIPLINRY NATURE OF THE ENVIRONMENTAL STUDIES.pptxMULTIDISCIPLINRY NATURE OF THE ENVIRONMENTAL STUDIES.pptx
MULTIDISCIPLINRY NATURE OF THE ENVIRONMENTAL STUDIES.pptxAnupkumar Sharma
 

Último (20)

Virtual-Orientation-on-the-Administration-of-NATG12-NATG6-and-ELLNA.pdf
Virtual-Orientation-on-the-Administration-of-NATG12-NATG6-and-ELLNA.pdfVirtual-Orientation-on-the-Administration-of-NATG12-NATG6-and-ELLNA.pdf
Virtual-Orientation-on-the-Administration-of-NATG12-NATG6-and-ELLNA.pdf
 
Food processing presentation for bsc agriculture hons
Food processing presentation for bsc agriculture honsFood processing presentation for bsc agriculture hons
Food processing presentation for bsc agriculture hons
 
4.16.24 21st Century Movements for Black Lives.pptx
4.16.24 21st Century Movements for Black Lives.pptx4.16.24 21st Century Movements for Black Lives.pptx
4.16.24 21st Century Movements for Black Lives.pptx
 
HỌC TỐT TIẾNG ANH 11 THEO CHƯƠNG TRÌNH GLOBAL SUCCESS ĐÁP ÁN CHI TIẾT - CẢ NĂ...
HỌC TỐT TIẾNG ANH 11 THEO CHƯƠNG TRÌNH GLOBAL SUCCESS ĐÁP ÁN CHI TIẾT - CẢ NĂ...HỌC TỐT TIẾNG ANH 11 THEO CHƯƠNG TRÌNH GLOBAL SUCCESS ĐÁP ÁN CHI TIẾT - CẢ NĂ...
HỌC TỐT TIẾNG ANH 11 THEO CHƯƠNG TRÌNH GLOBAL SUCCESS ĐÁP ÁN CHI TIẾT - CẢ NĂ...
 
Influencing policy (training slides from Fast Track Impact)
Influencing policy (training slides from Fast Track Impact)Influencing policy (training slides from Fast Track Impact)
Influencing policy (training slides from Fast Track Impact)
 
ICS2208 Lecture6 Notes for SL spaces.pdf
ICS2208 Lecture6 Notes for SL spaces.pdfICS2208 Lecture6 Notes for SL spaces.pdf
ICS2208 Lecture6 Notes for SL spaces.pdf
 
Field Attribute Index Feature in Odoo 17
Field Attribute Index Feature in Odoo 17Field Attribute Index Feature in Odoo 17
Field Attribute Index Feature in Odoo 17
 
Active Learning Strategies (in short ALS).pdf
Active Learning Strategies (in short ALS).pdfActive Learning Strategies (in short ALS).pdf
Active Learning Strategies (in short ALS).pdf
 
LEFT_ON_C'N_ PRELIMS_EL_DORADO_2024.pptx
LEFT_ON_C'N_ PRELIMS_EL_DORADO_2024.pptxLEFT_ON_C'N_ PRELIMS_EL_DORADO_2024.pptx
LEFT_ON_C'N_ PRELIMS_EL_DORADO_2024.pptx
 
AUDIENCE THEORY -CULTIVATION THEORY - GERBNER.pptx
AUDIENCE THEORY -CULTIVATION THEORY -  GERBNER.pptxAUDIENCE THEORY -CULTIVATION THEORY -  GERBNER.pptx
AUDIENCE THEORY -CULTIVATION THEORY - GERBNER.pptx
 
Karra SKD Conference Presentation Revised.pptx
Karra SKD Conference Presentation Revised.pptxKarra SKD Conference Presentation Revised.pptx
Karra SKD Conference Presentation Revised.pptx
 
Music 9 - 4th quarter - Vocal Music of the Romantic Period.pptx
Music 9 - 4th quarter - Vocal Music of the Romantic Period.pptxMusic 9 - 4th quarter - Vocal Music of the Romantic Period.pptx
Music 9 - 4th quarter - Vocal Music of the Romantic Period.pptx
 
What is Model Inheritance in Odoo 17 ERP
What is Model Inheritance in Odoo 17 ERPWhat is Model Inheritance in Odoo 17 ERP
What is Model Inheritance in Odoo 17 ERP
 
THEORIES OF ORGANIZATION-PUBLIC ADMINISTRATION
THEORIES OF ORGANIZATION-PUBLIC ADMINISTRATIONTHEORIES OF ORGANIZATION-PUBLIC ADMINISTRATION
THEORIES OF ORGANIZATION-PUBLIC ADMINISTRATION
 
GRADE 4 - SUMMATIVE TEST QUARTER 4 ALL SUBJECTS
GRADE 4 - SUMMATIVE TEST QUARTER 4 ALL SUBJECTSGRADE 4 - SUMMATIVE TEST QUARTER 4 ALL SUBJECTS
GRADE 4 - SUMMATIVE TEST QUARTER 4 ALL SUBJECTS
 
ISYU TUNGKOL SA SEKSWLADIDA (ISSUE ABOUT SEXUALITY
ISYU TUNGKOL SA SEKSWLADIDA (ISSUE ABOUT SEXUALITYISYU TUNGKOL SA SEKSWLADIDA (ISSUE ABOUT SEXUALITY
ISYU TUNGKOL SA SEKSWLADIDA (ISSUE ABOUT SEXUALITY
 
How to Add Barcode on PDF Report in Odoo 17
How to Add Barcode on PDF Report in Odoo 17How to Add Barcode on PDF Report in Odoo 17
How to Add Barcode on PDF Report in Odoo 17
 
ENGLISH 7_Q4_LESSON 2_ Employing a Variety of Strategies for Effective Interp...
ENGLISH 7_Q4_LESSON 2_ Employing a Variety of Strategies for Effective Interp...ENGLISH 7_Q4_LESSON 2_ Employing a Variety of Strategies for Effective Interp...
ENGLISH 7_Q4_LESSON 2_ Employing a Variety of Strategies for Effective Interp...
 
MULTIDISCIPLINRY NATURE OF THE ENVIRONMENTAL STUDIES.pptx
MULTIDISCIPLINRY NATURE OF THE ENVIRONMENTAL STUDIES.pptxMULTIDISCIPLINRY NATURE OF THE ENVIRONMENTAL STUDIES.pptx
MULTIDISCIPLINRY NATURE OF THE ENVIRONMENTAL STUDIES.pptx
 
FINALS_OF_LEFT_ON_C'N_EL_DORADO_2024.pptx
FINALS_OF_LEFT_ON_C'N_EL_DORADO_2024.pptxFINALS_OF_LEFT_ON_C'N_EL_DORADO_2024.pptx
FINALS_OF_LEFT_ON_C'N_EL_DORADO_2024.pptx
 

optim function

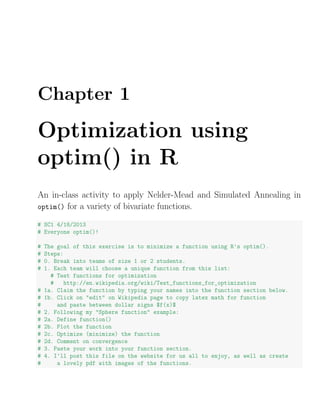
  • 1. Chapter 1 Optimization using optim() in R An in-class activity to apply Nelder-Mead and Simulated Annealing in optim() for a variety of bivariate functions. # SC1 4/18/2013 # Everyone optim()! # The goal of this exercise is to minimize a function using R's optim(). # Steps: # 0. Break into teams of size 1 or 2 students. # 1. Each team will choose a unique function from this list: # Test functions for optimization # http://en.wikipedia.org/wiki/Test_functions_for_optimization # 1a. Claim the function by typing your names into the function section below. # 1b. Click on "edit" on Wikipedia page to copy latex math for function # and paste between dollar signs $f(x)$ # 2. Following my "Sphere function" example: # 2a. Define function() # 2b. Plot the function # 2c. Optimize (minimize) the function # 2d. Comment on convergence # 3. Paste your work into your function section. # 4. I'll post this file on the website for us all to enjoy, as well as create # a lovely pdf with images of the functions.
  • 2. 2 Optimization using optim() in R 1.1 Sphere function f(x) = n i=1 x2 i ######################################## # Sphere function # Erik Erhardt # $f(boldsymbol{x}) = sum_{i=1}^{n} x_{i}^{2}$ # name used in plot below f.name <- "Sphere function" # define the function f.sphere <- function(x) { # make x a matrix so this function works for plotting and for optimizing x <- matrix(x, ncol=2) # calculate the function value for each row of x f.x <- apply(x^2, 1, sum) # return function value return(f.x) } # plot the function # define ranges of x to plot over and put into matrix x1 <- seq(-10, 10, length = 101) x2 <- seq(-10, 10, length = 101) X <- as.matrix(expand.grid(x1, x2)) colnames(X) <- c("x1", "x2") # evaluate function y <- f.sphere(X) # put X and y values in a data.frame for plotting df <- data.frame(X, y) # plot the function library(lattice) # use the lattice package wireframe(y ~ x1 * x2 # y, x1, and x2 axes to plot , data = df # data.frame with values to plot , main = f.name # name the plot , shade = TRUE # make it pretty , scales = list(arrows = FALSE) # include axis ticks , screen = list(z = -50, x = -70) # view position ) # optimize (minimize) the function using Nelder-Mead
  • 3. 1.1 Sphere function 3 out.sphere <- optim(c(1,1), f.sphere, method = "Nelder-Mead") out.sphere ## $par ## [1] 3.754e-05 5.179e-05 ## ## $value ## [1] 4.092e-09 ## ## $counts ## function gradient ## 63 NA ## ## $convergence ## [1] 0 ## ## $message ## NULL # optimize (minimize) the function using Simulated Annealing out.sphere <- optim(c(1,1), f.sphere, method = "SANN") out.sphere ## $par ## [1] 0.0001933 -0.0046280 ## ## $value ## [1] 2.146e-05 ## ## $counts ## function gradient ## 10000 NA ## ## $convergence ## [1] 0 ## ## $message ## NULL ### # comments based on plot and out.*
  • 4. 4 Optimization using optim() in R # The unique minimum was found within tolerance. ## values of x1 and x2 at the minimum # $par # [1] 3.754010e-05 5.179101e-05 # ## value of the function at the minimum # $value # [1] 4.091568e-09 # ## convergence in 63 iterations # $counts # function gradient # 63 NA # ## 0 = convergence successful # $convergence # [1] 0 # ## no news is good news # $message # NULL Sphere function −10 −5 0 5 10 −10 −5 0 5 10 0 50 100 150 200 x1 x2 y
  • 5. 1.2 Sphere function with stochastic noise 5 1.2 Sphere function with stochastic noise ######################################## # Sphere function with stochastic noise # Christian Gunning # name used in plot below f.name <- "Sphere function with stochastic noise at each iteration" # define the function f.sphere1 <- function(x) { # make x a matrix so this function works for plotting and for optimizing x <- matrix(x, ncol=2) # calculate the function value for each row of x # f.x <- apply(x, 1, function(y) {ret<- sum(y^2) }) f.x <- apply(x, 1, function(y) {ret<- sum(y^2)+rnorm(1,mean=1,sd=abs(mean(y))^(1/10))} # return function value return(f.x) } # plot the function # define ranges of x to plot over and put into matrix x1 <- seq(-10, 10, length = 101) x2 <- seq(-10, 10, length = 101) X <- as.matrix(expand.grid(x1, x2)) colnames(X) <- c("x1", "x2") # evaluate function y <- f.sphere1(X) # put X and y values in a data.frame for plotting df <- data.frame(X, y) # plot the function library(lattice) # use the lattice package wireframe(y ~ x1 * x2 # y, x1, and x2 axes to plot , data = df # data.frame with values to plot , main = f.name # name the plot , shade = TRUE # make it pretty , scales = list(arrows = FALSE) # include axis ticks , screen = list(z = -50, x = -70) # view position ) # optimize (minimize) the function using Nelder-Mead out.NM <- optim(c(1,1), f.sphere1, method = "Nelder-Mead") out.NM
  • 6. 6 Optimization using optim() in R ## $par ## [1] 0.875 1.150 ## ## $value ## [1] 0.2255 ## ## $counts ## function gradient ## 321 NA ## ## $convergence ## [1] 10 ## ## $message ## NULL # optimize (minimize) the function using Simulated Annealing out.sann <- optim(c(1,1), f.sphere1, method = "SANN") out.sann ## $par ## [1] -0.7529 -0.3134 ## ## $value ## [1] -1.036 ## ## $counts ## function gradient ## 10000 NA ## ## $convergence ## [1] 0 ## ## $message ## NULL
  • 7. 1.2 Sphere function with stochastic noise 7 Sphere function with stochastic noise at each iteration −10 −5 0 5 10 −10 −5 0 5 10 0 50 100 150 200 x1 x2 y
  • 8. 8 Optimization using optim() in R 1.3 Rosenbrock function ######################################## # Rosenbrock function # Mary Rose Paiz # name used in plot below f.name <- "Rosenbrock Function" # define the function f.rosenbrock <- function(x) { x1 <- x[,1] x2 <- x[,2] # calculating f.x term1 <- (x2 - (x1)^2)^2 term2 <- (x1 - 1)^2 f.x <- (100*term1 + term2) # return function value return(f.x) } # plot the function # define ranges of x to plot over and put into matrix x1 <- seq(-1.5, 2.0, length = 101) x2 <- seq(.5, 3.0, length = 101) X <- as.matrix(expand.grid(x1, x2)) colnames(X) <- c("x1", "x2") # evaluate function y <- f.rosenbrock(X) # put X and y values in a data.frame for plotting df <- data.frame(X, y) # plot the function library(lattice) # use the lattice package wireframe(y ~ x1 * x2 # y, x1, and x2 axes to plot , data = df # data.frame with values to plot , main = f.name # name the plot , shade = TRUE # make it pretty , scales = list(arrows = FALSE) # include axis ticks , screen = list(z = -75, x = -50) # view position )
  • 9. 1.3 Rosenbrock function 9 # optimize (minimize) the function using Nelder-Mead out.rosenbrock <- optim(c(1,1), f.rosenbrock, method = "Nelder-Mead") ## Error: incorrect number of dimensions out.rosenbrock ## Error: object ’out.rosenbrock’ not found # optimize (minimize) the function using Simulated Annealing out.rosenbrock <- optim(c(1,1), f.rosenbrock, method = "SANN") ## Error: incorrect number of dimensions out.rosenbrock ## Error: object ’out.rosenbrock’ not found Rosenbrock Function −1.5 −1.0 −0.5 0.0 0.5 1.0 1.5 2.0 0.5 1.0 1.5 2.0 2.5 3.0 200 400 600 800 1000 1200 x1 x2 y
  • 10. 10 Optimization using optim() in R 1.4 Beale’s function f(x, y) = (1.5 − x + xy)2 + 2.25 − x + xy2 2 + 2.625 − x + xy3 2 . ######################################## # Beale's function # Alvaro #$$f(x,y) = left( 1.5 - x + xy right)^{2} + left( 2.25 - x + xy^{2}right)^{2} + left(2.62 #Minimum: #$$f(3, 0.5) = 0 #-4.5 le x,y le 4.5$$ # name used in plot below f.name <- "Beale's function" # define the function f.beale <- function(mx) { mx <- matrix(mx, ncol=2) x<- mx[,1] y<- mx[,2] f.x<- (1.5 - x +x*y)^2 + (2.25-x+(x*y)^2)^2 + (2.625-x+(x*y)^3)^2 return(f.x) } # plot the function # define ranges of x to plot over and put into matrix x1 <- seq(-4.5, 4.5, length = 101) x2 <- seq(-4.5, 4.5, length = 101) X <- as.matrix(expand.grid(x1, x2)) colnames(X) <- c("x1", "x2") # evaluate function y <- log10(f.beale(X)) # put X and y values in a data.frame for plotting df <- data.frame(X, y) # plot the function library(lattice) # use the lattice package wireframe(y ~ x1 * x2 # y, x1, and x2 axes to plot , data = df # data.frame with values to plot , main = f.name # name the plot
  • 11. 1.4 Beale’s function 11 , shade = TRUE # make it pretty , scales = list(arrows = FALSE) # include axis ticks , screen = list(z = 0, x = 0) # view position ) # optimize (minimize) the function using Nelder-Mead out.beale <- optim(c(1,1), f.beale, method = "Nelder-Mead") out.beale ## $par ## [1] 2.4814 0.2284 ## ## $value ## [1] 0.286 ## ## $counts ## function gradient ## 83 NA ## ## $convergence ## [1] 0 ## ## $message ## NULL # optimize (minimize) the function using Simulated Annealing out.beale <- optim(c(1,1), f.beale, method = "SANN") out.beale ## $par ## [1] 2.4830 0.2269 ## ## $value ## [1] 0.2861 ## ## $counts ## function gradient ## 10000 NA ## ## $convergence ## [1] 0 ## ## $message ## NULL
  • 12. 12 Optimization using optim() in R ### # comments based on plot and out.* # The unique minimum was found within tolerance. Beale's function −4 −2 0 2 4 −4 −2 0 2 4 0 2 4 6 x1 x2 y
  • 13. 1.5 Goldstein-Price function 13 1.5 Goldstein-Price function f(x, y) = 1 + (x + y + 1)2 19 − 14x + 3x2 − 14y + 6xy + 3y2 30 + (2x − ######################################## # Goldstein-Price function # Barnaly Rashid #GoldsteinPrice function: #$f(x,y) = left(1+left(x+y+1right)^{2}left(19-14x+3x^{2}-14y+6xy+3y^{2}right)righ f.name <- "Goldstein-Price function" # define the function f.goldprice <- function(x1x2) { # calculate the function value for x1 and x2 x1x2 <- matrix(x1x2,ncol=2) a <- 1+(x1x2[,1]+x1x2[,2]+1)^2*(19-14*x1x2[,1]+3*x1x2[,1]^2-14*x1x2[,2]+6*x1x2[,1]*x1x b <- 30 + (2*x1x2[,1]-3*x1x2[,2])^2*(18-32*x1x2[,1]+12*x1x2[,1]^2+48*x1x2[,2]-36*x1x2[ f.x <- a*b # return function value return(f.x) } # matrix(x1x2,ncol=2) #plot the function # define ranges of x to plot over x1 <- seq(-1.5, 1.5, length = 101) x2 <- seq(-1.5, 1.5, length = 101) X <- as.matrix(expand.grid(x1, x2)) colnames(X) <- c("x1", "x2") #y <- f.goldprice(X[,1],X[,2]) y <- f.goldprice(X) # put X and y values in a data.frame for plotting df <- data.frame(X, y) library(lattice) # use the lattice package
  • 14. 14 Optimization using optim() in R wireframe(y ~ x1 * x2 # y, x1, and x2 axes to plot , data = df # data.frame with values to plot , main = f.name # name the plot , shade = TRUE # make it pretty , scales = list(arrows = FALSE) # include axis ticks , screen = list(z = -50, x = -70) # view position ) # optimize (minimize) the function using Nelder-Mead out.gold <- optim(c(0,-1), f.goldprice, method = "Nelder-Mead") out.gold ## $par ## [1] 0 -1 ## ## $value ## [1] 3 ## ## $counts ## function gradient ## 57 NA ## ## $convergence ## [1] 0 ## ## $message ## NULL # optimize (minimize) the function using Simulated Annealing out.gold <- optim(c(0,-1), f.goldprice, method = "SANN") out.gold ## $par ## [1] 0 -1 ## ## $value ## [1] 3 ## ## $counts ## function gradient ## 10000 NA ##
  • 15. 1.5 Goldstein-Price function 15 ## $convergence ## [1] 0 ## ## $message ## NULL Goldstein−Price function −1.5 −1.0 −0.5 0.0 0.5 1.0 1.5 −1.5 −1.0 −0.5 0.0 0.5 1.0 1.5 1e+05 2e+05 3e+05 x1 x2 y
  • 16. 16 Optimization using optim() in R 1.6 Booth’s function f(x) = (x + 2y − 7)2 + (2x + y − 5)2 ######################################## # Booth's function # Olga Vitkovskaya # $f(boldsymbol{x}) = (x + 2y -7)^{2}+(2x + y -5)^{2}$ # name used in plot below f.name <- "Booth's function" # define the function f.booths <- function(xy) { # make x a matrix so this function works for plotting and for optimizing xy <- matrix(xy, ncol=2) # calculate the function value for each row of x f.row <- function(this.row) { (this.row[1] + 2 * this.row[2] -7)^2 + (2 * this.row[1] + this.row[2] -5)^2 } f.x <- apply(xy, 1, f.row) # return function value return(f.x) } # plot the function # define ranges of x to plot over and put into matrix x.plot <- seq(-10, 10, length = 101) y.plot <- seq(-10, 10, length = 101) grid.plot <- as.matrix(expand.grid(x.plot, y.plot)) colnames(grid.plot) <- c("x", "y") # evaluate function z.plot <- f.booths(grid.plot) # put X, y and z values in a data.frame for plotting df <- data.frame(grid.plot, z.plot) # plot the function library(lattice) # use the lattice package
  • 17. 1.6 Booth’s function 17 p <- wireframe(z.plot ~ x * y # y, x1, and x2 axes to plot , data = df # data.frame with values to plot , main = f.name # name the plot , shade = TRUE # make it pretty , scales = list(arrows = FALSE) # include axis ticks , screen = list(z = -50, x = -70) # view position ) plot(p) # optimize (minimize) the function using Nelder-Mead out.booth1 <- optim(c(1,1), f.booths, method = "Nelder-Mead") out.booth1 ## $par ## [1] 0.9999 3.0001 ## ## $value ## [1] 4.239e-08 ## ## $counts ## function gradient ## 69 NA ## ## $convergence ## [1] 0 ## ## $message ## NULL # optimize (minimize) the function using Simulated Annealing out.booth2 <- optim(c(1,1), f.booths, method = "SANN") out.booth2 ## $par ## [1] 1.004 3.003 ## ## $value ## [1] 0.0002215 ## ## $counts ## function gradient ## 10000 NA ##
  • 18. 18 Optimization using optim() in R ## $convergence ## [1] 0 ## ## $message ## NULL Booth's function −10 −5 0 5 10 −10 −5 0 5 10 0 500 1000 1500 2000 2500 x y z.plot
  • 19. 1.7 Booth’s function 19 1.7 Booth’s function f(x, y) = (x + 2y − 7)2 + (2x + y − 5)2 . ######################################## # Booth's function # {Katherine Freeland) # Booth's Function: $f(x,y) = left( x + 2y -7right)^{2} + left(2x +y - 5right)^{2}.q # Minimum: $f(1,3) = 0</math>, for <math>-10 le x,y le 10</math>.$ f.booth <- function(xy){ xy <- matrix(xy, ncol=2) f.x <- ((xy[,1] + (2*xy[,2]) - 7)^2) + ((2*xy[,1]+ xy[,2]-5)^2) return(f.x) } x <- seq(-5, 5, length=101) y <- seq(-5, 5, length=101) mat <- as.matrix(expand.grid(x, y)) colnames(mat) <- c("x", "y") f.x <- f.booth(mat) df <- data.frame(mat, f.x) library(lattice) # use the lattice package wireframe(f.x ~ x * y # f.x, x, and y axes to plot , data = df # data.frame with values to plot , main = "Booth Function" # name the plot , shade = TRUE # make it pretty , scales = list(arrows = FALSE) # include axis ticks , screen = list(z = -50, x = -70) # view position ) # optimize (minimize) the function using Nelder-Mead out.booth <- optim(c(1,1), f.booth, method = "Nelder-Mead") out.booth ## $par ## [1] 0.9999 3.0001 ## ## $value ## [1] 4.239e-08
  • 20. 20 Optimization using optim() in R ## ## $counts ## function gradient ## 69 NA ## ## $convergence ## [1] 0 ## ## $message ## NULL out.booth2 <- optim(c(1,1), f.booth, method = "SANN") out.booth2 ## $par ## [1] 1.000 3.002 ## ## $value ## [1] 1.658e-05 ## ## $counts ## function gradient ## 10000 NA ## ## $convergence ## [1] 0 ## ## $message ## NULL
  • 21. 1.7 Booth’s function 21 Booth Function −4 −2 0 2 4 −4 −2 0 2 4 0 200 400 600 800 x y f.x
  • 22. 22 Optimization using optim() in R 1.8 Bukin function N. 6 f(x, y) = 100 |y − 0.01x2| + 0.01 |x + 10| ######################################## # Bukin function N. 6 # {Zhanna G.} # $f(x,y) = 100sqrt{left|y - 0.01x^{2}right|} + 0.01 left|x+10 right|$ f.name <- "Bukin_6 function" # define the function f.bukin <- function(xy) { xy <- matrix(xy, ncol=2) # calculate the function value for each row of x f.xy <- 100*sqrt(abs(y-0.01*(x)^2)) + 0.01*abs(x+10) # return function value return(f.xy) } x <- seq(-15, -5, length = 101) y <- seq(-3, 3, length = 101) X <- as.matrix(expand.grid(x, y)) #X colnames(X) <- c("x", "y") Z <- f.bukin(X) #Z df <- data.frame(X, Z) #head(df) # plot the function library(lattice) # use the lattice package wireframe(Z ~ x * y # y, x, and z axes to plot , data = df # data.frame with values to plot , main = f.name # name the plot , shade = TRUE # make it pretty , scales = list(arrows = FALSE) # include axis ticks , screen = list(z = -50, x = -70) # view position )
  • 23. 1.8 Bukin function N. 6 23 Bukin_6 function −14 −12 −10 −8 −6 −3 −2 −1 0 1 2 3 50 100 150 200 x y Z
  • 24. 24 Optimization using optim() in R 1.9 Ackley’s function f(x, y) = −20 exp −0.2 0.5 (x2 + y2) −exp (0.5 (cos (2πx) + cos (2πy)))+ 20 + e. ######################################## # Ackley's function # Rob Hoy # $<math>f(x,y) = -20expleft(-0.2sqrt{0.5left(x^{2}+y^{2}right)}right)-expleft(0.5left # name used in plot below f.name <- "Ackley's function" # define the function f.ackley <- function(X) { m <- matrix(X, ncol=2) # calculate the function value t1 <- (-20*(exp(-.2*sqrt(.5*(m[,1]^2+m[,2]^2))))) t2 <- (exp(.5*(cos(2*pi*m[,1]) + cos(2 * pi * m[,2])))) z <- t1 - t2 + 20 + exp(1) # return function value return(z) } # define ranges of x and y to plot x <- seq(-10, 10, length = 101) y <- seq(-10, 10, length = 101) # make x and y a matrix, plotting and opt. X <- as.matrix(expand.grid(x, y)) colnames(X) <- c("x", "y") # evaluate function z <- f.ackley(X) # Create dataframe for graphing df.ack <-data.frame(X,z) # plot the function library(lattice) # use the lattice package wireframe(z ~ x * y # z, x, and y axes to plot , data = df.ack # data.frame with values to plot , main = f.name # name the plot
  • 25. 1.9 Ackley’s function 25 , shade = TRUE # make it pretty , scales = list(arrows = FALSE) # include axis ticks , screen = list(z = -50, x = -70) # view position ) # optimize (minimize) the function using Nelder-Mead out.ackley1 <- optim(c(-1,1), f.ackley, method = "Nelder-Mead") out.ackley1 ## $par ## [1] -0.9685 0.9685 ## ## $value ## [1] 3.574 ## ## $counts ## function gradient ## 45 NA ## ## $convergence ## [1] 0 ## ## $message ## NULL # optimize (minimize) the function using Simulated Annealing out.ackley2 <- optim(c(1,1), f.ackley, method = "SANN") out.ackley2 ## $par ## [1] 0.001159 0.003890 ## ## $value ## [1] 0.01192 ## ## $counts ## function gradient ## 10000 NA ## ## $convergence ## [1] 0 ## ## $message ## NULL
  • 26. 26 Optimization using optim() in R #The first one was faster, but it appears to me that the second one is actually the more accur Ackley's function −10 −5 0 5 10 −10 −5 0 5 10 5 10 15 x y z
  • 27. 1.10 Matyas function 27 1.10 Matyas function f(x, y) = 0.26 x2 + y2 − 0.48xy. ######################################## # Matyas function # Josh Nightingale # $f(x,y) = 0.26 left( x^{2} + y^{2}right) - 0.48 xy.$ # name used in plot below f.name <- "Matyas function" # define the function f.matyas <- function(XY) { # make x a matrix so this function works for plotting and for optimizing XY <- matrix(XY, ncol=2) x <- XY[,1] y <- XY[,2] # calculate the function value for each row of x f.xy <- (0.26 * (x^2 + y^2)) - (0.48 * x * y) return(f.xy) } # plot the function # define ranges of x to plot over and put into matrix x <- seq(-10, 10, length = 101) y <- seq(-10, 10, length = 101) XY <- as.matrix(expand.grid(x, y)) colnames(XY) <- c("x", "y") # evaluate function z <- f.matyas(XY) # put X and y values in a data.frame for plotting df <- data.frame(XY, z) # plot the function library(lattice) # use the lattice package wireframe(z ~ x * y # z, x, and y axes to plot , data = df # data.frame with values to plot , main = f.name # name the plot , shade = TRUE # make it pretty , scales = list(arrows = FALSE) # include axis ticks #, screen = list(z = 3, x = 5) # view position )
  • 28. 28 Optimization using optim() in R # optimize (minimize) the function using Nelder-Mead out.matyas <- optim(c(1,1), f.matyas, method = "Nelder-Mead") out.matyas ## $par ## [1] 8.526e-05 7.856e-05 ## ## $value ## [1] 2.796e-10 ## ## $counts ## function gradient ## 69 NA ## ## $convergence ## [1] 0 ## ## $message ## NULL # optimize (minimize) the function using Simulated Annealing out.matyas <- optim(c(1,1), f.matyas, method = "SANN") out.matyas ## $par ## [1] 0.02710 0.01713 ## ## $value ## [1] 4.442e-05 ## ## $counts ## function gradient ## 10000 NA ## ## $convergence ## [1] 0 ## ## $message ## NULL
  • 29. 1.10 Matyas function 29 Matyas function −10 −5 0 5 10 −10 −5 0 5 10 0 20 40 60 80 100 x y z
  • 30. 30 Optimization using optim() in R 1.11 Levi function N. 13 f(x, y) = sin2 (3πx)+(x − 1)2 1 + sin2 (3πy) +(y − 1)2 1 + sin2 (2πy) . ######################################## # Levi function N. 13 # Claire L # $f(x,y) = sin^{2}left(3pi xright)+left(x-1right)^{2}left(1+sin^{2}left(3pi yright) # name used in plot below f.name <- "Levi function" # define the function f.levi <- function(X) { # make x a matrix so this function works for plotting and for optimizing # x <- matrix(x, ncol=1) # y <- matrix(y, ncol=1) X <- matrix(X, ncol=2) # calculate the function value for each row of x f.xy <- (sin(3*pi*X[,1]))^2 + ((X[,1]-1)^2)*(1+(sin(3*pi*X[,2]))^2) + ((X[,2]-1)^2)*(1+(sin( # return function value return(f.xy) } # plot the function # define ranges of x to plot over and put into matrix x <- seq(-5, 5, length = 101) y <- seq(-5, 5, length = 101) X <- as.matrix(expand.grid(x, y)) colnames(X) <- c("x", "y") # evaluate function z <- f.levi(X) # put X and y and z values in a data.frame for plotting df <- data.frame(X,z) # plot the function #It works! :) library(lattice) # use the lattice package wireframe(z ~ x * y , data = df # data.frame with values to plot , main = f.name # name the plot , shade = TRUE # make it pretty , scales = list(arrows = FALSE) # include axis ticks
  • 31. 1.11 Levi function N. 13 31 , screen = list(z = -50, x = -70) # view position ) # optimize (minimize) the function using Nelder-Mead out.levi <- optim(c(1,1), f.levi, method = "Nelder-Mead", ) out.levi ## $par ## [1] 1 1 ## ## $value ## [1] 1.35e-31 ## ## $counts ## function gradient ## 103 NA ## ## $convergence ## [1] 0 ## ## $message ## NULL # optimize (minimize) the function using Simulated Annealing out.levi <- optim(c(1,1), f.levi, method = "SANN") out.levi ## $par ## [1] 1 1 ## ## $value ## [1] 1.35e-31 ## ## $counts ## function gradient ## 10000 NA ## ## $convergence ## [1] 0 ## ## $message ## NULL
  • 32. 32 Optimization using optim() in R #optimize with lower and upper bounds. out.levi <- optim(c(1,1), f.levi, method = "L-BFGS-B", lower=-1, upper=1) out.levi ## $par ## [1] 1 1 ## ## $value ## [1] 1.35e-31 ## ## $counts ## function gradient ## 1 1 ## ## $convergence ## [1] 0 ## ## $message ## [1] "CONVERGENCE: NORM OF PROJECTED GRADIENT <= PGTOL" Levi function −4 −2 0 2 4 −4 −2 0 2 4 20 40 60 80 100 120 x y z
  • 33. 1.12 Three-hump camel function 33 1.12 Three-hump camel function f(x, y) = 2x2 − 1.05x4 + x6 6 + xy + y2 ######################################## # Three-hump camel function # Mohammad # Optimization #$f(x,y) = 2x^{2} - 1.05x^{4} + frac{x^{6}}{6} + xy + y^{2}$ #$-5le x,y le 5$ # name used in plot below f.name <- "Three-hump camel function" # define the function f.camel <- function(input) { # make x a matrix so this function works for plotting and for optimizing input <- matrix(input, ncol=2) # calculate the function value for each row of x f.x <- (2*input[,1]^2) - (1.05*input[,1]^4) + (input[,1]^6)/6 + input[,1]*input[,2] + input[,2]^2; # f.x <- apply(x^2, 1, sum) # return function value return(f.x) } # plot the function # define ranges of x to plot over and put into matrix x <- seq(-5, 5, length = 101) y <- seq(-5, 5, length = 101) X <- as.matrix(expand.grid(x, y)) colnames(X) <- c("x", "y") # evaluate function z <- f.camel(X) # put X and y values in a data.frame for plotting df <- data.frame(X, z) # plot the function library(lattice) # use the lattice package wireframe(z ~ x * y # y, x1, and x2 axes to plot , data = df # data.frame with values to plot , main = f.name # name the plot , shade = TRUE # make it pretty
  • 34. 34 Optimization using optim() in R , scales = list(arrows = FALSE) # include axis ticks , screen = list(z = -30, x = -70) # view position ) # optimize (minimize) the function using Nelder-Mead out.camel <- optim(runif(2,-5,5), f.camel, method = "L-BFGS-B", lower=c(-5,-5), upper=c(5,5)) out.camel ## $par ## [1] 6.440e-08 -1.416e-08 ## ## $value ## [1] 7.583e-15 ## ## $counts ## function gradient ## 12 12 ## ## $convergence ## [1] 0 ## ## $message ## [1] "CONVERGENCE: REL_REDUCTION_OF_F <= FACTR*EPSMCH" Three−hump camel function −4 −2 0 2 4 −4 −2 0 2 4 0 500 1000 1500 2000 x y z
  • 35. 1.13 Easom function 35 1.13 Easom function f(x, y) = − cos(x) cos(y) exp(−((x − π)2 + (y − π)2 )) ######################################## # Easom function # Maozhen Gong #f(x,y)=-cos(x)cos(y)exp(-((x-pi)^2+(y-pi)^2)) f.name<-"Easom function" #define the function f.easom<-function(x){ # make x a matrix so this function works for plotting and for optimizing x <- matrix(x, ncol=2) # calculate the function value for each row of x f.x<-apply(x,1,function(x) {-prod(cos(x)/exp((x-pi)^2))}) # return function value return(f.x) } # plot the function # define ranges of x to plot over and put into matrix x1 <- seq(-10, 10, length = 101) x2 <- seq(-10, 10, length = 101) X <- as.matrix(expand.grid(x1, x2)) colnames(X) <- c("x1", "x2") # evaluate function y <- f.easom(X) # put X and y values in a data.frame for plotting df <- data.frame(X, y) # plot the function library(lattice) # use the lattice package wireframe(y ~ x1 * x2 # y, x1, and x2 axes to plot , data = df # data.frame with values to plot , main = f.name # name the plot , shade = TRUE # make it pretty , scales = list(arrows = FALSE) # include axis ticks , screen = list(z = -50, x = -70) # view position
  • 36. 36 Optimization using optim() in R ) # optimize (minimize) the function using Nelder-Mead out.sphere <- optim(c(3,3), f.easom, method = "Nelder-Mead") out.sphere ## $par ## [1] 3.142 3.142 ## ## $value ## [1] -1 ## ## $counts ## function gradient ## 51 NA ## ## $convergence ## [1] 0 ## ## $message ## NULL # optimize (minimize) the function using Simulated Annealing out.sphere <- optim(c(3,3), f.easom, method = "SANN") out.sphere ## $par ## [1] 3 3 ## ## $value ## [1] -0.9416 ## ## $counts ## function gradient ## 10000 NA ## ## $convergence ## [1] 0 ## ## $message ## NULL
  • 37. 1.13 Easom function 37 Easom function −10 −5 0 5 10 −10 −5 0 5 10 −0.8 −0.6 −0.4 −0.2 0.0 x1 x2 y
  • 38. 38 Optimization using optim() in R 1.14 Cross-in-tray function ######################################## # Cross-in-tray function
  • 39. 1.15 Eggholder function 39 1.15 Eggholder function f(x, y) = − (y + 47) sin y + x 2 + 47 − x sin |x − (y + 47)| ######################################## # Eggholder function # Rogers F Silva # $f(x,y) = - left(y+47right) sin left(sqrt{left|y + frac{x}{2}+47right|}right) # Minimum: $f(512, 404.2319) = -959.6407$, for $-512le x,y le 512$. # $f(boldsymbol{x}) = sum_{i=1}^{n} x_{i}^{2}$ # name used in plot below f.name <- "Eggholder function" # define the function f.egg <- function(x) { # make x a matrix so this function works for plotting and for optimizing x <- matrix(x, ncol=2) # calculate the function value for each row of x x1 = x[,1]; x2 = x[,2]; f.x <- -(x2+47)*sin(sqrt(abs(x2+x1/2+47))) - x1*sin(sqrt(abs(x1-(x2+47)))) # return function value return(f.x) } # plot the function # define ranges of x to plot over and put into matrix x1 <- seq(-512, 512, length = 129) x2 <- seq(-512, 512, length = 129) X <- as.matrix(expand.grid(x1, x2)) colnames(X) <- c("x1", "x2") # evaluate function y <- f.egg(X) # put X and y values in a data.frame for plotting df <- data.frame(X, y) # plot the function library(lattice) # use the lattice package wireframe(y ~ x1 * x2 # y, x1, and x2 axes to plot , data = df # data.frame with values to plot , main = f.name # name the plot
  • 40. 40 Optimization using optim() in R , shade = TRUE # make it pretty , scales = list(arrows = FALSE) # include axis ticks , screen = list(z = -70, x = -50) # view position ) # optimize (minimize) the function using Nelder-Mead out.egg <- optim(c(500,400), f.egg, method = "Nelder-Mead", control = list(trace = TRUE)) ## Nelder-Mead direct search function minimizer ## function value for initial parameters = -846.569207 ## Scaled convergence tolerance is 1.26149e-05 ## Stepsize computed as 50.000000 ## BUILD 3 -76.457443 -895.756940 ## LO-REDUCTION 5 -733.894449 -895.756940 ## SHRINK 9 16.755533 -895.756940 ## LO-REDUCTION 11 -46.997041 -895.756940 ## SHRINK 15 6.846694 -895.756940 ## LO-REDUCTION 17 -89.531642 -895.756940 ## LO-REDUCTION 19 -601.209387 -895.756940 ## LO-REDUCTION 21 -743.937706 -895.756940 ## HI-REDUCTION 23 -871.318184 -895.756940 ## REFLECTION 25 -892.034514 -911.383876 ## SHRINK 29 -540.115854 -911.383876 ## LO-REDUCTION 31 -876.357680 -911.383876 ## HI-REDUCTION 33 -900.076804 -911.383876 ## HI-REDUCTION 35 -905.934548 -911.383876 ## EXTENSION 37 -906.836013 -918.289594 ## LO-REDUCTION 39 -911.383876 -918.289594 ## EXTENSION 41 -915.300166 -927.479612 ## EXTENSION 43 -918.289594 -934.086287 ## EXTENSION 45 -927.479612 -950.554116 ## LO-REDUCTION 47 -934.086287 -950.554116 ## REFLECTION 49 -949.824192 -956.159307 ## LO-REDUCTION 51 -950.554116 -956.186073 ## LO-REDUCTION 53 -955.918016 -956.186073 ## HI-REDUCTION 55 -956.159307 -956.713849 ## HI-REDUCTION 57 -956.186073 -956.775840 ## HI-REDUCTION 59 -956.713849 -956.846279 ## HI-REDUCTION 61 -956.775840 -956.854776 ## LO-REDUCTION 63 -956.846279 -956.897279 ## HI-REDUCTION 65 -956.854776 -956.900910 ## HI-REDUCTION 67 -956.897279 -956.909283 ## HI-REDUCTION 69 -956.900910 -956.909283 ## REFLECTION 71 -956.908722 -956.911104 ## HI-REDUCTION 73 -956.909283 -956.915023
  • 41. 1.15 Eggholder function 41 ## EXTENSION 75 -956.911104 -956.917960 ## HI-REDUCTION 77 -956.915023 -956.917960 ## LO-REDUCTION 79 -956.916157 -956.917960 ## HI-REDUCTION 81 -956.917804 -956.917960 ## HI-REDUCTION 83 -956.917950 -956.918158 ## HI-REDUCTION 85 -956.917960 -956.918187 ## HI-REDUCTION 87 -956.918158 -956.918205 ## HI-REDUCTION 89 -956.918187 -956.918215 ## LO-REDUCTION 91 -956.918205 -956.918221 ## Exiting from Nelder Mead minimizer ## 93 function evaluations used out.egg ## $par ## [1] 482.4 432.9 ## ## $value ## [1] -956.9 ## ## $counts ## function gradient ## 93 NA ## ## $convergence ## [1] 0 ## ## $message ## NULL # optimize (minimize) the function using Simulated Annealing out.egg <- optim(c(500,400), f.egg, method = "SANN", control = list(trace = TRUE)) ## sann objective function values ## initial value -846.569207 ## iter 1000 value -965.388229 ## iter 2000 value -976.124930 ## iter 3000 value -976.861171 ## iter 4000 value -976.910951 ## iter 5000 value -976.910951 ## iter 6000 value -976.910951 ## iter 7000 value -976.910951 ## iter 8000 value -976.910951
  • 42. 42 Optimization using optim() in R ## iter 9000 value -976.910951 ## iter 9999 value -976.910951 ## final value -976.910951 ## sann stopped after 9999 iterations out.egg ## $par ## [1] 522.1 413.3 ## ## $value ## [1] -976.9 ## ## $counts ## function gradient ## 10000 NA ## ## $convergence ## [1] 0 ## ## $message ## NULL Eggholder function −400 −200 0 200 400 −400 −200 0 200 400 −500 0 500 1000 x1 x2 y
  • 43. 1.16 Holder table function 43 1.16 Holder table function ######################################## # Holder table function
  • 44. 44 Optimization using optim() in R 1.17 McCormick function ######################################## # McCormick function
  • 45. 1.18 Schaffer function N. 2 45 1.18 Schaffer function N. 2 f(x, y) = 0.5 + sin2 (x2−y2 )−0.5 (1+0.001(x2+y2)) 2 . ######################################## # Schaffer function N. 2 # Yonghua # * Schaffer function N. 2: # :: <math>f(x,y) = 0.5 + frac{sin^{2}left(x^{2} - y^{2}right) - 0.5}{left(1 + 0.00 # :Minimum: <math>f(0, 0) = 0</math>, for <math>-100le x,y le 100</math>. f.name <- "Schaffer function No.2" # define the function f.shaffer2 <- function(x) { # make x a matrix so this function works for plotting and for optimizing x <- matrix(x, ncol=2) f.x <- x f.x <- cbind(x, rep(0,nrow(x))) # calculate the function value for each row of x #for (ii in 1:nrow(x)) { # f.x[ii,3] <- 0.5 + (sin((f.x[ii,1])^2+(f.x[ii,2])^2)-0.5)/(1+0.001*((f.x[ii,1])^2+ ret.val <- 0.5 + (sin((f.x[,1])^2+(f.x[,2])^2)-0.5)/(1+0.001*((f.x[,1])^2+(f.x[,2] # return function value return(ret.val) } # plot the function # define ranges of x to plot over and put into matrix x1 <- seq(-100, 100, length = 101) x2 <- seq(-100, 100, length = 101) X <- as.matrix(expand.grid(x1, x2)) colnames(X) <- c("x1", "x2") # evaluate function y <- f.shaffer2(X) #colnames(y) <- c("x1", "x2", "y")
  • 46. 46 Optimization using optim() in R # put X and y values in a data.frame for plotting df <- data.frame(X, y) library(lattice) # use the lattice package wireframe(y ~ x1 * x2 # y, x1, and x2 axes to plot , data = df # data.frame with values to plot , main = f.name # name the plot , shade = TRUE # make it pretty , scales = list(arrows = FALSE) # include axis ticks , screen = list(z = -50, x = -70) # view position ) # optimize (minimize) the function using Nelder-Mead out.schaffer <- optim(c(100,100), f.shaffer2, method = "Nelder-Mead") out.schaffer ## $par ## [1] 89.77 99.95 ## ## $value ## [1] 0.4959 ## ## $counts ## function gradient ## 85 NA ## ## $convergence ## [1] 0 ## ## $message ## NULL # optimize (minimize) the function using Simulated Annealing out.schaffer <- optim(c(100,100), f.shaffer2, method = "SANN") out.schaffer ## $par ## [1] 90.6 102.6 ## ## $value ## [1] 0.4961 ## ## $counts
  • 47. 1.18 Schaffer function N. 2 47 ## function gradient ## 10000 NA ## ## $convergence ## [1] 0 ## ## $message ## NULL Schaffer function No.2 −100 −50 0 50 100−100 −50 0 50 100 −0.5 0.0 0.5 x1 x2 y
  • 48. 48 Optimization using optim() in R 1.19 Schaffer function N. 4 ######################################## # Schaffer function N. 4
  • 49. 1.20 Styblinski-Tang function 49 1.20 Styblinski-Tang function f(x) = n i=1 x4 i −16x2 i +5xi 2 . ######################################## # Styblinski-Tang function # Kathy # $f(boldsymbol{x}) = frac{sum_{i=1}^{n} x_{i}^{4} - 16x_{i}^{2} + 5x_{i}}{2}.quad$ f.name <- "Styblinski-Tang function" f.styblinski <- function(x) { # make x a matrix so this function works for plotting and for optimizing x <- matrix(x, ncol=2) # calculate the function value for each row of x f.x <- (apply((x^4 - 16 * x^2 + 5 *x) , 1, sum))/2 # return function value return(f.x) } # plot the function # define ranges of x to plot over and put into matrix x1 <- seq(-4.9, 5, length = 101) x2 <- seq(-4.9, 5, length = 101) X <- as.matrix(expand.grid(x1, x2)) colnames(X) <- c("x1", "x2") # evaluate function y <- f.styblinski(X) # put X and y values in a data.frame for plotting df <- data.frame(X, y) # plot the function library(lattice) # use the lattice package wireframe(y ~ x1 * x2 # y, x1, and x2 axes to plot , data = df # data.frame with values to plot , main = f.name # name the plot , shade = TRUE # make it pretty , scales = list(arrows = FALSE) # include axis ticks , screen = list(z = 50, x = -70) # view position )
  • 50. 50 Optimization using optim() in R Styblinski−Tang function −4 −2 0 2 4 −4 −2 0 2 4 −50 0 50 100 150 200 250 x1 x2 y