SlideShare uma empresa Scribd logo
1 de 6
Baixar para ler offline
7                            Data Element Definitions


ID                              Indicator                                                             Definition
8         Employed in category                                          Percentage of the total number employed that are in a particular
                                                                        category

11        Vacancy rate                                                  Percentage of establishment posts that are unfilled

12        Personnel budget spent on category                            Percentage of the total personnel budget spent on this category of
                                                                        staff

13        Cost per staff member                                         Average cost of employing a member of a speci fic category of staff

27        Expenditure on facility maintenance as percentage of          Expenditure on facility maintenance as a percentage of expenditure
          health expenditure                                            by provincial DOH

31        Population per facility                                       Average (resident) population per facility

35        Facilities with electricity supply from the grid              Percentage of facilities that are supplied with electricity from the
                                                                        national grid

36        Facilities with piped water supply                            Percentage of facilities that have a piped water supply

37        Facilities with fixed telephone line                          Percentage of facilities that have an operational fixed telephone line

39        Facility condition average grade - 1996 NHFA                  Average grading for each type of facility in the 1996 National Health
                                                                        Facility Audit

40        Facility condition average grade - provincial audit           Average condition grading for each type of facility in the most recent
                                                                        provincial audit

42        Employed per 1,000 people - filled posts                      Number of staff employed (in post) per 1,000 resident population

44        Expenditure on DHS by the provincial DOH per person           Expenditure per member of the resident population on district health
                                                                        services by provincial DOH

46        Expenditure on DHS per person - total                         Expenditure per member of the resident population on district health
                                                                        services, including expenditure by local governm ent

48        Professional nurses per 100,000 people                        Number of professional nurses in post employed in PHC fixed
                                                                        facilities, per 100,000 resident population

50        Fixed public PHC facilities offering the full package of      Percentage of fixed public PHC facilities offering the full package of
          PHC services                                                  PHC services

51        Health districts/sub-districts with appointed manager         Percentage of health districts/sub-districts with appointed manager

52        Health districts/sub-districts with formal business plan      Percentage of health districts/sub-districts with formal business plan


    April, 2003           Guidelines for District Health Planning and Reporting - Part F. Definitions and Norms               Page 55
ID                           Indicator                                                             Definition

53     Fixed public PHC facilities with functioning                  Percentage of fixed public PHC facilities with functioning community
       community participation structure                             participation structure

54     PHC headcount per person                                      Headcount at public PHC facilities per member of the resident
                                                                     population

56     Children under one year fully immunized                       Percentage of children under one year who are fully immunized

57     Fixed public PHC facilities in facility audit condition       Percentage of fixed PHC facilities in awarded condition grading four
       four or five                                                  or five in the 1996 NHFA audit, or equivalent in a more recent
                                                                     provincial audit

58     PHC facilities visited at least once per month by a           Percentage of public PHC facilities visited at least once per month by
       supervisor who produces a written report                      a supervisor who produces a written report

59     PHC facilities supported by a doctor at least once a          Percentage of public PHC facilities that are supported by a doctor at
       week                                                          least once a week

60     Health districts/sub-districts with a formal quality          Percentage of health districts/sub-districts with a formal quality
       improvem ent plan                                             improvem ent plan

61     PHC facilities without DTP Hib vaccine at any time of         Percentage of public PHC facilities out of stock of vaccines at any
       year                                                          time of year

63     Expenditure on PHC per PHC headcount by province              PHC expenditure by provincial DOH and DPW per headcount at
                                                                     provincial PHC facilities

66     HIV antenat al seroprevalence rate                            Prevalence of HIV in antenatal clinics expressed as a percentage

69     STI treatment rate (per 1,000)                                Clients treated as STIs per 1,000 resident population

71     New smear positive TB cases (number and per                   New TB cases with positive smear results per 100,000 resident
       100,000)                                                      population

72     TB preval ence rate                                           Prevalence of TB per 100,000 resident population

75     PHC facilities where condoms are freely available             Percentage of public PHC facilities where condoms are freely
                                                                     available

76     Facilities offering VCT                                       Percentage of facilities that are offering VCT services

77     Facilities offering syndromic management of STIs              Percentage of facilities that offer syndromic managem ent of STIs

80     TB cases with a DOT supporter                                 Percentage of total TB caseload with a speci fied DOTS supporter

84     Smear positive PTB cases as percentage of all PTB             Smear positive PTB cases as percentage of all PTB cas es
       cases

85     New smear positive PTB cases as percentage of                 New smear positive PTB cases as a percentage of the number
       expect ed number of cases                                     predicted for this area by the MRC model

87     TB cases who are being re-treated                             Percentage of the total TB cas eload that are being retreated (not new)

88     New smear positive PTB cases who interrupt treatment          Percentage of new smear positive PTB cases who interrupt treatment

89     Dedicat ed HIV/AIDS budget spent                              Percentage of the HIV/AIDS sub-programme budget spent to date


 April, 2003           Guidelines for District Health Planning and Reporting - Part F. Definitions and Norms             Page 56
ID                            Indicator                                                            Definition
91     Syphilis preval ence rate                                      Prevalence of syphilis per 1,000 resident population

92     PTB smear conversion rat e at two months for new               Percentage of new smear positive cases that convert after two months
       cases

93     PTB smear conversion rat e at three months for re-             Percentage of retreated smear positive cases that convert after three
       treated cases                                                  months

94     New smear positive PTB cases cured at first attempt            Percentage of new smear positive cases that are cured

95     TB cases that are MDR                                          Percentage of TB cas es that are multiple drug resistant

96     Nutrition posts filled at all levels against nutrition staff   Percentage of posts in the staff establishment that are filled
       est ablishments

100    Newborn babies given Road to Health Chart                      Percentage of newborn babies who are given Road to Health Chart

101    Target ed primary schools that have feeding                    Percentage of targeted primary schools that have feeding programmes
       programmes

102    Target number of school feeding days that are actual           Percentage of target number of school feeding days that are actual
       school feeding days                                            school feeding days

103    Hospitals with maternity beds certi fi ed as baby fri endly    Percentage of hospitals with maternity beds that are certifi ed as baby
                                                                      fri endly against total hospitals with maternity beds

104    Target ed schools where actual servings for school             Percentage of targeted schools where actual servings for school
       feeding comply with requirements                               feeding comply with requirements and speci fications of the
                                                                      standardized menu options

105    Int egrat ed Nutrition Programme conditional grant spent       Percentage of the Integrated Nutrition Programme conditional grant
                                                                      budget spent to date

106    Speci al allocation for poverty relief spent                   Percentage of the special allocation for poverty relief spent to date

109    Children under five years stunted                              Percentage of children under five years who are stunted

110    Children under five years underweight                          Percentage of children under five years who are underweight

111    Children under five years wasted                               Percentage of children under five years who are wast ed

112    Children under five years severely underweight                 Percentage of children under five years who are severely underweight

113    Children under five years Vitamin A defici ent                 Percentage of children under five years that are Vitamin A defi cient

114    Children under five years iron deficient                       Percentage of children under five years who are iron defici ent

115    Children under five years iodine deficient                     Percentage of children under five years who are iodine deficient

116    Infants at six months exclusively breast fed                   Percentage of infants at six months who are exclusively breast fed

132    Expenditure on hospital staff as percentage of total           Expenditure on hospital staff (excluding staff employed in PHC
       hospital expenditure                                           services but allocated to the hospital pay point) as percentage of total
                                                                      hospital expenditure

133    Expenditure on drugs for hospital use as percentage of         Expenditure on drugs for hospital use (excluding drugs bought by the
       total hospital expenditure                                     hospital for use by PHC facilities) as percent age of provincial DOH
                                                                      hospital expenditure

 April, 2003           Guidelines for District Health Planning and Reporting - Part F. Definitions and Norms              Page 57
ID                            Indicator                                                             Definition
134    Expenditure on hospital maintenance as percentage of           Expenditure on hospital maintenance as percentage of total hospital
       total hospital expenditure                                     expenditure by provincial DOH

135    Us able beds per 1,000 people                                  Number of usable beds in hospitals per 1,000 resident population

137    Expenditure on hospitals by the province per person            Expenditure on hospitals by the provincial DOH and DPW, including
                                                                      capital expenditure, per person

139    Hospitals with operational hospital board                      Percentage of hospitals with operational hospital board

140    Hospitals with appointed (not acting) CEO in place             Percentage of hospitals that have appointed (not acting) CEO in place

141    Hospitals with business plan agreed with provincial            Percentage of hospitals that have a business plan agreed with
       health department                                              provincial health department

142    Hospitals with up to date asset register                       Percentage of hospitals with up to date asset register

143    Maximum permitted value of procurement at discretion           Average maximum permitted value of procurement at discretion of
       of hospital CEO without reference to provincial level          hospital CEO without reference to provincial level

144    Separations per 1,000 people                                   Number of hospital separations per 1,000 resident population

146    Patient day equivalents per 1,000 people                       Number of patient day equivalents per 1,000 people

148    Patient fee income per separation                              Average patient fee income per separation

149    Hospitals in facility audit condition four or five             Percentage of hospitals that are in facility audit condition four or five

150    Hospitals with current patient satisfaction survey             Percentage of hospitals that have conducted and published a patient
                                                                      satis faction survey in last 12 months

151    Hospitals with designated offi cial responsible for            Percentage of hospitals that have a designated official responsible for
       coordinating quality managem ent                               coordinating quality managem ent

152    Hospitals with clinical audit meetings at least once a         Percentage of hospitals that have clinical audit (Morbidity and
       month                                                          Mortality) meetings at least once a month

153    Length of stay                                                 The average number of patient days that an admitted patient spends in
                                                                      hospital before separation

154    Bed utilization rate (based on usable beds)                    The number of patient days during the reporting period, expressed as
                                                                      a percentage of the sum of the daily number of usable beds

155    Expenditure per patient day equivalent                         Average expenditure (cost) for a patient day equivalent

156    Case fatality rate for surgery separations                     Percentage of surgery separations that are deaths

173    PMCT - HIV negative                                            Number of clients tested for HIV and testing negative in PMCT sites

185    Expenditure by DPW per person in constant prices               Expenditure by DPW on public health facilities (including capital) in
                                                                      const ant prices per person

187    Expenditure on equipment maintenance as percentage             Expenditure on equipment maintenance as a percentage of
       of health expenditure                                          expenditure by provincial DOH

188    Mat ernal mortality rate                                       Number of maternal deaths per 1,000 women of reproductive age
                                                                      (15-49)


 April, 2003            Guidelines for District Health Planning and Reporting - Part F. Definitions and Norms              Page 58
ID                             Indicator                                                             Definition
189    Infant mortality rate                                           Number of infant deaths (i.e. deaths before age one year) per 1,000
                                                                       live births

190    Clients receiving home-based care                               Percentage of clients identified as requiring home-based care that are
                                                                       actually receiving it

192    Infl ation rate                                                 Annual percentage change in the CPIX index (Consumer price index,
                                                                       excluding interest rate changes)

193    Population - annual growth rate                                 Annual percentage change in the total population

197    Transport costs per kilometre                                   Transport costs per kilometre travelled

199    PHC nurse - facility headcount workload                         Average headcount per nurse in a PHC facility per day

200    Patients attending PHC referred to doctor                       Percentage of patients attending PHC who are then referred to a
                                                                       doctor

201    Measles cases per 1,000 population                              Number of confirmed measles cases per 1,000 population

202    Expenditure on PHC per person - total                           Provincial and municipal PHC recurrent expenditure(excluding
                                                                       capital expenditure) per person

203    Expenditure on PHC personnel per person - total                 Total recurrent expenditure (excluding capital expenditure) on PHC
                                                                       personnel per person

204    Expenditure on PHC per PHC headcount - total                    Total PHC expenditure per headcount at all (municipal and
                                                                       provincial) PHC facilities

206    Smear positive PTB caseload - total                             Smear positive PTB caseload - total (new plus retreatment cases)

230    Under five mortality rate                                       Number of deaths before age five years per 1,000 live births

279    Teenage pregnancy                                               Births to mothers aged 15-19 years as a percentage of all births

284    Population per square kilometre                                 Average population within the health area per square kilometre

285    Visiting points per mobile clinic                               Average number of visiting points made by a mobile clinic

286    Kilometres per vehicle                                          Average number of kilometres travelled per vehicl e

287    Cost per kilometre travelled by vehicle                         The average cost incurred by traveling a kilometre in a vehicle

288    Expenditure on PHC in constant prices - total                   Total expenditure on the PHC programme in constant prices

289    Expenditure on PHC in constant prices per person -              Total expenditure on the PHC programme in constant prices, per
       total                                                           person

291    PHC facilities without HIV/AIDS, STI or TB drugs                Percentage of public PHC facilities without HIV/AIDS, STI or TB
                                                                       drugs at any time of year

292    PHC facility visits per headcount                               Average number of visits (or services ) provided per headcount at a
                                                                       PHC facility

293    PHC visit - total                                               All PHC visits, either at PHC facilities or in the community

294    PHC visits per service day                                      Total PHC visits, either at PHC facilities or in the community, per
                                                                       service day

 April, 2003             Guidelines for District Health Planning and Reporting - Part F. Definitions and Norms            Page 59
ID                            Indicator                                                            Definition
295    PHC professional nurse - daily visit workload                 Average visits in PHC facilities or in the community per professional
                                                                     nurs e per day

296    PHC visit equivalents                                         Conversion of patient days in visit equivalents in PHC facilities

297    Low birth weight rate                                         Percentage of live births weighing less than 2500g immediately after
                                                                     birth

298    Cause-speci fic death rat e                                   Number of deaths attributable to a speci fic disease in a given
                                                                     population in a given time period (usually express ed per 100,000
                                                                     persons per year).

300    Employed staff - approved as percentage of required           Percentage of the total number of staff required that are approved, in
                                                                     a particular category

301    Employed staff - actual as percentage of required             Percentage of the total number of staff required that are actually in
                                                                     post, in a particular category

303    Expenditure on DHS by the provincial DOH per person           Expenditure by provincial DOH per member of the resident
       in constant prices                                            population on district health services in constant prices

304    Expenditure on DHS by DPW per person in constant              Expenditure per member of the resident population on district health
       pri ces                                                       services by DPW in constant prices

305    Expenditure on DHS by municipalities per person in            Expenditure per member of the resident population on district health
       const ant prices                                              services by municipalities in constant prices

306    Expenditure on DHS - total by local government                Expenditure on DHS, including expenditure

307    Expenditure on DHS in constant prices - total                 Expenditure on DHS, including expenditure by local government in
                                                                     const ant prices

309    Expenditure on DHS per person in constant prices -            Expenditure on DHS, including expenditure by local government, per
       total                                                         person and in constant prices

310    Expenditure on therapeutic drug group as percentage of        Expenditure on drugs in a speci fic therapeutic group as a percentage
       total drug expenditure                                        of total drug expenditure

311    Expenditure on individual drug as percentage of total         Expenditure on an individual drug as a percentage of total drug
       drug expenditure                                              expenditure

312    Expenditure on PHC by provincial DOH per person               Expenditure on the PHC programme by provincial DOH, per person

313    Hospital PHC headcount as percent age of OPD                  Percentage of al hospital OPD headcounts which are for PHC services
       headcount

315    HIV preval ence rate                                          Proportion of the population estimated to be HIV positive. Equivalent
                                                                     to indicators called "People living with HIV/AIDS"


 April, 2003           Guidelines for District Health Planning and Reporting - Part F. Definitions and Norms             Page 60

Mais conteúdo relacionado

Semelhante a Part6g

James Kingsland- Urgent Care
James Kingsland- Urgent Care James Kingsland- Urgent Care
James Kingsland- Urgent Care mckenln
 
What Meaningful Use Means for Dentists
What Meaningful Use Means for DentistsWhat Meaningful Use Means for Dentists
What Meaningful Use Means for Dentistsrbadovin
 
Antiretroviral Therapy in Botswana: Comparing Costs, Service Utilization, and...
Antiretroviral Therapy in Botswana: Comparing Costs, Service Utilization, and...Antiretroviral Therapy in Botswana: Comparing Costs, Service Utilization, and...
Antiretroviral Therapy in Botswana: Comparing Costs, Service Utilization, and...HFG Project
 
Ekohealth summary deck Mar 2013
Ekohealth summary deck  Mar 2013Ekohealth summary deck  Mar 2013
Ekohealth summary deck Mar 2013Dr Akash Rajpal
 
Tunisia Program - Working Meeting on Comprehensive Cervical Cancer Prevention...
Tunisia Program - Working Meeting on Comprehensive Cervical Cancer Prevention...Tunisia Program - Working Meeting on Comprehensive Cervical Cancer Prevention...
Tunisia Program - Working Meeting on Comprehensive Cervical Cancer Prevention...Tamar Naskidashvili
 
Leveraging Advanced Analytics to Help Hospitals Measure Efficacy of Treatment...
Leveraging Advanced Analytics to Help Hospitals Measure Efficacy of Treatment...Leveraging Advanced Analytics to Help Hospitals Measure Efficacy of Treatment...
Leveraging Advanced Analytics to Help Hospitals Measure Efficacy of Treatment...Booz Allen Hamilton
 
Management information system
Management information systemManagement information system
Management information systemNc Das
 
Cost-Effectiveness of the National HIV/AIDS Strategy (NHAS) Goal of Increasin...
Cost-Effectiveness of the National HIV/AIDS Strategy (NHAS) Goal of Increasin...Cost-Effectiveness of the National HIV/AIDS Strategy (NHAS) Goal of Increasin...
Cost-Effectiveness of the National HIV/AIDS Strategy (NHAS) Goal of Increasin...CDC NPIN
 
Economic analysis of malaria burden in kenya
Economic analysis of malaria burden in kenyaEconomic analysis of malaria burden in kenya
Economic analysis of malaria burden in kenyaNanyingi Mark
 
Novel Approaches in Public Health Surveillance
Novel Approaches in Public Health SurveillanceNovel Approaches in Public Health Surveillance
Novel Approaches in Public Health SurveillanceTaha Kass-Hout, MD, MS
 
Health Needs and Rights of Women and Children @ Risk or Living with HIV & AIDS
Health Needs and Rights of Women and Children @ Risk or  Living with HIV & AIDSHealth Needs and Rights of Women and Children @ Risk or  Living with HIV & AIDS
Health Needs and Rights of Women and Children @ Risk or Living with HIV & AIDSNaqibullah Hamdard
 

Semelhante a Part6g (15)

James Kingsland- Urgent Care
James Kingsland- Urgent Care James Kingsland- Urgent Care
James Kingsland- Urgent Care
 
What Meaningful Use Means for Dentists
What Meaningful Use Means for DentistsWhat Meaningful Use Means for Dentists
What Meaningful Use Means for Dentists
 
Antiretroviral Therapy in Botswana: Comparing Costs, Service Utilization, and...
Antiretroviral Therapy in Botswana: Comparing Costs, Service Utilization, and...Antiretroviral Therapy in Botswana: Comparing Costs, Service Utilization, and...
Antiretroviral Therapy in Botswana: Comparing Costs, Service Utilization, and...
 
Ekohealth summary deck Mar 2013
Ekohealth summary deck  Mar 2013Ekohealth summary deck  Mar 2013
Ekohealth summary deck Mar 2013
 
Tunisia Program - Working Meeting on Comprehensive Cervical Cancer Prevention...
Tunisia Program - Working Meeting on Comprehensive Cervical Cancer Prevention...Tunisia Program - Working Meeting on Comprehensive Cervical Cancer Prevention...
Tunisia Program - Working Meeting on Comprehensive Cervical Cancer Prevention...
 
Leveraging Advanced Analytics to Help Hospitals Measure Efficacy of Treatment...
Leveraging Advanced Analytics to Help Hospitals Measure Efficacy of Treatment...Leveraging Advanced Analytics to Help Hospitals Measure Efficacy of Treatment...
Leveraging Advanced Analytics to Help Hospitals Measure Efficacy of Treatment...
 
The evolving imact of hiv aids on outpatient health servies in kwazulu natal ...
The evolving imact of hiv aids on outpatient health servies in kwazulu natal ...The evolving imact of hiv aids on outpatient health servies in kwazulu natal ...
The evolving imact of hiv aids on outpatient health servies in kwazulu natal ...
 
CARPEDIEM
CARPEDIEMCARPEDIEM
CARPEDIEM
 
Management information system
Management information systemManagement information system
Management information system
 
Cost-Effectiveness of the National HIV/AIDS Strategy (NHAS) Goal of Increasin...
Cost-Effectiveness of the National HIV/AIDS Strategy (NHAS) Goal of Increasin...Cost-Effectiveness of the National HIV/AIDS Strategy (NHAS) Goal of Increasin...
Cost-Effectiveness of the National HIV/AIDS Strategy (NHAS) Goal of Increasin...
 
Economic analysis of malaria burden in kenya
Economic analysis of malaria burden in kenyaEconomic analysis of malaria burden in kenya
Economic analysis of malaria burden in kenya
 
Novel Approaches in Public Health Surveillance
Novel Approaches in Public Health SurveillanceNovel Approaches in Public Health Surveillance
Novel Approaches in Public Health Surveillance
 
END TB 2025
END TB 2025END TB 2025
END TB 2025
 
Health Needs and Rights of Women and Children @ Risk or Living with HIV & AIDS
Health Needs and Rights of Women and Children @ Risk or  Living with HIV & AIDSHealth Needs and Rights of Women and Children @ Risk or  Living with HIV & AIDS
Health Needs and Rights of Women and Children @ Risk or Living with HIV & AIDS
 
Nlep
NlepNlep
Nlep
 

Part6g

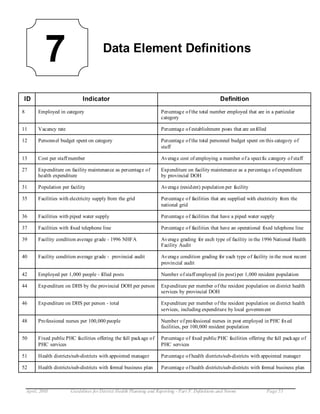
  • 1. 7 Data Element Definitions ID Indicator Definition 8 Employed in category Percentage of the total number employed that are in a particular category 11 Vacancy rate Percentage of establishment posts that are unfilled 12 Personnel budget spent on category Percentage of the total personnel budget spent on this category of staff 13 Cost per staff member Average cost of employing a member of a speci fic category of staff 27 Expenditure on facility maintenance as percentage of Expenditure on facility maintenance as a percentage of expenditure health expenditure by provincial DOH 31 Population per facility Average (resident) population per facility 35 Facilities with electricity supply from the grid Percentage of facilities that are supplied with electricity from the national grid 36 Facilities with piped water supply Percentage of facilities that have a piped water supply 37 Facilities with fixed telephone line Percentage of facilities that have an operational fixed telephone line 39 Facility condition average grade - 1996 NHFA Average grading for each type of facility in the 1996 National Health Facility Audit 40 Facility condition average grade - provincial audit Average condition grading for each type of facility in the most recent provincial audit 42 Employed per 1,000 people - filled posts Number of staff employed (in post) per 1,000 resident population 44 Expenditure on DHS by the provincial DOH per person Expenditure per member of the resident population on district health services by provincial DOH 46 Expenditure on DHS per person - total Expenditure per member of the resident population on district health services, including expenditure by local governm ent 48 Professional nurses per 100,000 people Number of professional nurses in post employed in PHC fixed facilities, per 100,000 resident population 50 Fixed public PHC facilities offering the full package of Percentage of fixed public PHC facilities offering the full package of PHC services PHC services 51 Health districts/sub-districts with appointed manager Percentage of health districts/sub-districts with appointed manager 52 Health districts/sub-districts with formal business plan Percentage of health districts/sub-districts with formal business plan April, 2003 Guidelines for District Health Planning and Reporting - Part F. Definitions and Norms Page 55
  • 2. ID Indicator Definition 53 Fixed public PHC facilities with functioning Percentage of fixed public PHC facilities with functioning community community participation structure participation structure 54 PHC headcount per person Headcount at public PHC facilities per member of the resident population 56 Children under one year fully immunized Percentage of children under one year who are fully immunized 57 Fixed public PHC facilities in facility audit condition Percentage of fixed PHC facilities in awarded condition grading four four or five or five in the 1996 NHFA audit, or equivalent in a more recent provincial audit 58 PHC facilities visited at least once per month by a Percentage of public PHC facilities visited at least once per month by supervisor who produces a written report a supervisor who produces a written report 59 PHC facilities supported by a doctor at least once a Percentage of public PHC facilities that are supported by a doctor at week least once a week 60 Health districts/sub-districts with a formal quality Percentage of health districts/sub-districts with a formal quality improvem ent plan improvem ent plan 61 PHC facilities without DTP Hib vaccine at any time of Percentage of public PHC facilities out of stock of vaccines at any year time of year 63 Expenditure on PHC per PHC headcount by province PHC expenditure by provincial DOH and DPW per headcount at provincial PHC facilities 66 HIV antenat al seroprevalence rate Prevalence of HIV in antenatal clinics expressed as a percentage 69 STI treatment rate (per 1,000) Clients treated as STIs per 1,000 resident population 71 New smear positive TB cases (number and per New TB cases with positive smear results per 100,000 resident 100,000) population 72 TB preval ence rate Prevalence of TB per 100,000 resident population 75 PHC facilities where condoms are freely available Percentage of public PHC facilities where condoms are freely available 76 Facilities offering VCT Percentage of facilities that are offering VCT services 77 Facilities offering syndromic management of STIs Percentage of facilities that offer syndromic managem ent of STIs 80 TB cases with a DOT supporter Percentage of total TB caseload with a speci fied DOTS supporter 84 Smear positive PTB cases as percentage of all PTB Smear positive PTB cases as percentage of all PTB cas es cases 85 New smear positive PTB cases as percentage of New smear positive PTB cases as a percentage of the number expect ed number of cases predicted for this area by the MRC model 87 TB cases who are being re-treated Percentage of the total TB cas eload that are being retreated (not new) 88 New smear positive PTB cases who interrupt treatment Percentage of new smear positive PTB cases who interrupt treatment 89 Dedicat ed HIV/AIDS budget spent Percentage of the HIV/AIDS sub-programme budget spent to date April, 2003 Guidelines for District Health Planning and Reporting - Part F. Definitions and Norms Page 56
  • 3. ID Indicator Definition 91 Syphilis preval ence rate Prevalence of syphilis per 1,000 resident population 92 PTB smear conversion rat e at two months for new Percentage of new smear positive cases that convert after two months cases 93 PTB smear conversion rat e at three months for re- Percentage of retreated smear positive cases that convert after three treated cases months 94 New smear positive PTB cases cured at first attempt Percentage of new smear positive cases that are cured 95 TB cases that are MDR Percentage of TB cas es that are multiple drug resistant 96 Nutrition posts filled at all levels against nutrition staff Percentage of posts in the staff establishment that are filled est ablishments 100 Newborn babies given Road to Health Chart Percentage of newborn babies who are given Road to Health Chart 101 Target ed primary schools that have feeding Percentage of targeted primary schools that have feeding programmes programmes 102 Target number of school feeding days that are actual Percentage of target number of school feeding days that are actual school feeding days school feeding days 103 Hospitals with maternity beds certi fi ed as baby fri endly Percentage of hospitals with maternity beds that are certifi ed as baby fri endly against total hospitals with maternity beds 104 Target ed schools where actual servings for school Percentage of targeted schools where actual servings for school feeding comply with requirements feeding comply with requirements and speci fications of the standardized menu options 105 Int egrat ed Nutrition Programme conditional grant spent Percentage of the Integrated Nutrition Programme conditional grant budget spent to date 106 Speci al allocation for poverty relief spent Percentage of the special allocation for poverty relief spent to date 109 Children under five years stunted Percentage of children under five years who are stunted 110 Children under five years underweight Percentage of children under five years who are underweight 111 Children under five years wasted Percentage of children under five years who are wast ed 112 Children under five years severely underweight Percentage of children under five years who are severely underweight 113 Children under five years Vitamin A defici ent Percentage of children under five years that are Vitamin A defi cient 114 Children under five years iron deficient Percentage of children under five years who are iron defici ent 115 Children under five years iodine deficient Percentage of children under five years who are iodine deficient 116 Infants at six months exclusively breast fed Percentage of infants at six months who are exclusively breast fed 132 Expenditure on hospital staff as percentage of total Expenditure on hospital staff (excluding staff employed in PHC hospital expenditure services but allocated to the hospital pay point) as percentage of total hospital expenditure 133 Expenditure on drugs for hospital use as percentage of Expenditure on drugs for hospital use (excluding drugs bought by the total hospital expenditure hospital for use by PHC facilities) as percent age of provincial DOH hospital expenditure April, 2003 Guidelines for District Health Planning and Reporting - Part F. Definitions and Norms Page 57
  • 4. ID Indicator Definition 134 Expenditure on hospital maintenance as percentage of Expenditure on hospital maintenance as percentage of total hospital total hospital expenditure expenditure by provincial DOH 135 Us able beds per 1,000 people Number of usable beds in hospitals per 1,000 resident population 137 Expenditure on hospitals by the province per person Expenditure on hospitals by the provincial DOH and DPW, including capital expenditure, per person 139 Hospitals with operational hospital board Percentage of hospitals with operational hospital board 140 Hospitals with appointed (not acting) CEO in place Percentage of hospitals that have appointed (not acting) CEO in place 141 Hospitals with business plan agreed with provincial Percentage of hospitals that have a business plan agreed with health department provincial health department 142 Hospitals with up to date asset register Percentage of hospitals with up to date asset register 143 Maximum permitted value of procurement at discretion Average maximum permitted value of procurement at discretion of of hospital CEO without reference to provincial level hospital CEO without reference to provincial level 144 Separations per 1,000 people Number of hospital separations per 1,000 resident population 146 Patient day equivalents per 1,000 people Number of patient day equivalents per 1,000 people 148 Patient fee income per separation Average patient fee income per separation 149 Hospitals in facility audit condition four or five Percentage of hospitals that are in facility audit condition four or five 150 Hospitals with current patient satisfaction survey Percentage of hospitals that have conducted and published a patient satis faction survey in last 12 months 151 Hospitals with designated offi cial responsible for Percentage of hospitals that have a designated official responsible for coordinating quality managem ent coordinating quality managem ent 152 Hospitals with clinical audit meetings at least once a Percentage of hospitals that have clinical audit (Morbidity and month Mortality) meetings at least once a month 153 Length of stay The average number of patient days that an admitted patient spends in hospital before separation 154 Bed utilization rate (based on usable beds) The number of patient days during the reporting period, expressed as a percentage of the sum of the daily number of usable beds 155 Expenditure per patient day equivalent Average expenditure (cost) for a patient day equivalent 156 Case fatality rate for surgery separations Percentage of surgery separations that are deaths 173 PMCT - HIV negative Number of clients tested for HIV and testing negative in PMCT sites 185 Expenditure by DPW per person in constant prices Expenditure by DPW on public health facilities (including capital) in const ant prices per person 187 Expenditure on equipment maintenance as percentage Expenditure on equipment maintenance as a percentage of of health expenditure expenditure by provincial DOH 188 Mat ernal mortality rate Number of maternal deaths per 1,000 women of reproductive age (15-49) April, 2003 Guidelines for District Health Planning and Reporting - Part F. Definitions and Norms Page 58
  • 5. ID Indicator Definition 189 Infant mortality rate Number of infant deaths (i.e. deaths before age one year) per 1,000 live births 190 Clients receiving home-based care Percentage of clients identified as requiring home-based care that are actually receiving it 192 Infl ation rate Annual percentage change in the CPIX index (Consumer price index, excluding interest rate changes) 193 Population - annual growth rate Annual percentage change in the total population 197 Transport costs per kilometre Transport costs per kilometre travelled 199 PHC nurse - facility headcount workload Average headcount per nurse in a PHC facility per day 200 Patients attending PHC referred to doctor Percentage of patients attending PHC who are then referred to a doctor 201 Measles cases per 1,000 population Number of confirmed measles cases per 1,000 population 202 Expenditure on PHC per person - total Provincial and municipal PHC recurrent expenditure(excluding capital expenditure) per person 203 Expenditure on PHC personnel per person - total Total recurrent expenditure (excluding capital expenditure) on PHC personnel per person 204 Expenditure on PHC per PHC headcount - total Total PHC expenditure per headcount at all (municipal and provincial) PHC facilities 206 Smear positive PTB caseload - total Smear positive PTB caseload - total (new plus retreatment cases) 230 Under five mortality rate Number of deaths before age five years per 1,000 live births 279 Teenage pregnancy Births to mothers aged 15-19 years as a percentage of all births 284 Population per square kilometre Average population within the health area per square kilometre 285 Visiting points per mobile clinic Average number of visiting points made by a mobile clinic 286 Kilometres per vehicle Average number of kilometres travelled per vehicl e 287 Cost per kilometre travelled by vehicle The average cost incurred by traveling a kilometre in a vehicle 288 Expenditure on PHC in constant prices - total Total expenditure on the PHC programme in constant prices 289 Expenditure on PHC in constant prices per person - Total expenditure on the PHC programme in constant prices, per total person 291 PHC facilities without HIV/AIDS, STI or TB drugs Percentage of public PHC facilities without HIV/AIDS, STI or TB drugs at any time of year 292 PHC facility visits per headcount Average number of visits (or services ) provided per headcount at a PHC facility 293 PHC visit - total All PHC visits, either at PHC facilities or in the community 294 PHC visits per service day Total PHC visits, either at PHC facilities or in the community, per service day April, 2003 Guidelines for District Health Planning and Reporting - Part F. Definitions and Norms Page 59
  • 6. ID Indicator Definition 295 PHC professional nurse - daily visit workload Average visits in PHC facilities or in the community per professional nurs e per day 296 PHC visit equivalents Conversion of patient days in visit equivalents in PHC facilities 297 Low birth weight rate Percentage of live births weighing less than 2500g immediately after birth 298 Cause-speci fic death rat e Number of deaths attributable to a speci fic disease in a given population in a given time period (usually express ed per 100,000 persons per year). 300 Employed staff - approved as percentage of required Percentage of the total number of staff required that are approved, in a particular category 301 Employed staff - actual as percentage of required Percentage of the total number of staff required that are actually in post, in a particular category 303 Expenditure on DHS by the provincial DOH per person Expenditure by provincial DOH per member of the resident in constant prices population on district health services in constant prices 304 Expenditure on DHS by DPW per person in constant Expenditure per member of the resident population on district health pri ces services by DPW in constant prices 305 Expenditure on DHS by municipalities per person in Expenditure per member of the resident population on district health const ant prices services by municipalities in constant prices 306 Expenditure on DHS - total by local government Expenditure on DHS, including expenditure 307 Expenditure on DHS in constant prices - total Expenditure on DHS, including expenditure by local government in const ant prices 309 Expenditure on DHS per person in constant prices - Expenditure on DHS, including expenditure by local government, per total person and in constant prices 310 Expenditure on therapeutic drug group as percentage of Expenditure on drugs in a speci fic therapeutic group as a percentage total drug expenditure of total drug expenditure 311 Expenditure on individual drug as percentage of total Expenditure on an individual drug as a percentage of total drug drug expenditure expenditure 312 Expenditure on PHC by provincial DOH per person Expenditure on the PHC programme by provincial DOH, per person 313 Hospital PHC headcount as percent age of OPD Percentage of al hospital OPD headcounts which are for PHC services headcount 315 HIV preval ence rate Proportion of the population estimated to be HIV positive. Equivalent to indicators called "People living with HIV/AIDS" April, 2003 Guidelines for District Health Planning and Reporting - Part F. Definitions and Norms Page 60