The Abortion pills for sale in Qatar@Doha [+27737758557] []Deira Dubai Kuwait
Mta dvs chxgel
1. CONSORT Randomized Clinical Trial
Antibacterial Efficacy of MTAD Final Rinse and Two Percent
Chlorhexidine Gel Medication in Teeth with Apical
Periodontitis: A Randomized Double-blinded Clinical Trial
Gevik Malkhassian, DDS, MSc,* Aldo J. Manzur, DDS, MSc,* Milos Legner, PhD,†
Edward D. Fillery, PhD,† Sheela Manek, BSc,† Bettina R. Basrani, DDS, PhD,*
and Shimon Friedman, DMD*
Abstract
Introduction: Clinical assessment of the efficacy of
novel root canal disinfection protocols is an important
focus in endodontic research. This randomized double-
T he causative role of bacteria in the pathogenesis of apical periodontitis (1) under-
lines the goal of elimination of bacteria as a critical step in root canal therapy. Bacte-
rial elimination is attempted by mechanical instrumentation, irrigation with
blinded study assessed the antibacterial efficacy of antibacterial agents, and medication with intracanal dressing. The commonly used anti-
a final rinse with BioPure MTAD (MTAD) and intracanal bacterial regimen includes the use of sodium hypochlorite (NaOCl) for irrigation and
medication with 2% chlorhexidine gel (CHX) in teeth calcium hydroxide for medication. In spite of the good efficacy of this regimen, bacteria
with apical periodontitis. Methods: Canals in 30 teeth might still survive in small numbers (2), which might adversely affect the outcome of
(single-rooted and multi-rooted) were prepared by using treatment (3). Therefore, alternatives and complements to the common regimen
1.3% NaOCl, rinsed with MTAD or saline in random continue to be investigated, with the aim to improve bacterial elimination during
sequence, medicated with CHX for 7 days, irrigated root canal treatment (2).
with 1.3% NaOCl, and filled. Bacteriologic root canal Instrumentation of the canal walls forms a smear layer that might be an obstacle to
samples were obtained by aspiration before (1A) and effective disinfection of the root canal system (4). The smear layer can be removed with
after (1B) canal preparation, after the final rinse (1C), a chelating agent such as ethylenediaminetetraacetic acid and citric acid (4). Recently,
after CHX was flushed (2A), and after final irrigation a novel compound has been developed with combined chelating and antibacterial
(2B). Bacteria were enumerated by epifluorescence- properties (5). MTAD (BioPure MTAD; Dentsply Tulsa Dental Specialties, Tulsa, OK)
microscopy (EFM) by using 2 staining methods and by is a mixture of doxycycline, citric acid, and Tween 80 (5). It is applied as a 5-minute
colony-forming-unit (CFU) counts after 14 days of incu- final rinse after canal instrumentation and irrigation with 1.3% NaOCl (6). Although
bation. Results: Bacterial counts (EFM) in 1B were preliminary in vitro studies have suggested effective elimination of root canal bacteria
greater than 95% decreased from 1A. Low bacterial by MTAD (7–10), subsequent studies did not support those results (11–15). At the
densities in 1B, 1C, 2A, and 2B did not differ significantly time this study was initiated, in vivo studies on the antibacterial efficacy of MTAD
from each other. EFM counts were consistently higher were lacking.
than CFU counts. Conclusions: The final rinse with Intracanal medication, most commonly calcium hydroxide, is applied primarily to
MTAD and medication with CHX did not reduce bacterial prevent proliferation of bacteria that survive canal instrumentation and irrigation, if
counts beyond levels achieved by canal preparation with treatment cannot be completed at the same session (2). Several in vivo studies have
NaOCl. (J Endod 2009;35:1483–1490) suggested that calcium hydroxide can effectively curtail residual root canal bacteria
(16, 17), whereas others have noted only a modest effect or even a moderate bacterial
Key Words regrowth (18–20).
Chlorhexidine gel, MTAD One alternative to calcium hydroxide is chlorhexidine gluconate (CHX) (21). CHX
is a wide-spectrum antimicrobial with a potential to impart substantive antimicrobial
activity, referred to as substantivity (21). In high concentrations CHX damages and
permeates the bacterial cell wall and then causes precipitation of the cytoplasm that
From the *Department of Endodontics and †Department of prevents repair of the cell membrane, leading to cell death. Both 2% CHX solution
Oral Microbiology, Faculty of Dentistry, University of Toronto, and gel have been used for intracanal medication in vivo (19, 22, 23). Paquette et
Toronto, Ontario, Canada.
Address requests for reprints to Dr Gevik Malkhassian, al (22) reported a moderate increase in bacterial counts in canals medicated with
Endodontics, Faculty of Dentistry, 124 Edward St, Toronto, On- CHX solution for 7–14 days. Manzur et al (19) reported no change in bacterial counts
tario M5G 1G6, Canada. E-mail address: gevik.malkhassian@ in canals medicated for 7 days with CHX gel, calcium hydroxide, or a mixture of calcium
dentistry.utoronto.ca. hydroxide and CHX.
0099-2399/$0 - see front matter The in vivo antibacterial efficacy of endodontic treatment regimens has been as-
Copyright ª 2009 American Association of Endodontists.
doi:10.1016/j.joen.2009.08.003 sessed by enumeration of bacteria recovered from root canal samples before and after
the use of test regimens. Samples have usually been acquired by means of paper points
and recovered bacteria cultivated on growth media. Although this method detects viable
cultivable bacteria, it cannot detect many noncultivable bacterial species (24). There-
fore, more sensitive methods of microbial detection have been introduced to
endodontic research, including direct enumeration of bacteria by using epifluores-
cence microscopy (22, 25). Epifluorescence microscopy is more sensitive than culture
JOE — Volume 35, Number 11, November 2009 Clinical Study of MTAD and CHX Gel 1483
2. CONSORT Randomized Clinical Trial
TABLE 1. Inclusion and Exclusion Criteria Considered for Enrollment of Subjects in the Study
Consideration Included Excluded
Patient ASA I or ASA II; 18 y of age and older; consented to ASA III and higher; pregnant female; nursing
participate; able to comply with protocol; good oral mother; cognitively impaired; known allergy
hygiene to CHX, tetracycline (doxycycline), citric acid, or
Tween 80
Tooth Adequate coronal structure; probing depth of #4 mm; Previous endodontic treatment; aberrant anatomy;
radiographic evidence of apical periodontitis; negative maxillary molar; radiographic evidence of
response to cold test internal or external root resorption
ASA, American Society of Anesthesiologists Physical Status classification system.
in quantifying bacteria, and it is also capable of distinguishing live and 30 teeth, 12 (40%) presented with spontaneous pain, 7 (23.3%)
dead bacteria in the sample (23, 26). with a history of swelling, 5 (16.6%) with a sinus tract, and 20
The aim of this in vivo epifluorescence microscopy study was to (66.6%) with percussion sensitivity.
assess the efficacy of a final rinse with MTAD, followed by root canal Subjects were randomly assigned to 2 equal groups, experimental
medication with 2% CHX gel, in curtailing residual bacteria after canal (MTAD) or control (sterile saline solution). To satisfy the requirements
instrumentation and irrigation. of a double-blinded trial, the saline control was colored to mimic
MTAD. The randomization, by drawing from a pool of lots, and prepa-
Material and Methods ration of the solutions were carried out in advance by a laboratory tech-
Study Cohort and Groups nician (S.M.), who delivered the test solutions to the treatment provider.
Before recruitment of the study cohort, the University of Toronto In this manner, both the treatment provider and patients were blinded
Health Sciences Research Ethics Board approved the protocol of this to the group allocation.
randomized, controlled, double-blinded clinical trial. Eligible partici-
pants were recruited from November 2005 until December 2006 Sample Size Calculation
from among patients who attended the Graduate Endodontics Clinic In the absence of data on the clinical efficacy of MTAD, the
at the Faculty of Dentistry, University of Toronto. Subjects were selected sample size calculation was based on the data from our previous study
in accordance with specific inclusion and exclusion criteria (Table 1). (23). In that study the mean difference in bacterial densities before
Thirty subjects consented to participate in the study (Fig. 1), including and after medication with 2% CHX liquid was 8.4 Æ 8.6 (natural loga-
15 men and 15 women with ages ranging from 25–78 years (mean, rithm-transformed DAPI counts). With SamplePower 2 software (SPSS
51.9 years). Each subject had 1 tooth that required endodontic treat- Inc, Chicago, IL), the sample size was established as 30 teeth divided
ment, for a total of 15 maxillary (6 anterior and 9 premolars) and into 2 equal groups, for an analysis at 94% power and with an alpha
15 mandibular (4 anterior, 7 premolars, and 4 molars) teeth. Of the of 0.05.
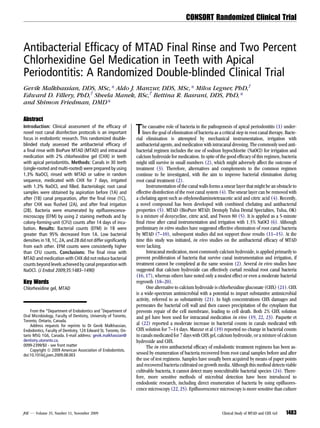
Assessed for eligibility (n = 34)
Excluded (n = 4)
Enrollment Not meeting inclusion criteria (n = 2)
Refused to participate (n = 2)
Randomly allocated to
intervention
MTAD group (n = 15) Saline group (n = 15)
Allocation
All received allocated intervention All received allocated intervention
Lost to follow-up (n = 0) Follow-Up Lost to follow-up (n = 0)
Analyzed (n = 15) Analyzed (n = 15)
Excluded from analysis Analysis Excluded from analysis
(n = 1; 1B sample from CFU) (n = 1; 1A sample from CFU)
Figure 1. The Consort flowchart.
1484 Malkhassian et al. JOE — Volume 35, Number 11, November 2009
3. CONSORT Randomized Clinical Trial
TABLE 2. Dilutions of original samples (1.0 mL RTF and approximately 0.3 mL sample), aliquots taken and RTF added to make the final subsamples constant at 1
mL for each EFM technique and 0.5 mL for CFU
Enumeration method
DAPI/DHET and BacLight CFU
Sample Original aliquot (mL) RTF added (mL) Original aliquot (mL) RTF added (mL)
1A 200 800 250 250
1B, 1C, 2A, 2B 400 600 250 250
1AC, 2AC 300 700 250 250
CFU, colony-forming unit; DAPI, 40 ,6-diamidino-2-phenylindole; DHET, dihydroethidium; EFM, epifluorescence microscopy; RTF, reduced transport fluid.
Preclinical Laboratory Procedures instruments (Dentsply Maillefer) used in the manufacturer-recommen-
For the collection of root canal bacterial samples, labeled micro- ded sequence to the WL. The apical diameter was gauged with hand files
tubes (1.5 mL) were prepared each with 1.0 mL of reduced transport and enlarged 1 size beyond the first gauging file. After each instrument,
fluid (RTF) mixed with dithiothreitol (DTT; Sigma-Aldrich, St Louis, the canal was irrigated with 1.5 mL of 1.3% NaOCl with a 30-gauge nee-
MO) (22). Empty micro-tubes were also prepared for measuring the dle, for a total minimum of 10.5 mL of NaOCl. The second root canal
volume of the treated canals. Each micro-tube was then weighed 3 times sample (1B) was obtained, and the RCV was measured as described
¨
with a precision balance (Sartorius, Gottingen, Germany), and the above. The final rinse with the test (MTAD) or control (colored saline)
average weight was calculated (22). solution was delivered in identical 5-mL syringes with a 30-gauge needle
inserted within 2 mm of WL. Initially, 1 mL of solution was slowly in-
Clinical Procedures, Sampling, and Canal Volume jected into the canal by using an up and down motion, followed by
Measurement manual agitation with a size 15 K-type file. After 5 minutes, the canal
was rinsed with the remaining 4 mL of solution. In the absence of
The basic clinical and experimental procedures, including infec-
a known inactivation protocol for MTAD (8, 9, 11), an effort was
tion control, inactivation of antibacterial agents, sampling procedures,
made to thoroughly rinse it out with 3 mL of sterile saline. Similarly,
and root canal volume (RCV) measurements, were performed as
the colored saline solution was only rinsed out, having shown no anti-
described by Paquette et al (22); they are briefly outlined below.
bacterial effect in the pilot test. The third root canal sample was then
Subjects were treated in 2 sessions 7 days apart. At the start of each
obtained (1C), and the canal was dried with paper points. Two percent
treatment session teeth were isolated, pumiced, and surface-decontami-
CHX gel (20% aqueous solution of CHX digluconate, methylcellulose
nated with 30% hydrogen peroxide and 5% iodine tincture. The antibac-
powder, and sterile distilled water; University of Toronto) was injected
terial agents were inactivated with 5% sodium thiosulfate (J. T. Baker,
into the canal from a preloaded syringe and distributed with a lentulo
Phillipsburg, N.J.) (27), and the tooth surface was rinsed with sterile
instrument (Dentsply Maillefer). A sterile sponge pellet was placed in
saline. A sterility control sample (1SC) was then obtained as follows.
the chamber, and the access was sealed with 2 layers of resin-modified
A sterile cotton pellet was used to rub the tooth surface and then placed
glass ionomer cement (Photac Fil Quick Aplical; 3 M ESPE, St Paul,
in a micro-tube filled with RTF. Drills and root canal instruments were
MN).
all heat-sterilized. Sterile saline was used for cooling during drilling.
In the second treatment session, the sterility control sample (2SC)
In the first treatment session, caries was removed, and the prelim-
was obtained, the temporary seal was removed short of penetrating the
inary access was prepared. The access cavity was decontaminated, and
chamber, the access control sample was obtained (2AC), and a new
the disinfectants were inactivated and rinsed similarly to the surface
drill was used to complete removal of the temporary seal from the
decontamination described above. The access control sample (1AC)
chamber. The canal was flushed with 3 mL sterile saline and the CHX
was obtained as follows. RTF was injected into the access cavity by using
gel inactivated with 3 mL of 0.3% L-a-lecithin (Sigma Aldrich) and
a 27-gauge needle (Monoject; Sherwood Medical, St Louis, MO) and
3% Tween 80 (28). The canal was flushed again with 3 mL of sterile
then aspirated into a syringe containing 0.3 mL of RTF. The syringe
saline and dried, and the fourth sample (2A) was obtained. The canal
contents were promptly emptied into a labeled micro-tube with 1.0
was irrigated with 1.3% NaOCl, prepared with the last hand file used or 1
mL of RTF/DTT and transferred to the microbiology laboratory for pro-
size larger, and dried, and the fifth and final sample (2B) was obtained.
cessing within 2 hours. A new drill was used to extend the access cavity
At the conclusion of treatment, the canal was dried, filled with vertically
into the pulp chamber and canal orifice. With only saline for irrigation,
compacted warm gutta-percha by using System B (Sybron Dental
an ISO size 10 or 15 stainless steel K-type file (Flexofile; Dentsply Mail-
Specialties, Orange, CA) and Thermaseal sealer (Dentsply Tulsa Dental
lefer, Ballaigues, Switzerland) was negotiated apically, and the working
Specialties), backfilled with injected warm gutta-percha (Obtura II;
length (WL) was established with an electronic apex locator (Root ZX II;
Obtura Spartan, East Earth City, MO), and the access was restored
J. Morita, Irvine, CA). The first root canal sample (1A) was acquired
with Photac Fil.
similarly to the access cavity sample, and the canal was dried with paper
points. To express the bacterial concentration per RCV, the canal was
filled with sterile water dispensed from a micro-pipette. The weight of Processing of Samples
the dispensed water was established and converted to volume, assuming All the samples were transferred to the microbiology laboratory for
a specific gravity of 1.0. In teeth with more than 1 canal, the sampling processing within 2 hours.
and volume measurement procedures were performed in all the canals Samples were processed for vital microscopy by using direct epi-
at the same time. fluorescence microscopy (EFM) counts based on 2 vital staining tech-
The canals were negotiated with ISO size 15 and 20 stainless steel niques. To enable comparisons with other studies, samples were also
K-type files to the WL, flared coronally with Gates-Glidden drills number processed for culture to obtain colony-forming unit (CFU) counts. To
2 and 3 (Dentsply Maillefer), and shaped with engine-driven ProTaper this end, each sample was divided into 3 subsamples. The final volume
JOE — Volume 35, Number 11, November 2009 Clinical Study of MTAD and CHX Gel 1485
4. CONSORT Randomized Clinical Trial
used for processing was constant at 1 mL for each EFM technique and
TABLE 3. Mean and Standard Deviation Values of Bacterial Densities (counts per mL of root canal volume) in Root Canal Samples Obtained at Different Treatment Steps from Teeth Medicated with MTAD or Saline
5.47 Â 106 Æ 5.44 Â 106
1.09 Â 105 Æ 1.34 Â 105
2.51 Â 104 Æ 1.89 Â 104
2.39 Â 105 Æ 7.14 Â 105
4.40 Â 104 Æ 6.48 Â 104
2.52 Â 106 Æ 2.96 Â 106
1.44 Â 105 Æ 2.61 Â 105
6.16 Â 104 Æ 1.04 Â 105
6.29 Â 104 Æ 1.11 Â 105
5.95 Â 104 Æ 6.48 Â 104
0.5 mL for CFU (Table 2).
The EFM subsamples were processed with 2 vital staining
Total
methods. For each sample, 1 subsample was stained with LIVE/DEAD
BacLight Bacterial Viability Kit (Molecular Probes Inc, Eugene, OR).
The second subsample was stained with dihydroethidium (DHET)
(Molecular Probes) and DAPI (40 ,6-diamidino-2-phenylindole;
Sigma-Aldrich) (23).
For the culture subsamples and the sterility control samples,
2.97 Â 106 Æ 3.30 Â 106
1.13 Â 104 Æ 1.43 Â 104
4.46 Â 103 Æ 3.93 Â 103
8.18 Â 104 Æ 2.41 Â 105
5.28 Â 103 Æ 4.21 Â 103
1.11 Â 106 Æ 1.10 Â 106
6.53 Â 104 Æ 2.19 Â 105
6.30 Â 103 Æ 1.08 Â 104
2.72 Â 104 Æ 7.81 Â 104
6.18 Â 103 Æ 9.93 Â 103
aliquots of 52 mL per sample were inoculated on a blood agar plate
BacLight
(Difco, Becton Dickinson, Sparks, MD) by using a Spiral System Plater
Dead
(Spiral System, Cincinnati, OH). All plates were incubated at 37 C for
14 days. Root canal cultures were kept under strict anaerobic condi-
tions in sealed jars with a gas mixture of 10% hydrogen, 10% carbon
dioxide, and 80% nitrogen; access cavity cultures were incubated sepa-
rately for both aerobic and anaerobic bacteria, and the sterility control
2.50 Â 106 Æ 3.11 Â 106
9.76 Â 104 Æ 1.29 Â 105
2.07 Â 104 Æ 1.68 Â 104
1.57 Â 105 Æ 3.56 Â 104
3.88 Â 104 Æ 5.33 Â 104
1.41 Â 106 Æ 2.60 Â 106
7.90 Â 104 Æ 1.46 Â 105
5.53 Â 104 Æ 9.34 Â 104
3.56 Â 104 Æ 4.33 Â 104
5.33 Â 104 Æ 5.74 Â 104
cultures were incubated aerobically. A count template was used to
establish CFU counts at the end of the incubation period.
Live
Bacterial Enumeration
Bacterial density (counts per mL of RCV)
EFM images were captured by using a Leica DMIRE2 (Leica Micro-
systems, Wetzlar, Germany) epifluorescence microscope, equipped
with a high sensitivity, black and white charge-coupled device camera
CFU, colony-forming unit; DAPI, 40 ,6-diamidino-2-phenylindole; DHET, dihydroethidium; MTAD, mixture of tetracycline isomer, acid, and detergent; RCV, root canal volume.
(Hamamatsu, Hamamatsu City, Japan), and Modular Imaging Software
5.90 Â 106 Æ 4.23 Â 106
7.93 Â 104 Æ 8.39 Â 104
6.66 Â 104 Æ 5.24 Â 104
2.45 Â 105 Æ 4.65 Â 105
2.32 Â 105 Æ 6.96 Â 105
2.96 Â 106 Æ 2.18 Â 106
1.40 Â 105 Æ 3.24 Â 105
1.39 Â 105 Æ 3.31 Â 105
1.50 Â 105 Æ 2.13 Â 105
6.09 Â 104 Æ 7.82 Â 104
(Openlab 4.0.2; Improvision, Lexington, MA). With the BacLight stain-
ing, live bacteria fluoresced green and dead bacteria fluoresced red.
Total
The signals for green and red were captured in 2 separate channels
(L5 and TX2 cubes; Leica Microsystems). With the DHET/DAPI staining,
live bacteria fluoresced red, whereas all bacteria fluoresced blue. The
red and blue signals were captured in 2 separate channels (A4 and TX2
cubes; Leica Microsystems). The dead bacteria count was calculated as
the difference between the live and total counts.
4.40 Â 106 Æ 3.93 Â 106
3.85 Â 104 Æ 5.60 Â 104
5.70 Â 104 Æ 4.95 Â 104
2.27 Â 105 Æ 4.56 Â 105
2.13 Â 105 Æ 7.00 Â 105
1.95 Â 106 Æ 1.75 Â 106
1.03 Â 105 Æ 2.75 Â 105
1.22 Â 105 Æ 3.25 Â 105
1.32 Â 105 Æ 2.03 Â 105
4.79 Â 104 Æ 6.47 Â 104
After manual focusing, the microscope was programmed to
DAPI/DHET
capture one image and to switch automatically to the appropriate filter
Dead
cube set to capture the second image. The captured paired images were
saved in TIF (Tag Image File) format on a personal computer. On
average, 130 digital images were saved for each 1A sample and approx-
imately 250 images for each subsequent sample from the same tooth.
An image analysis package (Optimas 6.5; Media Cybernetics, Silver
Spring, MD) was used to enumerate bacteria with both EFM methods.
1.51 Â 106 Æ 1.98 Â 106
4.08 Â 104 Æ 7.75 Â 104
9.58 Â 103 Æ 8.75 Â 103
1.79 Â 104 Æ 2.76 Â 104
1.86 Â 104 Æ 2.29 Â 104
1.01 Â 106 Æ 1.21 Â 106
3.66 Â 104 Æ 6.67 Â 104
1.73 Â 104 Æ 2.71 Â 104
1.72 Â 104 Æ 2.70 Â 104
1.30 Â 104 Æ 2.29 Â 104
Automated counts of bacterial cells in the microscopic images were
made with a macro developed specifically for this purpose. Images
Live
were converted to 32-bit gray scale, background noise was reduced
(3 Â 3 median filter), edges were enhanced with a filter (8-point
compass), and an attempt was made to separate individual bacterial
cells from clumped or overlapping bacteria with a water-shed algorithm.
After processing with edge detection, cells were automatically counted.
3.52 Â 105 Æ 5.83 Â 105
6.04 Æ 1.13 Â 101
5.41 Â 104 Æ 1.04 Â 105
6.66 Æ 1.01 Â 101
Counts were enumerated by CFU and 2 vital microscopy methods.
To verify the proper performance of the macro, bacteria from samples
CFU 14 days
collected in a pilot project were counted visually, and the results were
9.37 Â 10À1 Æ 1.74
3.71 Æ 4.69
1.59 Æ 2.32
2.30 Æ 3.45
2.11 Æ 2.50
7.82 Â 10À1 Æ 1.59
compared with those obtained with the automated procedure.
Culture plates were examined for absence or presence of bacterial
growth. When growth occurred, CFU counts were established with the
aid of a count template. The bacterial densities recorded by both
EFM and CFU were expressed as the number of bacteria per mL RCV
(22).
Sample
Analysis
1A
2A
1A
2A
1B
1C
2B
1B
1C
2B
SAS 9.1 (SAS Institute Inc, Cary, NC) was used for data management
and analysis. The main outcome variables were the mean EFM bacterial
Group
densities transformed by natural logarithms. The main experimental
MTAD
Saline
variables were group (MTAD versus saline) and sample (1C, 2A, 2B).
As a result of the dependent nature of the multiple treatment steps,
1486 Malkhassian et al. JOE — Volume 35, Number 11, November 2009
5. CONSORT Randomized Clinical Trial
TABLE 4. Means and Standard Deviations of the Bacterial Counts in the Access Cavity Samples at 2 Treatment Sessions, Obtained with Different Enumeration
Methods, and the Proportion of Bacteria-positive Cultures in the Samples
Count per access cavity
Enumeration method 1AC 2AC
CFU 14 days Aerobic 7.11 Â 101 Æ 2.92 Â 102 8.89 Æ 2.17 Â 101
Anaerobic 3.30 Â 101 Æ 6.23 Â 101 2.41 Â 101 Æ 3.81 Â 101
DAPI/DHET Live 2.62 Â 105 Æ 5.77 Â 105 1.08 Â 105 Æ 1.49 Â 105
Dead 1.75 Â 106 Æ 2.81 Â 106 2.24 Â 106 Æ 5.96 Â 106
Total 2.01 Â 106 Æ 2.76 Â 106 2.35 Â 106 Æ 6.06 Â 106
Baclight Live 1.15 Â 106 Æ 3.41 Â 106 3.12 Â 105 Æ 2.39 Â 105
Dead 1.21 Â 105 Æ 3.58 Â 105 7.83 Â 104 Æ 9.17 Â 104
Total 1.27 Â 106 Æ 3.75 Â 106 3.90 Â 105 Æ 2.69 Â 105
CFU, colony-forming unit; DAPI, 40 ,6-diamidino-2-phenylindole; DHET, dihydroethidium.
repeated-measures analysis of covariance was used to detect significant Sterility Control and Access Cavity Samples
differences in the bacterial densities at the different samples. In this anal- Sterility control samples 1SC and 2SC yielded bacterial growth in
ysis, bacterial densities in samples 1A and 1B were considered baseline 20% and 37% of the samples, respectively. Bacterial growth occurred
values and used as covariates after 2-sample t-tests were used to in 30% of 1AC and 17% of 2AC samples after aerobic incubation and
compare bacterial densities between the test (MTAD) and control 43% and 40%, respectively, after anaerobic incubation. The bacterial
(saline) groups in samples 1A and 1B. In addition, logistic regression counts in the access cavity samples are presented in Table 4. The
analysis was used to detect significant differences in the proportion of CFU counts were consistently low, and the EFM counts were at least 5
positive cultures between sample 1B and the subsequent samples. Statis- orders of magnitude higher. Both the CFU and EFM live counts appeared
tical tests were 2-tailed and interpreted at the 5% significance level. A to decrease from 1AC to 2AC samples. The counts of dead bacteria ap-
Bonferroni correction was used to account for multiple testing. peared higher in the DAPI/DHET-stained samples than in the BacLight-
stained samples. The access cavity dataset was not analyzed statistically.
Results
Final Data Set Effect of Root Canal Preparation
The bacterial densities (counts per mL RCV) obtained with the 3 The vital bacterial counts (both CFU and EFM values) decreased
enumeration methods are presented in Table 3. The CFU counts from substantially from 1A to 1B samples (Table 3). In both samples 1A
subject 18 (control group) were excluded because no bacterial growth and 1B, the counts did not differ significantly between the MTAD and
occurred in sample 1A, and the CFU count of sample 1B from subject 5 control groups.
(MTAD group) was excluded because of contamination of the culture
plate. Abundant CFUs were recorded in 1A samples, in sharp contrast Significant Effects, MTAD, CHX, and Final Preparation
to the few CFUs recorded in all subsequent samples. Because 1B, 1C, Table 5 summarizes the analyses of covariance for the EFM results.
2A, and 2B samples frequently had no bacterial growth (below detec- The bacterial counts in 1A samples showed no effect on counts at subse-
tion threshold), they were analyzed only for presence or absence of quent samples and were dropped from the analyses. With 2 exceptions
growth on culture plates. (BacLight-dead and DAPI/DHET-live), the bacterial counts in the 1B
EFM detected live bacteria in all samples except the DHET/DAPI- samples explained the bacterial counts at the subsequent samples;
stained 2A sample from subject 14 (MTAD group). Dead bacteria thus, higher counts at 1B samples corresponded to higher subsequent
were also detected in all samples, except the BacLight-stained 2B counts. Group (MTAD or saline) had no significant effect on the counts.
sample from subject 12 (MTAD group). The mean live bacterial counts Samples (1A, 2A, 2B) had a significant difference only for BacLight-
obtained with both EFM methods were consistently higher than the cor- dead and DAPI/DHET-total, showing higher counts in 2A than in 1C
responding CFU counts. The discrepancy was particularly evident in 1B and 2B. Group and sample had a confounded effect for BacLight-live
and subsequent samples. and BacLight-total. In particular, the MTAD counts were lower than
TABLE 5. P Values for Repeated-measures Analysis of Covariance for Vital Microscopy (EFM) Methods
Effects Covariate
Vital microscopy method Group Sample Group*Sample 1B
BacLight Live .6703 .5768 .0407* .0147*
Dead .1305 .0215* — .0711
Total .8134 .1660 .0327* .0369*
DAPI/DHET Live .8849 .5413 — —
Dead .2336 .2430 — .0269*
Total .3271 .0452* — .0043*†
DAPI, 40 ,6-diamidino-2-phenylindole; DHET, dihydroethidium.
Group = MTAD, saline; sample = 1C, 2A, 2B; empty cell = model rerun without this nonsignificant interaction or covariate.
Samples 1A and 1B were used as covariates in the analysis. All 1A results were nonsignificant and dropped from the model.
*Statistically significant at alpha = 0.05.
†
Only remaining significant value after Bonferroni correction.
JOE — Volume 35, Number 11, November 2009 Clinical Study of MTAD and CHX Gel 1487