SlideShare uma empresa Scribd logo
1 de 38
Baixar para ler offline
GRASS ROOTS RESEARCH* AND DISTRIBUTION, INC.
    #1 Small Cap Research* Firm, Powerful Distribution


 * Commercial advertisement
 www.grassrootsrd.com                                                                                     Telephone: 415.454.6985


                                                                                                           October 09, 2010


                                            Topaz Resources, Inc.
     Symbol                                          TOPZ
     Exchange                                     OTC BB
     Current Price                                    $0.55
     52 Week High/ Low                       $3.95/ $0.20
     Avg daily volume (3 mo.)                       27,719
     Shares Outstanding (in mn)                        84.1
     Current Market Cap (in $mn)                      $42.2
     Float As % of Shares Out.                       89.3%


                                   Cohen Price Target                                                      $1.94


                              INVESTMENT THESIS & RECOMMENDATION
Topaz Resources is an independent oil and gas company focusing on production, acquisitions and development of oil and gas
properties. The Company has a balanced and diversified portfolio of oil and natural gas properties located in the prolific Barnett
Shale Area and North Texas. Topaz is currently focused on commercializing its properties and expanding its Partner Program to
leverage its experience, skills and resources. The Topaz management team has a proven track record of success in executing
drilling, reserve growth and monetizing its assets in these prolific regions. The Company’s immediate growth plan includes the
acquisition and enhancement of North Texas shallow oil & gas production and acreage; drilling ten additional vertical shallow oil
wells; drilling one horizontal Barnet Shale gas well and drilling two horizontal Barnett oil wells.

In addition to its significant inventory of acreage and acquisition and drilling targets, the Company is likely to benefit from its
experienced management team and proprietary technology. Topaz has assembled a management team that has the capabilities and
experience to improve its potential and prospects. Key value drivers for the Company include: balanced portfolio of assets, use of
modern technology, favorable industry economics, higher profitability, healthy financial position and strong management.

Based on these factors, we believe that Topaz Resources is an undervalued Oil and Gas investment proposition. We forecast
Topaz’s top line to grow significantly from $0.3 million in 2010 to $175.9 million by FYE 2016. The Company will have to raise
over $30.0 million in capital, and close to $7.5 million in immediate funding to meet our projections. The stock is an attractive
short term trade and long term investment provided the Company raises the capital and meets our projections. Upside potential is
252.3% in the short to long term.
    Copyright © 2010 by Grass Roots Research and Distribution, Inc. All rights reserved. This report may not be reproduced.
Grass Roots Research and Distribution, Inc.


                              Sales, Earnings Margin Forecast – Base Case

all figures in $ 'millions; unles   2010 F      2011 F     2012 F       2013 F          2014 F          2015 F         2016 F
‡˜‡—‡•
  % growth                                                   199.3%        126.6%             69.7%            59.9%      40.2%
EBIT Margin                                     116.2%      99.8%         95.5%             94.6%            94.4%      95.0%
‡– ”‘ˆ‹–
  Net Profit Margin                                33.1%      54.5%         60.1%             61.4%            61.8%      54.1%
 ƒ”‹‰• ‡” Šƒ”‡ ‹Ž—–‡†
 ”‡‡ ƒ•Š Ž‘™ –‘ ‹”


                                         Cohen Price Target Summary

The Cohen Price Target is calculated by 25% equal weighting of four different valuation methodologies. We use
an industry average PE, an industry average price/capital employed (P/CE), a Cohen Performance Index, and the
fundamentally driven Cohen DCF.
                                             The Cohen Price TargetTM Formula

                     Price to Earnings (P/E)                                                   in US$
                     TOPZ Earnings Per Share 2011 Avg. Forecasts                      0.13
                     Industry Average P/E Ratio                                      17.43
                     Price based on P/E Ratio                                                           2.20

                     Price to Capital Employed (P/CE)                                          in US$
                     TOPZ Capital Employed                                             0.36
                     Industry Average P/CE Ratio                                       6.47
                     Price based on P/CE Ratio                                                          2.35

                     Cohen Discounted Cash Flow Model                                          in US$
                     Cohen DCF Value Base Case                                                          2.12

                     Cohen Performance Index                                                   in US$
                     Cohen Price Performance Index Value                             98.2%
                     TOPZ Current Stock Price                                         0.55
                     Price based on Cohen Performance Index                                             1.09

                     Cohen Price Index Target                                                           1.94

                     Current Price                                                                      0.55

                     Upside/ (Downside) Potential                                                     252.3%


  Copyright © 2010 by Grass Roots Research and Distribution, Inc. All rights reserved. This report may not be reproduced.
                                                     Page 2 of 38
Grass Roots Research and Distribution, Inc.


                                      EXECUTIVE SUMMARY
x   Topaz Resources Inc. (OTC BB: TOPZ), headquartered in Texas, is an independent oil and gas exploration and
    production company. The Company’s focus is to explore and acquire acreage in the prolific North-West-Central
    Texas belt, especially the Barnett Shale Play.
x   Topaz business strategy focuses on building its strengths to acquire acreage and production within its target
    locations, enhance the value of its acreage through drilling and well work-overs and expanding its network through
    a Partner Program to leverage its expertise in the oil  gas exploration and production industry.
x   The Company’s objective is to increase and enhance free cash flows by maximizing its proven reserve bases
    through acquisitions, organic growth and strategic partnerships. Management is continuously examining exciting
    acquisition opportunities and is focused on monetization of its assets via individual or complete asset sales.
x   The Company has assembled an enviable lease position with a large resource base. The Company’s total acreage
    in the Barnett Shale Area is spread over 2,800 gross acres and is estimated to have a resource base equivalent to 90
    billion cubic feet of natural gas.
x   TOPZ recently reported positive results from its drilling program at its Barnett Shale well located in the oil leg
    of the Barnett shale. The well was drilled to a total depth of 7,740 feet, and the logs have identified a 600 foot
    section of Barnett Shale which includes a solid 400 foot section in the Lower Barnett with porosity and
    permeability values that indicate good productive capabilities.
x   In addition, following completion of its acquisition of shallow oil and gas properties in North Texas and through
    the recently launched partner program, Topaz will hold an additional 1,000 acres with an estimated reserve base of
    14 billion cubic feet of natural gas equivalent.
x   This exciting reserve base and lease position combined with experience in drilling wells and advancing projects in
    the Barnett play and North-Central Texas energy provides Topaz with a strong competitive advantage. The
    Company is poised to fully exploit the production potential and financial upside of its project inventory.
x   The Company’s immediate growth plan is to make significant investment in drilling wells at its Barnett Play,
    expanding its network through the partner program and acquiring additional properties. Topaz plans to drill 5 new
    wells in 2010, commercialize production at these properties and further expand its asset base.
x   Declining conventional crude discoveries, increasing dependence on foreign oil, technology advancements and
    higher oil prices have resulted in renewed focus on abundant but difficult to explore oil and gas reserves. One of
    the most credible and proven sources is natural gas from the 8,000-9,000 feet depth Barnett formations.
x   Continuing global economic growth led by emerging markets such as China and India along with worsening
    geopolitics in the key oil producing areas and other economic slowdown in developed nations are likely to keep
    pressure on the demand-supply equation of oil and natural gas.
x   Risks: Capital access and competition from larger companies. Though the Company recently received debt and
    equity funding, Topaz will require investing $30.0 million to achieve its long term plans out of which $7.5 million
    would have to be raised immediately. Inabilityof a capital raise would impact growth plans.
Valuations:
x   We project revenues of approximately $0.3 million for fiscal year end December 31, 2010 and $175.9 million by
    2016. Margins are likely to expand as the Company’s assets are concentrated in low cost producing areas. We
    expect the Company to be cash flow positive by 2012.
x   The Cohen Price Target is calculated using market-based multiple valuation, Discounted Cash Flow (DCF) and by
    applying the Cohen Price Performance Index approach. The multiple based valuation approach uses the expected
    2011 Price-to-Earnings and Price-to-Capital Employed ratio. We also include the Cohen Price Performance Index,
    which is representative of the past coverage performance of all stocks evaluated by us. The last component in
    calculating the Cohen Price Target is the value derived using the long-term Cohen Discounted Cash Flow (DCF)
    valuation approach.
x   Based on this method, TOPZ common stock is valued at $1.94 per share, 252.3% higher than current market price
    of $0.55. The stock is an attractive short term trade and long term buy provided funds are raised.


Copyright © 2010 by Grass Roots Research and Distribution, Inc. All rights reserved. This report may not be reproduced.
                                                   Page 3 of 38
Grass Roots Research and Distribution, Inc.


                                      INVESTMENT SUMMARY


Topaz Resources, Inc. (OTCBB: TOPZ), headquartered in Denton, Texas, is an independent oil and gas
exploration and production Company. The Company is currently focusing its activities in the prolific belt of
North-West-Central Texas. The Company’s strategy is to acquire and expand its acreages and continue the
production and development of drilling opportunities within proven producing areas. The Company only selects
projects that have the potential to create a secure and abundant resource base which can be profitably explored
and developed. The Company currently holds acreage in the Barnett Shale play that passes through 15 counties in
North-West-Central Texas; with expected acreage acquisitions in other North Texas formations, including the
Strawn.

The Company’s management team provides it with a significant competitive advantage which should enable it to
achieve its corporate objectives: increase shareholder value, enhance cash flows and grow owned proven reserve
values. The Company will achieve this by leveraging its strength and aggressively pursuing its growth strategy.
The Company plans to increase and enhance cash flows through opportunistic monetization of its assets or
individual properties.

                                         Figure 1: Topaz’s Corporate Strategy


                                               Focus operations within North West Central Texas where the
                                               management team has a competitive advantage


                                               Drive organic growth through internally generated projects


                                               Maximize reserve growth through exploration and drilling of
                                               existing core properties


                                               Complement this growth strategy by strategic and timely
                                               acquisitions of assets


                                               Manage costs and development schedules through operational
                                               control to achieve higher profitability


                                               Expand its network through the Partner Program that shall enable
                                               it to leverage its rigs , work crews, and other expertise.


  Copyright © 2010 by Grass Roots Research and Distribution, Inc. All rights reserved. This report may not be reproduced.
                                                     Page 4 of 38
Grass Roots Research and Distribution, Inc.

In the current year, we expect the Company to consolidate and enhance its oil and gas properties and acquire new
acreage to expand reserve base. Topaz will need to invest approximately $30.0 million to expand acreage and drill
new oil and gas wells, of which the Company will need to invest approximately $7.5 million in the next 12-
months. We expect long term upside revenue opportunities from the Company’s portfolio of assets, highly
scalable business model, and new acquisition deals as natural gas discoveries increase in these prolific locations.
The recent announcement regarding the agreement with RMJ, Inc. as a part of its Partners Program further
provides positive impetus to Company’s growth plans. Our projections are based on reserve recovery of over 90
billion cubic feet of gas equivalent. However, the Company’s total probable reserve base could be much larger
than this, and any additional exploration will result in further upside. Topaz Resources is one of most exciting
junior oil and gas companies and provides an exciting short term and long term investment opportunity for risk
adverse investors.


                                EVOLUTION OF THE COMPANY
The Topaz Group is one of the most dynamic and exciting Groups working in the prolific Barnett Shale belt. The
Company has evolved into one of the most competitive players in this area through a disciplined strategy based on
focusing only within prime producing formations of North-West-Central Texas and seeking financing partners to
drill wells and generate proven reserves. This has enabled the Company to become a partner of choice for wells,
which previously have been drilled and need specialized expertise in either completion, work-overs or other
supplemental work to bring them into production or to improve production. During the last decade, the Topaz
Group has assembled, drilled and sold over 10,000 Barnett lease acres totaling approximately $100 million
through a number of separate drilling programs/ ventures. Management of Topaz Group through various
partnerships and private entities have drilled and/or operated in over 250 wells in this region.

                                        Figure 2: Evolution of the Topaz Group


        2001 03:                             •In 2001, the Group established its first drilling program.
                                             •Committed approximately 550acres to a privately held company that financed drilling a
    Krum Area, Denton                         total of 11 wells.
                                             •In 2003, these acres and reserves were sold to EnCana Corp. (TSX,NYSE: ECA) as part of a
         County                               larger property sale.


         2002 05:                            •In 2002, the Topaz Group committed approximately 2,500 lease acres to another privately
                                              held company.
        Argyle Area,                         •A total of 12 Barnett wells were drilled.
                                             •In mid 2005, this production, the reserves and acreage were sold to a private company for
       Denton County                          approximately $30 million and later resold to Range Resources Corporation (NYSE:RRC).


        2004 06:                             •In 2004, the Topaz Group acted as an operator and committed approximately 5,000 acres
                                              located to the west and southeast of the city of Denton, Texas.
   West and Southeast                        •In partnership with a private Australian finance group, a total of 16 wells were drilled
                                             •The Company sold its production, reserves and acreage to Dune Energy, Inc. for $46
     of Denton City                           million and later sold to Pioneer Natural Resources Company (NYSE:PXD).


  Copyright © 2010 by Grass Roots Research and Distribution, Inc. All rights reserved. This report may not be reproduced.
                                                     Page 5 of 38
Grass Roots Research and Distribution, Inc.


                                       COMPANY STRUCTURE
In order to achieve superior growth and achieve its highest level of efficiency, Topaz has grouped its assets and
projects of interest into different operating segments. At times, these are operating segments or assets held in
wholly owned individual limited partnerships. The key objective of using this structure is to provide operational
and budgetary focus for reserve development and enhancement. In addition, it also allows the Company to act
swiftly to make opportune acquisitions. The Company’s current operating structure is shown below:

                               Figure 3: Topaz Resources’ Current Operating Structure


       Parent Company
                                                                  Topaz
                                                               Resources Inc


                                       Production
                                                                                                        Barnett
      Current Operating                    and                          Barnett
                                                                                                         Gas
          Segments                      Leasehold                      Oil Project
                                                                                                        Project
                                       Acquisitions


  Copyright © 2010 by Grass Roots Research and Distribution, Inc. All rights reserved. This report may not be reproduced.
                                                     Page 6 of 38
Grass Roots Research and Distribution, Inc.


                                          COHEN GROWTH DRIVERS
                                               Figure 4: Cohen Growth Drivers

                                          2010 F      2011 F       2012 F     2013 F      2014 F       2015 F       2016 F
Barnett Gas Project
—„‡” ‘ˆ ‡ŽŽ•

ƒ• ”‘†—…–‹‘ ’‡” ‡ŽŽ ‹ …ˆ
‹Ž ”‘†—…–‹‘ ’‡” ‡ŽŽ ‹ „Ž

Barnett Oil Project
—„‡” ‘ˆ ‡ŽŽ•

ƒ• ”‘†—…–‹‘ ’‡” ‡ŽŽ ‹ …ˆ
‹Ž ”‘†—…–‹‘ ’‡” ‡ŽŽ ‹ „Ž

North Taxes Oil Plays
—„‡” ‘ˆ ‡ŽŽ•

ƒ• ”‘†—…–‹‘ ’‡” ‡ŽŽ ‹ …ˆ
‹Ž ”‘†—…–‹‘ ’‡” ‡ŽŽ ‹ „Ž

Total Production

ƒ• ‹ …ˆ
‹Ž ‹ †Ž•

Price

ƒ• ’‡” …ˆ
  % growth
‹Ž ’‡” †Ž•
  % growth

Net Revenues (in $ millions)

ĥ
‹Ž
TOTAL                                         0.33         6.82       20.41      46.25       78.47       125.46       175.93


Annual Revenues, Margins, Assets, Turns
all figures in $ 'millions                2010 F      2011 F       2012 F     2013 F      2014 F       2015 F       2016 F
‡– ‡˜‡—‡
’‡”ƒ–‹‰ ƒ”‰‹
‡– ƒ”‰‹
  ‹Ž—–‡†
”‡‡ ƒ•Š Ž‘™
 ƒ•Š ƒ† “—‹˜ƒŽ‡–•
‘”‹‰ ƒ’‹–ƒŽ
‘‰ ‡” ‡„–
‘–ƒŽ ‡„–
‘–ƒŽ ••‡–•
 

Percentage Change in Annual Revenues, Margins, Assets, Turns
                                        2010 F          2011 F     2012 F     2013 F      2014 F       2015 F       2016 F
‡˜‡—‡•                                        
’‡”ƒ–‹‰ ƒ”‰‹                                
‡– ƒ”‰‹                                      
  ‹Ž—–‡†
”‡‡ ƒ•Š Ž‘™                                    
 ƒ•Š                                            
‘”‹‰ ƒ’‹–ƒŽ                                  
‘–ƒŽ ‡„–                                                   
‘–ƒŽ ••‡–•                                     


  Copyright © 2010 by Grass Roots Research and Distribution, Inc. All rights reserved. This report may not be reproduced.
                                                     Page 7 of 38
Grass Roots Research and Distribution, Inc.

The Cohen Growth Drivers Model is an intelligent road map used by many securities analysts to analyze the
forecasted growth of a given company. Topaz Resources is expected to generate revenue from sale of Oil and
Natural Gas. The Company expects to cater to the large and growing market for oil and natural gas to be explored
from the prolific Barnett Play. Topaz is likely to aggressively expand its drilling program to commercialize oil
and gas production from its owned acreages. The Company is expected to continue acquiring unique assets that fit
the investment strategy of the firm. The global market for petroleum and natural gas is poised to continue with its
growth momentum over the next few years. Limited new discoveries, uncertainty in major producing nations,
growing demand and economic recovery will result in demand supply imbalance, in favor of suppliers, resulting
in high prices.

We expect significant revenues as the Company continues to bring more wells into production.
Commercialization of reserves in the prolific Barnett Shale gas play during the second half of the current year will
result in gross revenues of $0.3 million for FYE 2010. Going forward, the Company will not only benefit from
the expansion of Barnett acreages and partnerships to drill additional wells will result in revenues of $6.8 million
in FYE 2011. We expect revenues to grow thereafter to $175.9 million by FYE 2016. The key driver for this
growth is continued demand for oil and gas. The Company’s assets are an intelligent mix of acceptable risk, high
profit and short return in historically successful and productive regions. There are a number of established
companies in the industry and the available equipment and infrastructure is excellent. As a result TOPZ is likely
to ensure higher operating margins throughout our forecast period (Management Guidance).

The Company plans to spend approximately $7.5 million in capital expenditures in the next 12 months and will
require investing an additional $22.5 million to meet our projections (total funding requirement of $30.0 million).
These expenditures will be directed toward developing existing proved and probable reserves and evaluating and
acquiring new project areas. In addition to drilling new wells, Topaz is expected to invest additional funds in
development of logistics and transportation infrastructure.

Revenues are expected to grow rapidly as the Company commences commercial production from its wells.
Margins are positive and are expected to improve from 2010 going forward. Free cash flows are forecasted to be
positive in 2012 as significant investments are expected.


  Copyright © 2010 by Grass Roots Research and Distribution, Inc. All rights reserved. This report may not be reproduced.
                                                     Page 8 of 38
Grass Roots Research and Distribution, Inc.


                                         VALUE PROPOSITION

Topaz expects to generate substantial growth in value from sale of natural gas once it commercializes production
from its Barnett projects. The Company has designed an exploration program to cost effectively evaluate the
leases, using superior production technologies. The Company is positioned to seek opportunities arising from the
increased demand for natural gas due to demand supply imbalance and economic resurgence. Management’s
ability to raise funds, acquire new reserves and exit at the right time also provides a positive impetus to the
Company.

                                            Figure 5: Topaz’s Value Drivers


      Balanced and                                 Excellent
                                                                                              Attractive
     Diversified Asset                          Business Model
                                                                                          Financial Position
           Base                                  and Strategy


         Established                                 Attractive                                 Attractive
         Production                                   Industry                                   Current
           History                                   Dynamics                                   Valuation


     Partner Program                              Experienced
                                                                                           Established Exit
        will enable                               Management
                                                                                               Strategy
        expansion                                    Team


Note how the value proposition integrates significant revenues and market opportunities.


  Copyright © 2010 by Grass Roots Research and Distribution, Inc. All rights reserved. This report may not be reproduced.
                                                     Page 9 of 38
Grass Roots Research and Distribution, Inc.


                               COMPANY ASSET DESCRIPTION

Since its inception, Topaz Resources has assembled an exciting portfolio of assets located in Texas. Currently, the
Company is actively pursuing acquisition, expansion and drilling activities in the Barnett play and North Texas.

                                        Figure 6: Overview of Company’s Assets


                        Topaz Resources Inc.
                                                                                  North
                                 Barnett Area
                                                                                  Texas
                        Barnett Gas                Barnett Oil                   Strawn
                         Project –                Project – 950                Formation –
                        1,850 acres                   acres                    1,000 acres

About The Barnett Gas Project

The Company owns approximately 1,850 gross acres in the natural gas heart of the Barnett play. Located in the
historic core area in Wise and Denton counties and surrounded by existing production and current drilling
activity, this acreage has excellent exisiting gathering systems and pipeline infrastructure. The Company plans to
invest approximatly $2.75 million per well, and Topaz's strategy is to drill at least 1 horizontal well in 2010 at a
depth of 8,000 to 9,000 feet and then 1 horizontal well per quarter during 2011 accelerating thereafter.

                                    Figure 7: Barnett Gas Project – Horizontal Well


  Copyright © 2010 by Grass Roots Research and Distribution, Inc. All rights reserved. This report may not be reproduced.
                                                    Page 10 of 38
Grass Roots Research and Distribution, Inc.

It is estimated that each well holds 1.75 billion cubic feet of gas providing additional probable and possible
reserves of 61.25 billion cubic feet of gas. Management expects initial production rates of 2.0 million cubic feet
per day of natural gas. Topaz’s acreage in this project area easily could accommodate drilling 35 new horizontal
Barnett wells.

This Barnett acreage was acquired by Topaz through the 2006 farm-out agreement under which the Topaz group
participated in drilling and completing sixteen wells, all of which were successful commercial wells. Six of these
wells were funded and acquired by a privately held company and ten wells have been acquired by Pioneer Natural
Resources Company (NYSE:PXD).

About The Barnett Oil Project

Topaz holds approximately 950 acres located favorably in the oil area in Montague County of the Barnett play in
Texas. Due to significant improvement in completion techniques, it has been possible to explore oil from the
extended Barnett into the Montague County. Topaz will need to invest $2.75 million per well. The Company
plans to drill at least 2 horizontal wells in 2010 at a depth of 8,000 to 9,000 feet followed by 5 horizontal wells in
2011 accelerating thereafter.

                                 Figure 8: Location of Company’s Barnett Oil Project


Management believes that these wells will typically have initial production rates of 150 bbls of oil and 275 Mcf of
gas per day. Topaz will target to accommodate and drill 15 new horizontal Barnett wells with expected resources
in place of 1.875 billion cubic feet of gas equivalent, further providing additional probable and possible reserves
of 28.125 billion cubic feet of gas equivalent.


  Copyright © 2010 by Grass Roots Research and Distribution, Inc. All rights reserved. This report may not be reproduced.
                                                    Page 11 of 38
Grass Roots Research and Distribution, Inc.

Management’s estimates are expected to be realistic as several new vertical wells near the Company’s acreage
have successfully drilled wells with initial production rates of 100 to 200 barrels of oil per day and 200 to 350
Mcf per day. The most active player close to Company’s acreage is EOG Resources, Inc.

Topaz recently reported1 the drilling and log results of its Barnett Shale oil well. The well was drilled to a total
depth of 7,740 feet stopping at the top of the Viola formation. The electronic logs have identified a 600 foot
section of Barnett Shale which includes a solid 400 foot section in the Lower Barnett with porosity and
permeability values that indicate good productive capabilities. The logs also confirm good productive
characteristics from 6,775 feet to 6,785 feet, from 6,817 feet to 6,827 feet and from 6,881 feet to 6,888 feet in the
shallower Conglomerate, supporting the good oil and gas shows that were encountered during drilling through
these depths. In addition, oil and gas drilling and the logs indicate a potential productive Marble Falls zone at
6,980 feet to 7,160 feet. Based on these results, Topaz set casing and cemented as a vertical well through the
Barnett up to the shallower Conglomerate and Marble Falls zones. The Company is currently designing a
completion program and assessing the behind pipe production and reserve potential in the Marble Falls and
Conglomerate formations.

                                        Figure 9: Barnett Oil Project – Vertical Well


About The North Texas Shallow Oil  Gas Project

In addition to aggressively expanding its presence and expediting its drilling program in the Barnett play, Topaz is
also acquiring shallow oil and gas production properties with development upside in North Texas. One such
anticipated property acquisition is spread across 980 acres and consists of six leases. Currently, there are 25 wells
which together produce 3,000 bbls of oil and 6,000 Mcf of gas per month. The wells produce from the Strawn
Sand from two producing horizons, at 3,000 feet and at 1700 feet. Wells have been drilled at 20 and 10 acre
spacing with the possibility of further down spacing.

There are 20 to 30 additional drill locations at both depths. Recent drilling has focused on the shallower sand
horizon. At these shallower depths, the cost of drilling and completing a new well ranges from $100,000 to


1
    Source: Company Press Release


     Copyright © 2010 by Grass Roots Research and Distribution, Inc. All rights reserved. This report may not be reproduced.
                                                       Page 12 of 38
Grass Roots Research and Distribution, Inc.

$125,000 with an average initial production of 25 bbl and 50 Mcf per day. With oil prices at $80 per barrel the
payback on capital can be less than six months.

Topaz plans to prioritize the drilling program at this site as management believes that this property will quickly
increase its monthly cash flows thereby assisting the financing of new drill programs and further acquisiitons. The
Company is expected to drill at least 10 vertical wells at a depth of 1,700 feet in 2010.


  Copyright © 2010 by Grass Roots Research and Distribution, Inc. All rights reserved. This report may not be reproduced.
                                                    Page 13 of 38
Grass Roots Research and Distribution, Inc.


                           COMPANY LOCATION DESCRIPTION
Topaz has focused its activities and resources on expanding its presence in the North-Central-West Texas
producing formations that are spread across 15 counties immediately northwest of Dallas, Texas. The Barnett
Shale/Newark East Play located within these counties and today is one of the largest natural gas plays and drilling
booms in the continental United States and the biggest producing gas field in Texas.

                                           Figure 10: The Barnett Shale Play


The Barnett Shale is a geological formation located in the Bend Arch-Fort Worth Basin. It consists of sedimentary
rocks of Mississippian age (354–323 million years ago) in Texas. Improved completion techniques have allowed
operators to more than double the daily production in the Barnett since 2006 to about 4 billion cubic feet per day
from the currently operating 6,000 Barnett wells. The drilling activity is intense with approximately 70 rigs
running in this area operated by small operators to larger public energy companies.

Based on reports by various experts, it is estimated that Barnett Shale may have the largest producible reserves of
any onshore natural gas field in the United States. The Barnett Shale has a proven reserve base of 2.5 trillion
cubic feet of natural gas, and additional probable reserves of 30 trillion cubic feet of natural gas resources. Recent
technology developments and geological surveys have also shown reserves of oil, though in much lesser
quantities, but sufficient to be commercially viable.


  Copyright © 2010 by Grass Roots Research and Distribution, Inc. All rights reserved. This report may not be reproduced.
                                                    Page 14 of 38
Grass Roots Research and Distribution, Inc.

                             Figure 11: The Barnett Shale – Oil and Gas Producing Areas


Barnett is the productive formation that occurs at a depth of 8,000 to 9,000 feet. Until the 1990’s, most drilling
was done at formations above the Barnett, throughout Topaz’s acreages. The key hindrance that has limited the
production from Barnett Shale is because this play is a tight gas reservoir, indicating that the gas cannot be easily
extracted. The shale is very hard, making it virtually impossible to produce gas in commercial quantities from this
formation. However, recent improvements made in hydraulic fracturing technology and horizontal drilling,
coupled with the upturn in the natural gas prices have made drilling attractive in this region.


  Copyright © 2010 by Grass Roots Research and Distribution, Inc. All rights reserved. This report may not be reproduced.
                                                    Page 15 of 38
Grass Roots Research and Distribution, Inc.

                                        Figure 12: The Barnett Formations


Copyright © 2010 by Grass Roots Research and Distribution, Inc. All rights reserved. This report may not be reproduced.
                                                  Page 16 of 38
Grass Roots Research and Distribution, Inc.


                                                BULL CASE
 x    Total world demand for natural gas will continue to increase at an average annual rate of 1.5% to 2025.
      Liquid fuels are expected to rise 1.0% annually until 2030.

 x    Increasing use for electricity generation and industrial applications will account for about 75% of the
      projected growth in natural gas demand until 2025.

 x    Price-inelastic demand as most customers are unable to switch easily to an alternate fuel once they have
      committed to using gas for gas-fired equipment.

 x    Topaz Resources has a strong base of assets in areas known for producing high quantity oil and gas.
 x    The Company’s oil and gas properties are located in the prolific Barnett Shale Play. These assets are
      likely to provide assured funds to finance other projects to be undertaken in the future.
 x    Partner programs will enable Topaz to leverage its rigs, workforce and other expertise in the region to
      increase revenues and cash flows.


                                                BEAR CASE
 x    Factors that govern commodity prices are beyond the Company’s control.
 x    The rise in global Oil and Gas supply might result in lower prices making exploration from Barnett Shale
      uneconomical.
 x    The Company’s revenues and operating results are highly dependent upon the success of the exploratory
      and developmental drilling program at its various projects.
 x    Access to substantial sums of capital.


Copyright © 2010 by Grass Roots Research and Distribution, Inc. All rights reserved. This report may not be reproduced.
                                                  Page 17 of 38
Grass Roots Research and Distribution, Inc.


                                             GROWTH PLANS
The Company plans to invest significant capital to expedite growth. This capital will be invested in:

    x   Acquisition and enhancement of North Texas shallow oil  gas project

    x   Sign up with additional companies to expand its Well Partner Program with a target to at least sign-up
        with 5 wells.

    x   Drilling additional vertical Strawn oil wells

    x   Drilling three additional Barnet wells, (1 gas wells and 2 oil wells)

Based on its growth plans, internal management estimates and planned acquisition and drilling activities, total
proved and probable reserves could total 106 billion cubic feet of gas equivalent by year end 2010.

                                    Figure 13: Topaz Resources – Reserve Break-up


  Copyright © 2010 by Grass Roots Research and Distribution, Inc. All rights reserved. This report may not be reproduced.
                                                    Page 18 of 38
Grass Roots Research and Distribution, Inc.


                INDUSTRY OVERVIEW AND COMPETITION
Economic slowdown, rising exploration, production costs, and the increasing imbalance between demand and
supply are the primary drivers for the volatility in oil prices. The inability of oil companies to replace their
reserves and depletion of the proven reserves are the principle reasons for ongoing supply constraints. Existing
reserves are depleting due to rising energy needs of growing economies such as China, India and Brazil. OPEC
does not have spare capacity to increase supply. It is also increasingly difficult for companies to find new oil
fields. Iran’s nuclear standoff, civil unrest in Nigeria, nationalization of production by Venezuela, Ecuador, and
Bolivia and maturing fields in the U.S. and Europe further constrain supplies. Increases in oil supply are
dependent upon technological advancements or price increases in order to make undeveloped oil resources
profitable. Speculative market activities are increasing the demand for oil. The limited supply of drilling and
exploration equipment and the growing cost of steel and other raw materials are driving costs higher. A solution
is to use previously abandoned land for profitable oil production and use new technology in order to meet the
growing demand-supply imbalance. Exploration of oil sands is another important solution.

                                             Figure 14: Industry Overview


  Copyright © 2010 by Grass Roots Research and Distribution, Inc. All rights reserved. This report may not be reproduced.
                                                    Page 19 of 38
Grass Roots Research and Distribution, Inc.

Value Drivers: Oil and Gas Industry
                                    Figure 15: Value Drivers: Oil  Gas Industries


                                                                               led


Outlook: Oil and Gas Industry

Demand and Supply: Global oil demand declined in 2009 for the second consecutive year, the first time since
1983 that this has occurred. The decline bottomed out in the middle of 2009, as the world economy began to
recover in the last half of the year. The global market for oil and gas is expected to tighten in 2010 and 2011
driven by the positive recovery in the global economy. Developing and under-developed economies and other
countries outside the OECD are expected to lead the demand recovery. Last, the demand for oil in developed
nations will also grow in response to improving economic conditions. China and India continue to lead world
consumption growth.

The recent cuts announced by the Organization of the Petroleum Exporting Countries (OPEC) have weakened the
global market for oil. This has led to global oil and gas inventories and spare production capacity. This coupled
with expectations of a continued global economic turnaround have resulted in the reinforcement of the global oil
markets.


  Copyright © 2010 by Grass Roots Research and Distribution, Inc. All rights reserved. This report may not be reproduced.
                                                    Page 20 of 38
Grass Roots Research and Distribution, Inc.

                                  Figure 16: Energy Demand Forecasts (Source: EIA)


Competition

The global oil and gas industry is highly competitive. Individuals, smaller companies, and major oil and gas
companies compete for attractive assets. The primary factors differentiating major companies from smaller ones
are increased technical, financial and operational resources and staff. Also, for smaller companies, competition
arises mainly from other companies operating in and around their acreage of operations. The 70+/- drilling rigs
running in the area and over billions of dollars of investment annually into Barnett Area highlight its tremendous
opportunity. Today, more than 8,000 wells have been drilled in Barnett alone within the last six years. Currently,
Chesapeake Energy, Devon, EOG Resources and XTO (recently acquired by ExxonMobil) are among the major
players working in Topaz Resources’ focus area in Barnett Shale Area. We believe several factors differentiate
Topaz from its competitors, as discussed in the Value Driver section of our report.


                                       MANAGEMENT BIOS
Top management at Topaz Resources provides a competitive advantage. Their experience in the field of Natural
Gas, exploration and production includes capitalizing on industry cycles, making opportunistic acquisitions,
significantly ramping-up production and identifying suitable exit opportunities bodes well for the Company.
Management’s capability to source funds for acquisition in current uncertain markets provides liquidity for the
Company required to stay afloat in tough commodity cycle conditions.


Edward J. Munden, CEO, is a professional geological engineer with an MBA and is a co-founder of a private
boutique investment banking organization that has provided and/or arranged early and mid stage venture capital
and hands-on managerial assistance to a portfolio of energy, mining and technology software companies. From

  Copyright © 2010 by Grass Roots Research and Distribution, Inc. All rights reserved. This report may not be reproduced.
                                                    Page 21 of 38
Grass Roots Research and Distribution, Inc.

2001 to present, Mr. Munden has focused on development and financing of oil and gas leasing and drilling
projects in the Barnett Shale play in north-central Texas with a strategy of accumulating a solid mineral lease
position and building a strong operational capability. In 1994, Mr. Munden co-founded a Dallas based
independent NASDAQ-traded public energy company engaged in the exploration, development and acquisition of
oil and natural gas properties and held senior level positions including Director, Chairman, President and CEO
until it was sold for over $150 million in December 2001. Mr. Munden has held positions in the energy, mining,
manufacturing and technology industries for more than 30 years.
Robert P. Lindsay, COO, is a second-generation oil and gas professional with over 43 years experience in the
petroleum industry. He has planned and executed drilling and rework programs in Texas, Louisiana, Kentucky
and New Mexico. From 2001 to present, Mr. Lindsay has focused on locating, evaluating and securing mineral
leases in the Barnett Shale play in north central Texas, wherein he has drilled or participated in over 250 oil  gas
wells in the immediate region; has assembled, drilled and sold over 10,000 acres with dollar values approaching
$100 million; and has built and sold 6 Barnett Shale drilling rigs. Prior to this, Mr. Lindsay was Chief Operating
Officer of a NASDAQ energy company responsible for all administrative and operational aspects of the
company’s producing and development properties. From 1973 until 1995, Mr. Lindsay managed over 200
employees and 10 drilling rigs concentrating on drilling oil and gas wells throughout north Texas. Prior to 1973,
Mr. Lindsay held senior positions with an international oil and natural gas drilling and exploration company
headquartered in Tulsa, Oklahoma.
Rand Stinnett, VP and General Counsel, is a fourth-generation oil and gas professional, having focused full-time
on Barnett projects since 2000. Through various entities, Mr. Stinnett has executed a successful, disciplined
leasing strategy that has resulted in the acquisition and development of over 10,000 acres of quality mineral leases
within the Barnett in and around Wise, Denton, Montague and Tarrant Counties, Texas. Mr. Stinnett is a
commercial/business attorney and petroleum landman who has represented clients in all aspects of the oil and gas
business, including financial institutions, mineral owners, working interest owners, operators, drillers and
contractors. Since 1982, he has engaged in a general civil legal practice involving title examination, commercial
litigation, transactional work and regulatory/corporate matters, both as a sole practitioner and in association with
law firms, in Hurst and Austin, Texas. Mr. Stinnett is licensed to practice law in both Texas and Oklahoma and
holds B.S. and J.D. degrees.
Bill Williamson, VP Operations and Land, is a certified petroleum landman with over 28 years experience in the
oil and gas industry including eight years experience in operating and building oil and gas drilling rigs. In 2005,
Mr. Williamson co-founded a company to build and operate land drilling rigs, completing construction of three
drilling rigs. Prior to this from 2002, he worked for an independent drilling contractor located in Denton, Texas.
From 1998 to 2002, Mr. Williamson was VP, Land for a NASDAQ energy company responsible for all land,
acquisition and divestiture transactional contracts and agreements. Prior to 1998, Mr. Williamson provided
clients with oil and gas asset management, acquisition and divestiture services from a land and legal perspective.
Bruce I. Benn CFO and VP Finance, is a specialist in investment banking and international finance with over 25
years experience in identifying, structuring and negotiating acquisitions and investments, particularly in the
energy, mining and technology sectors. He arranges and executes public and private offerings of debt and equity
financing and oversees all aspects of public and investor relations and regulatory compliance. He was
instrumental in structuring and arranging over $500 million in debt and equity financing for a NASDAQ energy
company. He is a co-founder of a private boutique investment banking organization, where he focuses on
structuring transactions and interfacing with a select core of institutional and private investors. Mr. Benn is an
attorney and holds B.A., LLB and LLM degrees.

  Copyright © 2010 by Grass Roots Research and Distribution, Inc. All rights reserved. This report may not be reproduced.
                                                    Page 22 of 38
Grass Roots Research and Distribution, Inc.


                                                VALUATION

                                THE COHEN PRICE TARGET - $1.94
The Cohen Price TargetTM is a dynamic and logical valuation approach as it combines market-based approaches
and intrinsic value methodologies. Capital raising and cash are the life blood of any micro cap/small cap
company. Hence, the Cohen Price TargetTM includes four components, 25% equal weighted that together reflect
and are based on the Company’s ability to raise capital for growth. The four components used in our price index
are: Price-to-Earnings ratio (P/E), Cohen Price-to-Capital Employed ratio (P/CE) (Both Market based valuation
approaches), Cohen Discounted Cash Flow (DCF) method (Theoretically an Intrinsic Value based approach) and
Cohen Price Performance Index. Our formula for The Cohen Price TargetTM is shown below.

                                    Figure 17: The Cohen Price TargetTM Formula

                  Price to Earnings (P/E)                                                   in US$
                  TOPZ Earnings Per Share 2011 Avg. Forecasts                        0.13
                  Industry Average P/E Ratio                                        17.43
                  Price based on P/E Ratio                                                           2.20

                  Price to Capital Employed (P/CE)                                          in US$
                  TOPZ Capital Employed                                              0.36
                  Industry Average P/CE Ratio                                        6.47
                  Price based on P/CE Ratio                                                          2.35

                  Cohen Discounted Cash Flow Model                                          in US$
                  Cohen DCF Value Base Case                                                          2.12

                  Cohen Performance Index                                                   in US$
                  Cohen Price Performance Index Value                               98.2%
                  TOPZ Current Stock Price                                           0.55
                  Price based on Cohen Performance Index                                             1.09

                  Cohen Price Index Target                                                           1.94

                  Current Price                                                                      0.55

                  Upside/ (Downside) Potential                                                   252.3%


  Copyright © 2010 by Grass Roots Research and Distribution, Inc. All rights reserved. This report may not be reproduced.
                                                    Page 23 of 38
Grass Roots Research and Distribution, Inc.

                                       Figure 18: Cohen Discounted Cash FlowTM

               Range of Target Price vs. Long Term Growth Rates


                             in US $


                                                                Range of Long Term Growth Rates


                        ’–‹‹•–‹… ƒ•‡
                         ƒ•‡ ƒ•‡
                        ‡••‹‹•–‹… ƒ•‡


               Range Target Price vs. Cost of Equity
                             in US $


                                                                            Range of Cost of Capital


                        ’–‹‹•–‹… ƒ•‡
                         ƒ•‡ ƒ•‡
                        ‡••‹‹•–‹… ƒ•‡


Copyright © 2010 by Grass Roots Research and Distribution, Inc. All rights reserved. This report may not be reproduced.
                                                  Page 24 of 38
Grass Roots Research and Distribution, Inc.


                                   LATEST PRESS RELEASE
Source: Topaz Resources, Inc.
September 22, 2010 4:00 PM ET


Topaz Resources Signs Definitive Agreement With RMJ
Topaz Resources, Inc. (OTCBB: TOPZ) today announced that it has signed a Definitive Agreement with RMJ,
Inc. to partner in a Multi-Well Development Program. Under this Program, Topaz and RMJ are now negotiating
participation by RMJ in the Barnett Shale well recently drilled by Topaz in the oil leg of the Barnett Shale
formation in North Texas, which Topaz currently is preparing to complete.

We are very impressed at how quickly RMJ has been able to complete their part of this transaction, commented
Ted Munden, CEO of Topaz Resources, and we look forward to partnering with RMJ in our current Barnett
Shale well and in the next series of wells that we have planned in the near future.

About RMJ

RMJ is a private independent oil and gas (EP) company engaged in the exploration, development and
production of oil and gas in Texas, Oklahoma and California.

About Topaz Resources

Topaz Resources is an independent oil and gas company focusing on production, acquisitions and developmental
drilling opportunities within proven producing areas of north, central and west Texas. The Company's website can
be found at www.topazresourcesinc.com.


  Copyright © 2010 by Grass Roots Research and Distribution, Inc. All rights reserved. This report may not be reproduced.
                                                    Page 25 of 38
Grass Roots Research and Distribution, Inc.


                                               CONCLUSION
Topaz is one of the most exciting junior oil and gas exploration and production companies. The Company is
transforming itself from a start-up stage to a development stage oil and gas Company. Topaz’s objective is to
increase and enhance shareholder value, through possible monetization via sale of Topaz assets or of individual
properties. Topaz plans to aggressively pursue its well drilling program to expedite growth and become cash flow
positive. The Company is focused on executing its strategy of leveraging its strengths to acquire additional
acreages and production within its area of operation, and to enhance this acreage through drilling and well work-
overs using modern technology. Also, Company’s Partner Program whereby it utilizes its infrastructure, resources
and expertise to to partner with asset owners shall result in positive cash flows for Topaz. Topaz’s experienced
management team represents a strength and advantage necessary to execute this strategy.
The Barnett Shale Belt is turning out to be America’s most attractive oil and gas drilling location. Billions of
dollars are likely to be invested in this area. We believe that continued industry growth through the development
and exploration of conventional domestic oil and gas reserves will provide essential near-term growth drivers.
The Company plans to grow organically by raising and utilizing the funding it needs to begin its well
development program and acquire additional leases at its lucrative projects. The Company’s business model is
scalable and is able to accommodate larger capital infusions with correspondingly larger returns in dollar terms.
We expect significant growth potential from TOPZ’s prolific gas leases in the Barnett Area in the immediate to
medium term. Revenues are expected to grow from $0.3 million for Fiscal Year End (FYE) December 31, 2010 to
more than $175.9 million by FYE 2016. Note: our projections assume that the Company will be able to achieve
our forecasted targets provided if raises a total of $30.0 million funding.
We believe the Company’s focus in the attractive North-West-Central Texas Area together with the experience
and proven track record of its management team will provide enhanced returns on investment. The Company
intends to become an intermediate level oil and gas producer in the next few years. The stock is an attractive short
term trade and long term buy provided funds are raised.
RS/Cohen Independent Research Group


  Copyright © 2010 by Grass Roots Research and Distribution, Inc. All rights reserved. This report may not be reproduced.
                                                    Page 26 of 38
Grass Roots Research and Distribution, Inc.


                                   HISTORICAL HEADLINES
Topaz Resources Commences Drilling Program in Barnett
Jun 22, 2010 - Market Wire
Topaz Resources, Inc. (OTCBB: TOPZ), an independent oil and gas company (Topaz or the Company), today
announced that it has commenced its next drilling program in the Barnett shale formation in North Texas.

According to Topaz Resources, Natural Gas Is Key to Reducing...
Jun 21, 2010 - Market Wire
Topaz Resources, Inc. (OTCBB: TOPZ), an independent oil and gas company (Topaz or the Company), today
commented that natural gas is key to reducing U.S. dependence on oil. This is the foundation of the Topaz
strategy of expanding and developing its growing natural gas reserves in the Barnett shale, which has become one
of the biggest natural gas plays and drilling booms in the continental United States and the largest producing gas
field in Texas.

Topaz Resources Outlines Objectives for 2010
Jun 18, 2010 - Market Wire
Topaz Resources, Inc. (OTCBB: TOPZ), an independent oil and gas company (Topaz or the Company), today
issued a corporate update to provide its shareholders with insight into a series of fundamental developments
occurring at the Company in 2010. In a formal statement, Ted Munden, the Chief Executive Officer of Topaz,
stated.

Current  Forecasted Natural Prices Reinforce Topaz Strategy
Jun 16, 2010 - Market Wire
Topaz Resources, Inc. (OTCBB: TOPZ), an independent oil and gas company (Topaz or the Company), today
commented that current and forecasted prices of natural gas are providing significant reinforcement to the Topaz
acquisition and development strategy.

Topaz Resources Confirms Strategic Areas of Interest
Jun 8, 2010 - Market Wire
Topaz Resources, Inc. (OTCBB: TOPZ), an independent oil and gas company (Topaz or the Company), today
confirmed that it is targeting its operations and growth in the established, proved producing areas of north, central
and west Texas.

Topaz Resources Introduces Operations Capability
Jun 2, 2010 - Market Wire
Topaz Resources, Inc. (OTCBB: TOPZ), an independent oil and gas company (Topaz or the Company), today
introduced its team of 57 administrative and operations personnel.

Topaz Resources Announces Appointment of General Counsel
Jun 1, 2010 - Market Wire
Topaz Resources, Inc. (OTCBB: TOPZ), an independent oil and gas company (Topaz or the Company), today
announced that the Company's Board of Directors has named Rand Stinnett, 52, as Vice President and General
Counsel.


  Copyright © 2010 by Grass Roots Research and Distribution, Inc. All rights reserved. This report may not be reproduced.
                                                    Page 27 of 38
Grass Roots Research and Distribution, Inc.


                                                  APPENDIX
                                            The Cohen Price Target
The Cohen Price TargetTM is derived using a combination of academic and market-based valuation approaches.
The following four equal weighted (25%) components used in calculating our target price, include the assumption
of capital raised:

   1. The first 25% equal weighted component: is the market multiple based valuation methodology. This
      method uses the industry average 2011E Price-to-Earnings ratio to calculate the potential stock price
      (and/or price to Book if an asset based company). We take the average Price-to-Earnings multiple of a
      given industry. This means that, on an average, stocks in this industry should currently trade at a multiple
      times their 2011 expected earnings. These earnings are usually only generated by a small company
      raising cash to meet its master budget. The index, therefore, reflects capital invested in any micro/small
      cap company.
   2. The second 25% equal weighted component: Cohen Capital Employed based valuation. Most start-up and
      micro/small cap companies require significant capital to meet our projections. Our Cohen Price TargetTM
      reflects the Company’s ability to raise additional capital. Based on our capital projection and long-term
      price target from our Cohen DCFTM valuation model, we derive a Price-to-Capital Employed ratio. We
      then multiply this ratio with our capital employed per share assumption to derive this target price.
   3. Our third 25% equal weighted component is our use of the Cohen Price Performance IndexTM, which
      calculates the average price increase of all the stocks covered by Grass Roots Research and Distribution
      Inc. and Cohen Research after their release. Currently, for the period ending September 30, 2010 the
      Cohen Price Performance IndexTM is up by 98.2%, meaning that we expect the stock to follow the same
      trend and rise by 98.2%. To date, since May 2009, 97.6% of all of our stocks post report release have
      traded above the price of our initiate coverage report within 26 days. The Index assumes that all of its
      companies had capital employed in each company. In general, almost 100% of our researched stocks
      went up close to 100%.
   4. Our fourth 25% equal weighted component is our Cohen Discounted Cash Flow (DCF) method of
      valuation. Our Cohen DCFTM valuation includes a complex trademarked formula proprietary to our firm,
      which includes an assumed long-term sustainable growth rate, cost of capital and assumed capital
      invested in a given company. Our DCF price target values a company today, based on projections of how
      much future cash will be generated from a given company. We assume that a company is worth all of the
      cash it can make available to investors in the future. It is called 'discounted' cash flow because cash in the
      future is worth less than cash today, and therefore must be discounted to today. We forecast various line
      items including assuming a given amount of capital is raised, to calculate the free cash flow we project a
      company to generate during our 5 year forecasted time period. If a company does not raise our estimated
      cash requirements, it is highly unlikely to reach our forecasts and can go out of business. After using a
      formula to discount free cash flow, we divide the total forecasted equity of the company by the shares of
      stock outstanding to calculate our Cohen DCFTM valuation, or theoretical price per share target. We
      believe the Cohen DCFTM formula is a more accurate measurement of operating cash than the traditional
      DCF used by most Wall Street research analysts. A DCF, or 5 year forecasted free cash flow projection,
      cannot be calculated without forecasting the three statements (IS,BS,CF) for 5 years. We are the only

  Copyright © 2010 by Grass Roots Research and Distribution, Inc. All rights reserved. This report may not be reproduced.
                                                    Page 28 of 38
Grass Roots Research and Distribution, Inc.

        firm in the investor awareness industry that forecasts all of our companies for 5 years in three assumed
        cases. We believe this in depth level of securities analysis is a must for all of our companies, and is a
        foundation of the Cohen Research MethodTM.


Capital raising and cash are the life blood of any micro cap/small company. Our Cohen Price TargetTM includes 4
components, 25% equal weighted, that together reflect capital is raised in our client companies. Our components
are trademarked and proprietary to our firm, as is the Cohen Performance IndexTM.

Most micro/small cap companies have difficulty raising sufficient funds to reach our theoretical forecasts; hence
there is considerable risk for any investor. While we do not give investment advice, any company that cannot
raise adequate capital to finance its business model is a highly risky investment, short term or long
term. Investment awareness campaigns also affect our price targets. Do not rely on our price targets because they
are based on academic theory. Do your own research or consult with your investment professional.

Price Targets

Price targets can be heavily influenced by investor awareness campaigns. In general, we observe the more money
spent on such campaigns, the greater the probability for short term price increases post report release. Our price
targets normally assume capital raising and forecast 5 year Income Statement, Balance Sheet and Cash Flow
statements. In a perfect world, these assumptions may be realized. We do not give investment advice. However,
in the practical/real world, it is very difficult for a small company to raise adequate capital to reach our theoretical
5 year projections. We are not aware of any research firm that forecasts the three statements (IS, BS, CF) in 3
cases for 5 years to reach our price targets. We believe our price targets are unique to the body of knowledge in
the field of securities analysis.

The Penny Stock Market is primarily a short term trader’s market. Our reports often times recommend client
companies as short term trades, and long term investments only if an investor believes a company will raise the
required capital to meet our valuation and price targets. Our statistics indicate that short term price increases
regularly occur after release of our initiate coverage reports. Thereafter, we note that of the majority our stock
recommendations go down significantly due to profit taking. Our Disclaimer advises our readers to do their own
research outside and separate from our commercial advertisements. Do not rely on our price targets as they are
academic theory.

Note: How we calculate our Price Targets

We further explain our Cohen DCF, which is an important 25% component of The Cohen Price Target. The
Cohen Discounted Cash Flow Analysis (DCF) creates a price target and values a company today, based on
projections of how much future cash will be generated from a Company. Our DCF analysis assumes that a
Company is worth all of the cash that it can make available to investors in the future. It is called discounted cash
flow because cash in the future is worth less than cash today, and therefore must be discounted to today. We
forecast various line items including assuming capital is raised, to calculate the free cash flow we expect a
company to generate during our 5 year forecasted time period. After using a formula to discount free cash flow,
we divide the total forecasted equity of the Company by the shares of stock outstanding to calculate our Cohen
DCF (Discounted Cash Flow) valuation, or theoretical price per share target. We believe our Cohen DCF is a


  Copyright © 2010 by Grass Roots Research and Distribution, Inc. All rights reserved. This report may not be reproduced.
                                                    Page 29 of 38
Grass Roots Research and Distribution, Inc.

more accurate method of calculating operating cash. We forecast three assumed price targets because companies
change during 5 years, Base Case, Optimistic Case, and Pessimistic Case.

Note: What is our formula used to calculate our DCF, the Cohen Price Target?

Some line items include free cash flow to the firm, the weighted average cost of capital, assumption of capital
raised and capital spent, and the total enterprise value of the business less its debt, total equity value, total shares
outstanding, and our projected price per share. A DCF cannot be academically calculated without projecting the 5
year cash flow statement.


Risks of the Cohen Price Target

Our Price Targets assume capital will be raised in our four components, or 100% of the Cohen Price Target. The
majority of micro cap/small cap companies need capital to reach our 5 year sales and cash flow projections. In
the academic world, The Gordon Growth Model justifies an analyst's decision to forecast for 5 years. We
forecast the three statements for 5 years in 3 cases. However, in the practical/real world, buying a micro cap stock
based on 5 year forecasting is highly risky.

If smaller companies are able to raise capital, our theoretical price targets in a perfect world might be justified,
providing the Company executes on its business model. If an investor believes that a given Company cannot raise
the necessary capital to reach our projections, then any investment becomes highly risky.

The investor should consider the possibilities of a given company being able to raise capital and execute over 5
years. Few micro/small cap companies are able to raise enough capital and execute over an extended period of
time, primarily due to competition, management competence, access to capital, and execution of their master
budget. Our price targets are academic theory and should not be relied upon. Investors should do their own
research and consult with their financial consultants.


                           Oil and Natural Gas Measurement Abbreviations


  Copyright © 2010 by Grass Roots Research and Distribution, Inc. All rights reserved. This report may not be reproduced.
                                                    Page 30 of 38
Grass Roots Research and Distribution, Inc.


                                            FINANCIAL EXHIBITS
                                            Income Statement – Base Case
all figures in $ 'millions                  2010 F      2011 F     2012 F     2013 F      2014 F       2015 F       2016 F
Net Revenues                                     0.3         6.8       20.4       46.2        78.5        125.5        175.9

Cost of Production                               0.0         0.7        2.1        4.6         7.8         12.5         17.6
Gross Profit                                     0.3         6.1       18.3       41.6        70.6        112.9        158.4

Total Operating Costs
Operating Profit/ EBITDA                         0.3         5.8       17.5       39.8        67.5        107.9        151.3

 ‡’”‡…‹ƒ–‹‘ ƒ† ‘”–‹œƒ–‹‘
Earnings Before Interest and Tax/ EBIT          (0.8)        3.6       14.7       35.4        60.7         97.4        135.5
–‡”‡•– š’‡•‡ ‡–
Earnings Before Tax/ EBT                        (0.8)        2.8       13.9       34.7        60.2         96.9        135.9

ƒšƒ–‹‘ š’‡•‡      ‡‡ˆ‹–
Net Profit/Loss for the period                  (0.6)        2.3       11.1       27.8        48.2         77.5          95.2

Šƒ”‡• —–•–ƒ†‹‰     ƒ•‹…
Šƒ”‡• —–•–ƒ†‹‰     ‹Ž—–‡†

     ƒ•‹…
     ‹Ž—–‡†


                                              Balance Sheet – Base Case
all figures in $ 'millions                  2010 F      2011 F     2012 F     2013 F      2014 F       2015 F       2016 F
ASSETS
 ƒ•Š ƒ† ƒ•Š “—‹˜ƒŽ‡–•
  ……‘—–• ‡…‡‹˜ƒ„Ž‡
˜‡–‘”›
–Š‡” ••‡–•
Total Current Assets                             0.4         2.0        5.0       11.5        28.3         56.4          84.6

”‘’‡”–› Žƒ– ƒ† “—‹’‡– 
”‘••
  ƒ’‹–ƒŽ š’‡†‹–—”‡
  ‡’”‡…‹ƒ–‹‘ ˆ‘” –Š‡ ›‡ƒ”
  ……——Žƒ–‡† ‡’”‡…‹ƒ–‹‘
”‘’‡”–› Žƒ– ƒ† “—‹’‡– ‡–
–Š‡” ••‡–•
Total Assets                                    15.0        32.0       43.3       70.5       118.2        195.8        291.1

LIABILITIES
 ……‘—–• ƒ›ƒ„Ž‡
–Š‡” —””‡– ‹ƒ„
 —””‡– ’‘”–‹‘ ‘ˆ  ‡„–
Total Current Liabilities                        0.4         0.1        1.4        1.7         2.1           2.8          3.6

‘‰ –‡” ‘ƒ
Total Liabilities                                0.4         7.6        7.9        7.2         6.8           6.9          7.0

 ‘‘ –‘…
 ‘–”‹„—–‡† —”’Ž—•
‡–ƒ‹‡† ƒ”‹‰•
Total Shareholders Equity                       14.6        24.3       35.5       63.2       111.4        188.9        284.1
Total Liabilities, Shareholders Equity, M       15.0        32.0       43.3       70.5       118.2        195.8        291.1


  Copyright © 2010 by Grass Roots Research and Distribution, Inc. All rights reserved. This report may not be reproduced.
                                                    Page 31 of 38
Grass Roots Research and Distribution, Inc.

                                             Cash Flow Statement – Base Case
all figures in $ 'millions                      2010 F      2011 F      2012 F      2013 F      2014 F       2015 F       2016 F
Operating Activity
‡–
…‘‡

Adjustments to Reconcile Cash Flows
Depreciation and Amortization
Other Adjustments
Changes in operating assets and liabilities:
Accounts receivable
Inventory
Other assets
Accounts payable
Other liabilities
 Šƒ‰‡ ‹ ‘”‹‰ ƒ’‹–ƒŽ
Cash Flow from Operating Activities                  0.7         2.6        11.4        30.1        50.6         81.7        104.1

Investing Activity
 š’‡†‹–—”‡• ˆ‘” ’”‘’‡”–› ’Žƒ– ƒ† ‡“—‹’
–Š‡” ‘‰ –‡” ƒ••‡–•
Cash Flow from Investing Activities                (15.6)      (17.5)      (11.2)      (25.1)      (37.7)        (60.0)       (83.0)

Financing Activity
Proceeds from or repayment of debt
Proceeds from issuance of common stock
Cash Flow from Financing Activities                 15.2        15.0                    (1.1)        (0.9)        (0.8)        (0.7)

Net Change in Cash                                   0.3         0.0         0.2         4.0        11.9         20.9          20.5
Opening Cash Balance                                             0.3         0.3         0.5         4.5         16.4          37.3
Ending Cash Balance                                  0.3         0.3         0.5         4.5        16.4         37.3          57.8


                                               Income Statement – Optimistic Case
all figures in $ 'millions                      2010 F      2011 F      2012 F      2013 F      2014 F       2015 F       2016 F
Net Revenues                                         0.3         6.8        20.7        47.6        81.9        132.9        189.0

Cost of Production                                   0.0         0.7         2.1         4.8         8.2         13.3         18.9
Gross Profit                                         0.3         6.1        18.5        42.8        73.8        119.6        170.2

Total Operating Costs
Operating Profit/ EBITDA                             0.3         5.8        17.7        40.9        70.5        114.3        162.6

 ‡’”‡…‹ƒ–‹‘ ƒ† ‘”–‹œƒ–‹‘
Earnings Before Interest and Tax/ EBIT              (0.8)        4.4        15.6        37.2        64.3        104.1        146.7

Mais conteúdo relacionado

Mais procurados

hess Annual Reports 2006
hess Annual Reports 2006hess Annual Reports 2006
hess Annual Reports 2006finance8
 
ARC Resources - December 2012 Investor Presentation
ARC Resources - December 2012 Investor PresentationARC Resources - December 2012 Investor Presentation
ARC Resources - December 2012 Investor PresentationARC Resources
 
PVA Barclays Investor Presentation
PVA Barclays Investor PresentationPVA Barclays Investor Presentation
PVA Barclays Investor PresentationPennVirginiaCorp
 
Aberdeen International - Corporate Presentation
Aberdeen International - Corporate PresentationAberdeen International - Corporate Presentation
Aberdeen International - Corporate PresentationAberdeen International
 
New opportunities for driving growth in Mozambique coal
New opportunities for driving growth in Mozambique coalNew opportunities for driving growth in Mozambique coal
New opportunities for driving growth in Mozambique coalAnglo American
 
terex Baird111208
terex Baird111208terex Baird111208
terex Baird111208finance42
 
Cairn India Event Update 25 03 10
Cairn India  Event Update   25 03 10Cairn India  Event Update   25 03 10
Cairn India Event Update 25 03 10Angel Broking
 
Champion Minerals Corporate Presentation Sept 2011
Champion Minerals Corporate Presentation Sept 2011Champion Minerals Corporate Presentation Sept 2011
Champion Minerals Corporate Presentation Sept 2011shosein2011
 
Arp2012 ipaany conferencepresentation
Arp2012 ipaany conferencepresentationArp2012 ipaany conferencepresentation
Arp2012 ipaany conferencepresentationCompany Spotlight
 
Dahlman Rose Global Metals Mining and Materials Conference
Dahlman Rose Global Metals Mining and Materials ConferenceDahlman Rose Global Metals Mining and Materials Conference
Dahlman Rose Global Metals Mining and Materials ConferenceNewmont Mining Corporation
 
2011 Investor Presentation
2011 Investor Presentation2011 Investor Presentation
2011 Investor PresentationPennVirginiaCorp
 
Relevant Fact – Swift & Co. Update
Relevant Fact – Swift & Co. UpdateRelevant Fact – Swift & Co. Update
Relevant Fact – Swift & Co. UpdateJBS RI
 
PA Resources Interim Report Q1 2011 Presentation
PA Resources Interim Report Q1 2011 PresentationPA Resources Interim Report Q1 2011 Presentation
PA Resources Interim Report Q1 2011 PresentationPA Resources AB
 
terex Gabelli120408
terex Gabelli120408terex Gabelli120408
terex Gabelli120408finance42
 

Mais procurados (17)

hess Annual Reports 2006
hess Annual Reports 2006hess Annual Reports 2006
hess Annual Reports 2006
 
ARC Resources - December 2012 Investor Presentation
ARC Resources - December 2012 Investor PresentationARC Resources - December 2012 Investor Presentation
ARC Resources - December 2012 Investor Presentation
 
PVA Barclays Investor Presentation
PVA Barclays Investor PresentationPVA Barclays Investor Presentation
PVA Barclays Investor Presentation
 
Aberdeen International - Corporate Presentation
Aberdeen International - Corporate PresentationAberdeen International - Corporate Presentation
Aberdeen International - Corporate Presentation
 
New opportunities for driving growth in Mozambique coal
New opportunities for driving growth in Mozambique coalNew opportunities for driving growth in Mozambique coal
New opportunities for driving growth in Mozambique coal
 
First Half 2012, Asia Pacific TPI Index
First Half 2012, Asia Pacific TPI IndexFirst Half 2012, Asia Pacific TPI Index
First Half 2012, Asia Pacific TPI Index
 
terex Baird111208
terex Baird111208terex Baird111208
terex Baird111208
 
Cairn India Event Update 25 03 10
Cairn India  Event Update   25 03 10Cairn India  Event Update   25 03 10
Cairn India Event Update 25 03 10
 
Champion Minerals Corporate Presentation Sept 2011
Champion Minerals Corporate Presentation Sept 2011Champion Minerals Corporate Presentation Sept 2011
Champion Minerals Corporate Presentation Sept 2011
 
Arp2012 ipaany conferencepresentation
Arp2012 ipaany conferencepresentationArp2012 ipaany conferencepresentation
Arp2012 ipaany conferencepresentation
 
Dahlman Rose Global Metals Mining and Materials Conference
Dahlman Rose Global Metals Mining and Materials ConferenceDahlman Rose Global Metals Mining and Materials Conference
Dahlman Rose Global Metals Mining and Materials Conference
 
CLIFFS DEC 2010 Investor Slide Deck
CLIFFS DEC 2010 Investor Slide DeckCLIFFS DEC 2010 Investor Slide Deck
CLIFFS DEC 2010 Investor Slide Deck
 
2011 Investor Presentation
2011 Investor Presentation2011 Investor Presentation
2011 Investor Presentation
 
Relevant Fact – Swift & Co. Update
Relevant Fact – Swift & Co. UpdateRelevant Fact – Swift & Co. Update
Relevant Fact – Swift & Co. Update
 
PA Resources Interim Report Q1 2011 Presentation
PA Resources Interim Report Q1 2011 PresentationPA Resources Interim Report Q1 2011 Presentation
PA Resources Interim Report Q1 2011 Presentation
 
Investor Presentation
Investor PresentationInvestor Presentation
Investor Presentation
 
terex Gabelli120408
terex Gabelli120408terex Gabelli120408
terex Gabelli120408
 

Semelhante a Topz Report Cohen 102010

Aberdeen International Corporate Presesentation
Aberdeen International Corporate PresesentationAberdeen International Corporate Presesentation
Aberdeen International Corporate PresesentationAberdeen International
 
Aberdeen International Corporate Presesentation
Aberdeen International Corporate PresesentationAberdeen International Corporate Presesentation
Aberdeen International Corporate PresesentationAberdeen International
 
Aberdeen International Corporate Presesentation
Aberdeen International Corporate PresesentationAberdeen International Corporate Presesentation
Aberdeen International Corporate PresesentationAberdeen International
 
monsanto 09-21-05
monsanto 09-21-05monsanto 09-21-05
monsanto 09-21-05finance28
 
Chevron Upstream & Gas
Chevron Upstream & GasChevron Upstream & Gas
Chevron Upstream & Gasfinance1
 
el paso D7A9D355-197F-480A-8FF4-86834B0DD876_EP_4Q_2008_Earnings_FINAL(Color...
el paso  D7A9D355-197F-480A-8FF4-86834B0DD876_EP_4Q_2008_Earnings_FINAL(Color...el paso  D7A9D355-197F-480A-8FF4-86834B0DD876_EP_4Q_2008_Earnings_FINAL(Color...
el paso D7A9D355-197F-480A-8FF4-86834B0DD876_EP_4Q_2008_Earnings_FINAL(Color...finance49
 
Aberdeen International Corporate Presesentation
Aberdeen International Corporate PresesentationAberdeen International Corporate Presesentation
Aberdeen International Corporate PresesentationAberdeen International
 
Orchid chemicals event update-10-06-10
Orchid chemicals event update-10-06-10Orchid chemicals event update-10-06-10
Orchid chemicals event update-10-06-10Angel Broking
 
Orchid chemicals event update-10-06-10
Orchid chemicals event update-10-06-10Orchid chemicals event update-10-06-10
Orchid chemicals event update-10-06-10Angel Broking
 
Bonterra Energy Corporate Presentation
Bonterra Energy Corporate PresentationBonterra Energy Corporate Presentation
Bonterra Energy Corporate PresentationCompany Spotlight
 
Aberdeen International Corp Pres July 15
Aberdeen International Corp Pres July 15Aberdeen International Corp Pres July 15
Aberdeen International Corp Pres July 15Aberdeen International
 
el paso Intro_MacroOutlook
el paso  Intro_MacroOutlookel paso  Intro_MacroOutlook
el paso Intro_MacroOutlookfinance49
 
el paso Intro_MacroOutlook
el paso  Intro_MacroOutlookel paso  Intro_MacroOutlook
el paso Intro_MacroOutlookfinance49
 
el paso 129E17E7-B9DE-4351-A90B-947315FA05EF_EP_RayJamesDLF(Orlando)_FinalCo...
el paso  129E17E7-B9DE-4351-A90B-947315FA05EF_EP_RayJamesDLF(Orlando)_FinalCo...el paso  129E17E7-B9DE-4351-A90B-947315FA05EF_EP_RayJamesDLF(Orlando)_FinalCo...
el paso 129E17E7-B9DE-4351-A90B-947315FA05EF_EP_RayJamesDLF(Orlando)_FinalCo...finance49
 
monsanto 09-16-08b
monsanto 09-16-08bmonsanto 09-16-08b
monsanto 09-16-08bfinance28
 
Abderdeen International Corporate Presentation
Abderdeen International Corporate PresentationAbderdeen International Corporate Presentation
Abderdeen International Corporate PresentationAberdeen International
 

Semelhante a Topz Report Cohen 102010 (20)

Bp
BpBp
Bp
 
Aberdeen International Corporate Presesentation
Aberdeen International Corporate PresesentationAberdeen International Corporate Presesentation
Aberdeen International Corporate Presesentation
 
Aberdeen International Corporate Presesentation
Aberdeen International Corporate PresesentationAberdeen International Corporate Presesentation
Aberdeen International Corporate Presesentation
 
Aberdeen International Corporate Presesentation
Aberdeen International Corporate PresesentationAberdeen International Corporate Presesentation
Aberdeen International Corporate Presesentation
 
monsanto 09-21-05
monsanto 09-21-05monsanto 09-21-05
monsanto 09-21-05
 
Chevron Upstream & Gas
Chevron Upstream & GasChevron Upstream & Gas
Chevron Upstream & Gas
 
el paso D7A9D355-197F-480A-8FF4-86834B0DD876_EP_4Q_2008_Earnings_FINAL(Color...
el paso  D7A9D355-197F-480A-8FF4-86834B0DD876_EP_4Q_2008_Earnings_FINAL(Color...el paso  D7A9D355-197F-480A-8FF4-86834B0DD876_EP_4Q_2008_Earnings_FINAL(Color...
el paso D7A9D355-197F-480A-8FF4-86834B0DD876_EP_4Q_2008_Earnings_FINAL(Color...
 
el paso D7A9D355-197F-480A-8FF4-86834B0DD876_EP_4Q_2008_Earnings_FINAL(Color...
el paso  D7A9D355-197F-480A-8FF4-86834B0DD876_EP_4Q_2008_Earnings_FINAL(Color...el paso  D7A9D355-197F-480A-8FF4-86834B0DD876_EP_4Q_2008_Earnings_FINAL(Color...
el paso D7A9D355-197F-480A-8FF4-86834B0DD876_EP_4Q_2008_Earnings_FINAL(Color...
 
Aberdeen International Corporate Presesentation
Aberdeen International Corporate PresesentationAberdeen International Corporate Presesentation
Aberdeen International Corporate Presesentation
 
Orchid chemicals event update-10-06-10
Orchid chemicals event update-10-06-10Orchid chemicals event update-10-06-10
Orchid chemicals event update-10-06-10
 
Orchid chemicals event update-10-06-10
Orchid chemicals event update-10-06-10Orchid chemicals event update-10-06-10
Orchid chemicals event update-10-06-10
 
Bonterra Energy Corporate Presentation
Bonterra Energy Corporate PresentationBonterra Energy Corporate Presentation
Bonterra Energy Corporate Presentation
 
Aberdeen International Corp Pres July 15
Aberdeen International Corp Pres July 15Aberdeen International Corp Pres July 15
Aberdeen International Corp Pres July 15
 
el paso Intro_MacroOutlook
el paso  Intro_MacroOutlookel paso  Intro_MacroOutlook
el paso Intro_MacroOutlook
 
el paso Intro_MacroOutlook
el paso  Intro_MacroOutlookel paso  Intro_MacroOutlook
el paso Intro_MacroOutlook
 
el paso 129E17E7-B9DE-4351-A90B-947315FA05EF_EP_RayJamesDLF(Orlando)_FinalCo...
el paso  129E17E7-B9DE-4351-A90B-947315FA05EF_EP_RayJamesDLF(Orlando)_FinalCo...el paso  129E17E7-B9DE-4351-A90B-947315FA05EF_EP_RayJamesDLF(Orlando)_FinalCo...
el paso 129E17E7-B9DE-4351-A90B-947315FA05EF_EP_RayJamesDLF(Orlando)_FinalCo...
 
el paso 129E17E7-B9DE-4351-A90B-947315FA05EF_EP_RayJamesDLF(Orlando)_FinalCo...
el paso  129E17E7-B9DE-4351-A90B-947315FA05EF_EP_RayJamesDLF(Orlando)_FinalCo...el paso  129E17E7-B9DE-4351-A90B-947315FA05EF_EP_RayJamesDLF(Orlando)_FinalCo...
el paso 129E17E7-B9DE-4351-A90B-947315FA05EF_EP_RayJamesDLF(Orlando)_FinalCo...
 
monsanto 09-16-08b
monsanto 09-16-08bmonsanto 09-16-08b
monsanto 09-16-08b
 
Abderdeen International Corporate Presentation
Abderdeen International Corporate PresentationAbderdeen International Corporate Presentation
Abderdeen International Corporate Presentation
 
Aberdeen Corporate Presesentation
Aberdeen Corporate PresesentationAberdeen Corporate Presesentation
Aberdeen Corporate Presesentation
 

Último

The Economic History of the U.S. Lecture 17.pdf
The Economic History of the U.S. Lecture 17.pdfThe Economic History of the U.S. Lecture 17.pdf
The Economic History of the U.S. Lecture 17.pdfGale Pooley
 
Mira Road Awesome 100% Independent Call Girls NUmber-9833754194-Dahisar Inter...
Mira Road Awesome 100% Independent Call Girls NUmber-9833754194-Dahisar Inter...Mira Road Awesome 100% Independent Call Girls NUmber-9833754194-Dahisar Inter...
Mira Road Awesome 100% Independent Call Girls NUmber-9833754194-Dahisar Inter...priyasharma62062
 
06_Joeri Van Speybroek_Dell_MeetupDora&Cybersecurity.pdf
06_Joeri Van Speybroek_Dell_MeetupDora&Cybersecurity.pdf06_Joeri Van Speybroek_Dell_MeetupDora&Cybersecurity.pdf
06_Joeri Van Speybroek_Dell_MeetupDora&Cybersecurity.pdfFinTech Belgium
 
Top Rated Pune Call Girls Sinhagad Road ⟟ 6297143586 ⟟ Call Me For Genuine S...
Top Rated  Pune Call Girls Sinhagad Road ⟟ 6297143586 ⟟ Call Me For Genuine S...Top Rated  Pune Call Girls Sinhagad Road ⟟ 6297143586 ⟟ Call Me For Genuine S...
Top Rated Pune Call Girls Sinhagad Road ⟟ 6297143586 ⟟ Call Me For Genuine S...Call Girls in Nagpur High Profile
 
Top Rated Pune Call Girls Dighi ⟟ 6297143586 ⟟ Call Me For Genuine Sex Servi...
Top Rated  Pune Call Girls Dighi ⟟ 6297143586 ⟟ Call Me For Genuine Sex Servi...Top Rated  Pune Call Girls Dighi ⟟ 6297143586 ⟟ Call Me For Genuine Sex Servi...
Top Rated Pune Call Girls Dighi ⟟ 6297143586 ⟟ Call Me For Genuine Sex Servi...Call Girls in Nagpur High Profile
 
VIP Call Girl Service Andheri West ⚡ 9920725232 What It Takes To Be The Best ...
VIP Call Girl Service Andheri West ⚡ 9920725232 What It Takes To Be The Best ...VIP Call Girl Service Andheri West ⚡ 9920725232 What It Takes To Be The Best ...
VIP Call Girl Service Andheri West ⚡ 9920725232 What It Takes To Be The Best ...dipikadinghjn ( Why You Choose Us? ) Escorts
 
VIP Independent Call Girls in Mira Bhayandar 🌹 9920725232 ( Call Me ) Mumbai ...
VIP Independent Call Girls in Mira Bhayandar 🌹 9920725232 ( Call Me ) Mumbai ...VIP Independent Call Girls in Mira Bhayandar 🌹 9920725232 ( Call Me ) Mumbai ...
VIP Independent Call Girls in Mira Bhayandar 🌹 9920725232 ( Call Me ) Mumbai ...dipikadinghjn ( Why You Choose Us? ) Escorts
 
VIP Independent Call Girls in Andheri 🌹 9920725232 ( Call Me ) Mumbai Escorts...
VIP Independent Call Girls in Andheri 🌹 9920725232 ( Call Me ) Mumbai Escorts...VIP Independent Call Girls in Andheri 🌹 9920725232 ( Call Me ) Mumbai Escorts...
VIP Independent Call Girls in Andheri 🌹 9920725232 ( Call Me ) Mumbai Escorts...dipikadinghjn ( Why You Choose Us? ) Escorts
 
VIP Call Girl in Mira Road 💧 9920725232 ( Call Me ) Get A New Crush Everyday ...
VIP Call Girl in Mira Road 💧 9920725232 ( Call Me ) Get A New Crush Everyday ...VIP Call Girl in Mira Road 💧 9920725232 ( Call Me ) Get A New Crush Everyday ...
VIP Call Girl in Mira Road 💧 9920725232 ( Call Me ) Get A New Crush Everyday ...dipikadinghjn ( Why You Choose Us? ) Escorts
 
05_Annelore Lenoir_Docbyte_MeetupDora&Cybersecurity.pptx
05_Annelore Lenoir_Docbyte_MeetupDora&Cybersecurity.pptx05_Annelore Lenoir_Docbyte_MeetupDora&Cybersecurity.pptx
05_Annelore Lenoir_Docbyte_MeetupDora&Cybersecurity.pptxFinTech Belgium
 
The Economic History of the U.S. Lecture 21.pdf
The Economic History of the U.S. Lecture 21.pdfThe Economic History of the U.S. Lecture 21.pdf
The Economic History of the U.S. Lecture 21.pdfGale Pooley
 
Indore Real Estate Market Trends Report.pdf
Indore Real Estate Market Trends Report.pdfIndore Real Estate Market Trends Report.pdf
Indore Real Estate Market Trends Report.pdfSaviRakhecha1
 
The Economic History of the U.S. Lecture 19.pdf
The Economic History of the U.S. Lecture 19.pdfThe Economic History of the U.S. Lecture 19.pdf
The Economic History of the U.S. Lecture 19.pdfGale Pooley
 
Top Rated Pune Call Girls Viman Nagar ⟟ 6297143586 ⟟ Call Me For Genuine Sex...
Top Rated  Pune Call Girls Viman Nagar ⟟ 6297143586 ⟟ Call Me For Genuine Sex...Top Rated  Pune Call Girls Viman Nagar ⟟ 6297143586 ⟟ Call Me For Genuine Sex...
Top Rated Pune Call Girls Viman Nagar ⟟ 6297143586 ⟟ Call Me For Genuine Sex...Call Girls in Nagpur High Profile
 
The Economic History of the U.S. Lecture 20.pdf
The Economic History of the U.S. Lecture 20.pdfThe Economic History of the U.S. Lecture 20.pdf
The Economic History of the U.S. Lecture 20.pdfGale Pooley
 
Gurley shaw Theory of Monetary Economics.
Gurley shaw Theory of Monetary Economics.Gurley shaw Theory of Monetary Economics.
Gurley shaw Theory of Monetary Economics.Vinodha Devi
 
Booking open Available Pune Call Girls Shivane 6297143586 Call Hot Indian Gi...
Booking open Available Pune Call Girls Shivane  6297143586 Call Hot Indian Gi...Booking open Available Pune Call Girls Shivane  6297143586 Call Hot Indian Gi...
Booking open Available Pune Call Girls Shivane 6297143586 Call Hot Indian Gi...Call Girls in Nagpur High Profile
 
Stock Market Brief Deck (Under Pressure).pdf
Stock Market Brief Deck (Under Pressure).pdfStock Market Brief Deck (Under Pressure).pdf
Stock Market Brief Deck (Under Pressure).pdfMichael Silva
 

Último (20)

The Economic History of the U.S. Lecture 17.pdf
The Economic History of the U.S. Lecture 17.pdfThe Economic History of the U.S. Lecture 17.pdf
The Economic History of the U.S. Lecture 17.pdf
 
Mira Road Awesome 100% Independent Call Girls NUmber-9833754194-Dahisar Inter...
Mira Road Awesome 100% Independent Call Girls NUmber-9833754194-Dahisar Inter...Mira Road Awesome 100% Independent Call Girls NUmber-9833754194-Dahisar Inter...
Mira Road Awesome 100% Independent Call Girls NUmber-9833754194-Dahisar Inter...
 
06_Joeri Van Speybroek_Dell_MeetupDora&Cybersecurity.pdf
06_Joeri Van Speybroek_Dell_MeetupDora&Cybersecurity.pdf06_Joeri Van Speybroek_Dell_MeetupDora&Cybersecurity.pdf
06_Joeri Van Speybroek_Dell_MeetupDora&Cybersecurity.pdf
 
Top Rated Pune Call Girls Sinhagad Road ⟟ 6297143586 ⟟ Call Me For Genuine S...
Top Rated  Pune Call Girls Sinhagad Road ⟟ 6297143586 ⟟ Call Me For Genuine S...Top Rated  Pune Call Girls Sinhagad Road ⟟ 6297143586 ⟟ Call Me For Genuine S...
Top Rated Pune Call Girls Sinhagad Road ⟟ 6297143586 ⟟ Call Me For Genuine S...
 
Top Rated Pune Call Girls Dighi ⟟ 6297143586 ⟟ Call Me For Genuine Sex Servi...
Top Rated  Pune Call Girls Dighi ⟟ 6297143586 ⟟ Call Me For Genuine Sex Servi...Top Rated  Pune Call Girls Dighi ⟟ 6297143586 ⟟ Call Me For Genuine Sex Servi...
Top Rated Pune Call Girls Dighi ⟟ 6297143586 ⟟ Call Me For Genuine Sex Servi...
 
VIP Call Girl Service Andheri West ⚡ 9920725232 What It Takes To Be The Best ...
VIP Call Girl Service Andheri West ⚡ 9920725232 What It Takes To Be The Best ...VIP Call Girl Service Andheri West ⚡ 9920725232 What It Takes To Be The Best ...
VIP Call Girl Service Andheri West ⚡ 9920725232 What It Takes To Be The Best ...
 
VIP Independent Call Girls in Mira Bhayandar 🌹 9920725232 ( Call Me ) Mumbai ...
VIP Independent Call Girls in Mira Bhayandar 🌹 9920725232 ( Call Me ) Mumbai ...VIP Independent Call Girls in Mira Bhayandar 🌹 9920725232 ( Call Me ) Mumbai ...
VIP Independent Call Girls in Mira Bhayandar 🌹 9920725232 ( Call Me ) Mumbai ...
 
(INDIRA) Call Girl Mumbai Call Now 8250077686 Mumbai Escorts 24x7
(INDIRA) Call Girl Mumbai Call Now 8250077686 Mumbai Escorts 24x7(INDIRA) Call Girl Mumbai Call Now 8250077686 Mumbai Escorts 24x7
(INDIRA) Call Girl Mumbai Call Now 8250077686 Mumbai Escorts 24x7
 
VIP Independent Call Girls in Andheri 🌹 9920725232 ( Call Me ) Mumbai Escorts...
VIP Independent Call Girls in Andheri 🌹 9920725232 ( Call Me ) Mumbai Escorts...VIP Independent Call Girls in Andheri 🌹 9920725232 ( Call Me ) Mumbai Escorts...
VIP Independent Call Girls in Andheri 🌹 9920725232 ( Call Me ) Mumbai Escorts...
 
VIP Call Girl in Mira Road 💧 9920725232 ( Call Me ) Get A New Crush Everyday ...
VIP Call Girl in Mira Road 💧 9920725232 ( Call Me ) Get A New Crush Everyday ...VIP Call Girl in Mira Road 💧 9920725232 ( Call Me ) Get A New Crush Everyday ...
VIP Call Girl in Mira Road 💧 9920725232 ( Call Me ) Get A New Crush Everyday ...
 
05_Annelore Lenoir_Docbyte_MeetupDora&Cybersecurity.pptx
05_Annelore Lenoir_Docbyte_MeetupDora&Cybersecurity.pptx05_Annelore Lenoir_Docbyte_MeetupDora&Cybersecurity.pptx
05_Annelore Lenoir_Docbyte_MeetupDora&Cybersecurity.pptx
 
The Economic History of the U.S. Lecture 21.pdf
The Economic History of the U.S. Lecture 21.pdfThe Economic History of the U.S. Lecture 21.pdf
The Economic History of the U.S. Lecture 21.pdf
 
Indore Real Estate Market Trends Report.pdf
Indore Real Estate Market Trends Report.pdfIndore Real Estate Market Trends Report.pdf
Indore Real Estate Market Trends Report.pdf
 
The Economic History of the U.S. Lecture 19.pdf
The Economic History of the U.S. Lecture 19.pdfThe Economic History of the U.S. Lecture 19.pdf
The Economic History of the U.S. Lecture 19.pdf
 
Top Rated Pune Call Girls Viman Nagar ⟟ 6297143586 ⟟ Call Me For Genuine Sex...
Top Rated  Pune Call Girls Viman Nagar ⟟ 6297143586 ⟟ Call Me For Genuine Sex...Top Rated  Pune Call Girls Viman Nagar ⟟ 6297143586 ⟟ Call Me For Genuine Sex...
Top Rated Pune Call Girls Viman Nagar ⟟ 6297143586 ⟟ Call Me For Genuine Sex...
 
The Economic History of the U.S. Lecture 20.pdf
The Economic History of the U.S. Lecture 20.pdfThe Economic History of the U.S. Lecture 20.pdf
The Economic History of the U.S. Lecture 20.pdf
 
Gurley shaw Theory of Monetary Economics.
Gurley shaw Theory of Monetary Economics.Gurley shaw Theory of Monetary Economics.
Gurley shaw Theory of Monetary Economics.
 
Booking open Available Pune Call Girls Shivane 6297143586 Call Hot Indian Gi...
Booking open Available Pune Call Girls Shivane  6297143586 Call Hot Indian Gi...Booking open Available Pune Call Girls Shivane  6297143586 Call Hot Indian Gi...
Booking open Available Pune Call Girls Shivane 6297143586 Call Hot Indian Gi...
 
Stock Market Brief Deck (Under Pressure).pdf
Stock Market Brief Deck (Under Pressure).pdfStock Market Brief Deck (Under Pressure).pdf
Stock Market Brief Deck (Under Pressure).pdf
 
Call Girls in New Ashok Nagar, (delhi) call me [9953056974] escort service 24X7
Call Girls in New Ashok Nagar, (delhi) call me [9953056974] escort service 24X7Call Girls in New Ashok Nagar, (delhi) call me [9953056974] escort service 24X7
Call Girls in New Ashok Nagar, (delhi) call me [9953056974] escort service 24X7
 

Topz Report Cohen 102010

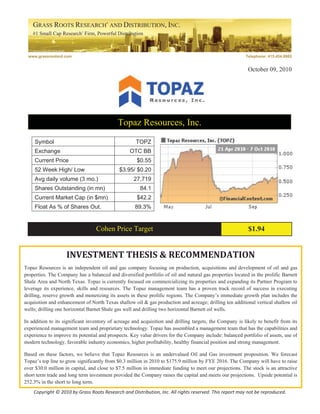
  • 1. GRASS ROOTS RESEARCH* AND DISTRIBUTION, INC. #1 Small Cap Research* Firm, Powerful Distribution * Commercial advertisement www.grassrootsrd.com Telephone: 415.454.6985 October 09, 2010 Topaz Resources, Inc. Symbol TOPZ Exchange OTC BB Current Price $0.55 52 Week High/ Low $3.95/ $0.20 Avg daily volume (3 mo.) 27,719 Shares Outstanding (in mn) 84.1 Current Market Cap (in $mn) $42.2 Float As % of Shares Out. 89.3% Cohen Price Target $1.94 INVESTMENT THESIS & RECOMMENDATION Topaz Resources is an independent oil and gas company focusing on production, acquisitions and development of oil and gas properties. The Company has a balanced and diversified portfolio of oil and natural gas properties located in the prolific Barnett Shale Area and North Texas. Topaz is currently focused on commercializing its properties and expanding its Partner Program to leverage its experience, skills and resources. The Topaz management team has a proven track record of success in executing drilling, reserve growth and monetizing its assets in these prolific regions. The Company’s immediate growth plan includes the acquisition and enhancement of North Texas shallow oil & gas production and acreage; drilling ten additional vertical shallow oil wells; drilling one horizontal Barnet Shale gas well and drilling two horizontal Barnett oil wells. In addition to its significant inventory of acreage and acquisition and drilling targets, the Company is likely to benefit from its experienced management team and proprietary technology. Topaz has assembled a management team that has the capabilities and experience to improve its potential and prospects. Key value drivers for the Company include: balanced portfolio of assets, use of modern technology, favorable industry economics, higher profitability, healthy financial position and strong management. Based on these factors, we believe that Topaz Resources is an undervalued Oil and Gas investment proposition. We forecast Topaz’s top line to grow significantly from $0.3 million in 2010 to $175.9 million by FYE 2016. The Company will have to raise over $30.0 million in capital, and close to $7.5 million in immediate funding to meet our projections. The stock is an attractive short term trade and long term investment provided the Company raises the capital and meets our projections. Upside potential is 252.3% in the short to long term. Copyright © 2010 by Grass Roots Research and Distribution, Inc. All rights reserved. This report may not be reproduced.
  • 2. Grass Roots Research and Distribution, Inc. Sales, Earnings Margin Forecast – Base Case all figures in $ 'millions; unles 2010 F 2011 F 2012 F 2013 F 2014 F 2015 F 2016 F ‡˜‡—‡• % growth 199.3% 126.6% 69.7% 59.9% 40.2%
  • 3. EBIT Margin 116.2% 99.8% 95.5% 94.6% 94.4% 95.0% ‡– ”‘ˆ‹– Net Profit Margin 33.1% 54.5% 60.1% 61.4% 61.8% 54.1% ƒ”‹‰• ‡” Šƒ”‡ ‹Ž—–‡† ”‡‡ ƒ•Š Ž‘™ –‘ ‹” Cohen Price Target Summary The Cohen Price Target is calculated by 25% equal weighting of four different valuation methodologies. We use an industry average PE, an industry average price/capital employed (P/CE), a Cohen Performance Index, and the fundamentally driven Cohen DCF. The Cohen Price TargetTM Formula Price to Earnings (P/E) in US$ TOPZ Earnings Per Share 2011 Avg. Forecasts 0.13 Industry Average P/E Ratio 17.43 Price based on P/E Ratio 2.20 Price to Capital Employed (P/CE) in US$ TOPZ Capital Employed 0.36 Industry Average P/CE Ratio 6.47 Price based on P/CE Ratio 2.35 Cohen Discounted Cash Flow Model in US$ Cohen DCF Value Base Case 2.12 Cohen Performance Index in US$ Cohen Price Performance Index Value 98.2% TOPZ Current Stock Price 0.55 Price based on Cohen Performance Index 1.09 Cohen Price Index Target 1.94 Current Price 0.55 Upside/ (Downside) Potential 252.3% Copyright © 2010 by Grass Roots Research and Distribution, Inc. All rights reserved. This report may not be reproduced. Page 2 of 38
  • 4. Grass Roots Research and Distribution, Inc. EXECUTIVE SUMMARY x Topaz Resources Inc. (OTC BB: TOPZ), headquartered in Texas, is an independent oil and gas exploration and production company. The Company’s focus is to explore and acquire acreage in the prolific North-West-Central Texas belt, especially the Barnett Shale Play. x Topaz business strategy focuses on building its strengths to acquire acreage and production within its target locations, enhance the value of its acreage through drilling and well work-overs and expanding its network through a Partner Program to leverage its expertise in the oil gas exploration and production industry. x The Company’s objective is to increase and enhance free cash flows by maximizing its proven reserve bases through acquisitions, organic growth and strategic partnerships. Management is continuously examining exciting acquisition opportunities and is focused on monetization of its assets via individual or complete asset sales. x The Company has assembled an enviable lease position with a large resource base. The Company’s total acreage in the Barnett Shale Area is spread over 2,800 gross acres and is estimated to have a resource base equivalent to 90 billion cubic feet of natural gas. x TOPZ recently reported positive results from its drilling program at its Barnett Shale well located in the oil leg of the Barnett shale. The well was drilled to a total depth of 7,740 feet, and the logs have identified a 600 foot section of Barnett Shale which includes a solid 400 foot section in the Lower Barnett with porosity and permeability values that indicate good productive capabilities. x In addition, following completion of its acquisition of shallow oil and gas properties in North Texas and through the recently launched partner program, Topaz will hold an additional 1,000 acres with an estimated reserve base of 14 billion cubic feet of natural gas equivalent. x This exciting reserve base and lease position combined with experience in drilling wells and advancing projects in the Barnett play and North-Central Texas energy provides Topaz with a strong competitive advantage. The Company is poised to fully exploit the production potential and financial upside of its project inventory. x The Company’s immediate growth plan is to make significant investment in drilling wells at its Barnett Play, expanding its network through the partner program and acquiring additional properties. Topaz plans to drill 5 new wells in 2010, commercialize production at these properties and further expand its asset base. x Declining conventional crude discoveries, increasing dependence on foreign oil, technology advancements and higher oil prices have resulted in renewed focus on abundant but difficult to explore oil and gas reserves. One of the most credible and proven sources is natural gas from the 8,000-9,000 feet depth Barnett formations. x Continuing global economic growth led by emerging markets such as China and India along with worsening geopolitics in the key oil producing areas and other economic slowdown in developed nations are likely to keep pressure on the demand-supply equation of oil and natural gas. x Risks: Capital access and competition from larger companies. Though the Company recently received debt and equity funding, Topaz will require investing $30.0 million to achieve its long term plans out of which $7.5 million would have to be raised immediately. Inabilityof a capital raise would impact growth plans. Valuations: x We project revenues of approximately $0.3 million for fiscal year end December 31, 2010 and $175.9 million by 2016. Margins are likely to expand as the Company’s assets are concentrated in low cost producing areas. We expect the Company to be cash flow positive by 2012. x The Cohen Price Target is calculated using market-based multiple valuation, Discounted Cash Flow (DCF) and by applying the Cohen Price Performance Index approach. The multiple based valuation approach uses the expected 2011 Price-to-Earnings and Price-to-Capital Employed ratio. We also include the Cohen Price Performance Index, which is representative of the past coverage performance of all stocks evaluated by us. The last component in calculating the Cohen Price Target is the value derived using the long-term Cohen Discounted Cash Flow (DCF) valuation approach. x Based on this method, TOPZ common stock is valued at $1.94 per share, 252.3% higher than current market price of $0.55. The stock is an attractive short term trade and long term buy provided funds are raised. Copyright © 2010 by Grass Roots Research and Distribution, Inc. All rights reserved. This report may not be reproduced. Page 3 of 38
  • 5. Grass Roots Research and Distribution, Inc. INVESTMENT SUMMARY Topaz Resources, Inc. (OTCBB: TOPZ), headquartered in Denton, Texas, is an independent oil and gas exploration and production Company. The Company is currently focusing its activities in the prolific belt of North-West-Central Texas. The Company’s strategy is to acquire and expand its acreages and continue the production and development of drilling opportunities within proven producing areas. The Company only selects projects that have the potential to create a secure and abundant resource base which can be profitably explored and developed. The Company currently holds acreage in the Barnett Shale play that passes through 15 counties in North-West-Central Texas; with expected acreage acquisitions in other North Texas formations, including the Strawn. The Company’s management team provides it with a significant competitive advantage which should enable it to achieve its corporate objectives: increase shareholder value, enhance cash flows and grow owned proven reserve values. The Company will achieve this by leveraging its strength and aggressively pursuing its growth strategy. The Company plans to increase and enhance cash flows through opportunistic monetization of its assets or individual properties. Figure 1: Topaz’s Corporate Strategy Focus operations within North West Central Texas where the management team has a competitive advantage Drive organic growth through internally generated projects Maximize reserve growth through exploration and drilling of existing core properties Complement this growth strategy by strategic and timely acquisitions of assets Manage costs and development schedules through operational control to achieve higher profitability Expand its network through the Partner Program that shall enable it to leverage its rigs , work crews, and other expertise. Copyright © 2010 by Grass Roots Research and Distribution, Inc. All rights reserved. This report may not be reproduced. Page 4 of 38
  • 6. Grass Roots Research and Distribution, Inc. In the current year, we expect the Company to consolidate and enhance its oil and gas properties and acquire new acreage to expand reserve base. Topaz will need to invest approximately $30.0 million to expand acreage and drill new oil and gas wells, of which the Company will need to invest approximately $7.5 million in the next 12- months. We expect long term upside revenue opportunities from the Company’s portfolio of assets, highly scalable business model, and new acquisition deals as natural gas discoveries increase in these prolific locations. The recent announcement regarding the agreement with RMJ, Inc. as a part of its Partners Program further provides positive impetus to Company’s growth plans. Our projections are based on reserve recovery of over 90 billion cubic feet of gas equivalent. However, the Company’s total probable reserve base could be much larger than this, and any additional exploration will result in further upside. Topaz Resources is one of most exciting junior oil and gas companies and provides an exciting short term and long term investment opportunity for risk adverse investors. EVOLUTION OF THE COMPANY The Topaz Group is one of the most dynamic and exciting Groups working in the prolific Barnett Shale belt. The Company has evolved into one of the most competitive players in this area through a disciplined strategy based on focusing only within prime producing formations of North-West-Central Texas and seeking financing partners to drill wells and generate proven reserves. This has enabled the Company to become a partner of choice for wells, which previously have been drilled and need specialized expertise in either completion, work-overs or other supplemental work to bring them into production or to improve production. During the last decade, the Topaz Group has assembled, drilled and sold over 10,000 Barnett lease acres totaling approximately $100 million through a number of separate drilling programs/ ventures. Management of Topaz Group through various partnerships and private entities have drilled and/or operated in over 250 wells in this region. Figure 2: Evolution of the Topaz Group 2001 03: •In 2001, the Group established its first drilling program. •Committed approximately 550acres to a privately held company that financed drilling a Krum Area, Denton total of 11 wells. •In 2003, these acres and reserves were sold to EnCana Corp. (TSX,NYSE: ECA) as part of a County larger property sale. 2002 05: •In 2002, the Topaz Group committed approximately 2,500 lease acres to another privately held company. Argyle Area, •A total of 12 Barnett wells were drilled. •In mid 2005, this production, the reserves and acreage were sold to a private company for Denton County approximately $30 million and later resold to Range Resources Corporation (NYSE:RRC). 2004 06: •In 2004, the Topaz Group acted as an operator and committed approximately 5,000 acres located to the west and southeast of the city of Denton, Texas. West and Southeast •In partnership with a private Australian finance group, a total of 16 wells were drilled •The Company sold its production, reserves and acreage to Dune Energy, Inc. for $46 of Denton City million and later sold to Pioneer Natural Resources Company (NYSE:PXD). Copyright © 2010 by Grass Roots Research and Distribution, Inc. All rights reserved. This report may not be reproduced. Page 5 of 38
  • 7. Grass Roots Research and Distribution, Inc. COMPANY STRUCTURE In order to achieve superior growth and achieve its highest level of efficiency, Topaz has grouped its assets and projects of interest into different operating segments. At times, these are operating segments or assets held in wholly owned individual limited partnerships. The key objective of using this structure is to provide operational and budgetary focus for reserve development and enhancement. In addition, it also allows the Company to act swiftly to make opportune acquisitions. The Company’s current operating structure is shown below: Figure 3: Topaz Resources’ Current Operating Structure Parent Company Topaz Resources Inc Production Barnett Current Operating and Barnett Gas Segments Leasehold Oil Project Project Acquisitions Copyright © 2010 by Grass Roots Research and Distribution, Inc. All rights reserved. This report may not be reproduced. Page 6 of 38
  • 8. Grass Roots Research and Distribution, Inc. COHEN GROWTH DRIVERS Figure 4: Cohen Growth Drivers 2010 F 2011 F 2012 F 2013 F 2014 F 2015 F 2016 F Barnett Gas Project —„‡” ‘ˆ ‡ŽŽ• ƒ• ”‘†—…–‹‘ ’‡” ‡ŽŽ ‹ …ˆ ‹Ž ”‘†—…–‹‘ ’‡” ‡ŽŽ ‹ „Ž Barnett Oil Project —„‡” ‘ˆ ‡ŽŽ• ƒ• ”‘†—…–‹‘ ’‡” ‡ŽŽ ‹ …ˆ ‹Ž ”‘†—…–‹‘ ’‡” ‡ŽŽ ‹ „Ž North Taxes Oil Plays —„‡” ‘ˆ ‡ŽŽ• ƒ• ”‘†—…–‹‘ ’‡” ‡ŽŽ ‹ …ˆ ‹Ž ”‘†—…–‹‘ ’‡” ‡ŽŽ ‹ „Ž Total Production ƒ• ‹ …ˆ ‹Ž ‹ †Ž• Price ƒ• ’‡” …ˆ % growth ‹Ž ’‡” †Ž• % growth Net Revenues (in $ millions) ƒ• ‹Ž TOTAL 0.33 6.82 20.41 46.25 78.47 125.46 175.93 Annual Revenues, Margins, Assets, Turns all figures in $ 'millions 2010 F 2011 F 2012 F 2013 F 2014 F 2015 F 2016 F ‡– ‡˜‡—‡ ’‡”ƒ–‹‰ ƒ”‰‹ ‡– ƒ”‰‹ ‹Ž—–‡†
  • 9. ”‡‡ ƒ•Š Ž‘™ ƒ•Š ƒ† “—‹˜ƒŽ‡–• ‘”‹‰ ƒ’‹–ƒŽ ‘‰ ‡” ‡„– ‘–ƒŽ ‡„– ‘–ƒŽ ••‡–• Percentage Change in Annual Revenues, Margins, Assets, Turns 2010 F 2011 F 2012 F 2013 F 2014 F 2015 F 2016 F ‡˜‡—‡• ’‡”ƒ–‹‰ ƒ”‰‹ ‡– ƒ”‰‹ ‹Ž—–‡†
  • 10. ”‡‡ ƒ•Š Ž‘™ ƒ•Š ‘”‹‰ ƒ’‹–ƒŽ ‘–ƒŽ ‡„– ‘–ƒŽ ••‡–• Copyright © 2010 by Grass Roots Research and Distribution, Inc. All rights reserved. This report may not be reproduced. Page 7 of 38
  • 11. Grass Roots Research and Distribution, Inc. The Cohen Growth Drivers Model is an intelligent road map used by many securities analysts to analyze the forecasted growth of a given company. Topaz Resources is expected to generate revenue from sale of Oil and Natural Gas. The Company expects to cater to the large and growing market for oil and natural gas to be explored from the prolific Barnett Play. Topaz is likely to aggressively expand its drilling program to commercialize oil and gas production from its owned acreages. The Company is expected to continue acquiring unique assets that fit the investment strategy of the firm. The global market for petroleum and natural gas is poised to continue with its growth momentum over the next few years. Limited new discoveries, uncertainty in major producing nations, growing demand and economic recovery will result in demand supply imbalance, in favor of suppliers, resulting in high prices. We expect significant revenues as the Company continues to bring more wells into production. Commercialization of reserves in the prolific Barnett Shale gas play during the second half of the current year will result in gross revenues of $0.3 million for FYE 2010. Going forward, the Company will not only benefit from the expansion of Barnett acreages and partnerships to drill additional wells will result in revenues of $6.8 million in FYE 2011. We expect revenues to grow thereafter to $175.9 million by FYE 2016. The key driver for this growth is continued demand for oil and gas. The Company’s assets are an intelligent mix of acceptable risk, high profit and short return in historically successful and productive regions. There are a number of established companies in the industry and the available equipment and infrastructure is excellent. As a result TOPZ is likely to ensure higher operating margins throughout our forecast period (Management Guidance). The Company plans to spend approximately $7.5 million in capital expenditures in the next 12 months and will require investing an additional $22.5 million to meet our projections (total funding requirement of $30.0 million). These expenditures will be directed toward developing existing proved and probable reserves and evaluating and acquiring new project areas. In addition to drilling new wells, Topaz is expected to invest additional funds in development of logistics and transportation infrastructure. Revenues are expected to grow rapidly as the Company commences commercial production from its wells. Margins are positive and are expected to improve from 2010 going forward. Free cash flows are forecasted to be positive in 2012 as significant investments are expected. Copyright © 2010 by Grass Roots Research and Distribution, Inc. All rights reserved. This report may not be reproduced. Page 8 of 38
  • 12. Grass Roots Research and Distribution, Inc. VALUE PROPOSITION Topaz expects to generate substantial growth in value from sale of natural gas once it commercializes production from its Barnett projects. The Company has designed an exploration program to cost effectively evaluate the leases, using superior production technologies. The Company is positioned to seek opportunities arising from the increased demand for natural gas due to demand supply imbalance and economic resurgence. Management’s ability to raise funds, acquire new reserves and exit at the right time also provides a positive impetus to the Company. Figure 5: Topaz’s Value Drivers Balanced and Excellent Attractive Diversified Asset Business Model Financial Position Base and Strategy Established Attractive Attractive Production Industry Current History Dynamics Valuation Partner Program Experienced Established Exit will enable Management Strategy expansion Team Note how the value proposition integrates significant revenues and market opportunities. Copyright © 2010 by Grass Roots Research and Distribution, Inc. All rights reserved. This report may not be reproduced. Page 9 of 38
  • 13. Grass Roots Research and Distribution, Inc. COMPANY ASSET DESCRIPTION Since its inception, Topaz Resources has assembled an exciting portfolio of assets located in Texas. Currently, the Company is actively pursuing acquisition, expansion and drilling activities in the Barnett play and North Texas. Figure 6: Overview of Company’s Assets Topaz Resources Inc. North Barnett Area Texas Barnett Gas Barnett Oil Strawn Project – Project – 950 Formation – 1,850 acres acres 1,000 acres About The Barnett Gas Project The Company owns approximately 1,850 gross acres in the natural gas heart of the Barnett play. Located in the historic core area in Wise and Denton counties and surrounded by existing production and current drilling activity, this acreage has excellent exisiting gathering systems and pipeline infrastructure. The Company plans to invest approximatly $2.75 million per well, and Topaz's strategy is to drill at least 1 horizontal well in 2010 at a depth of 8,000 to 9,000 feet and then 1 horizontal well per quarter during 2011 accelerating thereafter. Figure 7: Barnett Gas Project – Horizontal Well Copyright © 2010 by Grass Roots Research and Distribution, Inc. All rights reserved. This report may not be reproduced. Page 10 of 38
  • 14. Grass Roots Research and Distribution, Inc. It is estimated that each well holds 1.75 billion cubic feet of gas providing additional probable and possible reserves of 61.25 billion cubic feet of gas. Management expects initial production rates of 2.0 million cubic feet per day of natural gas. Topaz’s acreage in this project area easily could accommodate drilling 35 new horizontal Barnett wells. This Barnett acreage was acquired by Topaz through the 2006 farm-out agreement under which the Topaz group participated in drilling and completing sixteen wells, all of which were successful commercial wells. Six of these wells were funded and acquired by a privately held company and ten wells have been acquired by Pioneer Natural Resources Company (NYSE:PXD). About The Barnett Oil Project Topaz holds approximately 950 acres located favorably in the oil area in Montague County of the Barnett play in Texas. Due to significant improvement in completion techniques, it has been possible to explore oil from the extended Barnett into the Montague County. Topaz will need to invest $2.75 million per well. The Company plans to drill at least 2 horizontal wells in 2010 at a depth of 8,000 to 9,000 feet followed by 5 horizontal wells in 2011 accelerating thereafter. Figure 8: Location of Company’s Barnett Oil Project Management believes that these wells will typically have initial production rates of 150 bbls of oil and 275 Mcf of gas per day. Topaz will target to accommodate and drill 15 new horizontal Barnett wells with expected resources in place of 1.875 billion cubic feet of gas equivalent, further providing additional probable and possible reserves of 28.125 billion cubic feet of gas equivalent. Copyright © 2010 by Grass Roots Research and Distribution, Inc. All rights reserved. This report may not be reproduced. Page 11 of 38
  • 15. Grass Roots Research and Distribution, Inc. Management’s estimates are expected to be realistic as several new vertical wells near the Company’s acreage have successfully drilled wells with initial production rates of 100 to 200 barrels of oil per day and 200 to 350 Mcf per day. The most active player close to Company’s acreage is EOG Resources, Inc. Topaz recently reported1 the drilling and log results of its Barnett Shale oil well. The well was drilled to a total depth of 7,740 feet stopping at the top of the Viola formation. The electronic logs have identified a 600 foot section of Barnett Shale which includes a solid 400 foot section in the Lower Barnett with porosity and permeability values that indicate good productive capabilities. The logs also confirm good productive characteristics from 6,775 feet to 6,785 feet, from 6,817 feet to 6,827 feet and from 6,881 feet to 6,888 feet in the shallower Conglomerate, supporting the good oil and gas shows that were encountered during drilling through these depths. In addition, oil and gas drilling and the logs indicate a potential productive Marble Falls zone at 6,980 feet to 7,160 feet. Based on these results, Topaz set casing and cemented as a vertical well through the Barnett up to the shallower Conglomerate and Marble Falls zones. The Company is currently designing a completion program and assessing the behind pipe production and reserve potential in the Marble Falls and Conglomerate formations. Figure 9: Barnett Oil Project – Vertical Well About The North Texas Shallow Oil Gas Project In addition to aggressively expanding its presence and expediting its drilling program in the Barnett play, Topaz is also acquiring shallow oil and gas production properties with development upside in North Texas. One such anticipated property acquisition is spread across 980 acres and consists of six leases. Currently, there are 25 wells which together produce 3,000 bbls of oil and 6,000 Mcf of gas per month. The wells produce from the Strawn Sand from two producing horizons, at 3,000 feet and at 1700 feet. Wells have been drilled at 20 and 10 acre spacing with the possibility of further down spacing. There are 20 to 30 additional drill locations at both depths. Recent drilling has focused on the shallower sand horizon. At these shallower depths, the cost of drilling and completing a new well ranges from $100,000 to 1 Source: Company Press Release Copyright © 2010 by Grass Roots Research and Distribution, Inc. All rights reserved. This report may not be reproduced. Page 12 of 38
  • 16. Grass Roots Research and Distribution, Inc. $125,000 with an average initial production of 25 bbl and 50 Mcf per day. With oil prices at $80 per barrel the payback on capital can be less than six months. Topaz plans to prioritize the drilling program at this site as management believes that this property will quickly increase its monthly cash flows thereby assisting the financing of new drill programs and further acquisiitons. The Company is expected to drill at least 10 vertical wells at a depth of 1,700 feet in 2010. Copyright © 2010 by Grass Roots Research and Distribution, Inc. All rights reserved. This report may not be reproduced. Page 13 of 38
  • 17. Grass Roots Research and Distribution, Inc. COMPANY LOCATION DESCRIPTION Topaz has focused its activities and resources on expanding its presence in the North-Central-West Texas producing formations that are spread across 15 counties immediately northwest of Dallas, Texas. The Barnett Shale/Newark East Play located within these counties and today is one of the largest natural gas plays and drilling booms in the continental United States and the biggest producing gas field in Texas. Figure 10: The Barnett Shale Play The Barnett Shale is a geological formation located in the Bend Arch-Fort Worth Basin. It consists of sedimentary rocks of Mississippian age (354–323 million years ago) in Texas. Improved completion techniques have allowed operators to more than double the daily production in the Barnett since 2006 to about 4 billion cubic feet per day from the currently operating 6,000 Barnett wells. The drilling activity is intense with approximately 70 rigs running in this area operated by small operators to larger public energy companies. Based on reports by various experts, it is estimated that Barnett Shale may have the largest producible reserves of any onshore natural gas field in the United States. The Barnett Shale has a proven reserve base of 2.5 trillion cubic feet of natural gas, and additional probable reserves of 30 trillion cubic feet of natural gas resources. Recent technology developments and geological surveys have also shown reserves of oil, though in much lesser quantities, but sufficient to be commercially viable. Copyright © 2010 by Grass Roots Research and Distribution, Inc. All rights reserved. This report may not be reproduced. Page 14 of 38
  • 18. Grass Roots Research and Distribution, Inc. Figure 11: The Barnett Shale – Oil and Gas Producing Areas Barnett is the productive formation that occurs at a depth of 8,000 to 9,000 feet. Until the 1990’s, most drilling was done at formations above the Barnett, throughout Topaz’s acreages. The key hindrance that has limited the production from Barnett Shale is because this play is a tight gas reservoir, indicating that the gas cannot be easily extracted. The shale is very hard, making it virtually impossible to produce gas in commercial quantities from this formation. However, recent improvements made in hydraulic fracturing technology and horizontal drilling, coupled with the upturn in the natural gas prices have made drilling attractive in this region. Copyright © 2010 by Grass Roots Research and Distribution, Inc. All rights reserved. This report may not be reproduced. Page 15 of 38
  • 19. Grass Roots Research and Distribution, Inc. Figure 12: The Barnett Formations Copyright © 2010 by Grass Roots Research and Distribution, Inc. All rights reserved. This report may not be reproduced. Page 16 of 38
  • 20. Grass Roots Research and Distribution, Inc. BULL CASE x Total world demand for natural gas will continue to increase at an average annual rate of 1.5% to 2025. Liquid fuels are expected to rise 1.0% annually until 2030. x Increasing use for electricity generation and industrial applications will account for about 75% of the projected growth in natural gas demand until 2025. x Price-inelastic demand as most customers are unable to switch easily to an alternate fuel once they have committed to using gas for gas-fired equipment. x Topaz Resources has a strong base of assets in areas known for producing high quantity oil and gas. x The Company’s oil and gas properties are located in the prolific Barnett Shale Play. These assets are likely to provide assured funds to finance other projects to be undertaken in the future. x Partner programs will enable Topaz to leverage its rigs, workforce and other expertise in the region to increase revenues and cash flows. BEAR CASE x Factors that govern commodity prices are beyond the Company’s control. x The rise in global Oil and Gas supply might result in lower prices making exploration from Barnett Shale uneconomical. x The Company’s revenues and operating results are highly dependent upon the success of the exploratory and developmental drilling program at its various projects. x Access to substantial sums of capital. Copyright © 2010 by Grass Roots Research and Distribution, Inc. All rights reserved. This report may not be reproduced. Page 17 of 38
  • 21. Grass Roots Research and Distribution, Inc. GROWTH PLANS The Company plans to invest significant capital to expedite growth. This capital will be invested in: x Acquisition and enhancement of North Texas shallow oil gas project x Sign up with additional companies to expand its Well Partner Program with a target to at least sign-up with 5 wells. x Drilling additional vertical Strawn oil wells x Drilling three additional Barnet wells, (1 gas wells and 2 oil wells) Based on its growth plans, internal management estimates and planned acquisition and drilling activities, total proved and probable reserves could total 106 billion cubic feet of gas equivalent by year end 2010. Figure 13: Topaz Resources – Reserve Break-up Copyright © 2010 by Grass Roots Research and Distribution, Inc. All rights reserved. This report may not be reproduced. Page 18 of 38
  • 22. Grass Roots Research and Distribution, Inc. INDUSTRY OVERVIEW AND COMPETITION Economic slowdown, rising exploration, production costs, and the increasing imbalance between demand and supply are the primary drivers for the volatility in oil prices. The inability of oil companies to replace their reserves and depletion of the proven reserves are the principle reasons for ongoing supply constraints. Existing reserves are depleting due to rising energy needs of growing economies such as China, India and Brazil. OPEC does not have spare capacity to increase supply. It is also increasingly difficult for companies to find new oil fields. Iran’s nuclear standoff, civil unrest in Nigeria, nationalization of production by Venezuela, Ecuador, and Bolivia and maturing fields in the U.S. and Europe further constrain supplies. Increases in oil supply are dependent upon technological advancements or price increases in order to make undeveloped oil resources profitable. Speculative market activities are increasing the demand for oil. The limited supply of drilling and exploration equipment and the growing cost of steel and other raw materials are driving costs higher. A solution is to use previously abandoned land for profitable oil production and use new technology in order to meet the growing demand-supply imbalance. Exploration of oil sands is another important solution. Figure 14: Industry Overview Copyright © 2010 by Grass Roots Research and Distribution, Inc. All rights reserved. This report may not be reproduced. Page 19 of 38
  • 23. Grass Roots Research and Distribution, Inc. Value Drivers: Oil and Gas Industry Figure 15: Value Drivers: Oil Gas Industries led Outlook: Oil and Gas Industry Demand and Supply: Global oil demand declined in 2009 for the second consecutive year, the first time since 1983 that this has occurred. The decline bottomed out in the middle of 2009, as the world economy began to recover in the last half of the year. The global market for oil and gas is expected to tighten in 2010 and 2011 driven by the positive recovery in the global economy. Developing and under-developed economies and other countries outside the OECD are expected to lead the demand recovery. Last, the demand for oil in developed nations will also grow in response to improving economic conditions. China and India continue to lead world consumption growth. The recent cuts announced by the Organization of the Petroleum Exporting Countries (OPEC) have weakened the global market for oil. This has led to global oil and gas inventories and spare production capacity. This coupled with expectations of a continued global economic turnaround have resulted in the reinforcement of the global oil markets. Copyright © 2010 by Grass Roots Research and Distribution, Inc. All rights reserved. This report may not be reproduced. Page 20 of 38
  • 24. Grass Roots Research and Distribution, Inc. Figure 16: Energy Demand Forecasts (Source: EIA) Competition The global oil and gas industry is highly competitive. Individuals, smaller companies, and major oil and gas companies compete for attractive assets. The primary factors differentiating major companies from smaller ones are increased technical, financial and operational resources and staff. Also, for smaller companies, competition arises mainly from other companies operating in and around their acreage of operations. The 70+/- drilling rigs running in the area and over billions of dollars of investment annually into Barnett Area highlight its tremendous opportunity. Today, more than 8,000 wells have been drilled in Barnett alone within the last six years. Currently, Chesapeake Energy, Devon, EOG Resources and XTO (recently acquired by ExxonMobil) are among the major players working in Topaz Resources’ focus area in Barnett Shale Area. We believe several factors differentiate Topaz from its competitors, as discussed in the Value Driver section of our report. MANAGEMENT BIOS Top management at Topaz Resources provides a competitive advantage. Their experience in the field of Natural Gas, exploration and production includes capitalizing on industry cycles, making opportunistic acquisitions, significantly ramping-up production and identifying suitable exit opportunities bodes well for the Company. Management’s capability to source funds for acquisition in current uncertain markets provides liquidity for the Company required to stay afloat in tough commodity cycle conditions. Edward J. Munden, CEO, is a professional geological engineer with an MBA and is a co-founder of a private boutique investment banking organization that has provided and/or arranged early and mid stage venture capital and hands-on managerial assistance to a portfolio of energy, mining and technology software companies. From Copyright © 2010 by Grass Roots Research and Distribution, Inc. All rights reserved. This report may not be reproduced. Page 21 of 38
  • 25. Grass Roots Research and Distribution, Inc. 2001 to present, Mr. Munden has focused on development and financing of oil and gas leasing and drilling projects in the Barnett Shale play in north-central Texas with a strategy of accumulating a solid mineral lease position and building a strong operational capability. In 1994, Mr. Munden co-founded a Dallas based independent NASDAQ-traded public energy company engaged in the exploration, development and acquisition of oil and natural gas properties and held senior level positions including Director, Chairman, President and CEO until it was sold for over $150 million in December 2001. Mr. Munden has held positions in the energy, mining, manufacturing and technology industries for more than 30 years. Robert P. Lindsay, COO, is a second-generation oil and gas professional with over 43 years experience in the petroleum industry. He has planned and executed drilling and rework programs in Texas, Louisiana, Kentucky and New Mexico. From 2001 to present, Mr. Lindsay has focused on locating, evaluating and securing mineral leases in the Barnett Shale play in north central Texas, wherein he has drilled or participated in over 250 oil gas wells in the immediate region; has assembled, drilled and sold over 10,000 acres with dollar values approaching $100 million; and has built and sold 6 Barnett Shale drilling rigs. Prior to this, Mr. Lindsay was Chief Operating Officer of a NASDAQ energy company responsible for all administrative and operational aspects of the company’s producing and development properties. From 1973 until 1995, Mr. Lindsay managed over 200 employees and 10 drilling rigs concentrating on drilling oil and gas wells throughout north Texas. Prior to 1973, Mr. Lindsay held senior positions with an international oil and natural gas drilling and exploration company headquartered in Tulsa, Oklahoma. Rand Stinnett, VP and General Counsel, is a fourth-generation oil and gas professional, having focused full-time on Barnett projects since 2000. Through various entities, Mr. Stinnett has executed a successful, disciplined leasing strategy that has resulted in the acquisition and development of over 10,000 acres of quality mineral leases within the Barnett in and around Wise, Denton, Montague and Tarrant Counties, Texas. Mr. Stinnett is a commercial/business attorney and petroleum landman who has represented clients in all aspects of the oil and gas business, including financial institutions, mineral owners, working interest owners, operators, drillers and contractors. Since 1982, he has engaged in a general civil legal practice involving title examination, commercial litigation, transactional work and regulatory/corporate matters, both as a sole practitioner and in association with law firms, in Hurst and Austin, Texas. Mr. Stinnett is licensed to practice law in both Texas and Oklahoma and holds B.S. and J.D. degrees. Bill Williamson, VP Operations and Land, is a certified petroleum landman with over 28 years experience in the oil and gas industry including eight years experience in operating and building oil and gas drilling rigs. In 2005, Mr. Williamson co-founded a company to build and operate land drilling rigs, completing construction of three drilling rigs. Prior to this from 2002, he worked for an independent drilling contractor located in Denton, Texas. From 1998 to 2002, Mr. Williamson was VP, Land for a NASDAQ energy company responsible for all land, acquisition and divestiture transactional contracts and agreements. Prior to 1998, Mr. Williamson provided clients with oil and gas asset management, acquisition and divestiture services from a land and legal perspective. Bruce I. Benn CFO and VP Finance, is a specialist in investment banking and international finance with over 25 years experience in identifying, structuring and negotiating acquisitions and investments, particularly in the energy, mining and technology sectors. He arranges and executes public and private offerings of debt and equity financing and oversees all aspects of public and investor relations and regulatory compliance. He was instrumental in structuring and arranging over $500 million in debt and equity financing for a NASDAQ energy company. He is a co-founder of a private boutique investment banking organization, where he focuses on structuring transactions and interfacing with a select core of institutional and private investors. Mr. Benn is an attorney and holds B.A., LLB and LLM degrees. Copyright © 2010 by Grass Roots Research and Distribution, Inc. All rights reserved. This report may not be reproduced. Page 22 of 38
  • 26. Grass Roots Research and Distribution, Inc. VALUATION THE COHEN PRICE TARGET - $1.94 The Cohen Price TargetTM is a dynamic and logical valuation approach as it combines market-based approaches and intrinsic value methodologies. Capital raising and cash are the life blood of any micro cap/small cap company. Hence, the Cohen Price TargetTM includes four components, 25% equal weighted that together reflect and are based on the Company’s ability to raise capital for growth. The four components used in our price index are: Price-to-Earnings ratio (P/E), Cohen Price-to-Capital Employed ratio (P/CE) (Both Market based valuation approaches), Cohen Discounted Cash Flow (DCF) method (Theoretically an Intrinsic Value based approach) and Cohen Price Performance Index. Our formula for The Cohen Price TargetTM is shown below. Figure 17: The Cohen Price TargetTM Formula Price to Earnings (P/E) in US$ TOPZ Earnings Per Share 2011 Avg. Forecasts 0.13 Industry Average P/E Ratio 17.43 Price based on P/E Ratio 2.20 Price to Capital Employed (P/CE) in US$ TOPZ Capital Employed 0.36 Industry Average P/CE Ratio 6.47 Price based on P/CE Ratio 2.35 Cohen Discounted Cash Flow Model in US$ Cohen DCF Value Base Case 2.12 Cohen Performance Index in US$ Cohen Price Performance Index Value 98.2% TOPZ Current Stock Price 0.55 Price based on Cohen Performance Index 1.09 Cohen Price Index Target 1.94 Current Price 0.55 Upside/ (Downside) Potential 252.3% Copyright © 2010 by Grass Roots Research and Distribution, Inc. All rights reserved. This report may not be reproduced. Page 23 of 38
  • 27. Grass Roots Research and Distribution, Inc. Figure 18: Cohen Discounted Cash FlowTM Range of Target Price vs. Long Term Growth Rates in US $ Range of Long Term Growth Rates ’–‹‹•–‹… ƒ•‡ ƒ•‡ ƒ•‡ ‡••‹‹•–‹… ƒ•‡ Range Target Price vs. Cost of Equity in US $ Range of Cost of Capital ’–‹‹•–‹… ƒ•‡ ƒ•‡ ƒ•‡ ‡••‹‹•–‹… ƒ•‡ Copyright © 2010 by Grass Roots Research and Distribution, Inc. All rights reserved. This report may not be reproduced. Page 24 of 38
  • 28. Grass Roots Research and Distribution, Inc. LATEST PRESS RELEASE Source: Topaz Resources, Inc. September 22, 2010 4:00 PM ET Topaz Resources Signs Definitive Agreement With RMJ Topaz Resources, Inc. (OTCBB: TOPZ) today announced that it has signed a Definitive Agreement with RMJ, Inc. to partner in a Multi-Well Development Program. Under this Program, Topaz and RMJ are now negotiating participation by RMJ in the Barnett Shale well recently drilled by Topaz in the oil leg of the Barnett Shale formation in North Texas, which Topaz currently is preparing to complete. We are very impressed at how quickly RMJ has been able to complete their part of this transaction, commented Ted Munden, CEO of Topaz Resources, and we look forward to partnering with RMJ in our current Barnett Shale well and in the next series of wells that we have planned in the near future. About RMJ RMJ is a private independent oil and gas (EP) company engaged in the exploration, development and production of oil and gas in Texas, Oklahoma and California. About Topaz Resources Topaz Resources is an independent oil and gas company focusing on production, acquisitions and developmental drilling opportunities within proven producing areas of north, central and west Texas. The Company's website can be found at www.topazresourcesinc.com. Copyright © 2010 by Grass Roots Research and Distribution, Inc. All rights reserved. This report may not be reproduced. Page 25 of 38
  • 29. Grass Roots Research and Distribution, Inc. CONCLUSION Topaz is one of the most exciting junior oil and gas exploration and production companies. The Company is transforming itself from a start-up stage to a development stage oil and gas Company. Topaz’s objective is to increase and enhance shareholder value, through possible monetization via sale of Topaz assets or of individual properties. Topaz plans to aggressively pursue its well drilling program to expedite growth and become cash flow positive. The Company is focused on executing its strategy of leveraging its strengths to acquire additional acreages and production within its area of operation, and to enhance this acreage through drilling and well work- overs using modern technology. Also, Company’s Partner Program whereby it utilizes its infrastructure, resources and expertise to to partner with asset owners shall result in positive cash flows for Topaz. Topaz’s experienced management team represents a strength and advantage necessary to execute this strategy. The Barnett Shale Belt is turning out to be America’s most attractive oil and gas drilling location. Billions of dollars are likely to be invested in this area. We believe that continued industry growth through the development and exploration of conventional domestic oil and gas reserves will provide essential near-term growth drivers. The Company plans to grow organically by raising and utilizing the funding it needs to begin its well development program and acquire additional leases at its lucrative projects. The Company’s business model is scalable and is able to accommodate larger capital infusions with correspondingly larger returns in dollar terms. We expect significant growth potential from TOPZ’s prolific gas leases in the Barnett Area in the immediate to medium term. Revenues are expected to grow from $0.3 million for Fiscal Year End (FYE) December 31, 2010 to more than $175.9 million by FYE 2016. Note: our projections assume that the Company will be able to achieve our forecasted targets provided if raises a total of $30.0 million funding. We believe the Company’s focus in the attractive North-West-Central Texas Area together with the experience and proven track record of its management team will provide enhanced returns on investment. The Company intends to become an intermediate level oil and gas producer in the next few years. The stock is an attractive short term trade and long term buy provided funds are raised. RS/Cohen Independent Research Group Copyright © 2010 by Grass Roots Research and Distribution, Inc. All rights reserved. This report may not be reproduced. Page 26 of 38
  • 30. Grass Roots Research and Distribution, Inc. HISTORICAL HEADLINES Topaz Resources Commences Drilling Program in Barnett Jun 22, 2010 - Market Wire Topaz Resources, Inc. (OTCBB: TOPZ), an independent oil and gas company (Topaz or the Company), today announced that it has commenced its next drilling program in the Barnett shale formation in North Texas. According to Topaz Resources, Natural Gas Is Key to Reducing... Jun 21, 2010 - Market Wire Topaz Resources, Inc. (OTCBB: TOPZ), an independent oil and gas company (Topaz or the Company), today commented that natural gas is key to reducing U.S. dependence on oil. This is the foundation of the Topaz strategy of expanding and developing its growing natural gas reserves in the Barnett shale, which has become one of the biggest natural gas plays and drilling booms in the continental United States and the largest producing gas field in Texas. Topaz Resources Outlines Objectives for 2010 Jun 18, 2010 - Market Wire Topaz Resources, Inc. (OTCBB: TOPZ), an independent oil and gas company (Topaz or the Company), today issued a corporate update to provide its shareholders with insight into a series of fundamental developments occurring at the Company in 2010. In a formal statement, Ted Munden, the Chief Executive Officer of Topaz, stated. Current Forecasted Natural Prices Reinforce Topaz Strategy Jun 16, 2010 - Market Wire Topaz Resources, Inc. (OTCBB: TOPZ), an independent oil and gas company (Topaz or the Company), today commented that current and forecasted prices of natural gas are providing significant reinforcement to the Topaz acquisition and development strategy. Topaz Resources Confirms Strategic Areas of Interest Jun 8, 2010 - Market Wire Topaz Resources, Inc. (OTCBB: TOPZ), an independent oil and gas company (Topaz or the Company), today confirmed that it is targeting its operations and growth in the established, proved producing areas of north, central and west Texas. Topaz Resources Introduces Operations Capability Jun 2, 2010 - Market Wire Topaz Resources, Inc. (OTCBB: TOPZ), an independent oil and gas company (Topaz or the Company), today introduced its team of 57 administrative and operations personnel. Topaz Resources Announces Appointment of General Counsel Jun 1, 2010 - Market Wire Topaz Resources, Inc. (OTCBB: TOPZ), an independent oil and gas company (Topaz or the Company), today announced that the Company's Board of Directors has named Rand Stinnett, 52, as Vice President and General Counsel. Copyright © 2010 by Grass Roots Research and Distribution, Inc. All rights reserved. This report may not be reproduced. Page 27 of 38
  • 31. Grass Roots Research and Distribution, Inc. APPENDIX The Cohen Price Target The Cohen Price TargetTM is derived using a combination of academic and market-based valuation approaches. The following four equal weighted (25%) components used in calculating our target price, include the assumption of capital raised: 1. The first 25% equal weighted component: is the market multiple based valuation methodology. This method uses the industry average 2011E Price-to-Earnings ratio to calculate the potential stock price (and/or price to Book if an asset based company). We take the average Price-to-Earnings multiple of a given industry. This means that, on an average, stocks in this industry should currently trade at a multiple times their 2011 expected earnings. These earnings are usually only generated by a small company raising cash to meet its master budget. The index, therefore, reflects capital invested in any micro/small cap company. 2. The second 25% equal weighted component: Cohen Capital Employed based valuation. Most start-up and micro/small cap companies require significant capital to meet our projections. Our Cohen Price TargetTM reflects the Company’s ability to raise additional capital. Based on our capital projection and long-term price target from our Cohen DCFTM valuation model, we derive a Price-to-Capital Employed ratio. We then multiply this ratio with our capital employed per share assumption to derive this target price. 3. Our third 25% equal weighted component is our use of the Cohen Price Performance IndexTM, which calculates the average price increase of all the stocks covered by Grass Roots Research and Distribution Inc. and Cohen Research after their release. Currently, for the period ending September 30, 2010 the Cohen Price Performance IndexTM is up by 98.2%, meaning that we expect the stock to follow the same trend and rise by 98.2%. To date, since May 2009, 97.6% of all of our stocks post report release have traded above the price of our initiate coverage report within 26 days. The Index assumes that all of its companies had capital employed in each company. In general, almost 100% of our researched stocks went up close to 100%. 4. Our fourth 25% equal weighted component is our Cohen Discounted Cash Flow (DCF) method of valuation. Our Cohen DCFTM valuation includes a complex trademarked formula proprietary to our firm, which includes an assumed long-term sustainable growth rate, cost of capital and assumed capital invested in a given company. Our DCF price target values a company today, based on projections of how much future cash will be generated from a given company. We assume that a company is worth all of the cash it can make available to investors in the future. It is called 'discounted' cash flow because cash in the future is worth less than cash today, and therefore must be discounted to today. We forecast various line items including assuming a given amount of capital is raised, to calculate the free cash flow we project a company to generate during our 5 year forecasted time period. If a company does not raise our estimated cash requirements, it is highly unlikely to reach our forecasts and can go out of business. After using a formula to discount free cash flow, we divide the total forecasted equity of the company by the shares of stock outstanding to calculate our Cohen DCFTM valuation, or theoretical price per share target. We believe the Cohen DCFTM formula is a more accurate measurement of operating cash than the traditional DCF used by most Wall Street research analysts. A DCF, or 5 year forecasted free cash flow projection, cannot be calculated without forecasting the three statements (IS,BS,CF) for 5 years. We are the only Copyright © 2010 by Grass Roots Research and Distribution, Inc. All rights reserved. This report may not be reproduced. Page 28 of 38
  • 32. Grass Roots Research and Distribution, Inc. firm in the investor awareness industry that forecasts all of our companies for 5 years in three assumed cases. We believe this in depth level of securities analysis is a must for all of our companies, and is a foundation of the Cohen Research MethodTM. Capital raising and cash are the life blood of any micro cap/small company. Our Cohen Price TargetTM includes 4 components, 25% equal weighted, that together reflect capital is raised in our client companies. Our components are trademarked and proprietary to our firm, as is the Cohen Performance IndexTM. Most micro/small cap companies have difficulty raising sufficient funds to reach our theoretical forecasts; hence there is considerable risk for any investor. While we do not give investment advice, any company that cannot raise adequate capital to finance its business model is a highly risky investment, short term or long term. Investment awareness campaigns also affect our price targets. Do not rely on our price targets because they are based on academic theory. Do your own research or consult with your investment professional. Price Targets Price targets can be heavily influenced by investor awareness campaigns. In general, we observe the more money spent on such campaigns, the greater the probability for short term price increases post report release. Our price targets normally assume capital raising and forecast 5 year Income Statement, Balance Sheet and Cash Flow statements. In a perfect world, these assumptions may be realized. We do not give investment advice. However, in the practical/real world, it is very difficult for a small company to raise adequate capital to reach our theoretical 5 year projections. We are not aware of any research firm that forecasts the three statements (IS, BS, CF) in 3 cases for 5 years to reach our price targets. We believe our price targets are unique to the body of knowledge in the field of securities analysis. The Penny Stock Market is primarily a short term trader’s market. Our reports often times recommend client companies as short term trades, and long term investments only if an investor believes a company will raise the required capital to meet our valuation and price targets. Our statistics indicate that short term price increases regularly occur after release of our initiate coverage reports. Thereafter, we note that of the majority our stock recommendations go down significantly due to profit taking. Our Disclaimer advises our readers to do their own research outside and separate from our commercial advertisements. Do not rely on our price targets as they are academic theory. Note: How we calculate our Price Targets We further explain our Cohen DCF, which is an important 25% component of The Cohen Price Target. The Cohen Discounted Cash Flow Analysis (DCF) creates a price target and values a company today, based on projections of how much future cash will be generated from a Company. Our DCF analysis assumes that a Company is worth all of the cash that it can make available to investors in the future. It is called discounted cash flow because cash in the future is worth less than cash today, and therefore must be discounted to today. We forecast various line items including assuming capital is raised, to calculate the free cash flow we expect a company to generate during our 5 year forecasted time period. After using a formula to discount free cash flow, we divide the total forecasted equity of the Company by the shares of stock outstanding to calculate our Cohen DCF (Discounted Cash Flow) valuation, or theoretical price per share target. We believe our Cohen DCF is a Copyright © 2010 by Grass Roots Research and Distribution, Inc. All rights reserved. This report may not be reproduced. Page 29 of 38
  • 33. Grass Roots Research and Distribution, Inc. more accurate method of calculating operating cash. We forecast three assumed price targets because companies change during 5 years, Base Case, Optimistic Case, and Pessimistic Case. Note: What is our formula used to calculate our DCF, the Cohen Price Target? Some line items include free cash flow to the firm, the weighted average cost of capital, assumption of capital raised and capital spent, and the total enterprise value of the business less its debt, total equity value, total shares outstanding, and our projected price per share. A DCF cannot be academically calculated without projecting the 5 year cash flow statement. Risks of the Cohen Price Target Our Price Targets assume capital will be raised in our four components, or 100% of the Cohen Price Target. The majority of micro cap/small cap companies need capital to reach our 5 year sales and cash flow projections. In the academic world, The Gordon Growth Model justifies an analyst's decision to forecast for 5 years. We forecast the three statements for 5 years in 3 cases. However, in the practical/real world, buying a micro cap stock based on 5 year forecasting is highly risky. If smaller companies are able to raise capital, our theoretical price targets in a perfect world might be justified, providing the Company executes on its business model. If an investor believes that a given Company cannot raise the necessary capital to reach our projections, then any investment becomes highly risky. The investor should consider the possibilities of a given company being able to raise capital and execute over 5 years. Few micro/small cap companies are able to raise enough capital and execute over an extended period of time, primarily due to competition, management competence, access to capital, and execution of their master budget. Our price targets are academic theory and should not be relied upon. Investors should do their own research and consult with their financial consultants. Oil and Natural Gas Measurement Abbreviations Copyright © 2010 by Grass Roots Research and Distribution, Inc. All rights reserved. This report may not be reproduced. Page 30 of 38
  • 34. Grass Roots Research and Distribution, Inc. FINANCIAL EXHIBITS Income Statement – Base Case all figures in $ 'millions 2010 F 2011 F 2012 F 2013 F 2014 F 2015 F 2016 F Net Revenues 0.3 6.8 20.4 46.2 78.5 125.5 175.9 Cost of Production 0.0 0.7 2.1 4.6 7.8 12.5 17.6 Gross Profit 0.3 6.1 18.3 41.6 70.6 112.9 158.4 Total Operating Costs Operating Profit/ EBITDA 0.3 5.8 17.5 39.8 67.5 107.9 151.3 ‡’”‡…‹ƒ–‹‘ ƒ† ‘”–‹œƒ–‹‘ Earnings Before Interest and Tax/ EBIT (0.8) 3.6 14.7 35.4 60.7 97.4 135.5
  • 35. –‡”‡•– š’‡•‡ ‡– Earnings Before Tax/ EBT (0.8) 2.8 13.9 34.7 60.2 96.9 135.9 ƒšƒ–‹‘ š’‡•‡ ‡‡ˆ‹– Net Profit/Loss for the period (0.6) 2.3 11.1 27.8 48.2 77.5 95.2 Šƒ”‡• —–•–ƒ†‹‰ ƒ•‹… Šƒ”‡• —–•–ƒ†‹‰ ‹Ž—–‡† ƒ•‹… ‹Ž—–‡† Balance Sheet – Base Case all figures in $ 'millions 2010 F 2011 F 2012 F 2013 F 2014 F 2015 F 2016 F ASSETS ƒ•Š ƒ† ƒ•Š “—‹˜ƒŽ‡–• ……‘—–• ‡…‡‹˜ƒ„Ž‡
  • 36. ˜‡–‘”› –Š‡” ••‡–• Total Current Assets 0.4 2.0 5.0 11.5 28.3 56.4 84.6 ”‘’‡”–› Žƒ– ƒ† “—‹’‡– ”‘•• ƒ’‹–ƒŽ š’‡†‹–—”‡ ‡’”‡…‹ƒ–‹‘ ˆ‘” –Š‡ ›‡ƒ” ……——Žƒ–‡† ‡’”‡…‹ƒ–‹‘ ”‘’‡”–› Žƒ– ƒ† “—‹’‡– ‡– –Š‡” ••‡–• Total Assets 15.0 32.0 43.3 70.5 118.2 195.8 291.1 LIABILITIES ……‘—–• ƒ›ƒ„Ž‡ –Š‡” —””‡– ‹ƒ„ —””‡– ’‘”–‹‘ ‘ˆ ‡„– Total Current Liabilities 0.4 0.1 1.4 1.7 2.1 2.8 3.6 ‘‰ –‡” ‘ƒ Total Liabilities 0.4 7.6 7.9 7.2 6.8 6.9 7.0 ‘‘ –‘… ‘–”‹„—–‡† —”’Ž—• ‡–ƒ‹‡† ƒ”‹‰• Total Shareholders Equity 14.6 24.3 35.5 63.2 111.4 188.9 284.1 Total Liabilities, Shareholders Equity, M 15.0 32.0 43.3 70.5 118.2 195.8 291.1 Copyright © 2010 by Grass Roots Research and Distribution, Inc. All rights reserved. This report may not be reproduced. Page 31 of 38
  • 37. Grass Roots Research and Distribution, Inc. Cash Flow Statement – Base Case all figures in $ 'millions 2010 F 2011 F 2012 F 2013 F 2014 F 2015 F 2016 F Operating Activity ‡–
  • 38. …‘‡ Adjustments to Reconcile Cash Flows Depreciation and Amortization Other Adjustments Changes in operating assets and liabilities: Accounts receivable Inventory Other assets Accounts payable Other liabilities Šƒ‰‡ ‹ ‘”‹‰ ƒ’‹–ƒŽ Cash Flow from Operating Activities 0.7 2.6 11.4 30.1 50.6 81.7 104.1 Investing Activity š’‡†‹–—”‡• ˆ‘” ’”‘’‡”–› ’Žƒ– ƒ† ‡“—‹’ –Š‡” ‘‰ –‡” ƒ••‡–• Cash Flow from Investing Activities (15.6) (17.5) (11.2) (25.1) (37.7) (60.0) (83.0) Financing Activity Proceeds from or repayment of debt Proceeds from issuance of common stock Cash Flow from Financing Activities 15.2 15.0 (1.1) (0.9) (0.8) (0.7) Net Change in Cash 0.3 0.0 0.2 4.0 11.9 20.9 20.5 Opening Cash Balance 0.3 0.3 0.5 4.5 16.4 37.3 Ending Cash Balance 0.3 0.3 0.5 4.5 16.4 37.3 57.8 Income Statement – Optimistic Case all figures in $ 'millions 2010 F 2011 F 2012 F 2013 F 2014 F 2015 F 2016 F Net Revenues 0.3 6.8 20.7 47.6 81.9 132.9 189.0 Cost of Production 0.0 0.7 2.1 4.8 8.2 13.3 18.9 Gross Profit 0.3 6.1 18.5 42.8 73.8 119.6 170.2 Total Operating Costs Operating Profit/ EBITDA 0.3 5.8 17.7 40.9 70.5 114.3 162.6 ‡’”‡…‹ƒ–‹‘ ƒ† ‘”–‹œƒ–‹‘ Earnings Before Interest and Tax/ EBIT (0.8) 4.4 15.6 37.2 64.3 104.1 146.7
  • 39. –‡”‡•– š’‡•‡ ‡– Earnings Before Tax/ EBT (0.8) 3.7 14.8 36.5 63.7 103.7 147.1 ƒšƒ–‹‘ š’‡•‡ ‡‡ˆ‹– Net Profit/Loss for the period (0.6) 2.9 11.8 29.2 51.0 82.9 103.0 Šƒ”‡• —–•–ƒ†‹‰ ƒ•‹… Šƒ”‡• —–•–ƒ†‹‰ ‹Ž—–‡† ƒ•‹… ‹Ž—–‡† Copyright © 2010 by Grass Roots Research and Distribution, Inc. All rights reserved. This report may not be reproduced. Page 32 of 38
  • 40. Grass Roots Research and Distribution, Inc. Balance Sheet– Optimistic Case all figures in $ 'millions 2010 F 2011 F 2012 F 2013 F 2014 F 2015 F 2016 F ASSETS ƒ•Š ƒ† ƒ•Š “—‹˜ƒŽ‡–• ……‘—–• ‡…‡‹˜ƒ„Ž‡
  • 41. ˜‡–‘”› –Š‡” ••‡–• Total Current Assets 0.4 14.5 15.3 21.8 39.2 68.8 98.7 ”‘’‡”–› Žƒ– ƒ† “—‹’‡– ”‘•• ƒ’‹–ƒŽ š’‡†‹–—”‡ ‡’”‡…‹ƒ–‹‘ ˆ‘” –Š‡ ›‡ƒ” ……——Žƒ–‡† ‡’”‡…‹ƒ–‹‘ ”‘’‡”–› Žƒ– ƒ† “—‹’‡– ‡– –Š‡” ••‡–• Total Assets 15.0 32.6 44.7 73.3 124.0 207.0 310.3 LIABILITIES ……‘—–• ƒ›ƒ„Ž‡ –Š‡” —””‡– ‹ƒ„ —””‡– ’‘”–‹‘ ‘ˆ ‡„– Total Current Liabilities 0.4 0.1 1.4 1.7 2.2 2.9 3.8 ‘‰ –‡” ‘ƒ Total Liabilities 0.4 7.6 7.9 7.2 6.9 7.0 7.3 ‘‘ –‘… ‘–”‹„—–‡† —”’Ž—• ‡–ƒ‹‡† ƒ”‹‰• Total Shareholders Equity 14.6 25.0 36.9 66.1 117.1 200.0 303.0 Total Liabilities, Shareholders Equity, M 15.0 32.6 44.7 73.3 124.0 207.0 310.3 Cash Flow Statement– Optimistic Case all figures in $ 'millions 2010 F 2011 F 2012 F 2013 F 2014 F 2015 F 2016 F Operating Activity ‡–
  • 42. …‘‡ Adjustments to Reconcile Cash Flows Depreciation and Amortization Other Adjustments Changes in operating assets and liabilities: Accounts receivable Inventory Other assets Accounts payable Other liabilities Šƒ‰‡ ‹ ‘”‹‰ ƒ’‹–ƒŽ Cash Flow from Operating Activities 0.7 2.4 11.4 30.8 52.5 86.2 111.3 Investing Activity š’‡†‹–—”‡• ˆ‘” ’”‘’‡”–› ’Žƒ– ƒ† ‡“—‹’ –Š‡” ‘‰ –‡” ƒ••‡–• Cash Flow from Investing Activities (15.6) (4.9) (13.4) (25.8) (39.4) (63.6) (89.3) Financing Activity Proceeds from or repayment of debt Proceeds from issuance of common stock Cash Flow from Financing Activities 15.2 15.0 (1.1) (0.9) (0.8) (0.7) Net Change in Cash 0.3 12.5 (2.1) 3.9 12.2 21.8 21.3 Opening Cash Balance 0.3 12.7 10.7 14.6 26.8 48.6 Ending Cash Balance 0.3 12.7 10.7 14.6 26.8 48.6 69.9 Copyright © 2010 by Grass Roots Research and Distribution, Inc. All rights reserved. This report may not be reproduced. Page 33 of 38
  • 43. Grass Roots Research and Distribution, Inc. Income Statement– Pessimistic Case all figures in $ 'millions 2010 F 2011 F 2012 F 2013 F 2014 F 2015 F 2016 F Net Revenues 0.3 6.8 19.7 43.4 71.3 110.3 149.8 Cost of Production 0.0 0.7 2.0 4.3 7.1 11.0 15.0 Gross Profit 0.3 6.1 17.7 39.0 64.2 99.3 134.9 Total Operating Costs Operating Profit/ EBITDA 0.3 5.8 16.9 37.3 61.3 94.9 128.9 ‡’”‡…‹ƒ–‹‘ ƒ† ‘”–‹œƒ–‹‘ Earnings Before Interest and Tax/ EBIT (0.8) 4.4 14.8 33.7 55.6 85.9 115.3
  • 44. –‡”‡•– š’‡•‡ ‡– Earnings Before Tax/ EBT (0.8) 3.7 14.0 33.1 55.0 85.4 115.8 ƒšƒ–‹‘ š’‡•‡ ‡‡ˆ‹– Net Profit/Loss for the period (0.6) 2.9 11.2 26.5 44.0 68.3 81.0 Šƒ”‡• —–•–ƒ†‹‰ ƒ•‹… Šƒ”‡• —–•–ƒ†‹‰ ‹Ž—–‡† ƒ•‹… ‹Ž—–‡† Balance Sheet– Pessimistic Case all figures in $ 'millions 2010 F 2011 F 2012 F 2013 F 2014 F 2015 F 2016 F ASSETS ƒ•Š ƒ† ƒ•Š “—‹˜ƒŽ‡–• ……‘—–• ‡…‡‹˜ƒ„Ž‡
  • 45. ˜‡–‘”› –Š‡” ••‡–• Total Current Assets 0.4 14.5 15.2 21.2 36.3 60.9 85.1 ”‘’‡”–› Žƒ– ƒ† “—‹’‡– ”‘•• ƒ’‹–ƒŽ š’‡†‹–—”‡ ‡’”‡…‹ƒ–‹‘ ˆ‘” –Š‡ ›‡ƒ” ……——Žƒ–‡† ‡’”‡…‹ƒ–‹‘ ”‘’‡”–› Žƒ– ƒ† “—‹’‡– ‡– –Š‡” ••‡–• Total Assets 15.0 32.6 44.1 69.9 113.5 181.7 262.7 LIABILITIES ……‘—–• ƒ›ƒ„Ž‡ –Š‡” —””‡– ‹ƒ„ —””‡– ’‘”–‹‘ ‘ˆ ‡„– Total Current Liabilities 0.4 0.1 1.4 1.7 2.0 2.5 3.1 ‘‰ –‡” ‘ƒ Total Liabilities 0.4 7.6 7.8 7.2 6.7 6.6 6.6 ‘‘ –‘… ‘–”‹„—–‡† —”’Ž—• ‡–ƒ‹‡† ƒ”‹‰• Total Shareholders Equity 14.6 25.0 36.2 62.7 106.7 175.1 256.1 Total Liabilities, Shareholders Equity, M 15.0 32.6 44.1 69.9 113.5 181.7 262.7 Copyright © 2010 by Grass Roots Research and Distribution, Inc. All rights reserved. This report may not be reproduced. Page 34 of 38
  • 46. Grass Roots Research and Distribution, Inc. Cash Flow Statement– Pessimistic Case all figures in $ 'millions 2010 F 2011 F 2012 F 2013 F 2014 F 2015 F 2016 F Operating Activity ‡–
  • 47. …‘‡ Adjustments to Reconcile Cash Flows Depreciation and Amortization Other Adjustments Changes in operating assets and liabilities: Accounts receivable Inventory Other assets Accounts payable Other liabilities Šƒ‰‡ ‹ ‘”‹‰ ƒ’‹–ƒŽ Cash Flow from Operating Activities 0.7 2.4 10.9 28.2 46.0 72.1 89.2 Investing Activity š’‡†‹–—”‡• ˆ‘” ’”‘’‡”–› ’Žƒ– ƒ† ‡“—‹’ –Š‡” ‘‰ –‡” ƒ••‡–• Cash Flow from Investing Activities (15.6) (4.9) (12.8) (23.5) (34.2) (52.6) (70.4) Financing Activity Proceeds from or repayment of debt Proceeds from issuance of common stock Cash Flow from Financing Activities 15.2 15.0 (1.1) (0.9) (0.8) (0.7) Net Change in Cash 0.3 12.5 (1.9) 3.7 10.9 18.7 18.2 Opening Cash Balance 0.3 12.7 10.9 14.6 25.5 44.2 Ending Cash Balance 0.3 12.7 10.9 14.6 25.5 44.2 62.3 Copyright © 2010 by Grass Roots Research and Distribution, Inc. All rights reserved. This report may not be reproduced. Page 35 of 38
  • 48. Grass Roots Research and Distribution, Inc. Short Grass Roots Disclaimer Grass Roots Research and Distribution, Inc. (GRD) distributes research and other information purchased and compiled from outside sources and analysts. This report/release/advertisement is a commercial advertisement and is for general information purposes only. Do not base any investment decision on information in this report/release/advertisement. GRRD is not a registered Investment Advisor or a member of any association for other research providers. Under no circumstances is this report/release/advertisement to be used or considered as an offer to sell or a solicitation of any offer to buy any security or other debt instruments, or any options, futures or other derivatives related to such securities herein. All information herein is not intended to be used for investment advice. Price Targets are academic theory and should not be relied upon. The majority of these profiled companies are highly risky OTC Bulletin Board or Pink Sheet companies. All readers of this information indemnify GRD from any liability for all accessed information. GRD will not be responsible for updating any of its information in its report/release/advertisements. GRD advises recipients of all such data to be validated from the issuing company including all statistical information derived from SEC filings, from data sources or financial information and data from the issuing company contained herein. The reader should seek professional financial advice, verify all claims and do his/her own research and due diligence before investing in any securities mentioned. GRD will not be liable to any person or entity for the quality, accuracy, completeness, reliability or timeliness of information in this report/release/advertisement, or for any direct, indirect, consequential, incidental, special or punitive damages that may arise out of the use of information, products or services from any person or entity including but not limited to lost profits, loss of opportunities, trading losses, and damages that may result from any incompleteness or inaccuracy in any of GRD’s profiled companies. When paid in stock, GRD its affiliates, directors, officers, outside sources, investor awareness Groups and employees may liquidate shares at any time or hold for investment purposes. Readers are advised to review SEC periodic reports: Forms 10-Q, 10K, Form 8-K, insider reports, Forms 3, 4, 5 Schedule 13D, www.sec.gov.nasd.com, www.pinksheets.com, www.sec.gov and www.finra.com. GRD is compliant with the Can Spam Act of 2003. Investing in micro cap and small cap securities is speculative and carries a high degree of risk. Investors can lose their entire investment. The Private Securities Litigation Reform Act of 1995 provides investors a 'safe harbor' in regard to forward-looking statements. GRD cautions all investors that such forward-looking statements in this report/release/advertisement are not guarantees of future performance. Investors should understand that statements regarding future prospects may not be realized. Do not rely on our target prices. This report/release/advertisement does not have regard to the specific investment objective, financial situation, suitability, and the particular need of any specific person who may receive this report/release/advertisement. Investors should note that income from such securities, if any, may fluctuate and that each security's price or value may rise or fall substantially. Accordingly, investors may receive back less than originally invested, or lose their entire investment. Past performance is not indicative of future performance. Please click to: www.grassrootsrd.com to read the full text of this disclaimer. The Griffin Trading Company has paid $50,000 for this commercial advertisement. Full Grass Roots Disclaimer Grass Roots Research and Distribution, Inc. (GRRD) is an Investor Relations firm hired by certain companies to provide Investor Awareness services to micro cap, small cap companies and other private and public companies. GRRD is hereinafter collectively referred to as GRRD, “we” or “us” or “our. Investor Awareness programs are designed to help companies communicate their investment characteristics. GRRD is not a registered Investment Advisor or a member of any association for other research providers. GRRD distributes report/release/advertisements and other Information purchased and compiled from outside sources and analysts. These report/release/advertisement are commercial advertisements and are for general information purposes only. *When the words ‘research’, ‘research report’ and ‘report’ are used on our website and in our reports, these words mean commercial advertisements. Do not base any investment decision on information in this report. All information herein is not intended to be used for investment advice. Under no circumstances is this report/release/advertisement to be used or considered as an offer to sell or a solicitation of any offer to buy any security or other debt instruments, or any options, futures or other derivatives related to such securities herein. GRRD electronically disseminates information (the Information) on its websites, research reports, in newsletters, featured reports and email communications pertaining to issuers of securities (the Issuer or Issuers or Profiled Company or Profiled Companies). A Profiled Company's securities are most frequently quoted on the Over the Counter Bulletin Board (OTCBB) or the Pink Sheets. Certain Pink Sheet stocks may or may not have audited financial statements. GRRD and its data vendors do not warranty that such SEC filing data and other compiled data is accurate. GRRD advises recipients of all such data to be validated by the issuing company including all statistical information derived from SEC filings, from data sources or financial information and data from the issuing company contained herein. The Information is forecasted in report/release/advertisements and is primarily based on publicly available information, such as quarterly (sometimes with un-audited financial statements) and annual reports (with audited financial statements) filed with the Securities and Exchange Commission (SEC), quarterly and annual audited and/or un-audited financial reports and Information and Disclosure Statements filed with Pink Sheets, the Issuer's website and information obtained through contracted research analysts, search engines such as Yahoo Finance, Market Watch and Business Wire. GRRD does not endorse, independently verify or assert the truthfulness, validity, accuracy, completeness, or reliability of the Information disseminated by an issuing company used in any GRRD report/release/advertisement. The reader of the Information hereby indemnifies GRRD from any liability for any claimed direct, indirect, incidental, punitive, or consequential damages pertaining to the disseminated Information. The reader acknowledges that GRRD will not be liable to any person or entity for the quality, accuracy, completeness, reliability or timeliness of information in this report/release/advertisement, or for any direct, indirect, consequential, incidental, special or punitive damages that may arise out of the use of information, products or services from any person or entity including but not limited to lost profits, loss of opportunities, trading losses, and damages that may result from any incompleteness or inaccuracy in any of GRRD’s profiled companies of the disseminated Information. GRRD does not undertake any responsibility whatsoever for updating the Information contained in its prior publications. GRRD complies with current securities laws, regulations and ethical standards as related to GRRD's compliance requirements. The Information should only be used, at most, and if at all, as a starting point for Readers to conduct a thorough investigation of the Profiled Company and its securities, to consult with their financial, legal or other advisor(s) and avail themselves of filings and information that may be accessed at www.sec.gov . or www.picksheets.com or other electronic medium, including: (a) reviewing SEC periodic reports (Forms 10-Q and 10-K), reports of material events (Form 8-K), insider reports (Forms 3, 4, 5 and Schedule 13D); (b) reviewing Information and Disclosure Statements and unaudited financial reports filed with the Copyright © 2010 by Grass Roots Research and Distribution, Inc. All rights reserved. This report may not be reproduced. Page 36 of 38