Walton County Home Market Stats
•
2 gostaram•515 visualizações

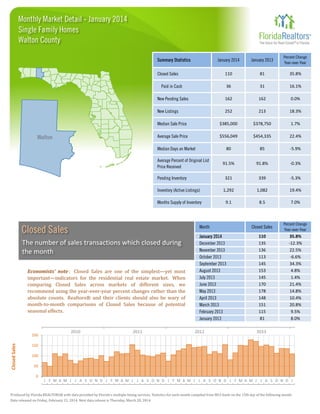
The document provides monthly real estate market statistics for Walton County for January 2014. Some key figures include: - Closed sales increased 35.8% year-over-year to 110 homes in January 2014. - Cash sales increased 16.1% year-over-year to 36 homes. - New pending sales were unchanged at 162 homes compared to January 2013. - New listings increased 18.3% year-over-year to 252 homes. - The median sale price rose 1.7% to $385,000 while the average sale price increased 22.4% to $556,049.

Recomendados
Recomendados
Mais conteúdo relacionado
Mais procurados
Mais procurados (20)
Semelhante a Walton County Home Market Stats
Semelhante a Walton County Home Market Stats (20)
Mais de Sandestin | 30a | Destin | Real Estate
Mais de Sandestin | 30a | Destin | Real Estate (12)
Último
Último (20)
Walton County Home Market Stats
- 1. Monthly Market Detail - January 2014 Single Family Homes Walton County January 2014 January 2013 Percent Change Year-over-Year 110 81 35.8% Paid in Cash 36 31 16.1% New Pending Sales 162 162 0.0% New Listings 252 213 18.3% Median Sale Price $385,000 $378,750 1.7% Average Sale Price $556,049 $454,335 22.4% 80 85 -5.9% 91.5% 91.8% -0.3% 321 339 -5.3% Inventory (Active Listings) 1,292 1,082 19.4% Months Supply of Inventory 9.1 8.5 7.0% Closed Sales Percent Change Year-over-Year 110 135 136 113 145 153 145 170 178 148 151 115 81 35.8% -12.3% 22.5% -6.6% 34.3% 4.8% 1.4% 21.4% 14.8% 10.4% 20.8% 9.5% 8.0% Summary Statistics Closed Sales Median Days on Market Average Percent of Original List Price Received Pending Inventory Month Closed Sales The number of sales transactions which closed during the month Economists' note : Closed Sales are one of the simplest—yet most important—indicators for the residential real estate market. When comparing Closed Sales across markets of different sizes, we recommend using the year-over-year percent changes rather than the absolute counts. Realtors® and their clients should also be wary of month-to-month comparisons of Closed Sales because of potential seasonal effects. Closed Sales 200 2010 2011 January 2014 December 2013 November 2013 October 2013 September 2013 August 2013 July 2013 June 2013 May 2013 April 2013 March 2013 February 2013 January 2013 2012 2013 150 100 50 0 J F M A M J J A S O N D J F M A M J J A S O N D J F M A M J J A S O N D J F M A M J J A S O N D J Produced by Florida REALTORS® with data provided by Florida's multiple listing services. Statistics for each month compiled from MLS feeds on the 15th day of the following month. Data released on Friday, February 21, 2014. Next data release is Thursday, March 20, 2014.
- 2. Monthly Market Detail - January 2014 Single Family Homes Walton County Month Cash Sales The number of Closed Sales during the month in which buyers exclusively paid in cash Economists' note : Cash Sales can be a useful indicator of the extent to which investors are participating in the market. Why? Investors are far more likely to have the funds to purchase a home available up front, whereas the typical homebuyer requires a mortgage or some other form of financing. There are, of course, many possible exceptions, so this statistic should be interpreted with care. 60 2010 2011 January 2014 December 2013 November 2013 October 2013 September 2013 August 2013 July 2013 June 2013 May 2013 April 2013 March 2013 February 2013 January 2013 2012 Cash Sales Percent Change Year-over-Year 36 49 48 42 53 43 39 43 49 49 43 43 31 16.1% 2.1% 60.0% 20.0% 60.6% 19.4% 0.0% 19.4% -5.8% 11.4% -2.3% 48.3% 29.2% 2013 Cash Sales 50 40 30 20 10 0 J F M A M J J A S O N D J F M A M J J A S O N D J F M A M J J A S O N D J F M A M J J A S O N D J Cash Sales as a Percentage of Closed Sales The percentage of Closed Sales during the month which were Cash Sales Pct. of Closed Sales Paid in Cash Economists' note : This statistic is simply another way of viewing Cash Sales. The remaining percentages of Closed Sales (i.e. those not paid fully in cash) each month involved some sort of financing, such as mortgages, owner/seller financing, assumed loans, etc. 44% 2010 2011 Month January 2014 December 2013 November 2013 October 2013 September 2013 August 2013 July 2013 June 2013 May 2013 April 2013 March 2013 February 2013 January 2013 2012 Percent of Closed Sales Paid in Cash Percent Change Year-over-Year 32.7% 36.3% 35.3% 37.2% 36.6% 28.1% 26.9% 25.3% 27.5% 33.1% 28.5% 37.4% 38.3% -14.5% 16.5% 30.6% 28.5% 19.6% 14.0% -1.4% -1.6% -17.9% 0.8% -19.1% 35.4% 19.6% 2013 39% 34% 29% 24% 19% 14% J F M A M J J A S O N D J F M A M J J A S O N D J F M A M J J A S O N D J F M A M J J A S O N D J Produced by Florida REALTORS® with data provided by Florida's multiple listing services. Statistics for each month compiled from MLS feeds on the 15th day of the following month. Data released on Friday, February 21, 2014. Next data release is Thursday, March 20, 2014.
- 3. Monthly Market Detail - January 2014 Single Family Homes Walton County Month New Pending Sales The number of property listings that went from "Active" to "Pending" status during the month Economists' note : Because of the typical length of time it takes for a sale to close, economists consider Pending Sales to be a decent indicator of potential future Closed Sales. It is important to bear in mind, however, that not all Pending Sales will be closed successfully. So, the effectiveness of Pending Sales as a future indicator of Closed Sales is susceptible to changes in market conditions such as the availability of financing for homebuyers and the inventory of distressed properties for sale. 2010 Pending Sales 250 2011 January 2014 December 2013 November 2013 October 2013 September 2013 August 2013 July 2013 June 2013 May 2013 April 2013 March 2013 February 2013 January 2013 2012 New Pending Sales Percent Change Year-over-Year 162 95 131 136 137 148 167 169 210 182 185 178 162 0.0% -4.0% 7.4% -14.5% 7.0% 11.3% 1.2% 10.5% 47.9% 13.0% 12.8% 54.8% 45.9% 2013 200 150 100 50 0 J F M A M J J A S O N D J F M A M J J A S O N D J F M A M J J A S O N D J F M A M J J A S O N D J Month New Listings The number of properties put onto the market during the month Economists' note : In a recovering market, we expect that new listings will eventually rise as sellers raise their estimations of value. But this increase will take place only after the market has turned up, so New Listings are a lagging indicator of the health of the market. Also be aware of properties which have been withdrawn from the market and then relisted. These are not really New Listings. New Listings 400 2010 2011 January 2014 December 2013 November 2013 October 2013 September 2013 August 2013 July 2013 June 2013 May 2013 April 2013 March 2013 February 2013 January 2013 2012 New Listings Percent Change Year-over-Year 252 142 221 237 209 224 186 250 244 254 279 206 213 18.3% 19.3% 26.3% 44.5% 35.7% 2.3% -4.6% 30.2% -10.0% 23.9% 11.2% 13.2% 33.1% 2013 300 200 100 0 J F M A M J J A S O N D J F M A M J J A S O N D J F M A M J J A S O N D J F M A M J J A S O N D J Produced by Florida REALTORS® with data provided by Florida's multiple listing services. Statistics for each month compiled from MLS feeds on the 15th day of the following month. Data released on Friday, February 21, 2014. Next data release is Thursday, March 20, 2014.
- 4. Monthly Market Detail - January 2014 Single Family Homes Walton County Month Median Sale Price The median sale price reported for the month (i.e. 50% of sales were above and 50% of sales were below) Economists' note : Median Sale Price is our preferred summary statistic for price activity because, unlike Average Sale Price, Median Sale Price is not sensitive to high sale prices for small numbers of homes that may not be characteristic of the market area. Median Sale Price $420K 2010 2011 January 2014 December 2013 November 2013 October 2013 September 2013 August 2013 July 2013 June 2013 May 2013 April 2013 March 2013 February 2013 January 2013 2012 Median Sale Price Percent Change Year-over-Year $385,000 $300,000 $320,000 $293,950 $319,000 $375,000 $399,900 $333,928 $352,500 $375,000 $333,853 $309,025 $378,750 1.7% -12.2% -13.5% -6.7% 1.8% 38.9% 25.0% 3.1% 11.7% 21.2% 17.5% -1.9% 48.5% 2013 $370K $320K $270K $220K J F M A M J J A S O N D J F M A M J J A S O N D J F M A M J J A S O N D J F M A M J J A S O N D J Month Average Sale Price The average sale price reported for the month (i.e. total sales in dollars divided by the number of sales) Average Sale Price Economists' note : As noted above, we prefer Median Sale Price over Average Sale Price as a summary statistic for home prices. However, Average Sale Price does have its uses—particularly when it is analyzed alongside the Median Sale Price. For one, the relative difference between the two statistics can provide some insight into the market for higher-end homes in an area. $850K 2010 2011 January 2014 December 2013 November 2013 October 2013 September 2013 August 2013 July 2013 June 2013 May 2013 April 2013 March 2013 February 2013 January 2013 2012 Average Sale Price Percent Change Year-over-Year $556,049 $484,568 $585,945 $446,643 $539,168 $590,055 $745,663 $512,408 $599,396 $605,141 $495,592 $506,412 $454,335 22.4% -9.3% 1.3% -0.9% 12.6% 45.1% 42.0% 6.0% 32.9% 18.1% 11.6% 9.2% -4.4% 2013 $750K $650K $550K $450K $350K J F M A M J J A S O N D J F M A M J J A S O N D J F M A M J J A S O N D J F M A M J J A S O N D J Produced by Florida REALTORS® with data provided by Florida's multiple listing services. Statistics for each month compiled from MLS feeds on the 15th day of the following month. Data released on Friday, February 21, 2014. Next data release is Thursday, March 20, 2014.
- 5. Monthly Market Detail - January 2014 Single Family Homes Walton County Month Median Days on Market The median number of days that properties sold during the month were on the market Economists' note : Median Days on Market is the amount of time the "middle" property selling this month was on the market. That is, 50% of homes selling this month took less time to sell, and 50% of homes took more time to sell. We use the median rather than the average because the median is not particularly sensitive to sales of homes that took an unusually large amount of time to sell relative to the vast majority of homes in the market. Median Days on Market 300 2010 2011 January 2014 December 2013 November 2013 October 2013 September 2013 August 2013 July 2013 June 2013 May 2013 April 2013 March 2013 February 2013 January 2013 2012 Median Days on Market Percent Change Year-over-Year 80 69 75 54 65 78 100 88 106 111 159 149 85 -5.9% -31.0% -38.5% -60.3% -37.5% -36.1% -9.1% -14.6% -18.5% -17.2% -2.5% -5.1% -37.5% 2013 250 200 150 100 50 0 J F M A M J J A S O N D J F M A M J J A S O N D J F M A M J J A S O N D J F M A M J J A S O N D J Average Percent of Original List Price Received The average of the sale price (as a percentage of the original list price) across all properties selling during the month Avg. Pct. of Orig. List Price Received Economists' note : The Average Percent of Original List Price Received is an indicator of market conditions, in that in a recovering market, the measure rises as buyers realize that the market may be moving away from them and they need to match the selling price (or better it) in order to get a contract on the house. This is usually the last measure to indicate a market that has shifted from down to up, and is another lagging indicator. 100% 2010 2011 Month January 2014 December 2013 November 2013 October 2013 September 2013 August 2013 July 2013 June 2013 May 2013 April 2013 March 2013 February 2013 January 2013 2012 Avg. Pct. of Orig. List Price Received Percent Change Year-over-Year 91.5% 94.6% 94.3% 93.5% 93.1% 92.9% 92.4% 92.8% 92.4% 94.4% 90.6% 92.1% 91.8% -0.3% 3.8% 3.1% 3.2% 4.8% 0.9% 3.1% 0.1% 1.8% 7.4% 0.2% 5.6% 3.6% 2013 95% 90% 85% 80% 75% J F M A M J J A S O N D J F M A M J J A S O N D J F M A M J J A S O N D J F M A M J J A S O N D J Produced by Florida REALTORS® with data provided by Florida's multiple listing services. Statistics for each month compiled from MLS feeds on the 15th day of the following month. Data released on Friday, February 21, 2014. Next data release is Thursday, March 20, 2014.
- 6. Monthly Market Detail - January 2014 Single Family Homes Walton County Month Inventory (Active Listings) The number of property listings active at the end of the month Economists' note : There are a number of ways to calculate Inventory, so these numbers may not match up to others you see in your market. We calculate Inventory by counting the number of active listings on the last day of the month, and hold this number to compare with the same month the following year. 2,100 2010 2011 January 2014 December 2013 November 2013 October 2013 September 2013 August 2013 July 2013 June 2013 May 2013 April 2013 March 2013 February 2013 January 2013 2012 Inventory Percent Change Year-over-Year 1,292 1,306 1,319 1,292 1,261 1,218 1,181 1,211 1,160 1,187 1,137 1,092 1,082 19.4% 15.9% 14.5% 9.7% -1.3% -9.8% -12.1% -13.9% -18.9% -15.8% -20.6% -24.4% -25.5% 2013 Inventory 1,900 1,700 1,500 1,300 1,100 900 J F M A M J J A S O N D J F M A M J J A S O N D J F M A M J J A S O N D J F M A M J J A S O N D J Month Months Supply of Inventory An estimate of the number of months it will take to deplete the current Inventory given recent sales rates Economists' note : This is an indicator of the state of the market, whether it is a buyers' market or a sellers' market. The benchmark for a balanced market (favoring neither buyer nor seller) is 5.5 Months of Inventory. Higher numbers indicate a buyers' market, lower numbers a sellers' market. Months Supply of Inventory 27.0 2010 2011 January 2014 December 2013 November 2013 October 2013 September 2013 August 2013 July 2013 June 2013 May 2013 April 2013 March 2013 February 2013 January 2013 2012 Months Supply Percent Change Year-over-Year 9.1 9.4 9.4 9.3 9.1 8.9 8.7 8.9 8.7 9.1 8.8 8.5 8.5 7.0% 5.3% 0.1% -3.0% -14.6% -20.6% -24.6% -26.9% -29.1% -27.6% -32.4% -34.7% -35.8% 2013 22.0 17.0 12.0 7.0 J F M A M J J A S O N D J F M A M J J A S O N D J F M A M J J A S O N D J F M A M J J A S O N D J Produced by Florida REALTORS® with data provided by Florida's multiple listing services. Statistics for each month compiled from MLS feeds on the 15th day of the following month. Data released on Friday, February 21, 2014. Next data release is Thursday, March 20, 2014.
- 7. Monthly Market Detail - January 2014 Single Family Homes Walton County Less than $50,000 2 -33.3% $50,000 - $99,999 7 75.0% 3 -57.1% $150,000 - $199,999 10 42.9% $200,000 - $249,999 15 25.0% $250,000 - $299,999 9 50.0% $300,000 - $399,999 10 66.7% $400,000 - $599,999 17 -19.0% $600,000 - $999,999 24 300.0% $1,000,000 or more The number of sales transactions which closed during the month Economists' note : Closed Sales are one of the simplest—yet most important—indicators for the residential real estate market. When comparing Closed Sales across markets of different sizes, we recommend using the year-over-year percent changes rather than the absolute counts. Realtors® and their clients should also be wary of month-to-month comparisons of Closed Sales because of potential seasonal effects. 30 Percent Change Year-over-Year $100,000 - $149,999 Closed Sales by Sale Price January 2013 Closed Sales 13 44.4% Sale Price January 2014 30 25 20 20 15 15 10 10 5 Closed Sales 25 5 0 0 Less than $50,000 $50,000 $99,999 $100,000 $149,999 $150,000 $199,999 $200,000 $249,999 $250,000 $299,999 $300,000 $399,999 $400,000 $599,999 $600,000 - $1,000,000 or $999,999 more $50,000 $99,999 $100,000 $149,999 Median Days on Market 74 -73.7% $50,000 - $99,999 63 -35.7% 86 -14.0% 118 42.2% $200,000 - $249,999 44 -27.9% $250,000 - $299,999 112 60.0% $300,000 - $399,999 80 -25.9% $400,000 - $599,999 38 -35.6% $600,000 - $999,999 69 1625.0% $1,000,000 or more Economists' note: Median Days on Market is the amount of time the "middle" property selling this month was on the market. That is, 50% of homes selling this month took less time to sell, and 50% of homes took more time to sell. We use the median rather than the average because the median is not particularly sensitive to sales of homes that took an unusually large amount of time to sell relative to the vast majority of homes in the market. Less than $50,000 Less than $50,000 $150,000 - $199,999 The median number of days that properties sold during the month were on the market January 2013 Percent Change Year-over-Year $100,000 - $149,999 Median Days on Market by Sale Price 350 300 250 200 150 100 50 0 Median Days on Market 186 -42.1% Sale Price January 2014 $150,000 $199,999 $200,000 $249,999 350 300 250 200 150 100 50 0 $250,000 $299,999 $300,000 $399,999 $400,000 $599,999 $600,000 - $1,000,000 or $999,999 more Produced by Florida REALTORS® with data provided by Florida's multiple listing services. Statistics for each month compiled from MLS feeds on the 15th day of the following month. Data released on Friday, February 21, 2014. Next data release is Thursday, March 20, 2014.
- 8. Monthly Market Detail - January 2014 Single Family Homes Walton County Initial Listing Price January 2013 New Listings 50 2 -50.0% $50,000 - $99,999 12 20.0% 10 -9.1% 11 -54.2% $200,000 - $249,999 34 54.5% $250,000 - $299,999 33 50.0% $300,000 - $399,999 34 -12.8% $400,000 - $599,999 36 20.0% $600,000 - $999,999 43 152.9% $1,000,000 or more Economists' note: In a recovering market, we expect that new listings will eventually rise as sellers raise their estimations of value. But this increase will take place only after the market has turned up, so New Listings are a lagging indicator of the health of the market. Also be aware of properties which have been withdrawn from the market and then relisted. These are not really New Listings. Less than $50,000 $150,000 - $199,999 The number of properties put onto the market during the month Percent Change Year-over-Year $100,000 - $149,999 New Listings by Initial Listing Price New Listings 37 8.8% January 2014 50 40 40 30 30 20 20 10 10 0 0 Less than $50,000 $50,000 $99,999 $100,000 $149,999 $150,000 $199,999 $200,000 $249,999 $250,000 $299,999 $300,000 $399,999 $400,000 $599,999 $600,000 - $1,000,000 or $999,999 more $50,000 $99,999 $100,000 $149,999 Inventory 14 7.7% $50,000 - $99,999 50 0.0% 51 21.4% 82 6.5% $200,000 - $249,999 107 -5.3% $250,000 - $299,999 115 51.3% $300,000 - $399,999 157 14.6% $400,000 - $599,999 208 32.5% $600,000 - $999,999 217 50.7% $1,000,000 or more Economists' note: There are a number of ways to calculate Inventory, so these numbers may not match up to others you see in your market. We calculate Inventory by counting the number of active listings on the last day of the month, and hold this number to compare with the same month the following year. Less than $50,000 Less than $50,000 $150,000 - $199,999 The number of property listings active at the end of the month January 2013 Percent Change Year-over-Year $100,000 - $149,999 Inventory by Current Listing Price 350 300 250 200 150 100 50 0 Inventory 291 6.6% Current Listing Price January 2014 $150,000 $199,999 $200,000 $249,999 350 300 250 200 150 100 50 0 $250,000 $299,999 $300,000 $399,999 $400,000 $599,999 $600,000 - $1,000,000 or $999,999 more Produced by Florida REALTORS® with data provided by Florida's multiple listing services. Statistics for each month compiled from MLS feeds on the 15th day of the following month. Data released on Friday, February 21, 2014. Next data release is Thursday, March 20, 2014.
- 9. Monthly Distressed Market - January 2014 Single Family Homes Walton County January 2014 Percent Change Year-over-Year 93 62 50.0% $453,200 $375,000 20.9% 9 8 12.5% $87,000 $135,500 -35.8% 8 Closed Sales January 2013 11 -27.3% $212,000 $437,500 -51.5% Traditional Median Sale Price Closed Sales Foreclosure/REO Median Sale Price Closed Sales Short Sale Median Sale Price 2010 2011 Traditional 2012 Foreclosure/REO 2013 Short Sale 100% 90% Closed Sales 80% 70% 60% 50% 40% 30% 20% 10% 0% J F M A M J J A S O N D J F M A M J J A S O N D J F M A M J J A S O N D J F M A M J J A S O N D J $600,000 Median Sale Price $500,000 $400,000 $300,000 $200,000 $100,000 $0 J F M A M J J A S O N D J F M A M J J A S O N D J F M A M J J A S O N D J F M A M J J A S O N D J 2010 2011 2012 2013 Produced by Florida REALTORS® with data provided by Florida's multiple listing services. Statistics for each month compiled from MLS feeds on the 15th day of the following month. Data released on Friday, February 21, 2014. Next data release is Thursday, March 20, 2014.
- 10. Monthly Market Detail - January 2014 Townhouses and Condos Walton County January 2014 January 2013 Percent Change Year-over-Year 56 40 40.0% Paid in Cash 23 21 9.5% New Pending Sales 86 69 24.6% New Listings 116 109 6.4% Median Sale Price $262,500 $210,000 25.0% Average Sale Price $341,196 $279,428 22.1% 73 140 -47.9% 91.9% 86.9% 5.8% Pending Inventory 95 112 -15.2% Inventory (Active Listings) 711 651 9.2% Months Supply of Inventory 9.5 9.0 5.1% Closed Sales Percent Change Year-over-Year 56 81 61 73 76 89 87 86 82 75 73 59 40 40.0% 9.5% -10.3% -6.4% 28.8% 9.9% 22.5% 11.7% -2.4% -5.1% -18.0% -7.8% -33.3% Summary Statistics Closed Sales Median Days on Market Average Percent of Original List Price Received Month Closed Sales The number of sales transactions which closed during the month Economists' note : Closed Sales are one of the simplest—yet most important—indicators for the residential real estate market. When comparing Closed Sales across markets of different sizes, we recommend using the year-over-year percent changes rather than the absolute counts. Realtors® and their clients should also be wary of month-to-month comparisons of Closed Sales because of potential seasonal effects. Closed Sales 120 2010 2011 January 2014 December 2013 November 2013 October 2013 September 2013 August 2013 July 2013 June 2013 May 2013 April 2013 March 2013 February 2013 January 2013 2012 2013 100 80 60 40 20 0 J F M A M J J A S O N D J F M A M J J A S O N D J F M A M J J A S O N D J F M A M J J A S O N D J Produced by Florida REALTORS® with data provided by Florida's multiple listing services. Statistics for each month compiled from MLS feeds on the 15th day of the following month. Data released on Friday, February 21, 2014. Next data release is Thursday, March 20, 2014.
- 11. Monthly Market Detail - January 2014 Townhouses and Condos Walton County Month Cash Sales The number of Closed Sales during the month in which buyers exclusively paid in cash Economists' note : Cash Sales can be a useful indicator of the extent to which investors are participating in the market. Why? Investors are far more likely to have the funds to purchase a home available up front, whereas the typical homebuyer requires a mortgage or some other form of financing. There are, of course, many possible exceptions, so this statistic should be interpreted with care. Cash Sales 80 2010 2011 January 2014 December 2013 November 2013 October 2013 September 2013 August 2013 July 2013 June 2013 May 2013 April 2013 March 2013 February 2013 January 2013 2012 Cash Sales Percent Change Year-over-Year 23 38 30 29 40 38 41 38 44 36 35 33 21 9.5% 15.2% -21.1% -29.3% 14.3% -15.6% -10.9% -5.0% 4.8% -14.3% -35.2% 17.9% -38.2% 2013 60 40 20 0 J F M A M J J A S O N D J F M A M J J A S O N D J F M A M J J A S O N D J F M A M J J A S O N D J Cash Sales as a Percentage of Closed Sales The percentage of Closed Sales during the month which were Cash Sales Pct. of Closed Sales Paid in Cash Economists' note : This statistic is simply another way of viewing Cash Sales. The remaining percentages of Closed Sales (i.e. those not paid fully in cash) each month involved some sort of financing, such as mortgages, owner/seller financing, assumed loans, etc. 75% 2010 2011 Month January 2014 December 2013 November 2013 October 2013 September 2013 August 2013 July 2013 June 2013 May 2013 April 2013 March 2013 February 2013 January 2013 2012 Percent of Closed Sales Paid in Cash Percent Change Year-over-Year 41.1% 46.9% 49.2% 39.7% 52.6% 42.7% 47.1% 44.2% 53.7% 48.0% 47.9% 55.9% 52.5% -21.8% 5.2% -12.0% -24.4% -11.3% -23.1% -27.3% -14.9% 7.3% -9.7% -21.0% 27.8% -7.4% 2013 65% 55% 45% 35% 25% J F M A M J J A S O N D J F M A M J J A S O N D J F M A M J J A S O N D J F M A M J J A S O N D J Produced by Florida REALTORS® with data provided by Florida's multiple listing services. Statistics for each month compiled from MLS feeds on the 15th day of the following month. Data released on Friday, February 21, 2014. Next data release is Thursday, March 20, 2014.
- 12. Monthly Market Detail - January 2014 Townhouses and Condos Walton County Month New Pending Sales The number of property listings that went from "Active" to "Pending" status during the month Economists' note : Because of the typical length of time it takes for a sale to close, economists consider Pending Sales to be a decent indicator of potential future Closed Sales. It is important to bear in mind, however, that not all Pending Sales will be closed successfully. So, the effectiveness of Pending Sales as a future indicator of Closed Sales is susceptible to changes in market conditions such as the availability of financing for homebuyers and the inventory of distressed properties for sale. 2010 Pending Sales 120 2011 January 2014 December 2013 November 2013 October 2013 September 2013 August 2013 July 2013 June 2013 May 2013 April 2013 March 2013 February 2013 January 2013 2012 New Pending Sales Percent Change Year-over-Year 86 53 70 80 61 84 95 101 96 65 104 81 69 24.6% 8.2% 29.6% -13.0% -6.2% 12.0% 33.8% 26.3% 11.6% -13.3% 19.5% 0.0% -9.2% 2013 100 80 60 40 20 0 J F M A M J J A S O N D J F M A M J J A S O N D J F M A M J J A S O N D J F M A M J J A S O N D J Month New Listings The number of properties put onto the market during the month Economists' note : In a recovering market, we expect that new listings will eventually rise as sellers raise their estimations of value. But this increase will take place only after the market has turned up, so New Listings are a lagging indicator of the health of the market. Also be aware of properties which have been withdrawn from the market and then relisted. These are not really New Listings. New Listings 250 2010 2011 January 2014 December 2013 November 2013 October 2013 September 2013 August 2013 July 2013 June 2013 May 2013 April 2013 March 2013 February 2013 January 2013 2012 New Listings Percent Change Year-over-Year 116 76 87 141 101 111 96 111 130 102 126 109 109 6.4% 20.6% 20.8% 64.0% 3.1% 16.8% 2.1% 19.4% 49.4% -3.8% 24.8% 11.2% -6.8% 2013 200 150 100 50 0 J F M A M J J A S O N D J F M A M J J A S O N D J F M A M J J A S O N D J F M A M J J A S O N D J Produced by Florida REALTORS® with data provided by Florida's multiple listing services. Statistics for each month compiled from MLS feeds on the 15th day of the following month. Data released on Friday, February 21, 2014. Next data release is Thursday, March 20, 2014.
- 13. Monthly Market Detail - January 2014 Townhouses and Condos Walton County Month Median Sale Price The median sale price reported for the month (i.e. 50% of sales were above and 50% of sales were below) Economists' note : Median Sale Price is our preferred summary statistic for price activity because, unlike Average Sale Price, Median Sale Price is not sensitive to high sale prices for small numbers of homes that may not be characteristic of the market area. Median Sale Price $360K 2010 2011 January 2014 December 2013 November 2013 October 2013 September 2013 August 2013 July 2013 June 2013 May 2013 April 2013 March 2013 February 2013 January 2013 2012 Median Sale Price Percent Change Year-over-Year $262,500 $310,000 $272,500 $300,000 $320,000 $270,000 $288,840 $233,625 $257,750 $260,000 $250,000 $219,000 $210,000 25.0% 18.1% 8.6% 39.5% 48.4% 8.0% 20.4% -18.0% 21.4% -3.7% 20.8% 5.2% -3.6% 2013 $310K $260K $210K $160K J F M A M J J A S O N D J F M A M J J A S O N D J F M A M J J A S O N D J F M A M J J A S O N D J Month Average Sale Price The average sale price reported for the month (i.e. total sales in dollars divided by the number of sales) Average Sale Price Economists' note : As noted above, we prefer Median Sale Price over Average Sale Price as a summary statistic for home prices. However, Average Sale Price does have its uses—particularly when it is analyzed alongside the Median Sale Price. For one, the relative difference between the two statistics can provide some insight into the market for higher-end homes in an area. $450K 2010 2011 January 2014 December 2013 November 2013 October 2013 September 2013 August 2013 July 2013 June 2013 May 2013 April 2013 March 2013 February 2013 January 2013 2012 Average Sale Price Percent Change Year-over-Year $341,196 $378,191 $345,347 $427,383 $431,620 $365,793 $364,601 $341,176 $323,547 $339,141 $358,556 $299,706 $279,428 22.1% 13.0% 6.0% 72.1% 29.1% 13.8% 28.0% -19.1% 1.7% 13.1% 38.9% 3.6% -15.2% 2013 $400K $350K $300K $250K $200K J F M A M J J A S O N D J F M A M J J A S O N D J F M A M J J A S O N D J F M A M J J A S O N D J Produced by Florida REALTORS® with data provided by Florida's multiple listing services. Statistics for each month compiled from MLS feeds on the 15th day of the following month. Data released on Friday, February 21, 2014. Next data release is Thursday, March 20, 2014.
- 14. Monthly Market Detail - January 2014 Townhouses and Condos Walton County Month Median Days on Market The median number of days that properties sold during the month were on the market Economists' note : Median Days on Market is the amount of time the "middle" property selling this month was on the market. That is, 50% of homes selling this month took less time to sell, and 50% of homes took more time to sell. We use the median rather than the average because the median is not particularly sensitive to sales of homes that took an unusually large amount of time to sell relative to the vast majority of homes in the market. Median Days on Market 300 2010 2011 January 2014 December 2013 November 2013 October 2013 September 2013 August 2013 July 2013 June 2013 May 2013 April 2013 March 2013 February 2013 January 2013 2012 Median Days on Market Percent Change Year-over-Year 73 75 104 63 94 74 102 66 90 94 183 136 140 -47.9% 36.4% 9.5% -38.8% -49.2% -27.5% -31.5% -60.9% -21.1% -45.0% 40.8% -18.6% -27.8% 2013 250 200 150 100 50 0 J F M A M J J A S O N D J F M A M J J A S O N D J F M A M J J A S O N D J F M A M J J A S O N D J Average Percent of Original List Price Received The average of the sale price (as a percentage of the original list price) across all properties selling during the month Avg. Pct. of Orig. List Price Received Economists' note : The Average Percent of Original List Price Received is an indicator of market conditions, in that in a recovering market, the measure rises as buyers realize that the market may be moving away from them and they need to match the selling price (or better it) in order to get a contract on the house. This is usually the last measure to indicate a market that has shifted from down to up, and is another lagging indicator. 95% 2010 2011 Month January 2014 December 2013 November 2013 October 2013 September 2013 August 2013 July 2013 June 2013 May 2013 April 2013 March 2013 February 2013 January 2013 2012 Avg. Pct. of Orig. List Price Received Percent Change Year-over-Year 91.9% 91.4% 91.3% 91.9% 89.9% 93.1% 92.9% 91.3% 90.9% 89.6% 91.1% 91.2% 86.9% 5.8% 0.2% 1.3% 0.9% 3.9% 5.4% 6.5% 5.7% 2.9% 2.1% 4.4% 3.6% 2.6% 2013 90% 85% 80% 75% 70% 65% J F M A M J J A S O N D J F M A M J J A S O N D J F M A M J J A S O N D J F M A M J J A S O N D J Produced by Florida REALTORS® with data provided by Florida's multiple listing services. Statistics for each month compiled from MLS feeds on the 15th day of the following month. Data released on Friday, February 21, 2014. Next data release is Thursday, March 20, 2014.
- 15. Monthly Market Detail - January 2014 Townhouses and Condos Walton County Month Inventory (Active Listings) The number of property listings active at the end of the month Economists' note : There are a number of ways to calculate Inventory, so these numbers may not match up to others you see in your market. We calculate Inventory by counting the number of active listings on the last day of the month, and hold this number to compare with the same month the following year. 1,700 2010 2011 January 2014 December 2013 November 2013 October 2013 September 2013 August 2013 July 2013 June 2013 May 2013 April 2013 March 2013 February 2013 January 2013 2012 Inventory Percent Change Year-over-Year 711 729 701 741 693 668 659 679 699 690 664 668 651 9.2% 9.1% 6.7% 6.9% -8.2% -14.1% -17.7% -17.4% -17.4% -22.2% -26.1% -28.4% -32.2% 2013 Inventory 1,500 1,300 1,100 900 700 500 J F M A M J J A S O N D J F M A M J J A S O N D J F M A M J J A S O N D J F M A M J J A S O N D J Month Months Supply of Inventory An estimate of the number of months it will take to deplete the current Inventory given recent sales rates Economists' note : This is an indicator of the state of the market, whether it is a buyers' market or a sellers' market. The benchmark for a balanced market (favoring neither buyer nor seller) is 5.5 Months of Inventory. Higher numbers indicate a buyers' market, lower numbers a sellers' market. Months Supply of Inventory 32.0 2010 2011 January 2014 December 2013 November 2013 October 2013 September 2013 August 2013 July 2013 June 2013 May 2013 April 2013 March 2013 February 2013 January 2013 2012 Months Supply Percent Change Year-over-Year 9.5 9.9 9.6 10.1 9.4 9.2 9.2 9.6 10.0 9.9 9.5 9.3 9.0 5.1% 9.4% 7.4% 4.7% -12.7% -15.0% -18.2% -16.2% -12.1% -16.4% -19.5% -22.9% -27.8% 2013 27.0 22.0 17.0 12.0 7.0 J F M A M J J A S O N D J F M A M J J A S O N D J F M A M J J A S O N D J F M A M J J A S O N D J Produced by Florida REALTORS® with data provided by Florida's multiple listing services. Statistics for each month compiled from MLS feeds on the 15th day of the following month. Data released on Friday, February 21, 2014. Next data release is Thursday, March 20, 2014.
- 16. Monthly Market Detail - January 2014 Townhouses and Condos Walton County $50,000 $99,999 $100,000 $149,999 Closed Sales 0 N/A $50,000 - $99,999 5 150.0% 6 -50.0% 8 166.7% $200,000 - $249,999 7 16.7% $250,000 - $299,999 6 100.0% $300,000 - $399,999 9 28.6% $400,000 - $599,999 7 75.0% $600,000 - $999,999 7 133.3% $1,000,000 or more Economists' note : Closed Sales are one of the simplest—yet most important—indicators for the residential real estate market. When comparing Closed Sales across markets of different sizes, we recommend using the year-over-year percent changes rather than the absolute counts. Realtors® and their clients should also be wary of month-to-month comparisons of Closed Sales because of potential seasonal effects. Less than $50,000 Less than $50,000 $150,000 - $199,999 The number of sales transactions which closed during the month 14 12 10 8 6 4 2 0 Percent Change Year-over-Year $100,000 - $149,999 Closed Sales by Sale Price January 2013 Closed Sales 1 N/A Sale Price January 2014 $150,000 $199,999 $200,000 $249,999 14 12 10 8 6 4 2 0 $250,000 $299,999 $300,000 $399,999 $400,000 $599,999 $600,000 - $1,000,000 or $999,999 more $50,000 $99,999 $100,000 $149,999 Median Days on Market (No Sales) N/A $50,000 - $99,999 59 555.6% 41 -57.3% 49 -90.7% $200,000 - $249,999 217 126.0% $250,000 - $299,999 27 -76.1% $300,000 - $399,999 86 -38.1% $400,000 - $599,999 621 178.5% $600,000 - $999,999 102 52.2% $1,000,000 or more Economists' note: Median Days on Market is the amount of time the "middle" property selling this month was on the market. That is, 50% of homes selling this month took less time to sell, and 50% of homes took more time to sell. We use the median rather than the average because the median is not particularly sensitive to sales of homes that took an unusually large amount of time to sell relative to the vast majority of homes in the market. Less than $50,000 Less than $50,000 $150,000 - $199,999 The median number of days that properties sold during the month were on the market January 2013 Percent Change Year-over-Year $100,000 - $149,999 Median Days on Market by Sale Price 700 600 500 400 300 200 100 0 Median Days on Market 4 N/A Sale Price January 2014 $150,000 $199,999 $200,000 $249,999 700 600 500 400 300 200 100 0 $250,000 $299,999 $300,000 $399,999 $400,000 $599,999 $600,000 - $1,000,000 or $999,999 more Produced by Florida REALTORS® with data provided by Florida's multiple listing services. Statistics for each month compiled from MLS feeds on the 15th day of the following month. Data released on Friday, February 21, 2014. Next data release is Thursday, March 20, 2014.
- 17. Monthly Market Detail - January 2014 Townhouses and Condos Walton County Initial Listing Price New Listings January 2013 40 35 30 25 20 15 10 5 0 Less than $50,000 $50,000 $99,999 $100,000 $149,999 0 N/A $50,000 - $99,999 2 0.0% 14 -17.6% 8 -33.3% $200,000 - $249,999 14 75.0% $250,000 - $299,999 13 116.7% $300,000 - $399,999 12 -57.1% $400,000 - $599,999 36 80.0% $600,000 - $999,999 7 -41.7% $1,000,000 or more Economists' note: In a recovering market, we expect that new listings will eventually rise as sellers raise their estimations of value. But this increase will take place only after the market has turned up, so New Listings are a lagging indicator of the health of the market. Also be aware of properties which have been withdrawn from the market and then relisted. These are not really New Listings. Less than $50,000 $150,000 - $199,999 The number of properties put onto the market during the month Percent Change Year-over-Year $100,000 - $149,999 New Listings by Initial Listing Price New Listings 10 150.0% January 2014 $150,000 $199,999 $200,000 $249,999 40 35 30 25 20 15 10 5 0 $250,000 $299,999 $300,000 $399,999 $400,000 $599,999 $600,000 - $1,000,000 or $999,999 more $50,000 $99,999 $100,000 $149,999 Inventory 0 N/A $50,000 - $99,999 13 -7.1% 44 4.8% 75 23.0% $200,000 - $249,999 60 13.2% $250,000 - $299,999 73 25.9% $300,000 - $399,999 135 17.4% $400,000 - $599,999 151 17.1% $600,000 - $999,999 96 0.0% $1,000,000 or more Economists' note: There are a number of ways to calculate Inventory, so these numbers may not match up to others you see in your market. We calculate Inventory by counting the number of active listings on the last day of the month, and hold this number to compare with the same month the following year. Less than $50,000 Less than $50,000 $150,000 - $199,999 The number of property listings active at the end of the month January 2013 Percent Change Year-over-Year $100,000 - $149,999 Inventory by Current Listing Price 160 140 120 100 80 60 40 20 0 Inventory 64 -22.9% Current Listing Price January 2014 $150,000 $199,999 $200,000 $249,999 160 140 120 100 80 60 40 20 0 $250,000 $299,999 $300,000 $399,999 $400,000 $599,999 $600,000 - $1,000,000 or $999,999 more Produced by Florida REALTORS® with data provided by Florida's multiple listing services. Statistics for each month compiled from MLS feeds on the 15th day of the following month. Data released on Friday, February 21, 2014. Next data release is Thursday, March 20, 2014.
- 18. Monthly Distressed Market - January 2014 Townhouses and Condos Walton County January 2014 Percent Change Year-over-Year 46 31 48.4% $267,500 $235,000 13.8% 8 4 100.0% $140,950 $202,500 -30.4% 2 Closed Sales January 2013 5 -60.0% $360,000 $145,000 148.3% Traditional Median Sale Price Closed Sales Foreclosure/REO Median Sale Price Closed Sales Short Sale Median Sale Price 2010 2011 Traditional 2012 Foreclosure/REO 2013 Short Sale 100% 90% Closed Sales 80% 70% 60% 50% 40% 30% 20% 10% 0% J F M A M J J A S O N D J F M A M J J A S O N D J F M A M J J A S O N D J F M A M J J A S O N D J $500,000 $450,000 Median Sale Price $400,000 $350,000 $300,000 $250,000 $200,000 $150,000 $100,000 $50,000 $0 J F M A M J J A S O N D J F M A M J J A S O N D J F M A M J J A S O N D J F M A M J J A S O N D J 2010 2011 2012 2013 Produced by Florida REALTORS® with data provided by Florida's multiple listing services. Statistics for each month compiled from MLS feeds on the 15th day of the following month. Data released on Friday, February 21, 2014. Next data release is Thursday, March 20, 2014.