

Recomendados
Mais conteúdo relacionado
Mais procurados
Mais procurados (20)
Destaque
Destaque (20)
Semelhante a Right to Education
Semelhante a Right to Education (20)
Último
Último (20)
Right to Education
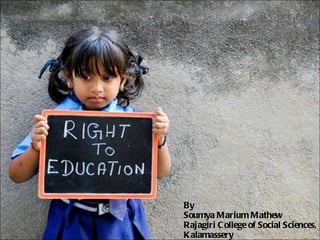
- 1. By Soumya Marium Mathew Rajagiri College of Social Sciences, Kalamassery
- 5. AVAILABILITY ACCESSIBILITY ADAPTAB ILITY ACCEPATBILITY Availability of skilled and qualified educators Barriers to education are eliminated Elimination of obstacles against progression and employment Quality education Safe environments Professional teachers Equitable achievements for all Promotion of full human potential Resource allocation for educational needs for all
- 8. INDIAN EDUCATION STATUS Literacy – Total Population 59.5% 133rd of 160 Literacy – Male Literacy - Female 70.2% 53.63% 130th of 156 Youth (15–24 years) literacy rate, 2000–2007*, male 87 Youth (15–24 years) literacy rate, 2000–2007*, female 77
- 9. PRIMARY EDUCATION Duration of education - Primary 6 Primary Education Completion Rate 90 Pupil Teacher Ratio Primary 40.2 Teaching Weeks per year - Primary 42 weeks per year Net enrollment rate (%), primary level, total 89.81 Gender parity index (GPI), gross enrollment ratio in primary education 0.97 Percentage of repeaters (%), primary 3.45 Drop-out rate (%), primary 34.21
- 10. SECONDARY EDUCATION TERITIARY EDUCATION Duration of education - Secondary 5 Percentage of repeaters (%), secondary 4.68 Pupil-teacher ratio, secondary 32.70 Education enrollment by level – Tertiary level 11,295,041 Enrollment 10.5% Universities - top 100 2 Universities – top 500 3
- 11. EXPENDITURE ON EDUCATION Public education expenditure as % of GDP 3.18 Education spending (% of total govt. expenditure) 12.7% Public spending on education, total - % of govt. expenditure 10.74% Public spending per student – Primary level 7.2
- 14. Why only boys….?
- 15. Who will neutralize this gap…..? Infra structure Do Matters…..!!!
- 16. Is Higher Education Accessible …… Affordable????