Financial Cartography at Bogazici University
•Transferir como PPTX, PDF•
4 gostaram•845 visualizações

As the financial system becomes more complex, new methods to understand its inherent risks and dynamics are needed. Kimmo Soramäki will discuss how network analysis of large‐scale financial transaction data can be used to improve our understanding systemic risk. He will also show case studies how visual analytics and accurate data driven maps of asset correlations and tail risks can enable a stronger intuition of market dynamics.

Recomendados
Recomendados
Mais conteúdo relacionado
Mais procurados
Mais procurados (8)
Destaque
Destaque (20)
Semelhante a Financial Cartography at Bogazici University
Semelhante a Financial Cartography at Bogazici University (20)
Último
Último (20)
Financial Cartography at Bogazici University
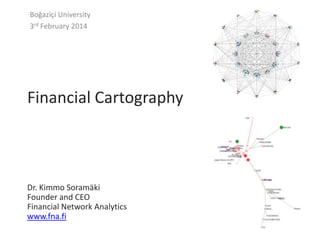
- 1. Boğaziçi University 3rd February 2014 Financial Cartography Dr. Kimmo Soramäki Founder and CEO Financial Network Analytics www.fna.fi
- 2. Agenda Mapping Interbank Payment Flows and Exposures Soramäki, K. M.L. Bech, W.E. Beyeler, R.J. Glass and J. Arnold (2007). ‘The Topology of Interbank Payments’ Physica A, Vol. 379, pp 317-333. Soramäki, K. and S. Cook (2013). ‘Algorithm for Identifying Systemically important Banks in Payment Systems’. Economics E-Journal, Vol. 7. Langfield, S. and K. Soramaki (forthcoming). ‘Interbank Networks’. Journal of Computational Economics. Asset Correlation Networks Soramäki, K., S. Cook and A. Laubsch (forthcoming). ‘A Network-Based Method for Visual Identification of Systemic Risks’. FNA Platform Soramäki, K., S. Cook. (forthcoming) ‘Financial Network Analytics with FNA’. ISBN: 978952-67505-1-4 2
- 4. Fedwire – First Maps Fedwire Interbank Payment Network Fall 2001 Around 8000 banks, 66 banks comprise 75% of value,25 banks completely connected Soramäki, Bech, Beyeler, Glass and Arnold (2007), Physica A, Vol. 379, pp 317-333. 4
- 5. Network Theory The behavior of a node cannot be understood on the basis its own properties alone. Financial Network Analysis Social Network Analysis Network Science NETWORK THEORY Graph & Matrix Theory Computer Science Biological Network Analysis To understand the behavior of one node, one must understand the behavior of nodes that may be several links apart in the network.
- 6. Networks Brings us Beyond the Data Cube For example: Entities: 100 banks Variables: Liquidity, Opening Balance, Collateral, … Time: Daily data Links: Bilateral payment flows Links are the 4th dimension to data (Tesseract) Information on the links allows us to develop better models for banks' liquidity situation in times of stress 6
- 7. Systemic Risk News articles mentioning “systemic risk”, Source: trends.google.com Not “The risk that a system composed of many interacting parts fails (due to a shock to some of its parts)” In Finance, the risk that a disturbance in the financial system propagates and makes the system unable to perform its function – i.e. allocate capital efficiently. Or Domino effects, cascading failures, financial interlinkages, … -> i.e. a process in the financial network 7
- 8. More Network Maps Federal funds Bech, M.L. and Atalay, E. (2008), “The Topology of the Federal Funds Market”. ECB Working Paper No. 986. Italian money market Iori G, G de Masi, O Precup, G Gabbi and G Caldarelli (2008): “A network analysis of the Italian overnight money market”, Journal of Economic Dynamics and Control, vol. 32(1), pages 259-278 Unsecured Sterling money market Wetherilt, A. P. Zimmerman, and K. Soramäki (2008), “The sterling unsecured loan market during 2006–2008: insights from network topology“, in Leinonen (ed), BoF Scientific monographs, E 42 Cross-border bank lending Minoiu, Camelia and Reyes, Javier A. (2010). A network analysis of global banking:1978-2009. IMF Working Paper WP/11/74. 8
- 9. Common Centrality Metrics Centrality metrics aim to summarize some notion of importance Degree: Number of links Closeness: Distance from/to other nodes via shortest paths Betweenness: Number of shortest paths going through the node Eigenvector: Nodes that are linked by other important nodes are more central, eg. Google’s PageRank
- 10. How to Calculate a Metric for Payment Flows Depends on process that takes place in the network! Trajectory – – – – Geodesic paths (shortest paths) Any path (visit no node twice) Trails (visit no link twice) Walks (free movement) Transmission – Parallel duplication – Serial duplication – Transfer Source: Borgatti (2004)
- 11. SinkRank Models Payment Flows NASA’s model of ocean currents around the Caribbean 11
- 12. Network Simulation Interactive demo at: www.fna.fi/demos/sofe/viz/simulation.html Failure Scenario Black node = can receive but cannot send (click to fail a node) Normal Scenario Green node = Liquidity available. Amount shown as node size. Red node = No, liquidity. Queues build up. Number 12 queued shown as node size.
- 13. Predictive Modeling • Predictive modeling is the process by which a model is created to try to best predict the probability of an outcome • For example: Given a distribution of liquidity among the banks at noon, how is it going to be at 5pm? – What is the distribution if bank A has an operational disruption at noon? – Who is affected first? – Who is affected most? – How is Bank C affected in an hour? • Valuable information for decision making – Crisis management – Participant behavior 13
- 14. SinkRank in BoK-Wire+ https://www.dropbox.com/s/rckmclzzstlmiht/S creenshot%202014-01-20%2010.32.39.png Baek, Soramäki and Yoon (forthcoming). ‘Network Indicators for Monitoring Intraday Liquidity in BOK-Wire+ ‘ 14
- 15. Market Signals • Markets are a great information processing device that create vast amounts of data useful for trading, risk management and financial stability analysis • Main signals: asset returns, volatilities and correlations • There is no easy way to monitor large numbers of assets and their dependencies -> Correlation Maps 15
- 16. Data in Example … Pairwise correlations of daily returns on 35 global assets (ETFs), incl. • • • • • Equity indices FX Commodities Debt Derivatives One year of daily correlations with exponentially-weighted moving average (EWMA) estimate of the (daily) returns’ standard deviation.
- 17. Data 17
- 18. Significant Correlations Common method to visualize large correlation matrices is via heat maps Keep statistically significant correlations with 95% confidence level Carry out 'Multiple comparison' correction -> Expected error rate <5% All correlations (last 100 days) Statistically significant correlations (last 100 days)
- 19. Color Perception A and B are the same shade of gray Right?
- 20. Color Perception A and B are the same shade of gray
- 21. Correlation Network Problem: Heat maps can be misleading due to human color perception
- 22. Correlation Network Nodes are assets Links are correlations: Red = negative Black = positive Absence of link marks that asset is not significantly correlated
- 23. Minimum Spanning Tree Hierarchical Structure in Financial Markets Rosario Mantegna (1999) ‘Hierarchical Structure in Financial Markets’ We use the Minimum Spanning Tree (MST) of the network to filter signal from noise.
- 24. Phylogenetic Tree Layout We lay out the assets by their hierarchical structure using Minimum Spanning Tree of the asset network. Shorter links indicate higher correlations. Longer links indicate lower correlations. Bachmaier, Brandes, and Schlieper (2005). Drawing Phylogenetic Trees. Proceeding ISAAC'05 Proceedings of the 16th international conference on Algorithms and Computation, pp. 1110-1121
- 25. Data Reduction + Adding Dimensions Mapping Returns and Outliers Network layout allows for the display of multiple dimensions of the same data set on a single map: Node color indicates latest daily return - Green = positive - Red = negative Node size indicates magnitude of return Bright green and red indicate an outlier return
- 26. FNA HeavyTails Interactive demo at: www.heavytails.com 26
- 27. Blog, Library and Demos at www.fna.fi Dr. Kimmo Soramäki kimmo@soramaki.net Twitter: soramaki