Rbo performance benchmarking in ino by ss
•Download as PPTX, PDF•
2 likes•553 views

The IWRM implementation should have tools to measure achievement's of RBO. This slide introduce the NARBO's Benchmarking as a tool to measure IWRM results, but still need some improvements.

Recommended
Recommended
More Related Content
Similar to Rbo performance benchmarking in ino by ss
Similar to Rbo performance benchmarking in ino by ss (20)
More from soenarto soendjaja
More from soenarto soendjaja (20)
Recently uploaded
Recently uploaded (20)
Rbo performance benchmarking in ino by ss
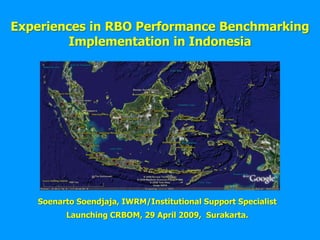
- 1. Experiences in RBO Performance Benchmarking Implementation in Indonesia Soenarto Soendjaja, IWRM/Institutional Support Specialist Launching CRBOM, 29 April 2009, Surakarta.
- 2. RIVER BASIN IN INDONESIA A. Category of River Basin: National Cross Countries : 5 RB Cross Provinces : 27 RB National Strategic : 37 RB B. Category of River Basin: Provincial Cross Districts/Cities: 51 RB C. Category of River Basin: District/City In one District/City: 13 RB TOTAL RB’s : 133 RB’s 2
- 3. This Presentation Based on works done by: NARBO Pilot Performance Benchmarking, for PJT 2, Jatiluhur, October 31st ~ November 3rd , 2006; Research of IWRM Basin Performance Benchmarking in Citarum River Basin, by Kei Saiki, the University of Tokyo in June 2007 to Feb 2008 ; RBO Performance Benchmarking for Selected River Basin, Public Works – NARBO – ADB - PJT 1 - DHV & Associates, May – November 2008; Identification of Generic Parameters for Basin Performance Improvement Indicators as A Tool for IWRM Measures, a Desk Study by Soenarto Soendjaja, IWRM/Institutional Support Specialist, Water Foundation ADHI EKA, Jan – April 2009.
- 4. GENERAL PROCESS OF NARBOPERFROMANCE BENCHMARKING 1. Self Assessment about present position 2. Setting Targets about future position 3. Formulating Plan how to reach Targets 4. Peer Review (External comparison, and advice from external partners in NARBO) 4
- 5. Implementation of RBO Performance Benchmarking in Indonesia 1.Small Workshop On Benchmarking (Jatiluhur-Indonesia, Oct 2004 ) 2.Member Consultation Workshop On Benchmarking (Batu,Malang, Nov 2004) 3.Launching Of Performance Benchmarking (Bali, September 2005) 4.NARBO Peer Reviewer Orientation and Certification & JasaTirtaII Public Corporation Peer Review (Jatiluhur, 31 Oct -03 Nov 2005) 5.NARBO peer review of SA Balai Besar WS Citarum (Bandung, February 2008); 6.RBO Performance Benchmarking in 6 selected river basin (May - November 2008); 7.Eight RBO’s have been benchmarked and 12 RBO’s will follow.
- 6. Economic Environmental Equity Efficiency Sustainability Management Enabling Institutional Instruments Environment Framework Assessment Policies Central - Ø Ø Ø Local Information Legislation Ø Ø River Basin Ø Allocation Ø Instruments Public - Ø Private water for livelihood “water as a Balance “ ” and resource ” The IWRM Implementation Process-GWP 6
- 8. GWP;
- 9. WWF;
- 10. UN
- 12. GWP : Tool Box
- 14. Others?
- 15. Knowledge
- 16. Lesson Learned
- 18. Knowledge Networking Process Partnership Building Listening Sharing Learning 9
- 19. The Outputs of the Study Design of an IWRM performance improvement indicators: performance indicator design for INPUT/OUTPUT/OUTCOME/IMPACT, benchmarking guideline, and design of an output publication 10
- 20. Expected IWRM’s Results Diagram Objectives of IWRM Economic Benefit Basic Livelihood Environmental Sustainability Water Utilization Disaster Vulnerability Envt’l Management River Basin Organization Internal Business Process Finance Learning and Growth Stakeholders Impact Basin Status Benchmarking Output &Outcome NARBOBenchmarking Input
- 21. NARBO Performance Evaluation Using Balanced Score Card
- 23. RBO Governance
- 24. Planning
- 25. Water Allocation
- 26. Data Management
- 27. Cost Recovery
- 34. Organizational DevelopmentFinance Internal Business Processes 13 Stakeholders Learning and Growth
- 38. Biodiversity14
- 39. An Example of a Basin Performance Report Diagram Disaster Preparedness Water Utilization Environmental Conservation Finance Stakeholders Learning and Growth Mission Internal Business Process 15
- 41. Key Lessons and Issues Benchmarking program side Data availability Adequacy of grading threshold values RBO side Strong commitment Institutional arrangement Constraints :time and capacity Different type of RBO with Different type of PB Parameters ? 17
- 42. “IWRM Performance”Future Study RBO Performance IWRM Performance Expanded to Basin Performance Benchmarking NARBO Performance Benchmarking 18
- 43. For More Information Chris Morris, cmorris@adb.org Kei Saiki, c370071@yahoo.co.jp soenarto_soendjaja@yahoo.com.sg