
Recomendados
Recomendados
Mais conteúdo relacionado
Destaque
Destaque (20)
Using Nonlinear Growth Models to Fit the Egg Production Curve in Khazak Hen
- 1. Iranian Journal of Animal Science Research Homepage: http://ijasr.um.ac.ir Research Paper Vol. 15, No.3, Fall 2023, p. 397-411 Using Nonlinear Growth Models to Fit the Egg Production Curve in Khazak Hen Hadi Faraji Arough 1,2 *, Mahmoud Ghazaghi 3 , Mohammad Rokouei 4 How to cite this article: Faraji-Arough, H., Ghazaghi, M., & Rokouei M. (2023). Using nonlinear growth models to fit the egg production curve in Khazak hen. Iranian Journal of Animal Science Research, 15(3), 397-411. DOI: 10.22067/ijasr.2023.77219.1080 Received: 18-06-2022 Revised: 14-01-2023 Accepted: 05-02-2023 Available Online: 05-02-2023 Introduction1: The egg production curve is defined graphically as the relationship between the number of eggs and laying time, which indicates the biological efficiency of a hen and can be effective in the selection and nutritional management of laying hens. Egg production is an essential section of the poultry industry. Appropriate mathematical models accurately represent the production phases of the hen and provide a valuable tool for biological comparisons and interpretations. Also, egg production curves help predict egg production, determine the appropriate age for poultry culling, and economic decisions. Sigmoid growth models are often used to describe size over time in plants, animals, and humans. In laying hens, the shape of the cumulative egg production curve is similar to the growth curve. Therefore, different growth models may be used to model the cumulative egg production curve. Khazak hen is one of the native birds of the Sistan region (Iran), and natural selection has adapted this bird to the conditions of Sistan over the years. The body of this chicken is small, and has low growth and is mainly kept for egg production. Since laying patterns is different in populations. Thus, the use of an appropriate model to describe the specific laying pattern of each population is necessary. Therefore, this study was conducted to investigate growth models to describe the cumulative egg production and weight of eggs and select the best model for the Khazak hen. Materials and Methods: The present study was conducted in the Research Center of Domestic Animals (RCDA), the Research institute of Zabol, Zabol (Iran). Khazak pullets are identified using foot-banded numbers before they start laying. During the experiment, all birds had access to water and feed ad libitum. The egg production was recorded daily for each hen separately. Based on daily records, the weekly egg production of each bird was calculated and then used the calculation of the cumulative egg production. A total of 365 pellet egg production records were used to analyze the production curve from the first to the fortieth 1- Assistant Professor, Research Center of Special Domestic Animals, University of Zabol, Zabol, Iran. 2- Assistant Professor, Department of Ostrich, Special Domestic Animals Institute, Research Institute of Zabol, Zabol, Iran. 3- Assistant Professor, Department of Animal Science, Agriculture Faculty, University of Zabol, Zabol, Iran. 4- Professor, Department of Animal Science, Agriculture Faculty, University of Zabol, Zabol, Iran. *Corresponding Author's Email: hadifaraji@uoz.ac.ir
- 2. 398 جلد ایران دامی علوم پژوهشهای نشریه 15 شماره ، 3 ، پاییز 1402 week of laying. Five growth models (Gompertz, Logistics, Richards, Lopez, and Weibull) were fitted on cumulative egg production and weight records. The goodness of fit criteria, including Akaike information criterion (AIC), mean square error (MSE), Bayesian information criterion (BIC), and adjusted coefficient of determination ( ), were used to compare the growth models and to select the best model. All models were fitted on egg production records using the nlme package in R software, and the parameters of each model were estimated. After fitting the models, the cumulative production values for different ages were predicted by the models and were compared with the actual values over 40 weeks. Results and Discussion: Based on the goodness of fit criteria, the Lopez mod had the highest value and lowest values of AIC, BIC, and MSE for cumulative egg production. While the Weibull model was the best model than other models to describe cumulative egg weight in terms of the goodness of fit criteria. The Gompertz and Logistic models overestimated initial production and underestimated the final production compared with other models. Estimates of time and production at the inflection points using Lopez and Weibull models were close to actual values of cumulative egg production and weight, respectively. Also, prediction of cumulative egg production and egg weight in different weeks using Lopez and Weibull models was accurately, respectively. In literature, various models were reported as the best model to describe the egg production curve, which indicates that the appropriate model specific to each breed should be used to evaluate its curve. The overestimation and underestimation of initial and final production using Logistic models were reported in other research that was similar to our findings. The important application of egg production models in poultry is to estimate the economic and genetic value by predicting total egg production from some records, which can be a suitable tool for biological comparisons and interpretations. Conclusion: The results of the present study, showed that the Lopez and Weibull models were the best models to describe the cumulative egg production and egg weight based on four good fit criteria, respectively. Therefore, these models can be used to describe the cumulative egg production and egg weight in Khazak hens. The application of these growth models can be useful to nutritional management and breeding programs to improve and change cumulative egg production and egg weight. Keywords: Cumulative egg production, Inflection point, Lopez model, Modelling, Native hen
- 3. ،همکاران و آروق فرجی مدل از استفاده برازش برای رشد خطی غیر های ... 399 نشریه پ ژوهشهای دامی علوم ایران Homepage: http://ijasr.um.ac.ir پژوهشی مقاله جلد 15 شماره ، 3 پاییز ، 1402 .ص ، 411 - 397 مدل از استفاده خزک مرغ در تخم تولید منحنی برازش برای رشد خطی غیر های آروق فرجی هادی 1،2 * قزاقی محمود ، 3 رکوعی محمد ، 4 :دریافت تاریخ 28 / 03 / 14010 :پذیرش تاریخ 16 / 11 / 1401 چکیده مدل ارزیابی هدف با حاضر پژوهش مناسب انتخاب و خزک مرغ در تخم تجمعی وزن و تولید منحنی توصیف برای رشد خطی غیر های مددل ترین مجموع در .شد انجام رشد خطی غیر ، تخم تولید 365 چهلم تا اول هفته از خزک مرغ پولت تخم گذاری ت از اسدتفاده با .شد استفاده ارزیابی برای و ولیدد تخم وزن مددل شدامل خطدی غیر رشد مدل پنج .شد محاسبه هفته چهل طول در تخم تجمعی وزن و تولید ،هفته هر در شده تولید های ،گمررتدز هدای مناسب و شده برازش تخم وزن و تولید تجمعی رکوردهای روی بر ویبول و لوپز ،ریچاردز ،لجستیک با تخم تجمعی وزن و تولید برای مدل ترین استفاده نتایج .شد تعیین )آکائیک اطالعات معیار و بیزی اطالعات معیار ،خطا مربعات میانگین ،شده تصحیح تبیین (ضریب برازش نکویی معیارهای از داد نشان علی که مدل همه برازش رغم داده روی بر رشد های ویبول و لوپز مدل ،ها به مناسد برازش برازش نکویی معیارهای براساس ترتیب ب بدرای مددل تدرین مرغ در تخم تجمعی وزن و تولید منحنی توصیف مدل در .بودند خزک های تولیدد و اولیه تولید ،لجستیک و گمررتز رشد های نهدایی بده و بدارتر ترتیدب پایین مدل از تر مدل از استفاده با عطف نقطه در تولید میزان و زمان .شد برآورد دیگر های نزدیک ویبول و لوپز های همچندین .بدود واقعدی مقادیر به تر ، پیش مقادیر مقایسه مدل توسط شده بینی ویبول و لوپز مدل دو که داد نشان واقعی مقدار با ها به پیش ترتیب بینی صدحیح هدای وزن و تولیدد بدرای تدری می حاصل نتایج به توجه با .داشتند تخم تجمعی مدل از توان من مطالعه برای ویبول و لوپز رشد های جهدت خزک مرغ در تجمعی تخم وزن و تولید حنی مدیریت تغذیه برنامه و ای .کرد استفاده بار صحت با منحنی تغییر برای نژادی اصالح های واژه :کلیدی های عطف نقطه ،بومی مرغ ،لوپز مدل ،مدلسازی ،تخم تجمعی تولید مقدمه 1 مرغ برای ًرمعمو بومی های تأمین من (دو تخم و گوشت )ظوره می داده پرورش رشد سرعت تجاری نژادهای با مقایسه در و شوند بلوغ سن و بدن پایین وزن ،زیاد کرچی ،کمتر مرغ تخم تولید ،پایین .دارند بار ّاما این با حال ، ویژگی دارای جمله از دیگری ممتاز های ( کمتر چربی و بهتر مزه و طعم با گوشت Haunshi et al., 2022 ،) زرده بزرگ تر ( Lordelo et al., 2020 و پوسته بیشتر ضخامت ،) ( مرغ تخم پوسته بارتر استحکام Emamgholi Begli et al., 1 - دام پژوهشکده ،استادیار .ایران ،زابل ،زابل دانشگاه ،خاص های 2 - دام پژوهشکده ،شترمرغ پژوهشی گروه ،استادیار ،زابدل پژوهشدگاه ،خداص هدای .ایران ،زابل 3 - دانشگاه ،کشاورزی دانشکده ،دامی علوم گروه ،استادیار ،زابل ،زابل .ایران 4 - استاد ،زابل دانشگاه ،کشاورزی دانشکده ،دامی علوم گروه ، ،زابل .ایران *( - :مسئول نویسنده (Email: hadifaraji@uoz.ac.ir DOI: 10.22067/ijasr.2023.77219.1080 2010 می ) به نسبت آن مطلوبیت و قیمت برتری سبب که باشند شده تجاری مرغان بیماری و محیطی شرایط انواع به مقاومت .است برای ساده شرایط به نیاز ،نگهداری جهت کمتر هزینه به نیاز ،ها ویژگی دیگر از بومی مرغان از ارگانیک تولیدات و نگهداری های می بومی نژادهای ( باشد Lee, 2006 .) تخم تولید به تخم تعداد صورت گذاشته های مرغ رنه یک در شده تخم تعداد کل یا در )مدرغ (روز زندده پرنددگان توسط شده تولید های می تعریف )سارنه ،ماهانه ،هفتگی ،(روزانه خاص دوره یک طول شود یا و به تخدم کدل نسبت صورت از تعددادی توسدط شدده تولیدد هدای می بیان حیوانات مدی تولید دوره طول در حیوان یک تخم تولید .شود تواند به باشد نیز تجمعی صورت ؛ انتخداب روش یدک این ،حال این با ( نیست نژادی اصالح و پرورشی اهداف برای Narinc et al., 2013 .) تولید منحنی تخم به تعداد بین رابطه نموداری توصیف صورت تخدم و زمان تخم گذاری می تعریف که شود نشان دهندده کدا بیولدوییکی رایی مدی و بدوده مرغ یک مرغدان در تغذیده مددیریت و انتخداب در تواندد تخم گذار ( باشد مؤثر Fairfull and Gowe, 1990 .)
- 4. 400 جلد ایران دامی علوم پژوهشهای نشریه 15 شماره ، 3 ، پاییز 1402 مرغ در تخم تولید منحنی شیردهی منحنی مشابه شکل نظر از ها مدل و است گاو در مددل برای ناقص گامای مانند هایی ت سدازی ولیدد مدی اسدتفاده شدیر شدود ( Wood, 1967; Gavora et al., 1982; Narinc et al., 2013 .) ،بندابراین مددل توصدیف هدای کنندده شدکل مدل برای شیردهی منحنی سدازگاری نیدز تخدم تولیدد منحنی سازی دارن ( د Wolc et al., 2015 می شیردهی منحنی همانند و ) ندر توان تداوم و تولید اوج بعد کاهش نر ،تولید اوج ،تولید اوج از قبل افزایش مرغان برای تولید تخم گذار به دست آورد ( Grossman et al., 2000; Narinc et al., 2014 اسدتفاده تخدم منحندی برای اغلب که مدلی .) می شود ، می ناقص گامای مدل باشد ، تفسدیر ،سداده ًانسدبت کاربرد زیرا داده با برازش بهترین و آسان دارد ها . عالوه ،براین مدل بده جدز های جملده چند و نمایی ،لجستیک مدل ،شده تصحیح جز به جز ، جز ا ی می استفاده نیز ( شوند Narinc et al., 2014 .) مدل .است طیور صنعت از مهمی بخش تخم تولید ریاضدی هدای مناسب به مدی نشان را مرغ تولید فاز دقیق طور و دهدد مناسدبی ابدزار مقایسه برای می فراهم بیولوییکی تفسیرهای و ها منحندی .کندد هدای ت تولید پیش در خم و مدرغ حدذف مناسدب سن تعیین ،تخم تولید بینی می کمک اقتصادی تصمیمات ( کندد Aggrey, 2002; Savegnago et al., 2012 فرایندهای طریق از ین زیادی تعداد نتیجه تخم تولید .) فیزیولویی و آناتومیکی ،بیوشیمیایی یدک طیور در صفت این .است کی در را توجهی قابل فردی تخم تولید تنوع که است پیچیده کمی صفت دوره تخم گذار می نشان ی ( دهدد Sharifi et al., 2022 مددل .) هدای از بسدیاری تخدم تولیدد منحندی توصدیف بدرای استفاده مورد آماری پشتیبانی را مدیریتی تصمیمات می تخدم تولیدد افدزایش برای تا کنند ( شود استفاده Wolc et al., 2011 مددل از اسدتفاده همچنین .) هدای پیش برای طیور عملی پرورش در ریاضی دوره یک در تخم تولید بینی برای رکوردها از قسمتی از استفاده با دیگر انتخابی دوره هر یا سارنه انتخاب تسهیل برخدوردار بداریی اهمیدت از مولد پرندگان هنگام زود ( اسددت Bindya et al., 2010; Abraham et al., 2017; Ahmadu et al., 2017 مددل از اسدتفاده .) بدرای خطدی غیدر هدای جمعیت در تخم تولید برازش می فراهم را امکان این مختلف های کند بین تخم تولید تا آن ها ترتیب این به .شود مقایسه ، مدی تخدم تولید - رین بین تواند تدا شده مقایسه مرغ نشده انتخاب و شده انتخاب های که تخم تولید منحنی در تغییرات به مدی صدورت انتخاب وسیله ،گیدرد ( شود مطالعه Sharifi et al., 2022 .) مدل نشدان برای مطالعات در ًاعمدت که خطی غیر رگرسیون های شدند استفاده تخم تولید زمان به وابسته تغییرات دادن ، مددل شدامل - آدامز ،نالی مک ،گاما های - تصدحیح جدز بده جدز ، جز به جز ،بل ت سه با تاکما ناروشین توابع و لخورست ،گلور ،لجستیک ،شده هفدت ا مدی بدرآوردی پارامتر ( باشدند Narinc et al., 2014 حدال هدر بده .) ، مدل از استفاده تخم تولید منحنی توصیف برای مطالعات در رشد های ش گزارش کمتر د لگهدورن ندژاد تخدم تولید منحنی بررسی در .است ه مدل ،شده سنتز سفید واقدع بررسدی مورد رشد های براسداس و شدده )(لوپز فلودین مرسر مورگان مدل ،برازش نکویی معیارهای بده عندوان شد گزارش پرنده این در تخم تولید منحنی برازش برای مناسب مدل ( Sharifi et al., 2022 خطدی ،لجستیک ،ریچارد ،گمررتز مدل پنج .) ر دو هفتگدی تخدم تولید روی بر نمایی و ندژاد مدادری و پددری یدن قهدوه داس دبراس دایی دنم مددل و دت دگرف درار دق بدرازش دورد دم دیکا دش ای برازش نکویی معیارهای به تولیدد توصدیف بدرای مناسدب مدل عنوان ( شدد گدزارش ریدن دو ایدن در تخدم Ahmadu et al., 2017 در .) دیگری تحقیق ، مدل از استفاده براز برای رشد های تولیدد منحندی ش مرغ در تخم تجمعی تخم های تخدم گدذار جوجده اجدداد مدرغ و هدای و مورگدان مددل کده شدد گزارش و گرفت قرار بررسی مورد گوشتی پدیش ریچاردز مدل آن متعاقب بیندی صدحیح هدای تخدم تولیدد از تدر و داشتند هفتگی به مناسب عنوان تخدم تولیدد برازش برای مدل ترین مرغ در هفتگی های ( شددند گزارش شده ذکر Darmani Kuhi and France, 2019 .) مدل ،گیاهدان انددازه توصدیف برای اغلب سیگموئیدی رشد های انسان و حیوانات می استفاده زمان طول در ها ( شوند Thornley and France, 2007 مرغ در .) های تخم گذار تخدم تولیدد منحندی شدکل ، است رشد منحنی مشابه تجمعی ؛ ممکدن رشدد مختلف توابع ،بنابراین مدل برای است اسدتفاده مدورد تخم تولید تجمعی تولید منحنی سازی صاف مسیر تجمعی مرغ تخم تولید منحنی .گیرند قرار نسدبت را تدری مدی نشان معمولی مرغ تخم تولید منحنی به صدور در و دهدد عددم ت امر این ،رکورد چند وجود به می قرار تأثیر تحت کمتری میزان و گیدرد داده وقدوع به نسبت کمتری حساسیت دارد شدده گدم یدا پدرت هدای ( Darmani Kuhi and France, 2019 .) پرنده جز خزک مرغ هدای می سیستان اقلیم در بومی سال طول در که باشد طبیعدی انتخداب هدا مدرغ این .است کرده پیدا سیستان شرایط با خوبی سازگاری بده دلیدل کوتاه پاهای داشتن به بسدیار مدرغ این جثه .است گرفته نام خزک نام مدی کم رشد دارای و بوده کوچک تخدم تولیدد جهدت بیشدتر و باشدد می نگهداری الگوی اینکه به توجه با .شود تخم گذار جمعیدت در ی هدا م می تفاوت از استفاده و باشند مددل الگدوی توصدیف جهدت مناسدب تخم گذاری نر بهتر درک برای تخم گذاری برنامده ، تغذیده هدای و ای می ضروری نژادی اصالح .باشد ،بنابراین بررسی هدف با پژوهش این مدل تخم تجمعی وزن و تولید نر توصیف برای رشد های انتخداب و خز مرغ در مدل مناسبترین .شد انجام ک
- 5. ،همکاران و آروق فرجی مدل از استفاده برازش برای رشد خطی غیر های ... 401 جدول 1 - استفاده مورد جیره مغذی مواد و )(درصد ترکیب )(درصد Table 1- Composition (%) and nutrients of the used diet (Percentage) خوراک اجزای Ingredient ترکیب Composition ذرت Corn 62.75 ( سویا کنجاله 44 )خام پروتئین درصد Soybean meal (44% CP) 18.05 فسفات کلسیم دی Dicalcium phosphate 0.90 ذرت گلوتن Gluten Meal 1.88 آهک سنگ Limestone 9.85 سدیم بیکربنات Sodium bicarbonate 0.31 نمک NaCl 0.28 معدنی مکمل 1 Mineral premix 0.25 ویتامینه مکمل 2 Vitamin premix 0.25 ال دی - متیونین DL- Methionine 0.13 ال - ریزین L-Lysine 0.10 روغن Oil 0.75 شده محاسبه شیمیایی ترکیبات Calculated chemical composition ( متابولیسم قابل انریی ک ی لوکالر )کیلوگرم /ی Metabolizable energy (kcal/kg) 2800 )(درصد خام پروتئین Crude protein (%) 16.00 )(درصد لیزین Lysine (%) 0.78 )(درصد متیونین Methionine (%) 0.38 )(درصد سیستئین + متیونین Methionine + cysteine (%) 0.64 )(درصد کلسیم Calcium (%) 4.00 فسفر قابل دسترس )(درصد Available phosphorus (%) 0.30 1 جیره کیلوگرم هر در را موارد این معدنی مکمل تأمین :نمود 65 میلی منگ گرم نز 65 ؛ 55 میلی روی؛ گرم 50 میلی آهن؛ گرم 8 میلی مس؛ گرم 8 / 1 میلی یدد؛ گرم 30 / 0 میلدی سدلنیم؛ گدرم 20 / 0 میلی و کبالت گرم 16 / 0 میلی .مولیبدن گرم 2 در موارد این ویتامینه مکمل ک هر ی لوگرم :نمود تأمین جیره 11500 المللی بین واحد ویتامین A ؛ 2100 ک کوله المللی بین واحد لسیفرول؛ 22 ویتدامین المللی بین واحد E ویتدامین ؛ 12 B ، mg 60 / 0 ،ریبوفالوین ؛ mg 4 / 4 ؛ 40 میلی نیکوتین گرم آمید؛ 35 میلی پنتوتنات؛ کلسیم گرم 50 / 1 میلی منادیون؛ گرم 80 / 0 میلی اسدید؛ فولیدک گرم 3 میلدی تیدامین؛ گدرم 10 میلدی گدرم پیریدوکسین؛ 1 میلی بیوتین؛ گرم 560 میلی گ و کلراید کولین رم 125 میلی اتوکسی گرم .کوئین 1 Mineral premix provided per kilogram of diet: 65 mg Mn; 50 mg Fe; 8 mg Cu; 1.8 mg I; 0.30 mg Se; 0.20 mg Co; and 0.16 mg Mo. 2 Vitamin premix provided per kilogram of diet: 11,500 IU vitamin A; 2,100 IU cholecalciferol; 22 IU vitamin E; 0.60 mg vitamin B12; 4.4 mg riboflavin; 40 mg nicotinamide; 35 mg calcium pantothenate; 1.50 mg menadione; 0.80 mg folic acid; 3 mg thiamine; 10 mg pyridoxine; 1 mg biotin; 560 mg choline chloride; and 125 mg ethoxyquin. موا روش و د ها دام پژوهشکده در حاضر پژوهش واقع زابل پژوهشگاه خاص های .شد انجام زهک شهرستان در زهدک شهرستان بدا مختصدات طدول جغرافیایی 61 درجه و 31 دقیقه شرقی و عرض جغرافیایی 30 درجه و
- 6. 402 جلد ایران دامی علوم پژوهشهای نشریه 15 شماره ، 3 ، پاییز 1402 55 دقیقه ،شمالی در ارتفاع 480 متری از سطح دریا قرار گرفته اسدت هوای و آب دارای و گرم و خشک میانگین با دراز مدت بارندگی پنجاه پنج و میلی متر به خزک مرغ .است طدی در سیسدتان بومی مرغ عنوان دام پژوهشکده در آن پایه نسل اخیر دهه سه خداص هدای پژوهشدگاه به می نگهداری سالن در صنعتی صورت سدال از و شدوند 1394 ثبدت دال دس از و دده دش داز دآغ دده دپرن دن دای درای دب دجره دش 1396 دورد درک دت دثب می انجام نیز باروری صفات ،رشد صفات ،تولیدتخم انجام جهت .گیرد برنامه و نژادی اصالح کارهای در صفات ینتیکی ارزیابی ،انتخاب های مدی ضدروری انتخداب معیار تعیین جهت دسترس بررسدی لدذا .باشدد پارامترهدای دارای کده مناسدب مددل از استفاده با تخم تولید منحنی قابل می بیولوییک توجیه می ،باشد در تولیدد منحنی بهتر فهم در تواند به مدل پارامترهای همچنین و بوده مؤثر پرنده این مهدم صفات عنوان برنامه در پولت مرکز این در .گیرد قرار نظر مد نژادی اصالح های های دام پژوهشدکده پرورشدی گلده در خزک شدروع از قبدل خداص هدای تخم استف با گذاری پالک از اده شدماره پا فلزی های در و شدده گدذاری قفس ابعاد به های 3 × 3 قطعه شش و خروس قطعه یک نسبت به متر غدذا و آب بده پرنددگان همه آزمایش طول در .شدند داده انتقال مرغ به تخدم جیدره از اسدتفاده با و داشتند دسترسی آزاد طور آردی گدذاری حاوی )(مش 2800 کیلوگ بر کیلوکالری و متابولیسدم قابدل اندریی رم 16 استفاده جیره مغذی مواد و ترکیب .شدند تغذیه خام پروتئین درصد جدول در شده 1 تله قفس هر در .است شده آورده تخدم هدای گدذاری به مرغ هر برای روزانه تخم تولید تا شد داده قرار ثبت جداگانه صورت .گردد هفتگ تخم تولید ،روزانه تخم تولید براساس محاسدبه پرندده هر ی تخم تولید ،هفته هر در تخم تجمعی تولید محاسبه برای سرس و شده بده منجدر این .شد جمع ماقبل هفته تخم مجموع با هفته آن هفتگی می یکنواخت افزایشی منحنی یک اغلب که شود به سیگموئیدی شکل می کاهشی فاز یک و افزایشی فاز یک با نقطده در فداز دو ایدن .شدود عطف داشته تندی شیب تخم تولید نقطه این در که شده وصل هم به تجمعدی وزن محاسبه برای روند همین .است تولید اوج به مربوط که شد استفاده نیز تخم ، تخم وزن مجموع یعنی هدر در شدده تولیدد های تخم وزن مجموع با هفته هفته در شده تولید های جمدع ماقبدل هدای .شد مجموع در ، تو رکوردهای تخم لید 365 اول هفتده از خدزک پولت چهلم تا تخم گذاری فروردین از که 1396 خدرداد تا 1400 جمدع آوری تخدم تجمعدی وزن و تولیدد منحنی تحلیل و تجزیه برای ،بودند شده شد استفاده . و تولید محاسبه از بعد و هفتده در تخم تجمعی زن مختلدف هدای لجسدت ،(گمررتدز رشدد مدل پنج ،مرغ هر برای و لدوپز ،ریچداردز ،یک .شدد بدرازش تخدم تجمعدی وزن و تولیدد رکوردهای روی بر )ویبول مدل معادله استفاده مورد های به صورت معادرت :بودند زیر معادله ( 1 ( گمررتز مدل :) Gompertz, 1825 ) معادله ( 2 لجستیک مدل :) ( Robertson, 1908 ) معادله ( 3 ریچاردز مدل :) ( Richards, 1959 ) معادله ( 4 لوپز مدل :) ( Lopez, 2000 ) معادله ( 5 ویبول مدل :) ( Weibull, 1951 ) در معادله های ،بار W : تجمع وزن و تولید هفته در تخم ی t ، 0 W ، f W و k : به نها مجانبی تخم تولید ،اولیه تخم تولید ترتیب ی ضریب و ی مدی نسبی رشد پارامترهدای .باشدد b و m : بده موقدع در سدن ترتیدب به دست می نشان را شکل پارامتر و تولید حداکثر نصف آوردن .دهند مدل مقایسه برای زیر برازش نکویی معیار چهار از رشد های مورد مناسب انتخاب و مطالعه وزن و تولیدد منحنی توصیف برای مدل ترین :شد استفاده تخم تجمعی معادله ( 6 ) معادله ( 7 ) معادله ( 8 ) معادله ( 9 ) در معادرت 6 تا 9 ، : ،شده تصحیح تبیین ضریب n و k : به می نشان را مدل پارامترهای و مشاهدات تعداد ترتیب .دهند : ضریب که است تبیین به صورت 1-(SSE/SST) می محاسبه که شود SSE : خطا مربعات جمع و SST : می کل مربعات جمع همچنین .باشد MSE ، AIC و BIC : به اطالعدات معیار ،خطا مربعات میانگین ترتیب می نشان را بیزی اطالعات معیار و آکائیک .دهد مدل تمام روی بدر ها دته دبس از دتفاده داس دا دب دی دتجمع وزن و دم دتخ دد دتولی دای درکورده nlme ( Pinheiro et al., 2014 نرم ) افزار R (نسخه 4 - 1 - 2 و شده برازش ) بدا عطدف نقطده در تولیدد و زمدان ،مدل هر پارامترهای از استفاده با فرمول از استفاده جدول های 2 مددل بدرازش از بعد .شدند برآورد ،هدا مدل توسط مختلف سنین برای تجمعی تولید مقادیر پیش ها شده بینی منح و پیش مقادیر نی طدول در واقعدی مقدادیر با شده بینی 40 هفتده .گرفت قرار مقایسه مورد
- 7. ،همکاران و آروق فرجی مدل از استفاده برازش برای رشد خطی غیر های ... 403 جدول 2 - محاسبه فرمول ( زمان i t ( تولید و ) i p نقطه در ) مدل در عطف رشد مختلف های wth models ) at inflection point in different gro i ) and production (p i time (t Calculation formula of - 2 Table مدل Model عطف نقطه در زمان i t عطف نقطه در تولید i p گمررتز Gompertz لجستیک Logistic ریچادز Richards لوپز Lopez ویبول Weibull * W0 ، Wf ، k ، m و b به مجانبی تخم تولید ،اولیه تخم تولید ترتیب نهایی شک پارامتر ،نسبی رشد ضریب ، موقع در سن و ل به دست .هستند تولیدی تخم حداکثر نصف آوردن * W0, Wf, k, m and b are initial egg production, asymptotic egg production, coefficient of relative growth, the shape parameter, and the age at approximately half maximum egg production, respectively. بحث و نتایج مدل برازش نکویی معیارهای روی بدر شدده بدرازش مختلف های جددول در تخم تجمعی وزن و تولید رکوردهای 3 .اسدت شدده آورده مدل شدده تصدحیح تبیدین ضدریب معیدار لحدا از شده برازش های بود هم به نزدیک ، به طوری که مدل همه تبیین ضریب مقدار دارای ها شده تصحیح 70 مقددار و تخدم تجمعی تولید برای درصد 68 درصدد ،بدرازش نکدویی معیارهدای سایر برای .بودند تخم تجمعی وزن برای مدل بین تفاوت حددودی تدا بدرازش نکدویی معیارهدای لحدا از هدا مقددار بدارترین لجستیک مدل .بود آشکارتر MSE و تولیدد بدرای را داشت تخم تجمعی وزن ، درحالی که مددل که لد هدای از ویبدول و وپز معیار این لحا به کمتدرین تجمعدی تخدم وزن و تولیدد بدرای ترتیب همچنین .بودند مقدار ، مقددار بدارترین دارای اخیر مدل دو این نشان که بودند هم دهنده مدل بودن مناسب های بدرای ویبدول و لوپز مرغ در تخم تجمعی وزن و تولید منحنی توصیف نس خزک های به بت مدل سایر معیار مشابه .بود مطالعه مورد های MSE معیارهدای مقدار ، AIC و BIC وزن و تولیدد منحندی توصدیف در لجستیک مدل برای بود مقدار بارترین تخم تجمعی ، ّاما مدل برای معیارها این مقدار هدای مدل سایر به نسبت ویبول و لوپز پایین ها .بود تر ،بنابراین بده توجده با چ منحنی توصیف برازش برای لجستیک مدل ،برازش نکویی معیار هار مرغ در تخم تجمعی وزن و تولید مددل سدایر به نسبت خزک های هدا بود نامناسب ، ّاما توصدیف بدرای ویبدول مددل آن متعاقب و لوپز مدل برای لوپز مدل آن متعاقب و ویبول مدل و تخم تجمعی تولید منحنی تجمعی وزن منحنی توصیف مرغ در تخم خزک ها به مدل عنوان هدای می مناسب .باشند مقدار مدل برای حاضدر پدژوهش در مطالعه مورد رشد های زیر 71 به درصد گدزارش از برخی به نسبت که آمد دست سدایر در هدا دژوهش دپ دایین دپ دا ده دی دم در دت ( دد دباش Fairfull and Gowe, 1990; Darmani Kuhi et al., 2003; Narinc et al., 2010; Sharifi ., 2022 et al ) مشدابه مقادیر ،حال هر به . منحندی بررسدی در در تخم تولید قهوه نژاد مادری و پدری رین دو شیکا ای شدد گزارش ( ., 2017 et al Ahmadu می که عواملی .) مقدار بر تواند برآورد می تأثیر مطالعات در شده مستقل متغییر مقادیر دامنه از عبارتند ،گذارد تکدرار تعدداد ،آن دامنده داخل در وابسته متغییر مقادیر ترتیب ،)(زمان مشاهدات از یدک هدر در وابسدته متغییدر مقددار تندوع ،وابسته متغییر ( مسدتقل متغییدر مقدادیر Cornell and Berger, 1986 ،بندابراین .) ندوع همچندین و مختلدف مطالعات در شده ذکر عوامل بودن متفاوت می )تخم تولید یا (رشد منحنی بدرای متفداوت برآوردهدای دلیل تواند مق دار .باشد مرغ تخم وزن و تخم تولید منحنی مطالعه در هدای مدل سفید لگهورن )لدوپز (مددل فلدودین مرسدر مورگدان و گویا های به به ترتیب مناسب عنوان و تخم تولید منحنی توصیف برای مدل ترین ( شد معرفی تخم وزن Sharifi et al., 2022 ه .) تحقیدق در مچندین آن متعاقدب و گویا مدل ،گوشتی مادر مرغ تخم تولید منحنی روی بر جمله چند مدل مدل با مقایسه در ای و دوم درجه ،لوپز ،لجستیک های ( دت دداش درازش دب درین دبهت دیدی دسینوس Abraham and Murthy, 2017 .)
- 8. 404 جلد ایران دامی علوم پژوهشهای نشریه 15 شماره ، 3 ، پاییز 1402 جدول 3 - مدل برازش نکویی معیارهای ه شده برازش رشد ای Table 3- The goodness of fit criteria of fitting growth models مدل Model خطا مربعات میانگین * MSE آکائیک اطالعات معیار AIC بیزی اطالعات معیار BIC شده تصحیح تبیین ضریب تخم تجمعی تولید Cumulative egg production گمررتز Gompertz 166.271 87050.03 87079.23 70.42 لجستیک Logistic 168.773 87213.54 87242.75 69.97 ریچادز Richards 164.790 86953.12 86989.62 70.68 لوپز Lopez 164.639 86943.04 86979.54 70.71 ویبول Weibull 164.761 86951.15 86987.65 70.68 تخم تجمعی وزن Cumulative egg weight گمررتز Gompertz 297527.90 170892.10 170921.30 68.47 لجستیک Logistic 301270.30 171030.40 171059.70 68.08 ریچادز Richards 295590.70 170820.80 170857.40 68.69 لوپز Lopez 295841.90 170830.20 170866.80 68.65 ویبول Weibull 295576.50 170820.30 170856.80 68.68 * میان ( خطا مربعات گین MSE ( آکائیک اطالعات معیار ،) AIC ( بیزی اطالعات معیار ،) BIC ( شده تصحیح تبیین ضریب و ) ) * Mean square error (MSE), Akaike information criterion (AIC), Bayesian information criterion (BIC), and adjusted coefficient of determination ( ) روی بدر نمدایی و خطدی ،ریچداردز ،گمررتدز ،لجستیک مدل پنج در تخم وزن منحنی قهوه نژاد مادری و پدری رین دو مدورد شیکا ای ریچاردز مدل و گرفت قرار مطالعه به مناسب عنوان بدرای مددل تدرین ( شد گزارش رین دو در تخم وزن منحنی توصیف Ahmadu et al., 2017 می حاضر تحقیق نتایج بودن متفاوت دلیل .) تواند به تفاوت دلیل مدل ،مطالعه مورد نژاد و گونه در ،تحقیدق هدر در بررسدی مدورد های برنامده و انتخداب ،پرندده هدر از اسدتفاده مورد مشاهدات میزان هدا ی ت مدیریت و مطالعه مورد پرنده در شده انجام نژادی اصالح غذیه ای در نتیجه در و شده تولید منحنی در تغییر باعث که باشد مطالعه هر ، مدل در مختلدف مطالعدات در تفداوت .باشدد متفاوت نژاد هر برای مناسب مناسب معرفی نژادهدای در تخدم محندی توصدیف بدرای مددل تدرین می نشان مختلف و بدوده متفداوت ندژادی هر در تولید منحنی که دهد م بررسی برای آن خداص مناسدب مددل از باید نژاد هر در تولید نحنی از استفاده که آنجایی از .کرد استفاده نژاد به تنهدایی بده عندوان است پرمخاطره برازش نکویی معبار ، معیارهدای سدایر از باید بنابراین کندار در نیز دیگر کدرد اسدتفاده مناسدب مددل انتخداب بدرای ( Cornell and Berger, 1986 ) ، بدرای نیدز دیگدر معیار سه بنابراین مناسب مدل انتخاب عالوه بر .شد استفاده جدول 4 مدل شده برآورد پارامترهای تجمعی وزن و تولید برای ها نشان را تخم می ( اولیه تولید میزان برای شده برآورد مقادیر .دهد 0 W ) مددل توسط بدود واقعدی مقددار از بدارتر لجسدتیک و گمررتدز هدای ، درحالی که مدل در اولیه تولید میزان کمتدر ویبول و لوپز ،ریچاردز های نهدا تخدم تولیدد بدرای روندد این .شد برآورد واقعی مقدار از ی ( ی f W ) بود اولیه تولید میزان برعکس ، به طوری که نهدا تولید مقدار ی بدرآورد ی ت شده مدل وسط دیگدر مددل دو از بیشدتر ویبول و لوپز ،ریچاردز های پارامتر مقدار .بود k مدل سایر از بارتر لوپز مدل در کمتدرین و بدود ها تخم تجمعی تولید برای ویبول مدل توسط پارامتر این مقدار به دسدت تولیدد مشدابه پارامترهدا بدرآورد روند نیز تخم تجمعی وزن برای .آمد تخم تجمعی بود ، به نحوی ( اولیده تولیدد میدزان کده 0 W مددل در ) هدا مدل سایر از بارتر لجستیک و گمررتز تخدم تولیدد مقددار و ها نهدایی
- 9. ،همکاران و آروق فرجی مدل از استفاده برازش برای رشد خطی غیر های ... 405 ( f W پایین ) مدل سایر از تر همچندین .شدد بدرآورد هدا ، پدارامتر مقددار ( نسبی رشد ضریب k مددل سدایر از بدارتر لدوپز مددل توسط نیز ) هدا شد برآورد ، ّاما تول مشابه مقددار ترین پایین ،تخم تجمعی ید k مربدوط .بود ویبول مدل به جدول 4 - مدل شده برآورد پارامترهای تجمعی تخم وزن و تخم تولید برای رشد مختلف های Table 4- Estimated parameters of different growth models for cumulative egg production and egg weight مدل Model * E S ± 0 W SE ± f W k±SE m±SE b±SE تخم تجمعی تولید Cumulative egg production گمررتز Gompertz 6.488±0.218 98.513±1.838 0.063±0.001 - - لجستیک Logistic 8.695±0.189 83.210±0.953 0.116±0.002 - - ریچادز Richards 3.044±0.563 150.000±19.475 0.023±0.005 -0.767±0.088 - ل وپز Lopez 2.704±0.765 298.211±74.425 1.107±0.067 - 100.000±34.952 ویبول Weibull 3.139±0.683 150.000±21.200 0.019±0.004 1.146±0.055 - تخم تجمعی وزن Cumulative egg weight گمررتز Gompertz 236.300±8.832 4031.000±83.640 0.061±0.002 - - لجستیک Logistic 321.800±7.655 3345.000±41.180 0.115±0.002 - - ریچادز Richards 119.900±21.770 6000.000±818.900 0.024±0.006 -0.689±0.095 - لوپز Lopez 150.400±25.940 8000.000±1129.000 1.300±0.069 - 57.100±10.640 ویبول Weibull 127.300±26.940 5874.000±825.200 0.020±0.003 1.208±0.059 - * 0 W ، f W ، k ، m و b : به مجانبی تخم تولید ،اولیه تخم تولید ترتیب نهایی موقع در سن و شکل پارامتر ،نسبی رشد ضریب ، به دست هسدتند تولیددی تخم حداکثر نصف آوردن ; SE : استاندارد خطای * W0, Wf, k, m and b are initial egg production, asymptotic egg production, coefficient of relative growth, the shape parameter, and the age at approximately half maximum egg production, respectively. SE: Standard error. باری برآورد 0 W پایین و f W بررسدی در لجسدتیک مددل توسط جوجده در رشد منحنی هدای CCGP ( Michalczuk et al., 2016 ،) جوجه ( خزک های Fairfull and Gowe, 1990 کده شد گزارش نیز ) .بود تخم تجمعی وزن و تولید منحنی برای حاضر تحقیق نتایج مشابه پایین ت ر برآورد ین 0 W ریچداردز مددل توسدط تخم تجمعی وزن برای به دست یافته مشابه که آمد ه ( بدود دیگر مطالعات ای Masoudi and Azarfar, 2017 در تخدم تجمعدی وزن و تولیدد منحنی بررسی در .) مرغ های تخم گذار و جوجه اجداد مرغ بار برآورد نیز گوشتی های 0 W مدل با پایین برآورد و گمررتز و لجستیک های 0 W مدل با و لوپز های گزارش ریچاردز یافتده مشابه که شد مدی حاضدر تحقیدق هدای باشدد ( Darmani Kuhi and France, 2019 .) مددل بدا شدده بدرآورد عطدف نقطه در تولید میزان و زمان هدای جددول در تخم تجمعی وزن و تخم تولید برای رشد مختلف 5 نشدان برای شده برآورد مقادیر .است شده داده نقطده در تولید میزان و زمان مددل بدا تخم تجمعی تولید عطف لدوپز و لجسدتیک هدای بده ترتیدب عطدف نقطده در تولیدد و زمدان مقددار .بود مقدار کمترین و بارترین لوپز مدل با شده برآورد به و پدنجم هفته در ًاتقریب که آن واقعی میزان می اتفاق ششم نزدیک ،افتد بارترین اگرچه .بود تر تولید میزان و زمان لجستیک مدل توسط تخم تجمعی وزن برای عطف نقطه در به دسدت آمد ، ّاما که بود ویبول مدل به مربوط آن مقدار کمترین به واقعی مقدار نزدیک نیز .بود تر
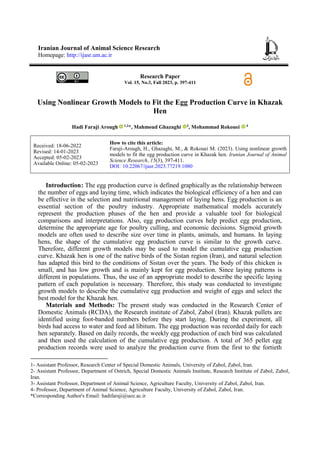
- 10. 406 جلد ایران دامی علوم پژوهشهای نشریه 15 شماره ، 3 ، پاییز 1402 جدول 5 - ( زمان i t ( تولید و ) i p نقطه در ) مدل با شده برآورد عطف رشد های ) at inflection point by growth models i ) and production (p i Estimated time (t - Table 5 مدل Model تخم تجمعی تولید Cumulative egg production تخم تجمعی وزن Cumulative egg weight )(هفته عطف نقطه در زمان i t (wk) )(تعداد عطف نقطه در تولید (number) i p )(هفته عطف نقطه در زمان (wk) i t ت ( عطف نقطه در ولید گرم ) (g) i p گمررتز Gompertz 15.88 36.24 17.09 1482.92 لجستیک Logistic 18.52 41.60 19.48 16.72.5 ریچادز Richards 9.29 22.45 12.61 1101.42 لوپز Lopez 6.77 16.98 11.92 1055.77 ویبول Weibull 8.72 20.71 11.66 1036.29 منحنی در عطف نقطه سیگموئیدی های بیانگر ز مانی ا ست که فا ز سریع دد درش متوقف و فا ز کند آ غا ز می شو .د همچنین ا ین ز ما ن لح ه - ا ای ست که حد ا کثر نر ا فز ا یش دد دتولید ر می د ( هد Roush and Branton, 2005 ) . واقع در ، و شده وصل هم به عطف نقطه در فاز دو ش تولید نقطه این در اسدت تولیدد اوج بده مربدوط که داشته تندی یب ( Darmani Kuhi and France, 2019 .) تحقیق این در ، نقطه زمان جددول ،لوپز (مدل مناسب مدل توسط تخم تجمعی تولید برای عطف 3 هفتم و ششم هفته بین ) به دست تجمعدی تولید مدت این تا که آمد تخم 98 / 16 بیافتدد اتفاق دیرتر عطف نقطه زمان چه هر .است تخم ، می سالیانه تولید در تواند تأثیر مدرغ تولیدد پیدک زمدان .بگدذارد هدای مک و گاما مدل توسط فایومی نالی به ترتیب 5 / 15 و 25 / 15 بعد هفته ( اسدت شدده گزارش تولید Mahmoud et al., 2021 بدارتر کده ) از یافته تولید از پس هفتم هفته هرحال به .بود حاضر تحقیق ها به عنوان ( گوشتی مادر مرغ برای پیک زمان Otwinowska-Mindur et al., 2016 ( نگرا کاستالنا مرغ و ) Miguel et al., 2007 که شد گزارش ) یافت مشابه ه .است حاضر تحقیق های پیش و واقعی مقادیر مدل توسط شده بینی در رشدد مختلدف های هفته تخدم تجمعی وزن و تولید برای تولید مختلف های بده در ترتیدب شکل های 1 تا 4 همان .است شده آورده مدی مشداهده کده طور شدود ، پیش مقادیر مدل توسط شده بینی در ریچاردز و لجستیک ،گمررتز های ا هفته اواخر و وایل .دارندد تفداوت واقعدی مقددار بده نسبت تولید های ،بنابراین مدل این را تخم تجمعی تولید منحنی ها بده صدحیح طدور تدر نمی پیش توانند پدیش مقادیر .کنند توصیف و بینی توسدط شدده بیندی مدل هفتده در آن واقعدی مقدادیر بده ویبول و لوپز های مختلدف هدای نزدیک و بوده تر ب ه خصوص پیش مقادیر که لوپز مدل برای به آن بینی نزدیک واقعی مقادیر (شکل است تر 2 پیش تخم تجمعی وزن برای .) - مدل توسط شده بینی مددل ،مختلدف های لجسدتیک و گمررتدز هدای (شکل 3 ) به پیش ترتیب بینی پایین و بارترین های مقدار به نسبت تری هفته انتهای و ابتدا در واقعی ت های دارد ولید ، ّاما مدل برای دیگدر های (شکل 4 پیش مقادیر ) .اسدت نزدیک واقعی مقادیر به نسبت شده بینی مقادیر ،ویبول و لوپز ،ریچاردز مدل سه در پیش بیندی اوایدل در شدده نزدیک ویبول مدل برای هفته دو بده نسدبت و بوده واقعی مقدار به تر لوپز و ریچاردز مدل به صحیح طور منحند تدر را تخدم تجمعدی وزن ی پیش می بینی .کند مدل در پیش مقادیر که هایی فواصل در واقعی مقادیر با شده بینی مدل از بهتر ،دارند تفاوت کوتاهتری می هایی آن تفاوت که باشند در ها طورنی فواصل می اتفاق تر ( افتد Adenaike et al., 2017 ایدن در .) تحق پیش مقادیر بین تفاوت نیز یق مددل در واقعی مقادیر با شده بینی در تخم تجمعی وزن برای ویبول مدل و تخم تجمعی تولید برای لوپز زمان از بسیاری پدیش مقدادیر مقایسه در .داشت انطباق باهم ها بیندی ( ایتالیا بومی مرغ پنج در بدن وزن واقعی مقدار با شده Rizzi et al., 2013 ( خزک مرغ و ) Fairfull and Gowe, 1990 ) کده شد گزارش پدایین را نهدایی وزن و حد از بارتر را ابتدایی وزن لجستیک مدل تدر پیش مدی بیندی ،داشدت مطابقدت حاضدر تحقیدق نتدایج بدا کده کندد به طوری ابتدد در تفاوت این لجستیک مدل در که نمودارهدا انتهدای و ا پیش مقادیر بین .است مشهود ًالکام واقعی و شده بینی مهم مددل کاربرد ترین ارزش بدرآورد طیدور در تخدم تولیدد هدای پدیش توسط ینتیکی و اقتصادی از بخشدی از تخدم تولیدد کدل بیندی ( است رکوردها Sharifi et al., 2022 مددل .) ریاضدی هدای مناسدب به به را مرغ تولید فاز کل دقیق طور توجیده قابدل پارامترهدای صورت می و داده نشان بیولوییکی به تواند هدر بدرای جداگانده صدفات عنوان .شود استفاده بیولوییکی تفسیرهای و مقایسات برای پرنده
- 11. ،همکاران و آروق فرجی مدل از استفاده برازش برای رشد خطی غیر های ... 407 شکل 1 - پیش و واقعی تخم تجمعی تولید مقادیر مدل توسط شده بینی گمرر های هفته در لجستیک و تز مختلف های Figure 1- Actual and predicted values of cumulative egg production by Gompertz and Logistic models in various weeks شکل 2 - پیش و واقعی تخم تجمعی تولید مقادیر مدل توسط شده بینی هفته در ویبول و لوپز ،ریچاردز های مختلف های Figure 2- Actual and predicted values of cumulative egg production by Richards, Lopez and weibull models in various weeks
- 12. 408 جلد ایران دامی علوم پژوهشهای نشریه 15 شماره ، 3 ، پاییز 1402 شکل 3 - پیش و واقعی تخم تجمعی وزن مقادیر مدل توسط شده بینی هفته در رشد لجستیک و گمررتز های مختلف های Figure 3- Actual and predicted values of cumulative egg weight by Gompertz and Logistic models in various weeks شکل 4 - پیش و واقعی تخم تجمعی وزن مقادیر مدل توسط شده بینی هفته در ویبول و لوپز ،ریچاردز های مختلف های Figure 4- Actual and predicted values of cumulative egg weight by Richards, Lopez and weibull models in various weeks عالوه مرغ فردی تولید اینکه به عنایت با ،براین وضدعیت مؤیدد ها می ،است گله تولیدی یهینه راستای در تواند هزینده منابع شدن تر و ای برنامده بدرای شدده یاد صفات از گله تولید نمودن بهینه اصدالح هدای ک استفاده آینده در نژادی چرخده از دقیق تحلیل و تجزیه همچنین .رد و درده دک دراهم دف را دان دزم دول دط در دی دمنحن دل دمراح دیف دتوص ،دد دتولی پیش پیش ،تولید بینی بلند بینی برنامده و ،تولیدد عملکدرد مددت ریدزی می تسهیل را گیری تصمیم و تولید اقتصادی کندد ( Yang and Wu, 1989; Groen et al., 1998 ) . مدل امروزه دستگاه در رشد های های ویژه اهمیت زیستی مطالعده و تحلیدل و تجزیده طریدق از و داشته ای منحنی آن رشدد مراحل تا دارد وجود امکان این طیور در رشد های هدا شناخته رشد قوانین با داده انطباق شده آن کمک به تا ،شده برنامده ها - های تغذیه و مدیریتی بده .گردد ارائه پرورش اثرات و بهبود جهت ای - منحنی از عالوه می رشد های نیدز ینتیکی پتانسیل ارزیابی جهت توان ( نمود استفاده Aggrey, 2000 نشدان تولیدکنندده بده منحنی شکل .) می دارد وجدود تغذیده برنامده تغییدر بده نیدازی آیا که دهد .نددارد یدا می منحنی ینتیکی توصیف همچنین اسدتراتژی تعیدین در تواندد هدای به انتخاب برنامه در .باشد مفید منحنی شکل تغییر منظور اصدالح های می منحنی شکل از آگاهی نژادی تصدمیماتی بدرای مناسبی ابزار تواند
- 13. ،همکاران و آروق فرجی مدل از استفاده برازش برای رشد خطی غیر های ... 409 کد باشد مدی اتخداذ بعدد نسدل انتخداب بدرای ه گدردد ( Akbas and Yaylak, 2000 ) . نتیجه کلی گیری مددل کلیده کده داد نشان حاضر پژوهش نتایج مدورد رشدد هدای مطالعه به بدرازش تخدم تجمعدی وزن و تولیدد رکوردهای روی خوبی مدل برازش نکویی معیار چهار براساس .شدند ویبدول و لدوپز های بده مناسب ترتیب تولید منحندی توصیف برای مدل ترین تجمعدی وزن و د نسدبت بارتری صحت با مذکور مدل دو همچنین .شدند انتخاب تخم مدل سایر به پیش را واقعی تخم تجمعی وزن و تولید های .کردند بینی ،بنابراین می مدل دو این وزن و تولیدد منحندی توصدیف بدرای تواندد مدل این کاربرد .شود استفاده خزک مرغ در تخم تجمعی در رشد های مدی تغذیه ریت پیش و ای در تخدم وزن و تعدداد از تجمعدی تولید بینی مدرغ فدردی تولیدد آنجدایی از و بدود خواهدد مفیدد طیور پرورش هدا نشان دهنده می صفات این ،است گله تولیدی وضعیت در تواند ب هینه تر هزینه منابع شدن برنامه برای گله تولید نمودن بهینه و ای اصالح های آینده در نژادی از مناسدب مددل پارامترهدای همچندین .شود استفاده می نیز عطف نقطه در تولید و زمان جمله تواند به در مهم صفات عنوان برنامه وزن و تولیدد منحندی تغییدر و بهبدود جهت نژادی اصالح های .گیرند قرار مدنظر تخم تجمعی سپاسگزاری دام پژوهشکده از نویسندگان در همکاری بابت خاص های اجدرای صمیمانه پژوهش این تشکر می قدردانی و حمایدت بدا طرح این .شود :طدرح شدماره .اسدت شده انجام زابل دانشگاه پژوهشی معاونت مالی PR-UOZ-1400-8 . References 1. Abraham, B. L., & Murthy, H. N. N. (2017). Egg production curves and their prediction through mathematical models in a randombred broiler breeder control population. Indian Journal of Poultry Science, 52, 16–21. 2. Adenaike, A. S., Akpan, U., Udoh, J. E., Wheto, M., Durosaro, S. O., Sanda, A. J., & Ikeobi, C. O. N. (2017). Comparative Evaluation of Growth Functions in three broiler strains of Nigerian chickens. Pertanika Journal of Tropical Agricultural Science, 40(4), 611-620. 3. Aggrey, S. E. (2002). Comparison of three nonlinear and spline regression models for describing chicken growth curves. Poultry Science, 81, 1782–1788. https://doi.org/10.1093/ps/81.12.1782. 4. Ahmadu, A., Kabir, M., Iyiola-Tunji, A. O., Akinsola, O. M., & Igbadun, H. (2017). Mathematical modelling of egg production curves of Shikabrown_ parents. Nigerian Journal of Animal Production, 44, 61–75. https://doi.org/10.51791/njap.v44i1.432. 5. Akbas, Y., & Yaylak, E. (2000). Heritability estimating of growth curve parameters and genetic correlation between the growth curve parameters and weights at different age of Japanese quail. Archiv fur Geflugelkunde, 64(4), 141- 146. 6. Bindya, L. A., Murthy, H. N. N., Jayashankar, M. R., & Govindaiah, A. M. (2010). Mathematical models for egg production in an Indian colored broiler dam line. International Journal of Poultry Science, 9, 916–919. https://doi.org/10.3923/ijps.2010.916.919. 7. Darmani Kuhi, H., & France, J. (2019). Modelling cumulative egg production in laying hens and parent stocks of broiler chickens using classical growth functions. British Poultry Science, 60(5), 564-569. https://doi.org/10.1080/00071668.2019.1622080. 8. Darmani Kuhi, H., Kebreab, E., Lopez, S., & France, J. (2003). An evaluation of different growth functions for describing the profile of live weight with time (age) in meat and egg strains of chicken. Poultry Science, 82, 1536– 1543. https://doi.org/10.1093/ps/82.10.1536. 9. Cornell, J. A., & Berger, R. D. (1987). Factors that influence the value of the coefficient of determination in simple linear and nonlinear regression models. Phytopathology, 77(1), 63- 70. 10. Emamgholi Begli, H., Zerehdaran, S., Hassani, S., Abbasi, M. A., & Khan Ahmadi, A. R. (2010). Heritability, genetic and phenotypic correlations of egg quality traits in Iranian native fowl. British Poultry Science, 51(6), 740- 744. http://dx.doi.org/10.1080/00071668.2010.528750. 11. Fairfull, R. W., & Gowe, R. S. (1990). Genetics of egg production in chickens. Pages 705–759 in: Poultry Breeding and Genetics. R. D. Crawford, ed. Elsevier Science Publishers B.V., Amsterdam, the Netherlands. 12. Faraji Arough, H., Rokouei, M., Maghsoudi, A., & Mehri, M. (2019). Evaluation of non-linear growth curves models for native slow-growing Khazak Chickens. Poultry Science Journal, 7(1), 25-32. https://doi.org/10.22069/psj.2019.15535.1355. 13. Gavora, J. S., Liljedahl, L. E., McMillan, I., & Ahlen, K. (1982). Comparison of three mathematical models of egg production. British Poultry Science, 23(4), 339-348. https://doi.org/10.1080/00071688208447967. 14. Gompertz, B. (1825). XXIV. On the nature of the function expressive of the law of human mortality, and on a new mode of determining the value of life contingencies. In a letter to Francis Baily, Esq. FRS &c. Philosophical
- 14. 410 جلد ایران دامی علوم پژوهشهای نشریه 15 شماره ، 3 ، پاییز 1402 transactions of the Royal Society of London, 115, 513- 583. https://doi.org/10.1098/rstl.1825.0026 15. Groen, A. F., Jiang, X., Emmerson, D. A., & Vereijken, A. A. (1998). Deterministic model for the economic evaluation of broiler production systems. Poultry Science, 77, 925 –933. https://doi.org/10.1093/ps/77.7.925. 16. Grossman, M., Gossman, T. N., & Koops, W.J. (2000). A model for persistency of egg production. Poultry Science, 79(12), 1715-1724. https://doi.org/10.1093/ps/79.12.1715. 17. Haunshi, S., Suresh, D., Lawrence, L. L. P., Rajkumar, U., Kannaki, R., & Rudranath, C. (2022). Carcass characteristics, meat quality and nutritional composition of Kadaknath, a native chicken breed of India. Foods, 11(22), 3603. https://doi.org/10.3390/foods11223603. 18. Lee, Y. P. (2006). Taiwan Country Chicken: A slow growth breed for eating quality. Symposium COA/INRA Scientific Cooperation in Agriculture. Taiwan, R.O.C. 19. Lopez, S., France, J., Gerrits, W. J. J., Dhanoa, M. S., Humphries, D. J., & Dijkstra, J. (2000). A generalized Michaelis-Menten equation for the analysis of growth. Journal of Animal Science 78(7), 1816-1828. https://doi.org/10.2527/2000.7871816x. 20. Lordelo, M., Cid, J., Cordovil, C. M., Alves, S. P., Bessa, R. J., & Carolino, I. (2020). A comparison between the quality of eggs from indigenous chicken breeds and that from commercial layers. Poultry Science, 99(3), 1768- 1776. https://doi.org/10.1016/j.psj.2019.11.023 21. Mahmoud, B. Y. F., Emam, A. M., & El-Full, E. A. (2021). Evaluation of four nonlinear models describing egg production curve of Fayoumi layers. Egyptian Poultry Science Journal, 41(1), 147-159. https://doi.org/10.15406/ijawb.2017.02.00012. 22. Masoudi, A., & Azarfar, A. (2017). Comparison of nonlinear models describing growth curves of broiler chickens fed on different levels of corn bran. International Journal of Avian and Wildlife Biology, 2, 1-7. https://doi.org/10.15406/ijawb.2017.02.00012. 23. Michalczuk, M., Damaziak, K., & Goryl, A. (2016). Sigmoid models for the growth curves in medium-growing meat type chickens, raised under semi-confined conditions. Annals of Animal Science, 16, 65-77. https://doi.org/10.1515/aoas-2015-0061. 24. Miguel, J. A., Asenjo, B., Ciria, J., & Calvo, J. L. (2007). Growth and lay modelling in a population of Castellana Negra native Spanish hens. British Poultry Science, 48(6), 651-654. https://doi.org/10.1080/00071660701598414. 25. Narinc, D., Karaman, E., Firat, M. Z., & Aksoy, T. (2010). Comparison of non-linear growth models to describe the growth in Japanese quail. Journal of Animal and Veterinary Advances, 9, 1961–1966. https://doi.org/10.3923/javaa.2010.1961.1966. 26. Narinc, D., Karaman, E., Aksoy, T., & Firat, M. Z. (2013). Investigation of non-linear models to describe the long term egg production in Japanese quail. Poultry Science, 92, 1676-1682. https://doi.org/10.3382/ps.2012-02511. 27. Narinc, D., Uckardes, F., & Aslan, E. (2014). Egg Production Curve Analysis in Poultry Science. World Poultry Science Journal, 70, 817–828. https://doi.org/10.1017/S0043933914000877. 28. Otwinowska-Mindur, A., Gumułka, M., & Kania-Gierdziewicz, J. (2016). Mathematical models for egg production in broiler breeder hens. Annals of Animal Science, 16(4), 1185-1198. https://doi.org/10.1515/aoas-2016-0037. 29. Pinheiro, J., Bates, D., DebRoy, S., & Sarkar, D. (2014). R Core Team, nlme: linear and nonlinear mixed effects models. R package version 3.1-117. Available at http://CRAN.R-project.org/package=nlme. 30. Richards, F. J. (1959). A flexible growth function for empirical use. Journal of Experimental Botany, 10(2), 290- 301. https://doi.org/10.1093/jxb/10.2.290 31. Rizzi, C., Contiero, B., & Cassandro, M. (2013). Growth patterns of Italian local chicken populations. Poultry Science, 92, 2226-2235. https://doi.org/10.3382/ps.2012-02825. 32. Robertson, T. B. (1908). On the normal rate of growth of an individual, and its biochemical significance. Archiv für Entwicklungsmechanik der Organismen, 25(4), 581-614. 33. Roush, W. B., & Branton, S. L. (2005). A comparison of fitting growth models with a genetic algorithm and nonlinear regression. Poultry Science, 84, 494-502. https://doi.org/10.1093/ps/84.3.494. 34. Savegnago, R. P., Cruz, V. A., Ramos, S. B., Caetano, S. L., Schmidt, G. S., Ledur, M. C., El Faro, L., & Munari, D. P. (2012). Egg production curve fitting using nonlinear models for selected and nonselected lines of White Leghorn hens. Poultry Science, 91, 2977–2987. https://doi.org/10.3382/ps.2012-02277. 35. Sharifi, M. A., Patil, C. S., Yadav, A. S., & Bangar, Y. C. (2022). Mathematical modeling for egg production and egg weight curves in a synthetic white leghorn. Poultry Science, 101(4), 101766. https://doi.org/10.1016/j.psj.2022.101766. 36. Thornley, J. H. M., & France, J. (2007). Mathematical Models in Agriculture: Quantitative Methods for the Plant, Animal and Ecological Sciences, 2nd ed. Oxon, UK, CABI Publishing, Wallingford. 37. Weibull, W. (1951). A statistical distribution function of wide applicability. Journal of Applied Mechanics, 18, 293- 297 38. Wolc, A., Graczyk, M., Settar, P., Arango, J., O’sullivan, N. P., Szwaczkowski, T., & Dekkers, J. C. M. (2015). Modified Wilmink curve for egg production analysis in layers. In XXVII International Poultry Science Symposium PB WPSA “Science to practice-practice to science”, Bydgoszcz, Poland.
- 15. ،همکاران و آروق فرجی مدل از استفاده برازش برای رشد خطی غیر های ... 411 39. Wolc, A., Arango, J., Settar, P., Neil, P., & Dekkers, J. (2011). Evaluation of egg production in layers using random regression models. Poultry Science, 90(1), 30-34. https://doi.org/10.3382/ps.2010-01118. 40. Wood, P. D. P. (1967). Algebraic Model of the Lactation Curve in Cattle. Nature, 216, 164–165. https://doi.org/10.1038/216164a0. 41. Yang, N., Wu, C., & McMillan, I. (1989). New mathematical model of poultry egg production. Poultry Science, 68, 476 – 481. https://doi.org/10.3382/ps.0680476.