SlideShare uma empresa Scribd logo
1 de 16
Baixar para ler offline
Electronic spreadsheets have become an
essential management tool. Throughout
this book there are references to Microsoft’s
Excel spreadsheet software program.
Although Excel is just a tool rather than
conceptual accounting material, we take
time to discuss it because of its pervasive and
critical use throughout the health care man-
agement setting. If you are already a user of
Excel, or of one of the competing spread-
sheet programs, such as the spreadsheet
programs in Google Documents or Open
Office, we suggest skipping this chapter as it
provides only a basic introduction. For new-
comers to electronic spreadsheet programs,
the goal of this chapter is to quickly provide
a foundation for the use of spreadsheets.
After reading this chapter, you should be
able to read spreadsheets prepared by oth-
ers, work on the templates provided with
this book, and create basic spreadsheets of
your own.
What Are Spreadsheets?
A spreadsheet is any document with a grid of
columns and rows. For centuries, manag-
ers have used paper that was lined with col-
umns and rows for their computations. For
example, Exhibit 2-1 presents a spreadsheet
prepared by hand on paper using a pencil
and calculator. This spreadsheet computes
the projected cost of overtime for the first 3
months of the coming year.
In Exhibit 2-1, the top section presents
the hourly overtime premium. That is, the
workers earn a base hourly rate; if they
work an hour of overtime, they get an addi-
tional premium for having worked over-
time. This spreadsheet is only showing the
premium, or extra pay, because the hours
are being worked at overtime rates. The
second section shows the projected num-
ber of overtime hours for each worker for
each month during the quarter. The third
section projects the overtime cost in dollars.
The numbers in the Overtime Cost section
are computed by taking each worker’s over-
time rate and multiplying it by the worker’s
overtime hours. For example, Brown is
projected to earn $12 extra for each over-
time hour. In January, Brown is expected to
work 28 overtime hours. Multiplying $12 by
28 hours indicates a projected overtime cost
of $336.00 for Brown.
To complete this very simple worksheet,
the 5 workers’ rates are manually multiplied
by their projected overtime hours for each of
3 months. That is 15 computations done by
hand. Then the cost for each of the 3 months
must be totaled to find the total overtime
cost per month. The total overtime cost by
9
Chapter 2
Introduction to Electronic Spreadsheets
45281_Ch02_FINAL.indd 9 11/4/11 1:38:38 PM
© Jones & Bartlett Learning, LLC. NOT FOR SALE OR DISTRIBUTION
10  Accounting Fundamentals for Health Care Management
the Microsoft Excel spreadsheet software
program installed as part of the Microsoft
Office suite of programs. Much of what is
done using Excel could be done manually,
but electronic spreadsheets can do compu-
tations faster and with fewer errors.
The most essential feature of electronic
spreadsheets is the ability to recompute
results quickly, easily, and reliably as any ele-
ment in the spreadsheet changes. One num-
ber within the spreadsheet can be changed,
and the results of the analysis can be auto-
matically and quickly updated, taking that
worker for each of the 3 months must also
be computed. There are over 20 computa-
tions to be done, and this example presents
an extremely limited example of the types of
computations that might be done in a health
care organization.
Electronic Spreadsheets
Electronic spreadsheets, such as Excel, are com-
puter software programs used for compu-
tations and creating charts. Most comput-
ers used in the health care industry have
Exhibit 2-1  Spreadsheet Prepared by Hand
45281_Ch02_FINAL.indd 10 11/4/11 1:38:38 PM
© Jones & Bartlett Learning, LLC. NOT FOR SALE OR DISTRIBUTION
Chapter 2: Introduction to Electronic Spreadsheets  11
worksheet. The worksheet extends off to the
right, showing more and more columns. It
doesn’t stop at Column Z. After Column Z
comes Column AA, AB, etc. And if you were
to scroll down, there are thousands of rows.
The intersection of a column and row is
called a “Cell.” Each cell can be referenced
by its cell name, which is its column and
row. For example, in Exhibit 2-3, the high-
lighted cell is referred to as Cell C4. So, if
someone told you to look at Cell C4 on the
spreadsheet that they just emailed to you,
you would open the spreadsheet file and
look at the contents of the cell in Column
C and Row 4.
change into account. This allows managers to
do many “what if” analyses, evaluating a pro-
jection under a wide range of assumptions.
So, if it turned out that the overtime rate
for Jones is not $11.00, but is actually $12.50,
the $11.00 could be changed in an elec-
tronic spreadsheet, and all of the Overtime
Cost computations would be recalculated
automatically. Also, all of the column and
row totals would automatically recompute.
This allows users to avoid a great deal of
time-consuming, error-prone work. This will
be demonstrated later in the chapter.
The Basics
Exhibit 2-2 provides a screenshot of an
example of an Excel spreadsheet. When you
open the software program, the computer
screen looks something like this, with icons
and menu choices at the top of the screen.
The key focus of a spreadsheet, however, is
on the rows and columns that create a grid.
Exhibit 2-2 displays just a small part
of the spreadsheet, alternatively called a
Exhibit 2-2  Initial Excel Screen
Exhibit 2-3  Cell Reference
45281_Ch02_FINAL.indd 11 11/4/11 1:38:38 PM
© Jones & Bartlett Learning, LLC. NOT FOR SALE OR DISTRIBUTION
12  Accounting Fundamentals for Health Care Management
Exhibit 2-5. The total of 476.5 appears in
Cell A1, and you no longer see the formula
“=128.92+347.58” in Cell A1. However, that
underlying formula has not gone away. Excel
maintains that information, and displays it in
a “formula bar” that appears just above the
columns, to the right of the letters “fx.” The
formula bar still shows “=128.92+347.58.” At
any time, you can move the cursor to any cell
in the spreadsheet, and the formula bar will
display the underlying formula that allowed
you to arrive at the number displayed in the
cell. Also note that to the left of the formula
bar, you see A1. This identifies the fact that
the “=128.92+347.58” you see in the formula
bar is the formula for the data in Cell A1.
Excel follows some conventions for
the order in which computations are
done. Suppose we told Excel to compute
“=128.92+347.58/3.” This instruction is
ambiguous. Do we mean that we want to add
128.92+347.58 and then divide that total by
3? Or do we mean we want to divide 347.58
by 3 and then add that result to 128.92? If we
mean the former, then the result is 158.83,
but if we mean the latter, then the result is
244.78. Very different results.
Excel is programmed so that multiplica-
tion and division are done first, followed
by addition and subtraction. Therefore,
if we don’t specifically instruct otherwise,
Excel will interpret “=128.92+347.58/3”
as asking to first divide 347.58 by 3, and
The starting point for an Excel spread-
sheet is to enter data in cells. You may want
to have a computer nearby as you read this
section, so you can follow the steps dis-
cussed here directly in Excel. The first step
is to open the software program. When it
opens, you should see a screen similar to
Exhibit 2-2. Next, move your cursor to the
Cell A1 box, and left click the mouse. When
you left click, Cell A1 is outlined in black, as
Cell C4 is in Exhibit 2-3. This quickly orients
you as to where you are in the worksheet.
Now let’s enter some data. Type 128.92, and
then press the Enter key. That’s all there is
to it. You now know how to enter data in
Excel. On your spreadsheet, in Cell A1, you
should now see the number 128.92.
The primary purpose of spreadsheet pro-
grams is to perform computations. All com-
putations in Excel start with an equals (=)
sign. The plus (+) sign is used for addition,
the minus (-) sign for subtraction, the for-
ward slash (/) for division, and an asterisk
(*) for multiplication.
Suppose we want to add together two
numbers—for example, 128.92 and 347.58.
Put your cursor in a cell by moving the mouse
to the desired cell and hitting the left mouse
button, and then type “=128.92+347.58.”
Exhibit 2-4 shows what you would see in
Excel when you type that before you hit the
Enter key.
Next, hit the Enter key. You should
immediately see something that looks like
Exhibit 2-4  Performing a Simple Computation
Exhibit 2-5  Results of Computation
45281_Ch02_FINAL.indd 12 11/4/11 1:38:38 PM
© Jones & Bartlett Learning, LLC. NOT FOR SALE OR DISTRIBUTION
Chapter 2: Introduction to Electronic Spreadsheets  13
Yet another way to do this addition would
be to type cell references. That is, rather
than adding the specific numbers in each
cell or moving the cursor to each cell that we
want to include in the computation, we can
tell Excel to add the values that appear in
each cell by referring to the cell addresses.
For example, we could move our cursor to
Cell B7, type “=B3+B4+B5+B6,” and then hit
Enter. Again the total “499” will appear in
B7.
But this is a laborious process. If you have
quite a few numbers to add up, you would
want a faster approach. A quicker way to do
this is to use the SUM function. This is one
of many functions programmed into the
software. To use this function, type the equal
sign, then “SUM,” and then an open paren-
thesis, or “=SUM(”. Next, type the range
of values. In this case, since we are adding
everything from Cell B3 through Cell B6,
you would type “=SUM(B3:B6).” The colon
in the formula indicates a range and lets
Excel know that we want to use all of the val-
ues from B3 through B6. Again, you will see
the total “499” appear in Cell B7.
Still another way to approach this com-
putation is to use the summation icon. The
Greek letter sigma (∑) is used in mathemat-
ics to indicate that a group of numbers are
being added together. In Excel, there is a ∑
icon in the menu at the top of the screen.
Move your cursor to B7, left click your
mouse so Excel knows you want to work on
Cell B7, then click the ∑ icon and hit Enter
(see Exhibit 2-6). When you first click on ∑,
it will show the range of numbers that Excel
assumes you want to sum. When you click
Enter, you are accepting that range.
If you have a continuous column of num-
bers, when you click on the ∑ icon, Excel
will assume you want to add that entire col-
umn. Notice in Exhibit 2-6 how the range of
cells was put in a box when the ∑ icon was
then add 128.92. To prevent ambiguity
and also to avoid computations from being
done in a different way than expected
without you even knowing that your result
is wrong, it is always safest to use paren-
theses to group your computations in a
clear manner. You should show this com-
putation as: “=(128.92+347.58)/3” or as
“=128.92+(347.58/3).” By doing this, the
computation you want will not only be clear
to Excel, but it will also be clear to you when
you come back and look at your spreadsheet
later, or to another user, if you share the
spreadsheet file with someone else.
Different Ways to Accomplish
the Same Task
Electronic spreadsheets allow you to achieve
the same result in more than one way.
Suppose we have the following: in Cell B3 we
have 42, in Cell B4 we have 29, in Cell B5
we have 247, and in Cell B6 we have 181. If we
want to add those values and show the total
in Cell B7, we could move our cursor to Cell
B7, left click our mouse, putting the cursor
firmly in Cell B7, typing “=42+29+247+181,”
and then hitting Enter. The total “499” would
appear in Cell B7.
However, we could also get to that same
result in other ways. We could put the cur-
sor in Cell B7 and left click. Then, type an
equals sign, move the cursor up to Cell B3,
left click in Cell B3, and then type a plus
sign. Next, move the cursor to Cell B4, left
click in Cell B4, and then hit the plus sign.
Next, move the cursor to B5, left click, and
then hit the plus sign. Repeat the process
until you get to Cell B6. When you move the
cursor to Cell B6 and left click, instead of
hitting plus, simply hit Enter. That will tell
Excel that you have finished adding values
for the computation, and the total “499” will
appear in Cell B7.
45281_Ch02_FINAL.indd 13 11/4/11 1:38:38 PM
© Jones & Bartlett Learning, LLC. NOT FOR SALE OR DISTRIBUTION
14  Accounting Fundamentals for Health Care Management
Formatting an Electronic
Spreadsheet
Exhibit 2-1 represents a handwritten, paper
spreadsheet. Now let’s move this onto an
Excel spreadsheet so we can see how things
differ using Excel. In Exhibit 2-9, you see
clicked, and the formula “=Sum(B3:B6)”
was filled in by Excel. However, if you are
trying to add a column of numbers with
a break in it, Excel may misinterpret your
intent. For example, suppose that cell B4 is
empty, and we want to add Cells B3 through
B6. If we click on the ∑ icon, Excel will leave
out Cell B3 (see Exhibit 2-7).
In Exhibit 2-7, we see that Excel assumes
you just want to add B5 through B6. If in fact
you want to add all the numbers in Column
B, put your cursor in B7, left click, then
click on ∑ from the menu at the top. Then,
when Excel shows the incorrect range, you
click on Cell B6 and, while holding the left
mouse button down, drag your mouse up to
B3, release the mouse button, and then hit
Enter. Excel will sum the range of cells you
indicated. After either using the SUM func-
tion or the ∑, the total and the formula will
appear as seen in Exhibit 2-8.
Exhibit 2-6  Using the Sigma Icon
Exhibit 2-7  Using Sigma with Noncontiguous
Numbers
45281_Ch02_FINAL.indd 14 11/4/11 1:38:39 PM
© Jones & Bartlett Learning, LLC. NOT FOR SALE OR DISTRIBUTION
Chapter 2: Introduction to Electronic Spreadsheets  15
Exhibit 2-8  Excel Screen After Use of Sigma for Addition
Exhibit 2-9  Transferring the Spreadsheet from Paper
45281_Ch02_FINAL.indd 15 11/4/11 1:38:39 PM
© Jones & Bartlett Learning, LLC. NOT FOR SALE OR DISTRIBUTION
16  Accounting Fundamentals for Health Care Management
columns seem to be off against the left side
of each column, but the numbers are against
the right edge of each column. In Rows 17
to 22, you can’t even read the data. Instead,
you see a bunch of “#” signs. All of these are
formatting issues.
The labels in Column A are cut off,
because the column isn’t wide enough for
them. The # signs in Columns B through E
indicate that the column is too narrow to dis-
play the number. How can we fix this? Excel
has a number of ways that we can change the
column width to fix these formatting issues.
One approach is to instruct Excel to make
each column wide enough to display the
widest data in that column. Click the Home
tab in the upper left part of the screen. This
all of the headings and text labels from the
left hand column of Exhibit 2-1 copied into
Column A of an Excel spreadsheet. This
does not look too different from the paper
spreadsheet.
One thing to note, however, is that some
of the text extends beyond Column A.
This is fine. As long as the cell to the right
is empty, a data label can extend beyond the
width of its cell. But what happens when we
enter the rest of the data from the paper
spreadsheet into the electronic one? Look
at Exhibit 2-10, which now includes all of
the data from Exhibit 2-1.
Exhibit 2-10 is a bit of a mess. The labels in
Column A are partly covered by the data
in Column B. The month headings in the
Exhibit 2-10  Spreadsheet with Data Entered
45281_Ch02_FINAL.indd 16 11/4/11 1:38:39 PM
© Jones & Bartlett Learning, LLC. NOT FOR SALE OR DISTRIBUTION
Chapter 2: Introduction to Electronic Spreadsheets  17
to set the column width. You can click on
the question mark (?) in the menu bar at
the top of the screen to access the Help
function. Once it opens, you would type
your question, such as “how do you set the
column width” or simply type “set column
width” and explanations of how to proceed
are shown. In fact, whenever you get stuck in
Excel, the first place to go is the Help func-
tion. Sometimes it can be a bit frustrating
to use Excel’s Help function and you may
have to word your question several different
ways until you get the relevant response. If
you are persistent, however, you can usually
accomplish what you want either by care-
fully reviewing the various menu options
that exist or by using the Help function.
The spreadsheet in Exhibit 2-12 has a
few other formatting changes. The col-
umn headings have been right-justified
and underlined. This is done using the
alignment and underlining icons from
the menu at the top, which are the same
icons used in Microsoft Word. Notice that
will allow you to access the Format menu.
Next, click your mouse in a cell in one cor-
ner of the spreadsheet, such as on Cell A1.
Left click the mouse and drag, with the left
button depressed, to cover all columns and
rows in your spreadsheet that have data.
For the spreadsheet in Exhibit 2-10, you
would drag to cover the range from A1 to
E22. Release the mouse button, and then
click on “Format” from the menu at the
top of the screen to display a drop down
menu. From that menu, you click on Autofit
Column. Different versions of Excel have
menu bars at the top that appear somewhat
differently, but the same features exist. After
you click on Autofit Column, the column
widths change. Exhibit 2-11 shows the pro-
cess for formatting, and Exhibit 2-12 shows
the spreadsheet after the column widths
have been adjusted.
In Exhibit 2-12, we can see that Column A
got wider, displaying all of the text. All of the
information in the spreadsheet has become
readable. There are a number of other ways
Exhibit 2-11  Autofit Column Width
45281_Ch02_FINAL.indd 17 11/4/11 1:38:39 PM
© Jones & Bartlett Learning, LLC. NOT FOR SALE OR DISTRIBUTION
18  Accounting Fundamentals for Health Care Management
Cells window, you can indicate that the cell
should be formatted as currency, with or
without dollar signs and with or without dec-
imal places showing. Or you can format the
cells as percentages, fractions, or even dates.
If you click on the alignment tab in this
Format Cells window, you can right align,
left align, and even turn text on an angle,
instead of appearing horizontal. The font
tab allows you to change fonts and font sizes,
as well as add underlines and other effects.
The border tab allows you to add grid lines
or create borders around your work. It is
worth spending some time exploring the
format commands that are available.
Row 22 now has double underlines. This is
commonly used in accounting to indicate
a final total for a column of numbers. To
find the option to use a double underline,
use the mouse to select the range of cells
you wish to format—for example, left click
on B22, drag the mouse to E22, and then
release the mouse button. Next, right click
the mouse, and select the Format Cells
choice. A Format Cells window opens. In
the Font tab area, you can choose a double
underline option.
There are many format options available
to improve the appearance of the spread-
sheet. In the Number tab within the Format
Exhibit 2-12  Spreadsheet with Adjusted Column Width
45281_Ch02_FINAL.indd 18 11/4/11 1:38:39 PM
© Jones & Bartlett Learning, LLC. NOT FOR SALE OR DISTRIBUTION
Chapter 2: Introduction to Electronic Spreadsheets  19
have to go back and manually recompute
every calculation you had initially made. You
would have to multiply the new $12.50 by the
number of hours for each month to get the
new Overtime Cost for Jones for each month.
Then, you would have to find a total for the
Overtime Cost for all workers for each month
and in total. You would also have to find a
new Overtime Cost total for Jones for the 3
months. Excel, however, has the capability, if
you set up your spreadsheet correctly, to auto-
matically do all of the computations when you
change $11.00 to $12.50. That is, you would
simply put your cursor in Cell B4, type 12.50,
and hit Enter, and all the numbers in your
spreadsheet would immediately be revised, as
Exhibit 2-13 shows.
Updating the Spreadsheet
Spreadsheetsoftenhavetobeupdatedbecause
assumptions change, errors are found, or
time passes and you want to replace old data
with new information. With paper spread-
sheets, the process of updating the spread-
sheet is laborious. All computations have to
be redone. This can be a very time-consuming
process, but this is where an electronic spread-
sheet, such as Excel, well... excels.
Exhibit 2-12 shows the example you have
been working with. Suppose that you now
determine that there had been an error in the
hourly premium for Jones. Although it shows
it as $11 per hour, it should be $12.50. If you
were using a paper spreadsheet, you would
Exhibit 2-13  Updated Spreadsheet
45281_Ch02_FINAL.indd 19 11/4/11 1:38:39 PM
© Jones & Bartlett Learning, LLC. NOT FOR SALE OR DISTRIBUTION
20  Accounting Fundamentals for Health Care Management
formulas used to develop the worksheet
are shown. When you enter each of these
formulas—as soon as you hit the Enter
key—you see the numerical value, as seen in
Exhibit 2-12. If you put your cursor in any
cell, the formula used to generate the num-
ber in that cell appears in the Formula bar
above the columns (just to the right of “fx”).
When you set up the spreadsheet, you put
the premium rate for each worker in Column
B. However, since the Overtime Premiums
are the same each month, as indicated in
Columns C and D, refer back to the value in
Column B. For example, the value for C2 is
shown as “=B2,” rather than $12.00. In the
Overtime Hours section, the totals are not
added manually. Both the totals by month
and the totals by employee are calculated
Notice in Exhibit 2-13 that as soon as we
entered 12.50, each of the numbers with an
arrow next to it has automatically changed.
Compare the numbers in Exhibits 2-13 and
2-12. How can Excel do that? It does this
based on the use of formulas. The key is
that when you create the spreadsheet, you
don’t manually do any of the computations.
Rather, you define the relationship between
the numbers in each cell and let the pro-
gram do the initial computations. This
provides the program with the information
needed to update all computations as data
changes.
For example, look at Exhibit 2-14. When
you enter your information into the spread-
sheet you don’t enter numbers, you enter
relationships. In this Exhibit, all of the
Exhibit 2-14  Using Cell Relationships and Formulas
45281_Ch02_FINAL.indd 20 11/4/11 1:38:39 PM
© Jones & Bartlett Learning, LLC. NOT FOR SALE OR DISTRIBUTION
Chapter 2: Introduction to Electronic Spreadsheets  21
there is a significant chance arithmetical
errors will occur, especially if there are a
lot of computations. If you are using Excel,
you have to be very careful to identify all of
your initial relationships correctly, but when
changes are made, as long as the revised
data is input correctly, you don’t have to
worry about computational errors.
More Time Savings
In addition to saving time when you change
numbers in a spreadsheet, Excel also has time-
saving features to help you create your spread-
sheet. For example, you can copy and paste,
just as you would in a Word document. This
can be done for numbers, as well as formu-
las. If you enter the formula in one cell, after
you hit Enter, you can put your cursor on that
cell and click on the Copy icon on the menu
(the same icon as Microsoft Word uses for
copying). Next, move your cursor to the cell
you want to paste the information into, and
click on the Paste icon. You can also click and
drag the mouse, if you want to copy a range of
cells. Or you can copy one cell, and then click
and drag to paste the formula from that one
cell into a range of cells. Rather than using
the Copy and Paste icons from the menus at
the top, another way to copy and paste is to
right click your mouse and select either Copy
or Paste from the menu that appears.
One of the great features of electronic
spreadsheets is that, if you typed “=A1 +
B1” as the formula for Cell C1, it will adjust
automatically when you copy C1 and paste
it into the range from C2 to C5. That is, the
formula that pastes into C2 will not be the
original “=A1 + B1,” instead, it will adjust
automatically to “=A2 + B2,” and the for-
mula that goes into C3 will be “=A3 + B3,”
and so on. Excel assumes that if you were
adding across in Row 1, you probably want
to do the same thing for Rows 2, 3, 4, and
by creating a formula. If you were to change
the overtime hours for any employee for any
month, the totals in that section automatically
recompute. All of the cells in the Overtime
Cost section are developed using formulas
showing cell relationships.
When cell B4 is changed from $11.00
to $12.50, Cells C4 and D4 automatically
become $12.50, because whatever is in B4
shows up in those cells as well. Cell B19 is
“=B4*B11.” When B4 changes, that causes
B19 to also change. And because Cell B22
is the total of the five numbers above it,
when one of those numbers changes, it
also changes. Also note that a change in
B4, which results in a change in C4 and D4,
causes C19 and D19 to change as well, and
those changes cause Cells C22 and D22 to
change. Cells E19 and E22 will also change
as part of the automatic updates. The ben-
efit of entering all cells as relationships
rather than numbers is that changing any
number in the spreadsheet causes the entire
spreadsheet to instantly update. Note again
that in a finished spreadsheet, you won’t see
all of the formulas in the cells, as shown in
Exhibit 2-14. As each cell is completed, the
formula is kept in Excel’s memory, but only
the resulting number is displayed.
These exhibits are an example of a
very small spreadsheet. In the health care
industry, computations can become quite
complex. The time savings from automatic
updating provides an enormous benefit.
Excel can quickly recompute and update an
entire spreadsheet, whether it is one rela-
tionship that needs to be updated or hun-
dreds or thousands of recomputations. This
capability gives you a tremendous advantage
if you use Excel rather than doing your com-
putations by hand. Further, if the original
set of relationships is entered correctly, the
updated results are much more reliable. If
you are doing all computations by hand,
45281_Ch02_FINAL.indd 21 11/4/11 1:38:39 PM
© Jones & Bartlett Learning, LLC. NOT FOR SALE OR DISTRIBUTION
22  Accounting Fundamentals for Health Care Management
year to the next, just a few numbers need
updating in a saved Excel file.
Once data have been analyzed in a spread-
sheet, such as Excel, you can easily create
charts or graphs showing the results in a way
that may make them easier to comprehend.
This chapter does not discuss preparation of
charts, but once you have the essentials from
this chapter, you will be able to go on and
learn how to use charts either using the help
function within Excel or using the free online
tutorial suggested at the end of the chapter.
Another advantage of electronic spread-
sheets is the ability to link and/or share anal-
yses. Once a computer file has been saved, it
can be shared with colleagues (e.g., by email
or on a thumb drive). This allows them to
modify your analysis without having to rec-
reate it. Also, files can be linked, so that an
analysis can draw on data in another file with-
out having to reenter all of the information.
In addition, Excel allows you to protect the
data in your spreadsheets so that other users
cannot change them or can only change
them by first entering a password you have
established. This function can be accessed
through the Tools menu, by clicking the
Protection option. Then, you can choose to
protect a worksheet or an entire Excel file.
Although we generally think about elec-
tronic spreadsheets as being computer-based,
spreadsheet software programs are now avail-
able for download onto tablets, smart phones,
and other personal digital assistants (PDAs).
In this chapter, we have now covered
everything you must know about Excel to
work with the templates provided with this
book and to create and/or use simple Excel
spreadsheets. You now know how to enter
data, copy and paste, perform computations,
set column widths, format cells, and create
formulas for computations. This is simply
the tip of the iceberg. There is much more
that can be accomplished using Excel that we
haven’t covered. With the foundation from
5, and it adjusts the formula for you. This
is called copying “relatively.” If the formula
for C1 is “=A1 + B1” and you copy cell C1
and paste it into K8, the formula for K8 will
alter to “=I8 + J8.” Excel will not only adjust
the row, but the columns as well.
You can also copy and paste “absolutely.”
Sometimes you don’t want Excel to adjust
the formula automatically. Suppose you want
the formula for cell K8 to be the same exact
formula as the formula for cell C1, without
any adjustment. In that case, when you cre-
ate the formula for C1, you put dollar signs
before the cell and columns in the formula.
The formula you would type for C1 would be
“=$A$1 + $B$1.” Now, if you copy C1 to K8,
the formula pasted into cell K8 will remain
“=$A$1 + $B$1,” and Excel will compute
the sum of the contents of Cells A1 + B1.
Sometimes you will want to keep just the row
constant or just the column constant. You
can adjust that by choosing where to insert
dollar signs in the formula. Only the column
and/or row with a dollar sign is locked in. As
you become familiar with Excel, you will find
that you are frequently using the copy and
paste commands to save time.
Another time-saving device is the use of
multiple worksheets within one computer
file. You might want some information on
one page of a spreadsheet and other infor-
mation on another page. You could do this
by creating separate files. Alternatively, at
the bottom of the spreadsheet, there are tabs
labeled “Sheet 1,” “Sheet 2,” and “Sheet 3.”
If you double click on any of those tabs you
can replace those sheet titles with a more
descriptive name for that page or “work-
sheet.” There is also a “new sheet” tab to the
right of Sheet 3. If you click on this tab, you
can add additional sheets as needed.
Electronic spreadsheets can be saved
and reused, allowing you to save a lot of
time because you don’t have to recreate the
spreadsheet from scratch. Often, from one
45281_Ch02_FINAL.indd 22 11/4/11 1:38:39 PM
© Jones & Bartlett Learning, LLC. NOT FOR SALE OR DISTRIBUTION
Chapter 2: Introduction to Electronic Spreadsheets  23
Open a new spreadsheet. Type6.	
“Practice” in Cell A1. In Cell A2,
type the number “35;” in A3, type
“42;” and, in A4, type “50.”
a.	Use the sum function to add
them together in cell A5.
b.	Calculate a 10% increase in
the numbers in Column A in
Column B by using a formula.
Type “Increase 10%” in B1.
c.	 Add together the original
numbers in Column A and the
increases in Column B. Use a
formula and place in Column C.
Type “Total” in C1.
d.	Save the file as “Excel_Practice
.xls.”
Copy your worksheet from7.	
Question 6 into another worksheet.
Change the increase from 10% to
18%. Protect the worksheet, so that
changes cannot be made.
Open a new spreadsheet. In Cell A1,8.	
type “Spending Categories.” In Cell
A3, type “Salaries;” in Cell A4, type
“Fringe Benefits;” in Cell A5, type
“OTPS;” in Cell A6, type “Total.”
a.	Adjust the column width, so that
the text does not cross over into
the other column.
b.	Put the months of the year in the
next 12 columns (B–M), and put
a total column after (in N). Ad-
just any columns as necessary, so
the text fits.
Care Clinic is preparing a worksheet9.	
for their staff. Their average starting
salary is $60,000. Benefits are 25%
this year. They expect benefits to
go up to 27% next year. They are
expecting to give a raise of 5% next
year. Care Clinic has 20 employees.
Prepare a formatted Excel Spread-
sheet for Care Clinic.
this chapter, you should be able to go on and
learn additional aspects of Excel as you go,
either from the Excel Help function, an Excel
how-to book, or online tutorials. Those inter-
ested in going further should refer to some of
the resources listed at the end of this chapter.
Key Concepts
Spreadsheets—A document with a grid of
columns and rows, often used for financial
computations.
Electronic spreadsheet—A software pro-
gram that allows for automatic recomputa-
tions when one number in the spreadsheet
changes.
Additional Resources
Tutorial:	A free Excel tutorial may be found
at: http://baycongroup.com/
Reading:	Harvey, G. 2010. Excel 2010
For Dummies. For Dummies
(Computer/Tech).
	Frye, C.D. 2010. Microsoft Excel
2010 Plain  Simple. Microsoft
Press.
	Dodge, M. and Douglas, C.S.
2010. Microsoft Excel 2010 Inside
Out. Microsoft Press.
	Walkenbach, J. 2010. Excel 2010
Bible. Wiley.
Test Your Knowledge
What is a spreadsheet?1.	
What is the main benefit of elec-2.	
tronic spreadsheets?
How do formulas for computations3.	
in Excel begin?
What convention does Excel follow4.	
when doing computations?
What Greek letter is the icon for sum-5.	
ming a column or row of numbers?
45281_Ch02_FINAL.indd 23 11/4/11 1:38:40 PM
© Jones  Bartlett Learning, LLC. NOT FOR SALE OR DISTRIBUTION
45281_Ch02_FINAL.indd 24 11/4/11 1:38:40 PM
© Jones  Bartlett Learning, LLC. NOT FOR SALE OR DISTRIBUTION

Mais conteúdo relacionado

Mais procurados

Exp2003 exl ppt_03
Exp2003 exl ppt_03Exp2003 exl ppt_03
Exp2003 exl ppt_03lonetree
 
Itm310 problem solving #7 complete solutions correct answers key
Itm310 problem solving #7 complete solutions correct answers keyItm310 problem solving #7 complete solutions correct answers key
Itm310 problem solving #7 complete solutions correct answers keySong Love
 
Lesson 4 advance spreadsheets skills cost of ingredients.xlsx.
Lesson 4 advance spreadsheets skills cost of ingredients.xlsx.Lesson 4 advance spreadsheets skills cost of ingredients.xlsx.
Lesson 4 advance spreadsheets skills cost of ingredients.xlsx.EmmanuelaSernicul
 
How To Automate Part 2
How To Automate Part 2How To Automate Part 2
How To Automate Part 2Sean Durocher
 
E-Book 25 Tips and Tricks MS Excel Functions & Formulaes
E-Book 25 Tips and Tricks MS Excel Functions & FormulaesE-Book 25 Tips and Tricks MS Excel Functions & Formulaes
E-Book 25 Tips and Tricks MS Excel Functions & FormulaesBurCom Consulting Ltd.
 
Creating Formulas in Excel
Creating Formulas in ExcelCreating Formulas in Excel
Creating Formulas in ExcelKim Estes
 
Excel functions and formulas
Excel functions and formulasExcel functions and formulas
Excel functions and formulasJason Wong
 
Ms Excel Basic to Advance Tutorial
Ms Excel Basic to Advance TutorialMs Excel Basic to Advance Tutorial
Ms Excel Basic to Advance TutorialBikal Shrestha
 
Exp2003 exl ppt_01
Exp2003 exl ppt_01Exp2003 exl ppt_01
Exp2003 exl ppt_01lonetree
 
Basics of excel for beginners
Basics of excel for beginnersBasics of excel for beginners
Basics of excel for beginnersJitesh Khushalani
 
Oracle Certification 1Z0-1041 Questions and Answers
Oracle Certification 1Z0-1041 Questions and AnswersOracle Certification 1Z0-1041 Questions and Answers
Oracle Certification 1Z0-1041 Questions and Answersdouglascarnicelli
 
Excel Formula and Function Basics
Excel Formula and Function BasicsExcel Formula and Function Basics
Excel Formula and Function Basicsguest1c3d8c6
 
Excel Data Management
Excel Data ManagementExcel Data Management
Excel Data ManagementRachel Espino
 
Commonly usedexcelfunctions v1
Commonly usedexcelfunctions v1Commonly usedexcelfunctions v1
Commonly usedexcelfunctions v1Hardik sharma
 
Functions of ms excel 2003
Functions of ms excel 2003Functions of ms excel 2003
Functions of ms excel 2003gaurav jain
 
Excel formulas with-example-narration
Excel formulas with-example-narrationExcel formulas with-example-narration
Excel formulas with-example-narrationBelinda Prahl
 

Mais procurados (20)

Mastering Excel Formulas and Functions
Mastering Excel Formulas and FunctionsMastering Excel Formulas and Functions
Mastering Excel Formulas and Functions
 
Real World Excel Formulas
Real World Excel FormulasReal World Excel Formulas
Real World Excel Formulas
 
Exp2003 exl ppt_03
Exp2003 exl ppt_03Exp2003 exl ppt_03
Exp2003 exl ppt_03
 
Spreadsheets
SpreadsheetsSpreadsheets
Spreadsheets
 
Itm310 problem solving #7 complete solutions correct answers key
Itm310 problem solving #7 complete solutions correct answers keyItm310 problem solving #7 complete solutions correct answers key
Itm310 problem solving #7 complete solutions correct answers key
 
Lesson 4 advance spreadsheets skills cost of ingredients.xlsx.
Lesson 4 advance spreadsheets skills cost of ingredients.xlsx.Lesson 4 advance spreadsheets skills cost of ingredients.xlsx.
Lesson 4 advance spreadsheets skills cost of ingredients.xlsx.
 
How To Automate Part 2
How To Automate Part 2How To Automate Part 2
How To Automate Part 2
 
E-Book 25 Tips and Tricks MS Excel Functions & Formulaes
E-Book 25 Tips and Tricks MS Excel Functions & FormulaesE-Book 25 Tips and Tricks MS Excel Functions & Formulaes
E-Book 25 Tips and Tricks MS Excel Functions & Formulaes
 
Creating Formulas in Excel
Creating Formulas in ExcelCreating Formulas in Excel
Creating Formulas in Excel
 
Excel functions and formulas
Excel functions and formulasExcel functions and formulas
Excel functions and formulas
 
Ms Excel Basic to Advance Tutorial
Ms Excel Basic to Advance TutorialMs Excel Basic to Advance Tutorial
Ms Excel Basic to Advance Tutorial
 
Exp2003 exl ppt_01
Exp2003 exl ppt_01Exp2003 exl ppt_01
Exp2003 exl ppt_01
 
Learn Excel 2016 VBA and Macros in 24 Hours (Part 2 of 2) On Practical's Asp...
Learn Excel 2016 VBA and Macros in 24 Hours  (Part 2 of 2) On Practical's Asp...Learn Excel 2016 VBA and Macros in 24 Hours  (Part 2 of 2) On Practical's Asp...
Learn Excel 2016 VBA and Macros in 24 Hours (Part 2 of 2) On Practical's Asp...
 
Basics of excel for beginners
Basics of excel for beginnersBasics of excel for beginners
Basics of excel for beginners
 
Oracle Certification 1Z0-1041 Questions and Answers
Oracle Certification 1Z0-1041 Questions and AnswersOracle Certification 1Z0-1041 Questions and Answers
Oracle Certification 1Z0-1041 Questions and Answers
 
Excel Formula and Function Basics
Excel Formula and Function BasicsExcel Formula and Function Basics
Excel Formula and Function Basics
 
Excel Data Management
Excel Data ManagementExcel Data Management
Excel Data Management
 
Commonly usedexcelfunctions v1
Commonly usedexcelfunctions v1Commonly usedexcelfunctions v1
Commonly usedexcelfunctions v1
 
Functions of ms excel 2003
Functions of ms excel 2003Functions of ms excel 2003
Functions of ms excel 2003
 
Excel formulas with-example-narration
Excel formulas with-example-narrationExcel formulas with-example-narration
Excel formulas with-example-narration
 

Destaque

Low TCO, high Impact: Innovative Government Services at Manatee County
Low TCO, high Impact: Innovative Government Services at Manatee CountyLow TCO, high Impact: Innovative Government Services at Manatee County
Low TCO, high Impact: Innovative Government Services at Manatee Countybkraft
 
Make a film in one day
Make a film in one dayMake a film in one day
Make a film in one dayMoodmaker
 
1s kartic chandr barman (ar)Shakti peeth Bakreswar-An Ancient Religious & Rur...
1s kartic chandr barman (ar)Shakti peeth Bakreswar-An Ancient Religious & Rur...1s kartic chandr barman (ar)Shakti peeth Bakreswar-An Ancient Religious & Rur...
1s kartic chandr barman (ar)Shakti peeth Bakreswar-An Ancient Religious & Rur...Institute of Historical Studies" Kolkata
 
Web 2.0
Web 2.0Web 2.0
Web 2.0JulenK
 
Presentatie Nick Hoogveldt
Presentatie Nick HoogveldtPresentatie Nick Hoogveldt
Presentatie Nick Hoogveldtnickhoogveldt
 
CML2117 Introduction to Law, 2008 - Lecture 16 - Charter cases
CML2117 Introduction to Law, 2008 - Lecture 16 - Charter casesCML2117 Introduction to Law, 2008 - Lecture 16 - Charter cases
CML2117 Introduction to Law, 2008 - Lecture 16 - Charter casesAndy Kaplan-Myrth
 
How social technologies drives business success - Google - Millward Brown - M...
How social technologies drives business success - Google - Millward Brown - M...How social technologies drives business success - Google - Millward Brown - M...
How social technologies drives business success - Google - Millward Brown - M...Romain Fonnier
 
Where has all the Liquidity Gone?
Where has all the Liquidity Gone?Where has all the Liquidity Gone?
Where has all the Liquidity Gone?berberblues
 
Mapa - Material educativo digital
Mapa - Material educativo digitalMapa - Material educativo digital
Mapa - Material educativo digitalGalaxia Mercury
 

Destaque (20)

Digital post n°82
Digital post n°82Digital post n°82
Digital post n°82
 
Low TCO, high Impact: Innovative Government Services at Manatee County
Low TCO, high Impact: Innovative Government Services at Manatee CountyLow TCO, high Impact: Innovative Government Services at Manatee County
Low TCO, high Impact: Innovative Government Services at Manatee County
 
Make a film in one day
Make a film in one dayMake a film in one day
Make a film in one day
 
1s kartic chandr barman (ar)Shakti peeth Bakreswar-An Ancient Religious & Rur...
1s kartic chandr barman (ar)Shakti peeth Bakreswar-An Ancient Religious & Rur...1s kartic chandr barman (ar)Shakti peeth Bakreswar-An Ancient Religious & Rur...
1s kartic chandr barman (ar)Shakti peeth Bakreswar-An Ancient Religious & Rur...
 
Web 2.0
Web 2.0Web 2.0
Web 2.0
 
2008 revision
2008 revision2008 revision
2008 revision
 
PPT 1 - MAP jae
PPT 1 - MAP jaePPT 1 - MAP jae
PPT 1 - MAP jae
 
Presentatie Nick Hoogveldt
Presentatie Nick HoogveldtPresentatie Nick Hoogveldt
Presentatie Nick Hoogveldt
 
2.. guia sistemas subneting
2.. guia sistemas subneting2.. guia sistemas subneting
2.. guia sistemas subneting
 
CML2117 Introduction to Law, 2008 - Lecture 16 - Charter cases
CML2117 Introduction to Law, 2008 - Lecture 16 - Charter casesCML2117 Introduction to Law, 2008 - Lecture 16 - Charter cases
CML2117 Introduction to Law, 2008 - Lecture 16 - Charter cases
 
How social technologies drives business success - Google - Millward Brown - M...
How social technologies drives business success - Google - Millward Brown - M...How social technologies drives business success - Google - Millward Brown - M...
How social technologies drives business success - Google - Millward Brown - M...
 
198 Crowd Funding Club
198 Crowd Funding Club198 Crowd Funding Club
198 Crowd Funding Club
 
Abc
AbcAbc
Abc
 
Schools in england
Schools in england Schools in england
Schools in england
 
Autism App
Autism App Autism App
Autism App
 
Slideshare Showcase
Slideshare ShowcaseSlideshare Showcase
Slideshare Showcase
 
Where has all the Liquidity Gone?
Where has all the Liquidity Gone?Where has all the Liquidity Gone?
Where has all the Liquidity Gone?
 
Mapa - Material educativo digital
Mapa - Material educativo digitalMapa - Material educativo digital
Mapa - Material educativo digital
 
Infovaardigheden 2012
Infovaardigheden 2012Infovaardigheden 2012
Infovaardigheden 2012
 
Presentatie Sterk water
Presentatie Sterk waterPresentatie Sterk water
Presentatie Sterk water
 

Semelhante a 45281 ch02 final

Module 3 comp 312 - computer fundamentals and programming
Module 3   comp 312 - computer fundamentals and programmingModule 3   comp 312 - computer fundamentals and programming
Module 3 comp 312 - computer fundamentals and programmingdiosdadamendoza
 
Basic excel training - 20140825.ppt
Basic excel training - 20140825.pptBasic excel training - 20140825.ppt
Basic excel training - 20140825.pptAnuHospitalsHumanRes
 
In Section 1 on the Data page, complete each column of the spreads.docx
In Section 1 on the Data page, complete each column of the spreads.docxIn Section 1 on the Data page, complete each column of the spreads.docx
In Section 1 on the Data page, complete each column of the spreads.docxsleeperharwell
 
data_analysis_step_by_step_booklet.pdf
data_analysis_step_by_step_booklet.pdfdata_analysis_step_by_step_booklet.pdf
data_analysis_step_by_step_booklet.pdfSanthosh Prabhu
 
Learn Advanced Excel Online
Learn Advanced Excel OnlineLearn Advanced Excel Online
Learn Advanced Excel Onlinebigspire
 
Lesson 10 FUNCTIONS AND FORMULAS IN AN E.pptx
Lesson 10 FUNCTIONS AND FORMULAS IN AN E.pptxLesson 10 FUNCTIONS AND FORMULAS IN AN E.pptx
Lesson 10 FUNCTIONS AND FORMULAS IN AN E.pptxCristineJoyVillajuan
 
A Presentation on Spreadsheet
A Presentation on SpreadsheetA Presentation on Spreadsheet
A Presentation on SpreadsheetEjiro Ndifereke
 
Pranavi verma-class-9-spreadsheet
Pranavi verma-class-9-spreadsheetPranavi verma-class-9-spreadsheet
Pranavi verma-class-9-spreadsheetPranaviVerma
 
Pivot tableinfo
Pivot tableinfoPivot tableinfo
Pivot tableinfoEsha Saha
 
Acct120 Class #14 Microsoft Excel Features
Acct120   Class #14   Microsoft Excel FeaturesAcct120   Class #14   Microsoft Excel Features
Acct120 Class #14 Microsoft Excel FeaturesAdjem
 
Entering Data - Excel 2013 Tutorial
Entering Data - Excel 2013 TutorialEntering Data - Excel 2013 Tutorial
Entering Data - Excel 2013 TutorialSpreadsheetTrainer
 
How to use microsoft excel
How to use microsoft excelHow to use microsoft excel
How to use microsoft excelgirum003
 
Spreadsheet for Year 8
Spreadsheet for Year 8Spreadsheet for Year 8
Spreadsheet for Year 8qistinahJR
 

Semelhante a 45281 ch02 final (20)

Module 3 comp 312 - computer fundamentals and programming
Module 3   comp 312 - computer fundamentals and programmingModule 3   comp 312 - computer fundamentals and programming
Module 3 comp 312 - computer fundamentals and programming
 
Basic excel training - 20140825.ppt
Basic excel training - 20140825.pptBasic excel training - 20140825.ppt
Basic excel training - 20140825.ppt
 
In Section 1 on the Data page, complete each column of the spreads.docx
In Section 1 on the Data page, complete each column of the spreads.docxIn Section 1 on the Data page, complete each column of the spreads.docx
In Section 1 on the Data page, complete each column of the spreads.docx
 
Excel-1.pdf
Excel-1.pdfExcel-1.pdf
Excel-1.pdf
 
data_analysis_step_by_step_booklet.pdf
data_analysis_step_by_step_booklet.pdfdata_analysis_step_by_step_booklet.pdf
data_analysis_step_by_step_booklet.pdf
 
Learn Advanced Excel Online
Learn Advanced Excel OnlineLearn Advanced Excel Online
Learn Advanced Excel Online
 
Excel training
Excel trainingExcel training
Excel training
 
Excel booklet
Excel bookletExcel booklet
Excel booklet
 
Ms excel 2007 tutorial
Ms excel 2007 tutorialMs excel 2007 tutorial
Ms excel 2007 tutorial
 
3 inner plumbing Excel tips
3 inner plumbing Excel tips3 inner plumbing Excel tips
3 inner plumbing Excel tips
 
Lesson 10 FUNCTIONS AND FORMULAS IN AN E.pptx
Lesson 10 FUNCTIONS AND FORMULAS IN AN E.pptxLesson 10 FUNCTIONS AND FORMULAS IN AN E.pptx
Lesson 10 FUNCTIONS AND FORMULAS IN AN E.pptx
 
Tech training workshop 3 final 090810
Tech training   workshop 3 final 090810Tech training   workshop 3 final 090810
Tech training workshop 3 final 090810
 
A Presentation on Spreadsheet
A Presentation on SpreadsheetA Presentation on Spreadsheet
A Presentation on Spreadsheet
 
Pranavi verma-class-9-spreadsheet
Pranavi verma-class-9-spreadsheetPranavi verma-class-9-spreadsheet
Pranavi verma-class-9-spreadsheet
 
Gse 213 lesson 3
Gse 213 lesson 3Gse 213 lesson 3
Gse 213 lesson 3
 
Pivot tableinfo
Pivot tableinfoPivot tableinfo
Pivot tableinfo
 
Acct120 Class #14 Microsoft Excel Features
Acct120   Class #14   Microsoft Excel FeaturesAcct120   Class #14   Microsoft Excel Features
Acct120 Class #14 Microsoft Excel Features
 
Entering Data - Excel 2013 Tutorial
Entering Data - Excel 2013 TutorialEntering Data - Excel 2013 Tutorial
Entering Data - Excel 2013 Tutorial
 
How to use microsoft excel
How to use microsoft excelHow to use microsoft excel
How to use microsoft excel
 
Spreadsheet for Year 8
Spreadsheet for Year 8Spreadsheet for Year 8
Spreadsheet for Year 8
 

Último

B2 Interpret the brief.docxccccccccccccccc
B2 Interpret the brief.docxcccccccccccccccB2 Interpret the brief.docxccccccccccccccc
B2 Interpret the brief.docxcccccccccccccccMollyBrown86
 
Corporate Presentation Probe May 2024.pdf
Corporate Presentation Probe May 2024.pdfCorporate Presentation Probe May 2024.pdf
Corporate Presentation Probe May 2024.pdfProbe Gold
 
slideshare Call girls Noida Escorts 9999965857 henakhan
slideshare Call girls Noida Escorts 9999965857 henakhanslideshare Call girls Noida Escorts 9999965857 henakhan
slideshare Call girls Noida Escorts 9999965857 henakhanhanshkumar9870
 
VVIP Pune Call Girls Sopan Baug WhatSapp Number 8005736733 With Elite Staff A...
VVIP Pune Call Girls Sopan Baug WhatSapp Number 8005736733 With Elite Staff A...VVIP Pune Call Girls Sopan Baug WhatSapp Number 8005736733 With Elite Staff A...
VVIP Pune Call Girls Sopan Baug WhatSapp Number 8005736733 With Elite Staff A...SUHANI PANDEY
 
Vijayawada ( Call Girls ) Pune 6297143586 Hot Model With Sexy Bhabi Ready F...
Vijayawada ( Call Girls ) Pune  6297143586  Hot Model With Sexy Bhabi Ready F...Vijayawada ( Call Girls ) Pune  6297143586  Hot Model With Sexy Bhabi Ready F...
Vijayawada ( Call Girls ) Pune 6297143586 Hot Model With Sexy Bhabi Ready F...tanu pandey
 
VIP Call Girl Amritsar 7001035870 Enjoy Call Girls With Our Escorts
VIP Call Girl Amritsar 7001035870 Enjoy Call Girls With Our EscortsVIP Call Girl Amritsar 7001035870 Enjoy Call Girls With Our Escorts
VIP Call Girl Amritsar 7001035870 Enjoy Call Girls With Our Escortssonatiwari757
 
Call Girls Chandigarh Just Call 8868886958 Top Class Call Girl Service Available
Call Girls Chandigarh Just Call 8868886958 Top Class Call Girl Service AvailableCall Girls Chandigarh Just Call 8868886958 Top Class Call Girl Service Available
Call Girls Chandigarh Just Call 8868886958 Top Class Call Girl Service AvailableSheetaleventcompany
 
Pakistani Call girls in Ajman +971563133746 Ajman Call girls
Pakistani Call girls in Ajman +971563133746 Ajman Call girlsPakistani Call girls in Ajman +971563133746 Ajman Call girls
Pakistani Call girls in Ajman +971563133746 Ajman Call girlsgwenoracqe6
 
BDSM⚡Call Girls in Hari Nagar Delhi >༒8448380779 Escort Service
BDSM⚡Call Girls in Hari Nagar Delhi >༒8448380779 Escort ServiceBDSM⚡Call Girls in Hari Nagar Delhi >༒8448380779 Escort Service
BDSM⚡Call Girls in Hari Nagar Delhi >༒8448380779 Escort ServiceDelhi Call girls
 
Top Rated Call Girls In Podanur 📱 {7001035870} VIP Escorts Podanur
Top Rated Call Girls In Podanur 📱 {7001035870} VIP Escorts PodanurTop Rated Call Girls In Podanur 📱 {7001035870} VIP Escorts Podanur
Top Rated Call Girls In Podanur 📱 {7001035870} VIP Escorts Podanurdharasingh5698
 
CALL ON ➥8923113531 🔝Call Girls Fazullaganj Lucknow best sexual service
CALL ON ➥8923113531 🔝Call Girls Fazullaganj Lucknow best sexual serviceCALL ON ➥8923113531 🔝Call Girls Fazullaganj Lucknow best sexual service
CALL ON ➥8923113531 🔝Call Girls Fazullaganj Lucknow best sexual serviceanilsa9823
 

Último (20)

(INDIRA) Call Girl Kashmir Call Now 8617697112 Kashmir Escorts 24x7
(INDIRA) Call Girl Kashmir Call Now 8617697112 Kashmir Escorts 24x7(INDIRA) Call Girl Kashmir Call Now 8617697112 Kashmir Escorts 24x7
(INDIRA) Call Girl Kashmir Call Now 8617697112 Kashmir Escorts 24x7
 
@9999965857 🫦 Sexy Desi Call Girls Karol Bagh 💓 High Profile Escorts Delhi 🫶
@9999965857 🫦 Sexy Desi Call Girls Karol Bagh 💓 High Profile Escorts Delhi 🫶@9999965857 🫦 Sexy Desi Call Girls Karol Bagh 💓 High Profile Escorts Delhi 🫶
@9999965857 🫦 Sexy Desi Call Girls Karol Bagh 💓 High Profile Escorts Delhi 🫶
 
B2 Interpret the brief.docxccccccccccccccc
B2 Interpret the brief.docxcccccccccccccccB2 Interpret the brief.docxccccccccccccccc
B2 Interpret the brief.docxccccccccccccccc
 
(‿ˠ‿) Independent Call Girls Laxmi Nagar 👉 9999965857 👈 Delhi : 9999 Cash Pa...
(‿ˠ‿) Independent Call Girls Laxmi Nagar 👉 9999965857 👈 Delhi  : 9999 Cash Pa...(‿ˠ‿) Independent Call Girls Laxmi Nagar 👉 9999965857 👈 Delhi  : 9999 Cash Pa...
(‿ˠ‿) Independent Call Girls Laxmi Nagar 👉 9999965857 👈 Delhi : 9999 Cash Pa...
 
Corporate Presentation Probe May 2024.pdf
Corporate Presentation Probe May 2024.pdfCorporate Presentation Probe May 2024.pdf
Corporate Presentation Probe May 2024.pdf
 
slideshare Call girls Noida Escorts 9999965857 henakhan
slideshare Call girls Noida Escorts 9999965857 henakhanslideshare Call girls Noida Escorts 9999965857 henakhan
slideshare Call girls Noida Escorts 9999965857 henakhan
 
@9999965857 🫦 Sexy Desi Call Girls Vaishali 💓 High Profile Escorts Delhi 🫶
@9999965857 🫦 Sexy Desi Call Girls Vaishali 💓 High Profile Escorts Delhi 🫶@9999965857 🫦 Sexy Desi Call Girls Vaishali 💓 High Profile Escorts Delhi 🫶
@9999965857 🫦 Sexy Desi Call Girls Vaishali 💓 High Profile Escorts Delhi 🫶
 
Russian Call Girls Rohini Sector 3 💓 Delhi 9999965857 @Sabina Modi VVIP MODEL...
Russian Call Girls Rohini Sector 3 💓 Delhi 9999965857 @Sabina Modi VVIP MODEL...Russian Call Girls Rohini Sector 3 💓 Delhi 9999965857 @Sabina Modi VVIP MODEL...
Russian Call Girls Rohini Sector 3 💓 Delhi 9999965857 @Sabina Modi VVIP MODEL...
 
Rohini Sector 15 Call Girls Delhi 9999965857 @Sabina Saikh No Advance
Rohini Sector 15 Call Girls Delhi 9999965857 @Sabina Saikh No AdvanceRohini Sector 15 Call Girls Delhi 9999965857 @Sabina Saikh No Advance
Rohini Sector 15 Call Girls Delhi 9999965857 @Sabina Saikh No Advance
 
VVIP Pune Call Girls Sopan Baug WhatSapp Number 8005736733 With Elite Staff A...
VVIP Pune Call Girls Sopan Baug WhatSapp Number 8005736733 With Elite Staff A...VVIP Pune Call Girls Sopan Baug WhatSapp Number 8005736733 With Elite Staff A...
VVIP Pune Call Girls Sopan Baug WhatSapp Number 8005736733 With Elite Staff A...
 
Vijayawada ( Call Girls ) Pune 6297143586 Hot Model With Sexy Bhabi Ready F...
Vijayawada ( Call Girls ) Pune  6297143586  Hot Model With Sexy Bhabi Ready F...Vijayawada ( Call Girls ) Pune  6297143586  Hot Model With Sexy Bhabi Ready F...
Vijayawada ( Call Girls ) Pune 6297143586 Hot Model With Sexy Bhabi Ready F...
 
VIP Call Girl Amritsar 7001035870 Enjoy Call Girls With Our Escorts
VIP Call Girl Amritsar 7001035870 Enjoy Call Girls With Our EscortsVIP Call Girl Amritsar 7001035870 Enjoy Call Girls With Our Escorts
VIP Call Girl Amritsar 7001035870 Enjoy Call Girls With Our Escorts
 
Call Girls Chandigarh Just Call 8868886958 Top Class Call Girl Service Available
Call Girls Chandigarh Just Call 8868886958 Top Class Call Girl Service AvailableCall Girls Chandigarh Just Call 8868886958 Top Class Call Girl Service Available
Call Girls Chandigarh Just Call 8868886958 Top Class Call Girl Service Available
 
Pakistani Call girls in Ajman +971563133746 Ajman Call girls
Pakistani Call girls in Ajman +971563133746 Ajman Call girlsPakistani Call girls in Ajman +971563133746 Ajman Call girls
Pakistani Call girls in Ajman +971563133746 Ajman Call girls
 
BDSM⚡Call Girls in Hari Nagar Delhi >༒8448380779 Escort Service
BDSM⚡Call Girls in Hari Nagar Delhi >༒8448380779 Escort ServiceBDSM⚡Call Girls in Hari Nagar Delhi >༒8448380779 Escort Service
BDSM⚡Call Girls in Hari Nagar Delhi >༒8448380779 Escort Service
 
Top Rated Call Girls In Podanur 📱 {7001035870} VIP Escorts Podanur
Top Rated Call Girls In Podanur 📱 {7001035870} VIP Escorts PodanurTop Rated Call Girls In Podanur 📱 {7001035870} VIP Escorts Podanur
Top Rated Call Girls In Podanur 📱 {7001035870} VIP Escorts Podanur
 
CALL ON ➥8923113531 🔝Call Girls Fazullaganj Lucknow best sexual service
CALL ON ➥8923113531 🔝Call Girls Fazullaganj Lucknow best sexual serviceCALL ON ➥8923113531 🔝Call Girls Fazullaganj Lucknow best sexual service
CALL ON ➥8923113531 🔝Call Girls Fazullaganj Lucknow best sexual service
 
Call Girls 🫤 East Of Kailash ➡️ 9999965857 ➡️ Delhi 🫦 Russian Escorts FULL ...
Call Girls 🫤 East Of Kailash ➡️ 9999965857  ➡️ Delhi 🫦  Russian Escorts FULL ...Call Girls 🫤 East Of Kailash ➡️ 9999965857  ➡️ Delhi 🫦  Russian Escorts FULL ...
Call Girls 🫤 East Of Kailash ➡️ 9999965857 ➡️ Delhi 🫦 Russian Escorts FULL ...
 
(👉゚9999965857 ゚)👉 VIP Call Girls Friends Colony 👉 Delhi 👈 : 9999 Cash Payment...
(👉゚9999965857 ゚)👉 VIP Call Girls Friends Colony 👉 Delhi 👈 : 9999 Cash Payment...(👉゚9999965857 ゚)👉 VIP Call Girls Friends Colony 👉 Delhi 👈 : 9999 Cash Payment...
(👉゚9999965857 ゚)👉 VIP Call Girls Friends Colony 👉 Delhi 👈 : 9999 Cash Payment...
 
Rohini Sector 17 Call Girls Delhi 9999965857 @Sabina Saikh No Advance
Rohini Sector 17 Call Girls Delhi 9999965857 @Sabina Saikh No AdvanceRohini Sector 17 Call Girls Delhi 9999965857 @Sabina Saikh No Advance
Rohini Sector 17 Call Girls Delhi 9999965857 @Sabina Saikh No Advance
 

45281 ch02 final

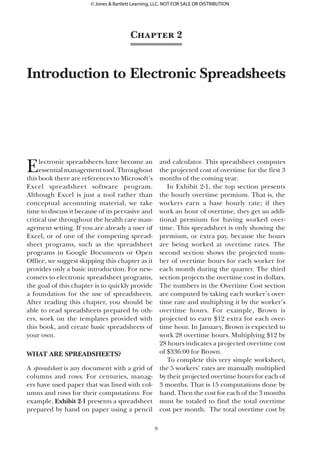
  • 1. Electronic spreadsheets have become an essential management tool. Throughout this book there are references to Microsoft’s Excel spreadsheet software program. Although Excel is just a tool rather than conceptual accounting material, we take time to discuss it because of its pervasive and critical use throughout the health care man- agement setting. If you are already a user of Excel, or of one of the competing spread- sheet programs, such as the spreadsheet programs in Google Documents or Open Office, we suggest skipping this chapter as it provides only a basic introduction. For new- comers to electronic spreadsheet programs, the goal of this chapter is to quickly provide a foundation for the use of spreadsheets. After reading this chapter, you should be able to read spreadsheets prepared by oth- ers, work on the templates provided with this book, and create basic spreadsheets of your own. What Are Spreadsheets? A spreadsheet is any document with a grid of columns and rows. For centuries, manag- ers have used paper that was lined with col- umns and rows for their computations. For example, Exhibit 2-1 presents a spreadsheet prepared by hand on paper using a pencil and calculator. This spreadsheet computes the projected cost of overtime for the first 3 months of the coming year. In Exhibit 2-1, the top section presents the hourly overtime premium. That is, the workers earn a base hourly rate; if they work an hour of overtime, they get an addi- tional premium for having worked over- time. This spreadsheet is only showing the premium, or extra pay, because the hours are being worked at overtime rates. The second section shows the projected num- ber of overtime hours for each worker for each month during the quarter. The third section projects the overtime cost in dollars. The numbers in the Overtime Cost section are computed by taking each worker’s over- time rate and multiplying it by the worker’s overtime hours. For example, Brown is projected to earn $12 extra for each over- time hour. In January, Brown is expected to work 28 overtime hours. Multiplying $12 by 28 hours indicates a projected overtime cost of $336.00 for Brown. To complete this very simple worksheet, the 5 workers’ rates are manually multiplied by their projected overtime hours for each of 3 months. That is 15 computations done by hand. Then the cost for each of the 3 months must be totaled to find the total overtime cost per month. The total overtime cost by 9 Chapter 2 Introduction to Electronic Spreadsheets 45281_Ch02_FINAL.indd 9 11/4/11 1:38:38 PM © Jones & Bartlett Learning, LLC. NOT FOR SALE OR DISTRIBUTION
  • 2. 10  Accounting Fundamentals for Health Care Management the Microsoft Excel spreadsheet software program installed as part of the Microsoft Office suite of programs. Much of what is done using Excel could be done manually, but electronic spreadsheets can do compu- tations faster and with fewer errors. The most essential feature of electronic spreadsheets is the ability to recompute results quickly, easily, and reliably as any ele- ment in the spreadsheet changes. One num- ber within the spreadsheet can be changed, and the results of the analysis can be auto- matically and quickly updated, taking that worker for each of the 3 months must also be computed. There are over 20 computa- tions to be done, and this example presents an extremely limited example of the types of computations that might be done in a health care organization. Electronic Spreadsheets Electronic spreadsheets, such as Excel, are com- puter software programs used for compu- tations and creating charts. Most comput- ers used in the health care industry have Exhibit 2-1  Spreadsheet Prepared by Hand 45281_Ch02_FINAL.indd 10 11/4/11 1:38:38 PM © Jones & Bartlett Learning, LLC. NOT FOR SALE OR DISTRIBUTION
  • 3. Chapter 2: Introduction to Electronic Spreadsheets  11 worksheet. The worksheet extends off to the right, showing more and more columns. It doesn’t stop at Column Z. After Column Z comes Column AA, AB, etc. And if you were to scroll down, there are thousands of rows. The intersection of a column and row is called a “Cell.” Each cell can be referenced by its cell name, which is its column and row. For example, in Exhibit 2-3, the high- lighted cell is referred to as Cell C4. So, if someone told you to look at Cell C4 on the spreadsheet that they just emailed to you, you would open the spreadsheet file and look at the contents of the cell in Column C and Row 4. change into account. This allows managers to do many “what if” analyses, evaluating a pro- jection under a wide range of assumptions. So, if it turned out that the overtime rate for Jones is not $11.00, but is actually $12.50, the $11.00 could be changed in an elec- tronic spreadsheet, and all of the Overtime Cost computations would be recalculated automatically. Also, all of the column and row totals would automatically recompute. This allows users to avoid a great deal of time-consuming, error-prone work. This will be demonstrated later in the chapter. The Basics Exhibit 2-2 provides a screenshot of an example of an Excel spreadsheet. When you open the software program, the computer screen looks something like this, with icons and menu choices at the top of the screen. The key focus of a spreadsheet, however, is on the rows and columns that create a grid. Exhibit 2-2 displays just a small part of the spreadsheet, alternatively called a Exhibit 2-2  Initial Excel Screen Exhibit 2-3  Cell Reference 45281_Ch02_FINAL.indd 11 11/4/11 1:38:38 PM © Jones & Bartlett Learning, LLC. NOT FOR SALE OR DISTRIBUTION
  • 4. 12  Accounting Fundamentals for Health Care Management Exhibit 2-5. The total of 476.5 appears in Cell A1, and you no longer see the formula “=128.92+347.58” in Cell A1. However, that underlying formula has not gone away. Excel maintains that information, and displays it in a “formula bar” that appears just above the columns, to the right of the letters “fx.” The formula bar still shows “=128.92+347.58.” At any time, you can move the cursor to any cell in the spreadsheet, and the formula bar will display the underlying formula that allowed you to arrive at the number displayed in the cell. Also note that to the left of the formula bar, you see A1. This identifies the fact that the “=128.92+347.58” you see in the formula bar is the formula for the data in Cell A1. Excel follows some conventions for the order in which computations are done. Suppose we told Excel to compute “=128.92+347.58/3.” This instruction is ambiguous. Do we mean that we want to add 128.92+347.58 and then divide that total by 3? Or do we mean we want to divide 347.58 by 3 and then add that result to 128.92? If we mean the former, then the result is 158.83, but if we mean the latter, then the result is 244.78. Very different results. Excel is programmed so that multiplica- tion and division are done first, followed by addition and subtraction. Therefore, if we don’t specifically instruct otherwise, Excel will interpret “=128.92+347.58/3” as asking to first divide 347.58 by 3, and The starting point for an Excel spread- sheet is to enter data in cells. You may want to have a computer nearby as you read this section, so you can follow the steps dis- cussed here directly in Excel. The first step is to open the software program. When it opens, you should see a screen similar to Exhibit 2-2. Next, move your cursor to the Cell A1 box, and left click the mouse. When you left click, Cell A1 is outlined in black, as Cell C4 is in Exhibit 2-3. This quickly orients you as to where you are in the worksheet. Now let’s enter some data. Type 128.92, and then press the Enter key. That’s all there is to it. You now know how to enter data in Excel. On your spreadsheet, in Cell A1, you should now see the number 128.92. The primary purpose of spreadsheet pro- grams is to perform computations. All com- putations in Excel start with an equals (=) sign. The plus (+) sign is used for addition, the minus (-) sign for subtraction, the for- ward slash (/) for division, and an asterisk (*) for multiplication. Suppose we want to add together two numbers—for example, 128.92 and 347.58. Put your cursor in a cell by moving the mouse to the desired cell and hitting the left mouse button, and then type “=128.92+347.58.” Exhibit 2-4 shows what you would see in Excel when you type that before you hit the Enter key. Next, hit the Enter key. You should immediately see something that looks like Exhibit 2-4  Performing a Simple Computation Exhibit 2-5  Results of Computation 45281_Ch02_FINAL.indd 12 11/4/11 1:38:38 PM © Jones & Bartlett Learning, LLC. NOT FOR SALE OR DISTRIBUTION
  • 5. Chapter 2: Introduction to Electronic Spreadsheets  13 Yet another way to do this addition would be to type cell references. That is, rather than adding the specific numbers in each cell or moving the cursor to each cell that we want to include in the computation, we can tell Excel to add the values that appear in each cell by referring to the cell addresses. For example, we could move our cursor to Cell B7, type “=B3+B4+B5+B6,” and then hit Enter. Again the total “499” will appear in B7. But this is a laborious process. If you have quite a few numbers to add up, you would want a faster approach. A quicker way to do this is to use the SUM function. This is one of many functions programmed into the software. To use this function, type the equal sign, then “SUM,” and then an open paren- thesis, or “=SUM(”. Next, type the range of values. In this case, since we are adding everything from Cell B3 through Cell B6, you would type “=SUM(B3:B6).” The colon in the formula indicates a range and lets Excel know that we want to use all of the val- ues from B3 through B6. Again, you will see the total “499” appear in Cell B7. Still another way to approach this com- putation is to use the summation icon. The Greek letter sigma (∑) is used in mathemat- ics to indicate that a group of numbers are being added together. In Excel, there is a ∑ icon in the menu at the top of the screen. Move your cursor to B7, left click your mouse so Excel knows you want to work on Cell B7, then click the ∑ icon and hit Enter (see Exhibit 2-6). When you first click on ∑, it will show the range of numbers that Excel assumes you want to sum. When you click Enter, you are accepting that range. If you have a continuous column of num- bers, when you click on the ∑ icon, Excel will assume you want to add that entire col- umn. Notice in Exhibit 2-6 how the range of cells was put in a box when the ∑ icon was then add 128.92. To prevent ambiguity and also to avoid computations from being done in a different way than expected without you even knowing that your result is wrong, it is always safest to use paren- theses to group your computations in a clear manner. You should show this com- putation as: “=(128.92+347.58)/3” or as “=128.92+(347.58/3).” By doing this, the computation you want will not only be clear to Excel, but it will also be clear to you when you come back and look at your spreadsheet later, or to another user, if you share the spreadsheet file with someone else. Different Ways to Accomplish the Same Task Electronic spreadsheets allow you to achieve the same result in more than one way. Suppose we have the following: in Cell B3 we have 42, in Cell B4 we have 29, in Cell B5 we have 247, and in Cell B6 we have 181. If we want to add those values and show the total in Cell B7, we could move our cursor to Cell B7, left click our mouse, putting the cursor firmly in Cell B7, typing “=42+29+247+181,” and then hitting Enter. The total “499” would appear in Cell B7. However, we could also get to that same result in other ways. We could put the cur- sor in Cell B7 and left click. Then, type an equals sign, move the cursor up to Cell B3, left click in Cell B3, and then type a plus sign. Next, move the cursor to Cell B4, left click in Cell B4, and then hit the plus sign. Next, move the cursor to B5, left click, and then hit the plus sign. Repeat the process until you get to Cell B6. When you move the cursor to Cell B6 and left click, instead of hitting plus, simply hit Enter. That will tell Excel that you have finished adding values for the computation, and the total “499” will appear in Cell B7. 45281_Ch02_FINAL.indd 13 11/4/11 1:38:38 PM © Jones & Bartlett Learning, LLC. NOT FOR SALE OR DISTRIBUTION
  • 6. 14  Accounting Fundamentals for Health Care Management Formatting an Electronic Spreadsheet Exhibit 2-1 represents a handwritten, paper spreadsheet. Now let’s move this onto an Excel spreadsheet so we can see how things differ using Excel. In Exhibit 2-9, you see clicked, and the formula “=Sum(B3:B6)” was filled in by Excel. However, if you are trying to add a column of numbers with a break in it, Excel may misinterpret your intent. For example, suppose that cell B4 is empty, and we want to add Cells B3 through B6. If we click on the ∑ icon, Excel will leave out Cell B3 (see Exhibit 2-7). In Exhibit 2-7, we see that Excel assumes you just want to add B5 through B6. If in fact you want to add all the numbers in Column B, put your cursor in B7, left click, then click on ∑ from the menu at the top. Then, when Excel shows the incorrect range, you click on Cell B6 and, while holding the left mouse button down, drag your mouse up to B3, release the mouse button, and then hit Enter. Excel will sum the range of cells you indicated. After either using the SUM func- tion or the ∑, the total and the formula will appear as seen in Exhibit 2-8. Exhibit 2-6  Using the Sigma Icon Exhibit 2-7  Using Sigma with Noncontiguous Numbers 45281_Ch02_FINAL.indd 14 11/4/11 1:38:39 PM © Jones & Bartlett Learning, LLC. NOT FOR SALE OR DISTRIBUTION
  • 7. Chapter 2: Introduction to Electronic Spreadsheets  15 Exhibit 2-8  Excel Screen After Use of Sigma for Addition Exhibit 2-9  Transferring the Spreadsheet from Paper 45281_Ch02_FINAL.indd 15 11/4/11 1:38:39 PM © Jones & Bartlett Learning, LLC. NOT FOR SALE OR DISTRIBUTION
  • 8. 16  Accounting Fundamentals for Health Care Management columns seem to be off against the left side of each column, but the numbers are against the right edge of each column. In Rows 17 to 22, you can’t even read the data. Instead, you see a bunch of “#” signs. All of these are formatting issues. The labels in Column A are cut off, because the column isn’t wide enough for them. The # signs in Columns B through E indicate that the column is too narrow to dis- play the number. How can we fix this? Excel has a number of ways that we can change the column width to fix these formatting issues. One approach is to instruct Excel to make each column wide enough to display the widest data in that column. Click the Home tab in the upper left part of the screen. This all of the headings and text labels from the left hand column of Exhibit 2-1 copied into Column A of an Excel spreadsheet. This does not look too different from the paper spreadsheet. One thing to note, however, is that some of the text extends beyond Column A. This is fine. As long as the cell to the right is empty, a data label can extend beyond the width of its cell. But what happens when we enter the rest of the data from the paper spreadsheet into the electronic one? Look at Exhibit 2-10, which now includes all of the data from Exhibit 2-1. Exhibit 2-10 is a bit of a mess. The labels in Column A are partly covered by the data in Column B. The month headings in the Exhibit 2-10  Spreadsheet with Data Entered 45281_Ch02_FINAL.indd 16 11/4/11 1:38:39 PM © Jones & Bartlett Learning, LLC. NOT FOR SALE OR DISTRIBUTION
  • 9. Chapter 2: Introduction to Electronic Spreadsheets  17 to set the column width. You can click on the question mark (?) in the menu bar at the top of the screen to access the Help function. Once it opens, you would type your question, such as “how do you set the column width” or simply type “set column width” and explanations of how to proceed are shown. In fact, whenever you get stuck in Excel, the first place to go is the Help func- tion. Sometimes it can be a bit frustrating to use Excel’s Help function and you may have to word your question several different ways until you get the relevant response. If you are persistent, however, you can usually accomplish what you want either by care- fully reviewing the various menu options that exist or by using the Help function. The spreadsheet in Exhibit 2-12 has a few other formatting changes. The col- umn headings have been right-justified and underlined. This is done using the alignment and underlining icons from the menu at the top, which are the same icons used in Microsoft Word. Notice that will allow you to access the Format menu. Next, click your mouse in a cell in one cor- ner of the spreadsheet, such as on Cell A1. Left click the mouse and drag, with the left button depressed, to cover all columns and rows in your spreadsheet that have data. For the spreadsheet in Exhibit 2-10, you would drag to cover the range from A1 to E22. Release the mouse button, and then click on “Format” from the menu at the top of the screen to display a drop down menu. From that menu, you click on Autofit Column. Different versions of Excel have menu bars at the top that appear somewhat differently, but the same features exist. After you click on Autofit Column, the column widths change. Exhibit 2-11 shows the pro- cess for formatting, and Exhibit 2-12 shows the spreadsheet after the column widths have been adjusted. In Exhibit 2-12, we can see that Column A got wider, displaying all of the text. All of the information in the spreadsheet has become readable. There are a number of other ways Exhibit 2-11  Autofit Column Width 45281_Ch02_FINAL.indd 17 11/4/11 1:38:39 PM © Jones & Bartlett Learning, LLC. NOT FOR SALE OR DISTRIBUTION
  • 10. 18  Accounting Fundamentals for Health Care Management Cells window, you can indicate that the cell should be formatted as currency, with or without dollar signs and with or without dec- imal places showing. Or you can format the cells as percentages, fractions, or even dates. If you click on the alignment tab in this Format Cells window, you can right align, left align, and even turn text on an angle, instead of appearing horizontal. The font tab allows you to change fonts and font sizes, as well as add underlines and other effects. The border tab allows you to add grid lines or create borders around your work. It is worth spending some time exploring the format commands that are available. Row 22 now has double underlines. This is commonly used in accounting to indicate a final total for a column of numbers. To find the option to use a double underline, use the mouse to select the range of cells you wish to format—for example, left click on B22, drag the mouse to E22, and then release the mouse button. Next, right click the mouse, and select the Format Cells choice. A Format Cells window opens. In the Font tab area, you can choose a double underline option. There are many format options available to improve the appearance of the spread- sheet. In the Number tab within the Format Exhibit 2-12  Spreadsheet with Adjusted Column Width 45281_Ch02_FINAL.indd 18 11/4/11 1:38:39 PM © Jones & Bartlett Learning, LLC. NOT FOR SALE OR DISTRIBUTION
  • 11. Chapter 2: Introduction to Electronic Spreadsheets  19 have to go back and manually recompute every calculation you had initially made. You would have to multiply the new $12.50 by the number of hours for each month to get the new Overtime Cost for Jones for each month. Then, you would have to find a total for the Overtime Cost for all workers for each month and in total. You would also have to find a new Overtime Cost total for Jones for the 3 months. Excel, however, has the capability, if you set up your spreadsheet correctly, to auto- matically do all of the computations when you change $11.00 to $12.50. That is, you would simply put your cursor in Cell B4, type 12.50, and hit Enter, and all the numbers in your spreadsheet would immediately be revised, as Exhibit 2-13 shows. Updating the Spreadsheet Spreadsheetsoftenhavetobeupdatedbecause assumptions change, errors are found, or time passes and you want to replace old data with new information. With paper spread- sheets, the process of updating the spread- sheet is laborious. All computations have to be redone. This can be a very time-consuming process, but this is where an electronic spread- sheet, such as Excel, well... excels. Exhibit 2-12 shows the example you have been working with. Suppose that you now determine that there had been an error in the hourly premium for Jones. Although it shows it as $11 per hour, it should be $12.50. If you were using a paper spreadsheet, you would Exhibit 2-13  Updated Spreadsheet 45281_Ch02_FINAL.indd 19 11/4/11 1:38:39 PM © Jones & Bartlett Learning, LLC. NOT FOR SALE OR DISTRIBUTION
  • 12. 20  Accounting Fundamentals for Health Care Management formulas used to develop the worksheet are shown. When you enter each of these formulas—as soon as you hit the Enter key—you see the numerical value, as seen in Exhibit 2-12. If you put your cursor in any cell, the formula used to generate the num- ber in that cell appears in the Formula bar above the columns (just to the right of “fx”). When you set up the spreadsheet, you put the premium rate for each worker in Column B. However, since the Overtime Premiums are the same each month, as indicated in Columns C and D, refer back to the value in Column B. For example, the value for C2 is shown as “=B2,” rather than $12.00. In the Overtime Hours section, the totals are not added manually. Both the totals by month and the totals by employee are calculated Notice in Exhibit 2-13 that as soon as we entered 12.50, each of the numbers with an arrow next to it has automatically changed. Compare the numbers in Exhibits 2-13 and 2-12. How can Excel do that? It does this based on the use of formulas. The key is that when you create the spreadsheet, you don’t manually do any of the computations. Rather, you define the relationship between the numbers in each cell and let the pro- gram do the initial computations. This provides the program with the information needed to update all computations as data changes. For example, look at Exhibit 2-14. When you enter your information into the spread- sheet you don’t enter numbers, you enter relationships. In this Exhibit, all of the Exhibit 2-14  Using Cell Relationships and Formulas 45281_Ch02_FINAL.indd 20 11/4/11 1:38:39 PM © Jones & Bartlett Learning, LLC. NOT FOR SALE OR DISTRIBUTION
  • 13. Chapter 2: Introduction to Electronic Spreadsheets  21 there is a significant chance arithmetical errors will occur, especially if there are a lot of computations. If you are using Excel, you have to be very careful to identify all of your initial relationships correctly, but when changes are made, as long as the revised data is input correctly, you don’t have to worry about computational errors. More Time Savings In addition to saving time when you change numbers in a spreadsheet, Excel also has time- saving features to help you create your spread- sheet. For example, you can copy and paste, just as you would in a Word document. This can be done for numbers, as well as formu- las. If you enter the formula in one cell, after you hit Enter, you can put your cursor on that cell and click on the Copy icon on the menu (the same icon as Microsoft Word uses for copying). Next, move your cursor to the cell you want to paste the information into, and click on the Paste icon. You can also click and drag the mouse, if you want to copy a range of cells. Or you can copy one cell, and then click and drag to paste the formula from that one cell into a range of cells. Rather than using the Copy and Paste icons from the menus at the top, another way to copy and paste is to right click your mouse and select either Copy or Paste from the menu that appears. One of the great features of electronic spreadsheets is that, if you typed “=A1 + B1” as the formula for Cell C1, it will adjust automatically when you copy C1 and paste it into the range from C2 to C5. That is, the formula that pastes into C2 will not be the original “=A1 + B1,” instead, it will adjust automatically to “=A2 + B2,” and the for- mula that goes into C3 will be “=A3 + B3,” and so on. Excel assumes that if you were adding across in Row 1, you probably want to do the same thing for Rows 2, 3, 4, and by creating a formula. If you were to change the overtime hours for any employee for any month, the totals in that section automatically recompute. All of the cells in the Overtime Cost section are developed using formulas showing cell relationships. When cell B4 is changed from $11.00 to $12.50, Cells C4 and D4 automatically become $12.50, because whatever is in B4 shows up in those cells as well. Cell B19 is “=B4*B11.” When B4 changes, that causes B19 to also change. And because Cell B22 is the total of the five numbers above it, when one of those numbers changes, it also changes. Also note that a change in B4, which results in a change in C4 and D4, causes C19 and D19 to change as well, and those changes cause Cells C22 and D22 to change. Cells E19 and E22 will also change as part of the automatic updates. The ben- efit of entering all cells as relationships rather than numbers is that changing any number in the spreadsheet causes the entire spreadsheet to instantly update. Note again that in a finished spreadsheet, you won’t see all of the formulas in the cells, as shown in Exhibit 2-14. As each cell is completed, the formula is kept in Excel’s memory, but only the resulting number is displayed. These exhibits are an example of a very small spreadsheet. In the health care industry, computations can become quite complex. The time savings from automatic updating provides an enormous benefit. Excel can quickly recompute and update an entire spreadsheet, whether it is one rela- tionship that needs to be updated or hun- dreds or thousands of recomputations. This capability gives you a tremendous advantage if you use Excel rather than doing your com- putations by hand. Further, if the original set of relationships is entered correctly, the updated results are much more reliable. If you are doing all computations by hand, 45281_Ch02_FINAL.indd 21 11/4/11 1:38:39 PM © Jones & Bartlett Learning, LLC. NOT FOR SALE OR DISTRIBUTION
  • 14. 22  Accounting Fundamentals for Health Care Management year to the next, just a few numbers need updating in a saved Excel file. Once data have been analyzed in a spread- sheet, such as Excel, you can easily create charts or graphs showing the results in a way that may make them easier to comprehend. This chapter does not discuss preparation of charts, but once you have the essentials from this chapter, you will be able to go on and learn how to use charts either using the help function within Excel or using the free online tutorial suggested at the end of the chapter. Another advantage of electronic spread- sheets is the ability to link and/or share anal- yses. Once a computer file has been saved, it can be shared with colleagues (e.g., by email or on a thumb drive). This allows them to modify your analysis without having to rec- reate it. Also, files can be linked, so that an analysis can draw on data in another file with- out having to reenter all of the information. In addition, Excel allows you to protect the data in your spreadsheets so that other users cannot change them or can only change them by first entering a password you have established. This function can be accessed through the Tools menu, by clicking the Protection option. Then, you can choose to protect a worksheet or an entire Excel file. Although we generally think about elec- tronic spreadsheets as being computer-based, spreadsheet software programs are now avail- able for download onto tablets, smart phones, and other personal digital assistants (PDAs). In this chapter, we have now covered everything you must know about Excel to work with the templates provided with this book and to create and/or use simple Excel spreadsheets. You now know how to enter data, copy and paste, perform computations, set column widths, format cells, and create formulas for computations. This is simply the tip of the iceberg. There is much more that can be accomplished using Excel that we haven’t covered. With the foundation from 5, and it adjusts the formula for you. This is called copying “relatively.” If the formula for C1 is “=A1 + B1” and you copy cell C1 and paste it into K8, the formula for K8 will alter to “=I8 + J8.” Excel will not only adjust the row, but the columns as well. You can also copy and paste “absolutely.” Sometimes you don’t want Excel to adjust the formula automatically. Suppose you want the formula for cell K8 to be the same exact formula as the formula for cell C1, without any adjustment. In that case, when you cre- ate the formula for C1, you put dollar signs before the cell and columns in the formula. The formula you would type for C1 would be “=$A$1 + $B$1.” Now, if you copy C1 to K8, the formula pasted into cell K8 will remain “=$A$1 + $B$1,” and Excel will compute the sum of the contents of Cells A1 + B1. Sometimes you will want to keep just the row constant or just the column constant. You can adjust that by choosing where to insert dollar signs in the formula. Only the column and/or row with a dollar sign is locked in. As you become familiar with Excel, you will find that you are frequently using the copy and paste commands to save time. Another time-saving device is the use of multiple worksheets within one computer file. You might want some information on one page of a spreadsheet and other infor- mation on another page. You could do this by creating separate files. Alternatively, at the bottom of the spreadsheet, there are tabs labeled “Sheet 1,” “Sheet 2,” and “Sheet 3.” If you double click on any of those tabs you can replace those sheet titles with a more descriptive name for that page or “work- sheet.” There is also a “new sheet” tab to the right of Sheet 3. If you click on this tab, you can add additional sheets as needed. Electronic spreadsheets can be saved and reused, allowing you to save a lot of time because you don’t have to recreate the spreadsheet from scratch. Often, from one 45281_Ch02_FINAL.indd 22 11/4/11 1:38:39 PM © Jones & Bartlett Learning, LLC. NOT FOR SALE OR DISTRIBUTION
  • 15. Chapter 2: Introduction to Electronic Spreadsheets  23 Open a new spreadsheet. Type6. “Practice” in Cell A1. In Cell A2, type the number “35;” in A3, type “42;” and, in A4, type “50.” a. Use the sum function to add them together in cell A5. b. Calculate a 10% increase in the numbers in Column A in Column B by using a formula. Type “Increase 10%” in B1. c. Add together the original numbers in Column A and the increases in Column B. Use a formula and place in Column C. Type “Total” in C1. d. Save the file as “Excel_Practice .xls.” Copy your worksheet from7. Question 6 into another worksheet. Change the increase from 10% to 18%. Protect the worksheet, so that changes cannot be made. Open a new spreadsheet. In Cell A1,8. type “Spending Categories.” In Cell A3, type “Salaries;” in Cell A4, type “Fringe Benefits;” in Cell A5, type “OTPS;” in Cell A6, type “Total.” a. Adjust the column width, so that the text does not cross over into the other column. b. Put the months of the year in the next 12 columns (B–M), and put a total column after (in N). Ad- just any columns as necessary, so the text fits. Care Clinic is preparing a worksheet9. for their staff. Their average starting salary is $60,000. Benefits are 25% this year. They expect benefits to go up to 27% next year. They are expecting to give a raise of 5% next year. Care Clinic has 20 employees. Prepare a formatted Excel Spread- sheet for Care Clinic. this chapter, you should be able to go on and learn additional aspects of Excel as you go, either from the Excel Help function, an Excel how-to book, or online tutorials. Those inter- ested in going further should refer to some of the resources listed at the end of this chapter. Key Concepts Spreadsheets—A document with a grid of columns and rows, often used for financial computations. Electronic spreadsheet—A software pro- gram that allows for automatic recomputa- tions when one number in the spreadsheet changes. Additional Resources Tutorial: A free Excel tutorial may be found at: http://baycongroup.com/ Reading: Harvey, G. 2010. Excel 2010 For Dummies. For Dummies (Computer/Tech). Frye, C.D. 2010. Microsoft Excel 2010 Plain Simple. Microsoft Press. Dodge, M. and Douglas, C.S. 2010. Microsoft Excel 2010 Inside Out. Microsoft Press. Walkenbach, J. 2010. Excel 2010 Bible. Wiley. Test Your Knowledge What is a spreadsheet?1. What is the main benefit of elec-2. tronic spreadsheets? How do formulas for computations3. in Excel begin? What convention does Excel follow4. when doing computations? What Greek letter is the icon for sum-5. ming a column or row of numbers? 45281_Ch02_FINAL.indd 23 11/4/11 1:38:40 PM © Jones Bartlett Learning, LLC. NOT FOR SALE OR DISTRIBUTION
  • 16. 45281_Ch02_FINAL.indd 24 11/4/11 1:38:40 PM © Jones Bartlett Learning, LLC. NOT FOR SALE OR DISTRIBUTION