S&P 500 Index - Dividends and Implied Volatility Surfaces Parameters
•
1 gostou•496 visualizações

S&P 500 Index - Dividends and Implied Volatility Surfaces Parameters

Recomendados
Recomendados
Mais conteúdo relacionado
Mais procurados
Mais procurados (20)
Semelhante a S&P 500 Index - Dividends and Implied Volatility Surfaces Parameters
Semelhante a S&P 500 Index - Dividends and Implied Volatility Surfaces Parameters (20)
Mais de BCV
Mais de BCV (20)
Último
Último (20)
S&P 500 Index - Dividends and Implied Volatility Surfaces Parameters
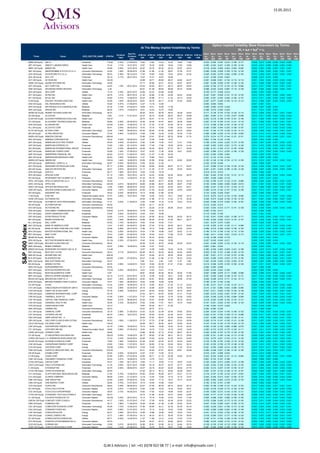
- 1. 15.05.2013 Ticker Name GICS_SECTOR_NAME ATM Ref Dividend Yield Next Ex- Dividend Date ATM Vol - 30D ATM Vol - 60D ATM Vol - 90D ATM Vol - 6M ATM Vol - 12M ATM Vol - 18M ATM Vol - 24M Skew (a) - 30D Skew (a) - 60D Skew (a) - 90D Skew (a) - 6M Skew (a) - 12M Skew (a) - 18M Skew (a) - 24M Skew (b) - 30D Skew (b) - 60D Skew (b) - 90D Skew (b) - 6M Skew (b) - 12M Skew (b) - 18M Skew (b) - 24M MMM UN Equity 3M CO Industrials 110.88 2.33% 21.08.2013 13.64 13.82 14.23 15.22 16.69 17.68 -0.232 -0.335 -0.325 -0.215 -0.189 -0.177 0.026 0.013 0.008 0.006 0.003 0.002 ABT UN Equity ABBOTT LABORATORIES Health Care 37.44 1.71% 10.07.2013 15.87 16.39 16.65 16.94 17.60 18.89 -0.385 -0.303 -0.247 -0.186 -0.155 -0.140 0.016 0.012 0.009 0.006 0.003 0.002 ABBV UN Equity ABBVIE INC Health Care 45.89 3.55% 10.07.2013 22.97 23.78 25.03 24.33 23.97 24.53 -0.018 -0.024 -0.058 -0.052 -0.052 -0.062 0.002 0.003 0.004 0.003 0.001 0.001 ANF UN Equity ABERCROMBIE & FITCH CO-CL A Consumer Discretionary 53.92 1.48% 30.05.2013 47.96 41.98 41.20 39.67 37.36 37.01 -0.265 -0.246 -0.209 -0.165 -0.133 -0.125 0.005 0.004 0.003 0.002 0.001 0.001 ACN UN Equity ACCENTURE PLC-CL A Information Technology 80.52 2.36% 09.10.2013 17.52 18.95 19.62 19.54 20.82 22.34 -0.345 -0.302 -0.278 -0.240 -0.209 -0.183 0.010 0.009 0.007 0.005 0.002 0.002 ACE UN Equity ACE LTD Financials 92.15 2.17% 26.07.2013 13.47 14.31 14.97 16.68 -0.331 -0.339 -0.322 -0.267 0.008 0.010 0.010 0.005 ACT UN Equity ACTAVIS INC Health Care 124.30 33.99 30.71 28.60 26.27 24.54 24.27 -0.091 -0.006 0.001 -0.134 -0.114 -0.112 0.001 0.004 0.004 -0.002 0.004 0.003 ADBE UW Equity ADOBE SYSTEMS INC Information Technology 44.68 27.77 25.96 25.31 25.23 25.87 26.97 -0.281 -0.238 -0.206 -0.167 -0.148 -0.130 0.011 0.009 0.006 0.003 0.002 0.001 ADT UN Equity ADT CORP/THE Industrials 42.40 1.18% 29.07.2013 25.53 25.64 26.71 28.73 28.93 29.00 -0.229 -0.192 -0.170 -0.143 -0.110 -0.092 0.013 0.011 0.008 0.003 0.001 0.001 AMD UN Equity ADVANCED MICRO DEVICES Information Technology 4.40 60.51 61.38 59.93 56.08 53.74 52.89 -0.098 -0.034 -0.035 -0.087 -0.119 -0.108 0.007 0.005 0.004 0.002 0.002 0.001 AES UN Equity AES CORP Utilities 13.19 2.35% 26.07.2013 22.69 23.33 23.46 22.88 -0.105 -0.177 -0.209 -0.214 0.002 0.003 0.004 0.005 AET UN Equity AETNA INC Health Care 59.78 1.41% 09.07.2013 21.20 20.96 21.50 23.28 25.04 25.86 -0.347 -0.261 -0.208 -0.151 -0.116 -0.103 0.013 0.010 0.007 0.003 0.002 0.001 AFL UN Equity AFLAC INC Financials 54.65 3.31% 12.08.2013 20.44 20.88 21.17 21.34 22.14 23.06 -0.492 -0.391 -0.330 -0.240 -0.184 -0.157 0.014 0.011 0.009 0.005 0.003 0.002 A UN Equity AGILENT TECHNOLOGIES INC Health Care 45.95 1.04% 28.06.2013 29.61 28.76 28.17 27.39 27.63 28.62 -0.307 -0.277 -0.246 -0.185 -0.119 -0.112 0.013 0.009 0.007 0.004 0.003 0.002 GAS UN Equity AGL RESOURCES INC Utilities 43.50 4.37% 21.08.2013 13.27 13.16 13.05 -0.093 -0.093 -0.093 0.001 0.001 0.001 APD UN Equity AIR PRODUCTS & CHEMICALS INC Materials 91.34 3.15% 27.06.2013 16.09 16.31 16.56 17.28 -0.269 -0.282 -0.278 -0.228 0.006 0.007 0.006 0.003 ARG UN Equity AIRGAS INC Materials 99.34 1.97% 13.09.2013 18.51 18.32 18.75 19.85 -0.396 -0.419 -0.369 -0.245 0.011 0.012 0.009 0.004 AKAM UW Equity AKAMAI TECHNOLOGIES INC Information Technology 48.37 26.25 35.51 38.76 38.44 35.38 35.54 -0.171 -0.136 -0.124 -0.120 -0.120 -0.112 0.012 0.005 0.002 0.001 0.001 0.000 AA UN Equity ALCOA INC Materials 8.54 1.41% 31.07.2013 22.27 24.70 25.55 26.24 28.27 29.68 0.063 -0.093 -0.121 -0.100 -0.077 -0.059 0.010 0.011 0.009 0.004 0.002 0.002 ALXN UW Equity ALEXION PHARMACEUTICALS INC Health Care 105.37 28.75 30.41 31.16 31.40 31.51 32.84 -0.253 -0.216 -0.189 -0.146 -0.161 -0.148 0.011 0.006 0.004 0.001 0.002 0.001 ATI UN Equity ALLEGHENY TECHNOLOGIES INC Materials 28.85 2.50% 20.09.2013 34.40 34.29 34.97 36.67 38.38 39.68 -0.207 -0.176 -0.160 -0.143 -0.121 -0.110 0.011 0.008 0.005 0.002 0.001 0.001 AGN UN Equity ALLERGAN INC Health Care 103.84 0.24% 14.08.2013 21.16 21.54 21.97 23.60 25.19 24.95 -0.313 -0.228 -0.186 -0.167 -0.148 -0.137 0.014 0.014 0.010 0.003 0.002 0.001 ALL UN Equity ALLSTATE CORP Financials 50.41 2.04% 29.05.2013 15.43 15.16 15.85 17.86 19.30 19.94 -0.390 -0.395 -0.344 -0.235 -0.189 -0.167 0.015 0.015 0.012 0.005 0.003 0.002 ALTR UW Equity ALTERA CORP Information Technology 33.24 1.56% 09.08.2013 24.40 26.38 27.50 28.82 29.75 30.83 -0.221 -0.195 -0.178 -0.150 -0.134 -0.112 0.008 0.006 0.004 0.003 0.001 0.001 MO UN Equity ALTRIA GROUP INC Consumer Staples 37.40 4.95% 14.06.2013 13.56 13.98 14.40 15.29 16.39 17.54 -0.368 -0.289 -0.238 -0.174 -0.106 -0.084 0.013 0.012 0.010 0.006 0.006 0.004 AMZN UW Equity AMAZON.COM INC Consumer Discretionary 268.44 23.68 23.91 25.43 28.78 30.69 31.74 -0.274 -0.214 -0.175 -0.144 -0.121 -0.101 0.015 0.010 0.006 0.003 0.001 0.001 AEE UN Equity AMEREN CORPORATION Utilities 36.22 4.42% 09.09.2013 12.97 13.36 13.68 14.07 0.000 -0.106 -0.152 -0.192 0.000 0.004 0.006 0.006 AEP UN Equity AMERICAN ELECTRIC POWER Utilities 49.25 4.04% 07.08.2013 12.82 12.99 13.00 13.07 14.31 15.08 -0.188 -0.233 -0.244 -0.222 -0.173 -0.155 0.003 0.007 0.008 0.007 0.003 0.002 AXP UN Equity AMERICAN EXPRESS CO Financials 72.80 1.29% 02.10.2013 16.60 17.49 17.90 18.69 20.54 21.44 -0.428 -0.363 -0.305 -0.221 -0.172 -0.148 0.014 0.010 0.008 0.005 0.003 0.002 AIG UN Equity AMERICAN INTERNATIONAL GROUP Financials 46.01 0.43% 09.09.2013 25.30 25.35 26.57 27.70 29.11 30.28 -0.256 -0.191 -0.182 -0.131 -0.105 -0.093 0.013 0.010 0.008 0.003 0.001 0.001 AMT UN Equity AMERICAN TOWER CORP Financials 83.89 1.32% 27.06.2013 15.47 16.53 17.36 18.50 19.61 20.62 -0.425 -0.366 -0.314 -0.233 -0.156 -0.129 0.012 0.012 0.009 0.005 0.004 0.002 AMP UN Equity AMERIPRISE FINANCIAL INC Financials 80.92 2.61% 01.08.2013 19.63 21.07 21.80 22.26 -0.252 -0.282 -0.294 -0.284 0.006 0.005 0.004 0.004 ABC UN Equity AMERISOURCEBERGEN CORP Health Care 55.00 1.64% 16.08.2013 17.31 18.66 19.27 19.66 -0.101 -0.143 -0.153 -0.145 0.002 0.009 0.009 0.004 AMGN UW Equity AMGEN INC Health Care 108.34 1.44% 16.08.2013 23.56 23.59 23.94 24.72 25.82 26.99 -0.163 -0.148 -0.138 -0.124 -0.112 -0.106 0.014 0.010 0.007 0.003 0.002 0.001 APH UN Equity AMPHENOL CORP-CL A Information Technology 80.87 0.54% 09.09.2013 15.55 20.03 21.04 -0.322 -0.279 -0.249 0.009 0.008 0.007 APC UN Equity ANADARKO PETROLEUM CORP Energy 87.17 0.50% 09.09.2013 27.82 28.84 29.06 28.07 27.77 28.27 -0.107 -0.099 -0.103 -0.138 -0.140 -0.132 0.014 0.008 0.005 0.002 0.001 0.001 ADI UW Equity ANALOG DEVICES INC Information Technology 46.51 2.97% 29.05.2013 21.17 21.25 21.37 21.69 22.00 22.53 -0.291 -0.251 -0.225 -0.186 -0.149 -0.128 0.008 0.007 0.006 0.004 0.002 0.002 AON UN Equity AON PLC Financials 66.17 1.06% 30.07.2013 14.54 14.35 14.79 -0.214 -0.310 -0.316 0.004 0.009 0.008 APA UN Equity APACHE CORP Energy 81.10 1.00% 18.07.2013 22.72 23.23 23.65 24.40 25.63 26.70 -0.281 -0.222 -0.194 -0.167 -0.131 -0.113 0.012 0.009 0.006 0.003 0.003 0.002 AIV UN Equity APARTMENT INVT & MGMT CO -A Financials 32.59 3.13% 14.08.2013 21.23 20.18 19.63 19.47 0.000 -0.028 -0.064 -0.133 0.000 -0.001 -0.001 0.003 APOL UW Equity APOLLO GROUP INC-CL A Consumer Discretionary 20.52 41.50 44.63 45.77 44.86 45.33 44.70 -0.199 -0.166 -0.147 -0.122 -0.101 -0.099 0.008 0.005 0.003 0.002 0.001 0.001 AAPL UW Equity APPLE INC Information Technology 434.09 2.81% 08.08.2013 25.66 24.88 26.81 25.80 26.67 27.69 -0.105 -0.094 -0.084 -0.056 -0.029 -0.014 0.011 0.007 0.004 0.002 0.001 0.000 AMAT UW Equity APPLIED MATERIALS INC Information Technology 14.94 2.68% 26.08.2013 25.40 24.42 24.50 24.49 24.91 25.41 -0.295 -0.237 -0.193 -0.151 -0.129 -0.112 0.013 0.008 0.005 0.003 0.002 0.001 ADM UN Equity ARCHER-DANIELS-MIDLAND CO Consumer Staples 34.68 1.67% 13.08.2013 20.06 21.50 22.28 23.08 23.62 24.58 -0.266 -0.216 -0.182 -0.147 -0.122 -0.106 0.021 0.013 0.007 0.004 0.002 0.001 AIZ UN Equity ASSURANT INC Financials 49.22 2.03% 29.08.2013 19.12 20.68 21.69 23.26 -0.123 -0.202 -0.228 -0.201 0.003 0.005 0.005 0.004 T UN Equity AT&T INC Telecommunication Services 37.57 4.84% 10.07.2013 13.82 14.02 15.03 15.21 16.88 18.12 -0.414 -0.270 -0.215 -0.132 -0.104 -0.095 0.017 0.014 0.011 0.007 0.004 0.002 ADSK UW Equity AUTODESK INC Information Technology 39.49 34.54 31.98 31.10 31.23 31.75 32.30 -0.328 -0.273 -0.226 -0.159 -0.135 -0.125 0.011 0.007 0.004 0.002 0.001 0.001 ADP UW Equity AUTOMATIC DATA PROCESSING Information Technology 71.47 2.53% 11.09.2013 13.20 13.69 14.18 14.78 15.42 16.18 -0.245 -0.306 -0.319 -0.240 -0.192 -0.167 0.006 0.008 0.008 0.006 0.003 0.002 AN UN Equity AUTONATION INC Consumer Discretionary 46.26 22.64 24.11 24.78 -0.212 -0.244 -0.215 0.006 0.009 0.007 AZO UN Equity AUTOZONE INC Consumer Discretionary 418.93 24.17 22.28 21.25 20.69 20.02 20.03 -0.330 -0.263 -0.219 -0.171 -0.141 -0.128 0.012 0.008 0.006 0.003 0.002 0.002 AVB UN Equity AVALONBAY COMMUNITIES INC Financials 135.95 3.21% 26.06.2013 14.78 14.65 15.18 -0.353 -0.343 -0.317 0.007 0.009 0.008 AVY UN Equity AVERY DENNISON CORP Industrials 43.90 2.64% 03.09.2013 19.09 18.61 18.98 -0.110 -0.093 -0.109 0.001 0.001 0.002 AVP UN Equity AVON PRODUCTS INC Consumer Staples 23.65 1.01% 15.08.2013 23.32 24.56 26.22 28.80 29.25 29.10 -0.152 -0.241 -0.255 -0.221 -0.188 -0.171 0.003 0.005 0.004 0.002 0.001 0.001 BHI UN Equity BAKER HUGHES INC Energy 45.63 1.49% 08.08.2013 24.96 26.40 27.02 27.48 28.21 28.77 -0.449 -0.345 -0.283 -0.215 -0.170 -0.147 0.012 0.009 0.006 0.003 0.002 0.001 BLL UN Equity BALL CORP Materials 45.52 1.19% 30.08.2013 15.62 16.40 16.93 17.61 -0.241 -0.274 -0.270 -0.200 0.006 0.008 0.008 0.006 BAC UN Equity BANK OF AMERICA CORP Financials 13.41 0.30% 04.09.2013 25.56 27.24 27.02 26.96 28.21 29.20 -0.316 -0.225 -0.197 -0.150 -0.111 -0.089 0.015 0.011 0.007 0.003 0.002 0.001 BK UN Equity BANK OF NEW YORK MELLON CORP Financials 30.08 2.06% 25.07.2013 17.85 19.12 19.86 20.67 22.62 23.63 -0.496 -0.419 -0.358 -0.249 -0.180 -0.163 0.018 0.013 0.009 0.005 0.002 0.001 BAX UN Equity BAXTER INTERNATIONAL INC Health Care 70.42 2.83% 04.09.2013 16.34 17.90 18.86 19.87 20.62 21.19 -0.186 -0.174 -0.168 -0.142 -0.115 -0.104 0.008 0.005 0.004 0.003 0.002 0.001 BBT UN Equity BB&T CORP Financials 32.43 3.02% 07.08.2013 15.28 16.04 16.67 17.96 19.78 19.98 -0.480 -0.411 -0.352 -0.241 -0.219 -0.173 0.018 0.011 0.008 0.004 0.001 0.001 BEAM UN Equity BEAM INC Consumer Staples 68.88 1.38% 05.08.2013 19.74 20.33 20.64 20.87 -0.129 -0.189 -0.209 -0.178 0.006 0.007 0.007 0.004 BDX UN Equity BECTON DICKINSON AND CO Health Care 101.54 2.02% 07.06.2013 15.40 16.42 16.84 16.59 -0.227 -0.245 -0.248 -0.211 0.006 0.005 0.005 0.004 BBBY UW Equity BED BATH & BEYOND INC Consumer Discretionary 68.32 20.59 23.50 24.70 24.69 25.06 25.02 -0.341 -0.249 -0.200 -0.152 -0.136 -0.119 0.012 0.008 0.006 0.003 0.002 0.001 BMS UN Equity BEMIS COMPANY Materials 40.57 2.59% 16.08.2013 14.08 14.61 15.33 0.000 0.004 -0.034 0.000 0.000 0.000 BRK/B UN Equity BERKSHIRE HATHAWAY INC-CL B Financials 112.46 14.07 14.56 14.88 15.40 16.35 17.50 -0.365 -0.300 -0.260 -0.228 -0.221 -0.186 0.020 0.015 0.012 0.007 0.004 0.002 BBY UN Equity BEST BUY CO INC Consumer Discretionary 26.23 2.71% 26.06.2013 60.48 56.72 54.32 49.39 43.02 40.84 -0.222 -0.150 -0.157 -0.188 -0.195 -0.176 0.006 0.003 0.002 0.001 0.001 0.001 BIIB UW Equity BIOGEN IDEC INC Health Care 228.38 32.41 32.00 32.10 32.55 32.94 33.53 -0.261 -0.201 -0.171 -0.149 -0.127 -0.109 0.013 0.008 0.005 0.002 0.001 0.001 BLK UN Equity BLACKROCK INC Financials 284.85 2.42% 07.06.2013 20.27 21.48 21.80 21.70 22.22 22.93 -0.403 -0.289 -0.253 -0.233 -0.175 -0.150 0.013 0.008 0.005 0.002 0.001 0.001 BMC UW Equity BMC SOFTWARE INC Information Technology 45.37 5.90 6.01 5.95 5.94 4.18 3.58 0.100 -0.235 -0.342 -0.155 -0.253 -0.181 0.000 0.007 0.008 0.008 0.007 0.004 BA UN Equity BOEING CO/THE Industrials 96.76 2.08% 14.08.2013 19.23 19.63 20.78 21.27 21.82 23.02 -0.412 -0.355 -0.279 -0.193 -0.160 -0.135 0.017 0.011 0.007 0.004 0.002 0.001 BWA UN Equity BORGWARNER INC Consumer Discretionary 83.35 21.17 22.23 23.32 -0.264 -0.283 -0.266 0.007 0.006 0.005 BXP UN Equity BOSTON PROPERTIES INC Financials 110.39 2.45% 26.06.2013 14.27 14.40 15.21 17.10 -0.205 -0.244 -0.242 -0.195 0.004 0.006 0.006 0.005 BSX UN Equity BOSTON SCIENTIFIC CORP Health Care 8.97 28.91 29.26 29.39 29.32 30.36 31.80 -0.057 -0.066 -0.078 -0.117 -0.082 -0.085 0.002 0.009 0.010 0.005 0.002 0.001 BMY UN Equity BRISTOL-MYERS SQUIBB CO Health Care 44.19 3.21% 03.07.2013 19.16 18.56 18.30 18.41 19.36 20.75 -0.361 -0.305 -0.262 -0.196 -0.147 -0.131 0.017 0.012 0.009 0.006 0.004 0.002 BRCM UW Equity BROADCOM CORP-CL A Information Technology 36.67 1.20% 28.08.2013 22.05 24.67 26.00 26.96 26.96 27.83 -0.342 -0.259 -0.216 -0.171 -0.132 -0.113 0.011 0.007 0.005 0.003 0.002 0.001 BF/B UN Equity BROWN-FORMAN CORP-CLASS B Consumer Staples 72.51 1.48% 06.06.2013 16.54 16.50 16.48 16.58 -0.186 -0.197 -0.194 -0.156 0.005 0.005 0.004 0.002 CA UW Equity CA INC Information Technology 27.44 3.64% 16.08.2013 18.10 19.82 20.61 21.23 21.15 23.03 -0.180 -0.217 -0.217 -0.150 -0.127 -0.111 0.006 0.006 0.005 0.003 0.002 0.002 CVC UN Equity CABLEVISION SYSTEMS-NY GRP-A Consumer Discretionary 15.55 3.86% 22.08.2013 30.10 32.08 32.97 33.30 33.78 34.43 0.219 0.125 0.066 -0.033 -0.060 -0.085 0.007 0.006 0.005 0.004 0.000 0.000 COG UN Equity CABOT OIL & GAS CORP Energy 67.78 0.09% 12.08.2013 32.07 32.30 33.50 35.87 35.70 34.81 -0.231 -0.211 -0.200 -0.184 -0.152 -0.136 0.008 0.006 0.004 0.002 0.001 0.001 CAM UN Equity CAMERON INTERNATIONAL CORP Energy 63.16 27.52 28.71 29.53 30.86 31.31 31.83 -0.293 -0.272 -0.252 -0.201 -0.167 -0.143 0.007 0.005 0.003 0.002 0.001 0.001 CPB UN Equity CAMPBELL SOUP CO Consumer Staples 47.95 2.50% 11.07.2013 17.57 16.64 16.09 15.76 16.38 16.62 -0.224 -0.249 -0.235 -0.182 -0.084 -0.064 0.005 0.008 0.008 0.005 0.003 0.002 COF UN Equity CAPITAL ONE FINANCIAL CORP Financials 59.69 2.01% 08.08.2013 20.48 23.07 23.08 23.55 25.74 26.43 -0.418 -0.322 -0.259 -0.194 -0.143 -0.121 0.014 0.009 0.007 0.003 0.002 0.001 CAH UN Equity CARDINAL HEALTH INC Health Care 46.56 2.72% 25.09.2013 15.02 16.92 17.81 18.01 19.70 19.90 -0.191 -0.201 -0.202 -0.195 -0.146 -0.134 0.004 0.006 0.006 0.004 0.003 0.002 CFN UN Equity CAREFUSION CORP Health Care 33.73 19.87 20.35 20.71 21.26 -0.196 -0.254 -0.270 -0.222 0.004 0.006 0.006 0.004 KMX UN Equity CARMAX INC Consumer Discretionary 48.23 30.57 28.37 27.41 -0.282 -0.262 -0.238 0.011 0.008 0.005 CCL UN Equity CARNIVAL CORP Consumer Discretionary 35.18 2.98% 21.08.2013 23.03 22.25 22.38 23.40 24.80 26.03 -0.204 -0.243 -0.234 -0.185 -0.148 -0.132 0.005 0.008 0.007 0.004 0.002 0.001 CAT UN Equity CATERPILLAR INC Industrials 86.79 2.42% 18.07.2013 20.53 20.40 22.03 22.39 24.03 25.04 -0.225 -0.181 -0.192 -0.156 -0.114 -0.098 0.018 0.011 0.007 0.004 0.002 0.001 CBG UN Equity CBRE GROUP INC - A Financials 24.83 26.09 27.52 28.47 30.26 30.68 30.92 -0.231 -0.260 -0.263 -0.226 -0.159 -0.141 0.006 0.005 0.004 0.002 0.001 0.001 CBS UN Equity CBS CORP-CLASS B NON VOTING Consumer Discretionary 50.03 1.08% 11.06.2013 27.72 27.70 27.85 28.81 27.63 28.59 -0.228 -0.174 -0.147 -0.129 -0.121 -0.108 0.011 0.007 0.005 0.002 0.001 0.001 CELG UW Equity CELGENE CORP Health Care 130.20 29.38 29.71 30.05 30.91 32.84 34.42 -0.147 -0.153 -0.142 -0.118 -0.120 -0.116 0.015 0.009 0.006 0.003 0.002 0.001 CNP UN Equity CENTERPOINT ENERGY INC Utilities 24.19 3.46% 16.08.2013 19.19 19.05 19.09 19.52 19.79 20.43 -0.050 -0.165 -0.182 -0.090 -0.068 -0.075 0.001 0.006 0.007 0.004 0.002 0.002 CTL UN Equity CENTURYLINK INC Telecommunication Services 38.06 5.68% 07.06.2013 16.83 16.79 17.23 18.19 19.05 19.45 -0.250 -0.315 -0.278 -0.175 -0.129 -0.111 0.007 0.011 0.010 0.006 0.004 0.003 CERN UW Equity CERNER CORP Health Care 95.86 23.98 26.09 27.12 27.62 28.47 29.10 -0.324 -0.240 -0.197 -0.179 -0.139 -0.120 0.013 0.007 0.004 0.002 0.002 0.001 CF UN Equity CF INDUSTRIES HOLDINGS INC Materials 190.93 0.63% 15.08.2013 26.17 26.92 27.36 28.01 29.12 29.94 -0.228 -0.191 -0.165 -0.146 -0.113 -0.100 0.009 0.006 0.004 0.002 0.001 0.001 CHRW UW Equity C.H. ROBINSON WORLDWIDE INC Industrials 57.43 2.44% 04.09.2013 20.95 23.29 24.32 24.29 24.20 24.65 -0.232 -0.215 -0.201 -0.152 -0.141 -0.128 0.008 0.006 0.004 0.003 0.002 0.001 SCHW UN Equity SCHWAB (CHARLES) CORP Financials 18.60 1.29% 14.08.2013 23.28 23.97 24.34 24.79 24.04 24.64 -0.135 -0.180 -0.197 -0.186 -0.119 -0.124 0.003 0.003 0.003 0.001 0.002 0.001 CHK UN Equity CHESAPEAKE ENERGY CORP Energy 20.60 1.94% 11.07.2013 30.51 30.83 31.54 33.40 35.42 36.14 -0.193 -0.193 -0.193 -0.179 -0.146 -0.129 0.016 0.010 0.007 0.004 0.002 0.002 CVX UN Equity CHEVRON CORP Energy 122.89 3.22% 16.08.2013 13.39 14.48 14.75 15.42 17.20 18.19 -0.401 -0.354 -0.280 -0.214 -0.196 -0.173 0.015 0.013 0.011 0.007 0.004 0.002 CMG UN Equity CHIPOTLE MEXICAN GRILL INC Consumer Discretionary 375.92 24.21 26.53 27.81 29.20 29.81 30.58 -0.296 -0.236 -0.201 -0.166 -0.139 -0.126 0.010 0.006 0.004 0.002 0.001 0.001 CB UN Equity CHUBB CORP Financials 90.20 2.00% 19.06.2013 12.57 12.81 13.50 15.19 -0.475 -0.361 -0.298 -0.232 0.016 0.012 0.009 0.005 CI UN Equity CIGNA CORP Health Care 67.84 0.09% 07.03.2014 20.65 20.71 21.16 22.38 23.85 24.74 -0.223 -0.232 -0.209 -0.141 -0.112 -0.094 0.013 0.008 0.005 0.002 0.001 0.000 CINF UW Equity CINCINNATI FINANCIAL CORP Financials 50.23 3.27% 16.09.2013 12.76 13.79 14.51 15.72 0.000 -0.123 -0.167 -0.188 0.000 0.006 0.007 0.006 CTAS UW Equity CINTAS CORP Industrials 45.37 1.79% 05.11.2013 15.00 17.11 18.00 17.73 19.03 19.22 -0.162 -0.293 -0.313 -0.205 -0.127 -0.108 0.002 0.008 0.009 0.006 0.004 0.003 CSCO UW Equity CISCO SYSTEMS INC Information Technology 21.25 3.62% 02.07.2013 25.88 23.19 24.57 22.70 23.77 24.85 -0.225 -0.243 -0.194 -0.160 -0.123 -0.103 0.011 0.008 0.005 0.004 0.003 0.002 C UN Equity CITIGROUP INC Financials 50.70 0.45% 08.08.2013 23.37 25.19 25.23 25.20 26.62 27.79 -0.402 -0.313 -0.257 -0.197 -0.140 -0.127 0.013 0.009 0.005 0.003 0.002 0.002 CTXS UW Equity CITRIX SYSTEMS INC Information Technology 65.50 27.20 29.14 30.12 30.84 30.09 30.97 -0.057 -0.107 -0.132 -0.148 -0.115 -0.107 0.005 0.003 0.002 0.001 0.000 0.000 CLF UN Equity CLIFFS NATURAL RESOURCES INC Materials 21.54 2.79% 15.08.2013 54.90 55.02 55.06 54.77 53.01 51.70 -0.178 -0.167 -0.150 -0.132 -0.107 -0.091 0.007 0.004 0.003 0.002 0.001 0.001 CLX UN Equity CLOROX COMPANY Consumer Staples 88.08 3.22% 21.10.2013 13.19 13.44 13.65 14.16 15.18 15.57 -0.253 -0.335 -0.310 -0.221 -0.163 -0.137 0.005 0.010 0.009 0.005 0.003 0.002 CME UW Equity CME GROUP INC Financials 63.49 2.84% 07.06.2013 16.34 16.67 17.15 18.47 19.77 20.34 -0.309 -0.284 -0.263 -0.216 -0.149 -0.133 0.009 0.008 0.007 0.005 0.003 0.002 CMS UN Equity CMS ENERGY CORP Utilities 28.94 3.70% 31.07.2013 16.10 16.04 15.99 15.64 -0.162 -0.162 -0.161 -0.166 0.002 0.002 0.002 0.005 COH UN Equity COACH INC Consumer Discretionary 58.83 2.29% 06.06.2013 23.07 27.05 28.78 29.19 28.54 29.12 -0.200 -0.199 -0.189 -0.137 -0.123 -0.103 0.012 0.006 0.003 0.001 0.001 0.001 KO UN Equity COCA-COLA CO/THE Consumer Staples 42.76 2.67% 11.09.2013 13.83 14.89 15.03 15.44 16.60 18.01 -0.420 -0.318 -0.239 -0.172 -0.129 -0.109 0.017 0.011 0.009 0.005 0.003 0.002 CCE UN Equity COCA-COLA ENTERPRISES Consumer Staples 38.55 2.15% 04.09.2013 16.63 17.62 18.25 18.86 19.46 20.37 -0.195 -0.263 -0.273 -0.193 -0.155 -0.121 0.004 0.008 0.008 0.004 0.002 0.002 CTSH UW Equity COGNIZANT TECH SOLUTIONS-A Information Technology 62.73 32.74 31.96 32.29 33.47 33.69 33.84 -0.225 -0.177 -0.147 -0.125 -0.126 -0.108 0.008 0.007 0.005 0.002 0.001 0.001 CL UN Equity COLGATE-PALMOLIVE CO Consumer Staples 124.09 2.25% 26.07.2013 14.14 15.16 15.49 15.42 16.63 17.48 -0.645 -0.486 -0.381 -0.266 -0.196 -0.160 0.020 0.015 0.011 0.007 0.003 0.002 CMCSA UW EquityCOMCAST CORP-CLASS A Consumer Discretionary 43.17 1.92% 01.07.2013 17.03 17.36 18.35 20.38 22.06 23.52 -0.378 -0.299 -0.242 -0.173 -0.133 -0.105 0.016 0.011 0.008 0.004 0.002 0.001 CMA UN Equity COMERICA INC Financials 39.17 1.86% 11.09.2013 18.29 20.68 21.38 21.89 23.62 24.44 -0.441 -0.332 -0.280 -0.231 -0.195 -0.175 0.015 0.010 0.007 0.004 0.002 0.001 CSC UN Equity COMPUTER SCIENCES CORP Information Technology 46.48 1.72% 12.06.2013 37.88 35.65 34.21 32.30 30.38 30.18 -0.255 -0.249 -0.241 -0.196 -0.173 -0.139 0.007 0.004 0.003 0.002 0.001 0.001 CAG UN Equity CONAGRA FOODS INC Consumer Staples 35.97 2.95% 31.07.2013 14.72 15.13 15.35 15.63 15.68 15.84 -0.249 -0.268 -0.266 -0.224 -0.185 -0.146 0.006 0.008 0.008 0.006 0.003 0.002 COP UN Equity CONOCOPHILLIPS Energy 62.21 4.29% 25.07.2013 15.99 15.86 16.08 16.94 18.53 19.23 -0.441 -0.310 -0.242 -0.184 -0.158 -0.133 0.015 0.013 0.011 0.006 0.003 0.002 CNX UN Equity CONSOL ENERGY INC Energy 33.77 1.48% 07.08.2013 34.13 34.33 34.72 35.59 37.04 38.36 -0.316 -0.290 -0.251 -0.177 -0.139 -0.124 0.012 0.007 0.005 0.002 0.001 0.001 ED UN Equity CONSOLIDATED EDISON INC Utilities 60.71 4.05% 12.08.2013 11.57 11.98 12.13 12.40 13.25 13.78 -0.106 -0.141 -0.162 -0.198 -0.149 -0.125 0.001 0.002 0.003 0.006 0.003 0.002 STZ UN Equity CONSTELLATION BRANDS INC-A Consumer Staples 50.33 24.29 25.27 25.74 25.85 26.30 27.53 -0.088 -0.216 -0.228 -0.174 -0.147 -0.144 0.006 0.007 0.005 0.002 0.001 0.000 GLW UN Equity CORNING INC Information Technology 15.68 2.61% 30.08.2013 20.98 20.81 23.59 24.15 24.94 25.74 -0.128 -0.120 -0.145 -0.118 -0.093 -0.086 0.007 0.008 0.006 0.003 0.002 0.002 COST UW Equity COSTCO WHOLESALE CORP Consumer Staples 112.41 1.14% 07.08.2013 16.36 15.75 15.73 16.47 17.80 19.02 -0.381 -0.330 -0.269 -0.189 -0.158 -0.135 0.014 0.011 0.009 0.006 0.003 0.002 S&P500Index Option Implied Volatility Skew Parameters by Terms: IVt = atx + btx 2 + ct At The Money Implied Volatilities by Terms Q.M.S Advisors | tel: +41 (0)78 922 08 77 | e-mail: info@qmsadv.com |
- 2. 15.05.2013 Ticker Name GICS_SECTOR_NAME ATM Ref Dividend Yield Next Ex- Dividend Date ATM Vol - 30D ATM Vol - 60D ATM Vol - 90D ATM Vol - 6M ATM Vol - 12M ATM Vol - 18M ATM Vol - 24M Skew (a) - 30D Skew (a) - 60D Skew (a) - 90D Skew (a) - 6M Skew (a) - 12M Skew (a) - 18M Skew (a) - 24M Skew (b) - 30D Skew (b) - 60D Skew (b) - 90D Skew (b) - 6M Skew (b) - 12M Skew (b) - 18M Skew (b) - 24M COV UN Equity COVIDIEN PLC Health Care 66.10 1.71% 01.08.2013 16.70 16.64 17.23 18.81 20.70 22.04 -0.125 -0.220 -0.218 -0.163 -0.162 -0.140 0.004 0.008 0.008 0.005 0.002 0.001 BCR UN Equity CR BARD INC Health Care 106.73 0.79% 18.07.2013 16.32 15.80 15.83 -0.222 -0.326 -0.339 0.005 0.007 0.007 CCI UN Equity CROWN CASTLE INTL CORP Telecommunication Services 79.78 18.44 17.66 17.96 19.46 -0.184 -0.234 -0.230 -0.183 0.006 0.008 0.008 0.004 CSX UN Equity CSX CORP Industrials 25.92 2.31% 30.08.2013 18.63 19.66 20.40 21.46 22.81 24.26 -0.224 -0.239 -0.240 -0.206 -0.156 -0.136 0.005 0.007 0.007 0.004 0.003 0.001 CMI UN Equity CUMMINS INC Industrials 114.34 2.36% 14.08.2013 23.63 24.97 25.93 27.56 29.42 30.71 -0.325 -0.245 -0.202 -0.166 -0.135 -0.113 0.011 0.007 0.005 0.003 0.002 0.001 CVS UN Equity CVS CAREMARK CORP Consumer Staples 59.95 1.60% 25.07.2013 15.91 17.01 17.56 17.98 19.39 20.23 -0.535 -0.417 -0.339 -0.252 -0.202 -0.169 0.019 0.014 0.010 0.006 0.003 0.002 DHR UN Equity DANAHER CORP Industrials 61.88 0.19% 02.10.2013 15.28 16.47 17.28 18.64 20.13 21.40 -0.305 -0.289 -0.273 -0.232 -0.168 -0.147 0.007 0.007 0.007 0.005 0.003 0.002 DRI UN Equity DARDEN RESTAURANTS INC Consumer Discretionary 53.88 4.16% 10.07.2013 21.02 20.30 20.42 21.59 22.43 22.64 -0.308 -0.297 -0.248 -0.166 -0.146 -0.133 0.009 0.009 0.007 0.003 0.001 0.001 DVA UN Equity DAVITA HEALTHCARE PARTNERS I Health Care 129.90 19.51 20.48 21.19 -0.416 -0.243 -0.183 0.014 0.013 0.009 DF UN Equity DEAN FOODS CO Consumer Staples 19.98 26.41 29.15 30.40 31.26 32.07 32.50 -0.173 -0.205 -0.216 -0.208 -0.136 -0.115 0.002 0.001 0.001 0.002 0.002 0.001 DE UN Equity DEERE & CO Industrials 89.09 2.33% 28.06.2013 22.27 21.13 20.67 21.04 23.10 24.25 -0.342 -0.283 -0.241 -0.185 -0.131 -0.115 0.011 0.008 0.007 0.004 0.003 0.001 DELL UW Equity DELL INC Information Technology 13.48 0.59% 27.06.2013 17.78 17.91 16.89 15.73 16.51 16.02 -0.270 -0.404 -0.256 -0.278 -0.119 -0.122 0.016 0.015 0.021 0.012 0.006 0.004 DLPH UN Equity DELPHI AUTOMOTIVE PLC Consumer Discretionary 46.40 1.51% 12.06.2013 21.39 23.52 24.61 25.36 26.48 27.59 -0.219 -0.247 -0.243 -0.166 -0.137 -0.113 0.006 0.005 0.004 0.003 0.001 0.001 DNR UN Equity DENBURY RESOURCES INC Energy 18.16 28.67 30.11 30.83 31.05 33.56 33.60 -0.001 -0.082 -0.124 -0.162 -0.148 -0.132 0.007 0.006 0.005 0.003 0.002 0.001 XRAY UW Equity DENTSPLY INTERNATIONAL INC Health Care 42.79 0.60% 26.06.2013 18.70 16.59 16.53 -0.182 -0.326 -0.303 0.001 0.012 0.011 DVN UN Equity DEVON ENERGY CORPORATION Energy 58.55 1.50% 13.09.2013 23.95 24.98 25.46 25.71 26.21 27.08 -0.165 -0.155 -0.149 -0.134 -0.114 -0.104 0.019 0.011 0.006 0.003 0.002 0.001 DO UN Equity DIAMOND OFFSHORE DRILLING Energy 69.75 0.72% 01.08.2013 19.28 20.57 21.36 22.45 23.30 24.01 -0.337 -0.342 -0.328 -0.251 -0.165 -0.145 0.009 0.005 0.004 0.002 0.002 0.001 DTV UW Equity DIRECTV Consumer Discretionary 64.61 21.20 21.48 21.75 22.60 22.70 24.31 -0.254 -0.211 -0.184 -0.153 -0.138 -0.122 0.014 0.010 0.008 0.004 0.002 0.002 DFS UN Equity DISCOVER FINANCIAL SERVICES Financials 47.29 1.78% 02.07.2013 21.18 21.43 22.20 24.12 26.02 26.70 -0.438 -0.313 -0.250 -0.195 -0.134 -0.120 0.015 0.011 0.007 0.003 0.002 0.001 DISCA UW Equity DISCOVERY COMMUNICATIONS-A Consumer Discretionary 78.99 21.07 21.32 21.87 -0.295 -0.269 -0.235 0.010 0.009 0.008 DG UN Equity DOLLAR GENERAL CORP Consumer Discretionary 52.98 27.74 25.58 24.68 25.52 25.57 25.78 -0.106 -0.148 -0.166 -0.143 -0.067 -0.069 0.004 0.004 0.004 0.002 0.000 0.001 DLTR UW Equity DOLLAR TREE INC Consumer Discretionary 49.54 28.97 27.54 26.84 26.77 26.73 26.31 -0.226 -0.204 -0.186 -0.151 -0.138 -0.127 0.009 0.006 0.005 0.002 0.002 0.001 D UN Equity DOMINION RESOURCES INC/VA Utilities 60.50 3.78% 28.08.2013 12.66 12.72 12.97 -0.227 -0.302 -0.292 0.005 0.010 0.010 DOV UN Equity DOVER CORP Industrials 75.62 1.99% 28.08.2013 17.93 19.00 19.76 20.94 -0.508 -0.350 -0.267 -0.220 0.018 0.012 0.008 0.004 DOW UN Equity DOW CHEMICAL CO/THE Materials 35.40 3.87% 30.09.2013 22.22 22.96 23.40 23.92 24.79 25.18 -0.443 -0.336 -0.270 -0.206 -0.153 -0.134 0.015 0.010 0.007 0.004 0.002 0.002 DHI UN Equity DR HORTON INC Consumer Discretionary 27.39 0.27% 10.02.2014 30.88 32.51 33.41 34.34 34.31 35.07 -0.263 -0.238 -0.213 -0.156 -0.083 -0.074 0.013 0.008 0.005 0.002 0.001 0.000 DPS UN Equity DR PEPPER SNAPPLE GROUP INC Consumer Staples 49.77 3.11% 20.06.2013 16.04 17.23 17.95 18.15 -0.167 -0.176 -0.176 -0.151 0.003 0.005 0.005 0.005 DTE UN Equity DTE ENERGY COMPANY Utilities 71.08 3.69% 12.09.2013 13.63 13.24 13.28 -0.202 -0.281 -0.295 0.004 0.007 0.008 DUK UN Equity DUKE ENERGY CORP Utilities 71.85 4.34% 14.08.2013 12.36 12.45 12.55 13.13 14.73 16.49 -0.193 -0.274 -0.264 -0.205 -0.155 -0.126 0.005 0.009 0.008 0.006 0.004 0.002 DNB UN Equity DUN & BRADSTREET CORP Industrials 96.76 1.68% 28.08.2013 18.87 21.13 21.94 21.37 -0.113 -0.150 -0.160 -0.138 0.002 0.004 0.004 0.003 ETFC UW Equity E*TRADE FINANCIAL CORP Financials 11.32 29.06 30.47 30.80 30.86 31.94 32.56 -0.206 -0.218 -0.205 -0.170 -0.138 -0.130 0.013 0.009 0.006 0.003 0.001 0.001 EMN UN Equity EASTMAN CHEMICAL CO Materials 69.88 1.83% 12.09.2013 26.02 27.03 27.61 28.14 28.49 29.36 -0.300 -0.280 -0.265 -0.216 -0.170 -0.147 0.016 0.009 0.005 0.003 0.002 0.001 ETN UN Equity EATON CORP PLC Industrials 64.91 2.71% 08.08.2013 22.14 22.12 22.45 23.54 25.56 26.75 -0.307 -0.290 -0.266 -0.225 -0.193 -0.170 0.007 0.008 0.007 0.003 0.001 0.001 EBAY UW Equity EBAY INC Information Technology 56.42 22.59 26.00 27.22 28.07 29.85 31.19 -0.289 -0.241 -0.195 -0.135 -0.114 -0.097 0.013 0.008 0.005 0.002 0.002 0.001 ECL UN Equity ECOLAB INC Materials 88.21 1.13% 20.09.2013 15.73 15.44 15.79 -0.256 -0.278 -0.271 0.006 0.008 0.007 EIX UN Equity EDISON INTERNATIONAL Utilities 49.35 2.85% 26.09.2013 15.49 15.22 15.30 -0.196 -0.294 -0.278 0.004 0.009 0.009 EW UN Equity EDWARDS LIFESCIENCES CORP Health Care 71.91 25.04 29.39 31.03 30.70 29.72 29.72 0.001 -0.051 -0.074 -0.079 -0.065 -0.072 0.009 0.004 0.002 0.002 0.002 0.001 DD UN Equity DU PONT (E.I.) DE NEMOURS Materials 55.28 2.50% 15.08.2013 17.37 17.44 17.80 18.68 19.87 20.61 -0.382 -0.290 -0.248 -0.206 -0.157 -0.140 0.015 0.014 0.011 0.006 0.004 0.002 EA UW Equity ELECTRONIC ARTS INC Information Technology 22.68 36.38 36.14 36.01 35.99 35.21 35.30 -0.270 -0.212 -0.177 -0.138 -0.119 -0.105 0.008 0.005 0.003 0.002 0.001 0.001 LLY UN Equity ELI LILLY & CO Health Care 56.67 3.46% 15.08.2013 16.29 17.67 18.35 19.04 19.94 20.49 -0.385 -0.267 -0.211 -0.164 -0.128 -0.110 0.018 0.014 0.010 0.004 0.002 0.001 EMC UN Equity EMC CORP/MA Information Technology 22.88 21.76 22.49 22.75 23.14 24.86 26.43 -0.303 -0.235 -0.197 -0.154 -0.118 -0.098 0.017 0.012 0.009 0.004 0.002 0.001 EMR UN Equity EMERSON ELECTRIC CO Industrials 58.54 3.01% 14.08.2013 16.46 17.73 18.19 19.26 20.43 21.62 -0.495 -0.406 -0.323 -0.231 -0.206 -0.166 0.016 0.012 0.009 0.005 0.003 0.002 ESV UN Equity ENSCO PLC-CL A Energy 61.03 3.32% 06.06.2013 25.31 25.55 25.88 26.85 27.71 28.05 -0.212 -0.191 -0.176 -0.148 -0.145 -0.132 0.006 0.005 0.005 0.003 0.001 0.001 ETR UN Equity ENTERGY CORP Utilities 69.31 4.79% 06.08.2013 15.79 15.18 15.08 15.97 -0.149 -0.179 -0.182 -0.122 0.002 0.005 0.006 0.002 EOG UN Equity EOG RESOURCES INC Energy 135.10 0.57% 16.10.2013 28.84 28.34 28.42 28.85 28.68 28.49 -0.241 -0.236 -0.228 -0.209 -0.191 -0.181 0.010 0.007 0.005 0.003 0.002 0.001 EQT UN Equity EQT CORP Energy 76.95 0.16% 07.08.2013 24.85 25.52 25.79 25.65 -0.387 -0.302 -0.258 -0.232 0.010 0.008 0.006 0.004 EFX UN Equity EQUIFAX INC Industrials 63.66 1.43% 30.08.2013 16.90 18.21 18.69 -0.091 -0.064 -0.088 0.001 0.001 0.002 EQR UN Equity EQUITY RESIDENTIAL Financials 59.13 3.13% 19.06.2013 15.82 15.70 16.13 -0.221 -0.215 -0.211 0.004 0.006 0.006 EL UN Equity ESTEE LAUDER COMPANIES-CL A Consumer Staples 71.94 1.04% 24.09.2013 22.18 21.75 22.23 23.32 23.51 23.81 -0.642 -0.439 -0.314 -0.209 -0.155 -0.126 0.015 0.010 0.007 0.004 0.002 0.001 EXC UN Equity EXELON CORP Utilities 35.20 2.64% 16.08.2013 16.17 16.13 16.15 16.37 17.17 17.66 -0.213 -0.229 -0.232 -0.202 -0.145 -0.115 0.004 0.006 0.007 0.007 0.004 0.003 EXPE UW Equity EXPEDIA INC Consumer Discretionary 60.93 0.90% 28.08.2013 32.79 32.80 34.46 37.72 38.76 39.72 -0.180 -0.179 -0.166 -0.140 -0.128 -0.110 0.007 0.005 0.003 0.001 0.001 0.001 EXPD UW Equity EXPEDITORS INTL WASH INC Industrials 38.70 1.55% 03.12.2013 22.79 24.78 25.54 25.07 24.88 26.08 -0.098 -0.111 -0.121 -0.122 -0.109 -0.095 0.008 0.006 0.005 0.003 0.002 0.001 ESRX UW Equity EXPRESS SCRIPTS HOLDING CO Health Care 61.01 20.09 19.84 22.60 23.69 24.51 25.60 -0.289 -0.248 -0.212 -0.170 -0.135 -0.115 0.015 0.008 0.007 0.003 0.001 0.001 XOM UN Equity EXXON MOBIL CORP Energy 90.84 2.91% 08.08.2013 13.17 13.38 13.54 14.02 15.53 16.61 -0.563 -0.422 -0.339 -0.260 -0.213 -0.172 0.018 0.014 0.011 0.008 0.004 0.003 FFIV UW Equity F5 NETWORKS INC Information Technology 78.33 30.66 32.77 34.76 37.28 38.17 39.06 -0.108 -0.123 -0.117 -0.100 -0.099 -0.086 0.010 0.006 0.004 0.001 0.001 0.000 FDO UN Equity FAMILY DOLLAR STORES Consumer Discretionary 65.05 1.64% 12.06.2013 23.10 25.02 25.52 25.49 25.79 25.88 -0.113 -0.073 -0.072 -0.087 -0.091 -0.099 0.003 0.003 0.002 0.001 0.000 0.000 FAST UW Equity FASTENAL CO Industrials 51.90 1.66% 26.07.2013 21.62 23.15 23.92 24.65 25.29 25.71 -0.288 -0.276 -0.262 -0.234 -0.186 -0.156 0.008 0.006 0.005 0.003 0.002 0.001 FDX UN Equity FEDEX CORP Industrials 100.80 0.63% 18.06.2013 23.54 22.18 21.83 22.12 22.56 23.05 -0.303 -0.246 -0.207 -0.158 -0.123 -0.107 0.009 0.008 0.006 0.003 0.002 0.001 FIS UN Equity FIDELITY NATIONAL INFORMATIO Information Technology 44.00 2.05% 13.09.2013 15.70 17.32 17.93 -0.340 -0.323 -0.285 0.011 0.011 0.009 FITB UW Equity FIFTH THIRD BANCORP Financials 18.00 2.67% 26.06.2013 17.11 17.87 18.50 20.02 22.41 23.56 -0.212 -0.301 -0.298 -0.192 -0.157 -0.128 0.005 0.011 0.011 0.006 0.001 0.001 FHN UN Equity FIRST HORIZON NATIONAL CORP Financials 11.35 2.03% 11.09.2013 23.01 23.83 24.80 26.76 0.000 -0.270 -0.344 -0.207 0.000 0.007 0.008 0.003 FSLR UW Equity FIRST SOLAR INC Information Technology 51.06 56.02 54.74 55.19 54.77 52.19 52.39 -0.020 -0.044 -0.071 -0.085 -0.067 -0.088 0.010 0.007 0.005 0.003 0.001 0.000 FE UN Equity FIRSTENERGY CORP Utilities 42.90 5.13% 05.08.2013 15.26 15.02 14.98 15.25 15.96 16.26 -0.153 -0.157 -0.181 -0.179 -0.124 -0.112 0.004 0.003 0.005 0.005 0.002 0.002 FISV UW Equity FISERV INC Information Technology 89.78 15.32 16.60 17.20 17.48 -0.300 -0.299 -0.291 -0.256 0.006 0.006 0.006 0.005 FLIR UW Equity FLIR SYSTEMS INC Information Technology 24.75 1.45% 22.08.2013 20.87 22.50 23.50 -0.148 -0.134 -0.139 0.007 0.003 0.002 FLS UN Equity FLOWSERVE CORP Industrials 164.31 0.52% 28.06.2013 19.20 20.05 20.98 -0.266 -0.257 -0.238 0.014 0.009 0.006 FLR UN Equity FLUOR CORP Industrials 62.09 1.10% 04.09.2013 24.09 24.60 25.46 27.03 27.99 28.57 -0.298 -0.237 -0.204 -0.174 -0.139 -0.126 0.010 0.006 0.004 0.002 0.002 0.001 FMC UN Equity FMC CORP Materials 62.74 0.89% 25.09.2013 19.33 19.03 19.45 -0.027 -0.142 -0.186 0.000 0.004 0.005 FTI UN Equity FMC TECHNOLOGIES INC Energy 56.04 25.24 26.03 27.01 -0.267 -0.287 -0.266 0.008 0.006 0.004 F UN Equity FORD MOTOR CO Consumer Discretionary 14.70 2.99% 26.07.2013 22.65 22.70 24.50 24.70 25.83 27.03 -0.309 -0.208 -0.176 -0.134 -0.112 -0.094 0.013 0.010 0.007 0.004 0.002 0.002 FRX UN Equity FOREST LABORATORIES INC Health Care 38.85 20.57 22.30 22.99 22.93 23.14 23.42 -0.330 -0.258 -0.220 -0.196 -0.126 -0.114 0.010 0.008 0.007 0.004 0.003 0.002 FOSL UW Equity FOSSIL INC Consumer Discretionary 109.39 28.43 31.41 33.26 36.20 35.86 36.23 -0.282 -0.214 -0.180 -0.144 -0.126 -0.107 0.006 0.006 0.005 0.002 0.001 0.000 BEN UN Equity FRANKLIN RESOURCES INC Financials 166.14 0.73% 28.06.2013 19.29 19.52 20.15 21.65 -0.461 -0.453 -0.414 -0.303 0.014 0.010 0.006 0.002 FCX UN Equity FREEPORT-MCMORAN COPPER Materials 31.60 3.96% 11.07.2013 30.59 31.54 31.23 31.50 33.51 34.33 -0.262 -0.190 -0.144 -0.132 -0.137 -0.113 0.012 0.008 0.005 0.003 0.001 0.001 FTR UW Equity FRONTIER COMMUNICATIONS CORP Telecommunication Services 4.33 9.25% 09.09.2013 26.02 28.30 29.53 29.42 28.73 27.93 0.000 -0.076 -0.133 -0.280 -0.121 -0.031 0.000 0.010 0.012 0.007 0.003 0.003 GME UN Equity GAMESTOP CORP-CLASS A Consumer Discretionary 38.88 2.89% 29.05.2013 45.02 41.09 39.79 40.37 41.09 40.98 -0.280 -0.214 -0.178 -0.146 -0.121 -0.115 0.007 0.004 0.003 0.001 0.001 0.001 GCI UN Equity GANNETT CO Consumer Discretionary 21.88 3.75% 04.09.2013 35.21 39.36 39.39 36.92 35.46 35.26 -0.098 -0.095 -0.107 -0.122 -0.115 -0.096 0.014 0.008 0.005 0.004 0.002 0.001 GPS UN Equity GAP INC/THE Consumer Discretionary 41.13 1.51% 05.07.2013 31.09 30.04 29.48 29.22 28.90 29.34 -0.282 -0.251 -0.228 -0.187 -0.161 -0.142 0.010 0.007 0.005 0.002 0.002 0.001 GRMN UW Equity GARMIN LTD Consumer Discretionary 35.23 5.11% 10.06.2014 22.72 22.78 24.00 26.96 29.08 29.90 -0.140 -0.155 -0.148 -0.133 -0.124 -0.107 0.006 0.008 0.006 0.002 0.001 0.001 GD UN Equity GENERAL DYNAMICS CORP Industrials 76.01 3.01% 03.07.2013 18.30 19.96 20.64 20.88 21.58 22.65 -0.433 -0.348 -0.294 -0.240 -0.193 -0.177 0.016 0.010 0.007 0.004 0.002 0.002 GE UN Equity GENERAL ELECTRIC CO Industrials 23.09 3.55% 20.06.2013 15.66 17.57 18.27 18.31 20.91 21.92 -0.307 -0.234 -0.198 -0.169 -0.124 -0.099 0.012 0.014 0.011 0.006 0.003 0.002 GIS UN Equity GENERAL MILLS INC Consumer Staples 50.64 3.00% 10.10.2013 13.95 15.52 15.66 15.22 15.90 16.81 -0.406 -0.325 -0.257 -0.172 -0.123 -0.103 0.016 0.012 0.010 0.006 0.004 0.002 GPC UN Equity GENUINE PARTS CO Consumer Discretionary 79.16 2.76% 11.09.2013 15.52 16.86 17.66 18.06 -0.199 -0.237 -0.254 -0.216 0.005 0.007 0.007 0.005 GNW UN Equity GENWORTH FINANCIAL INC-CL A Financials 11.01 37.74 39.86 41.06 42.28 44.14 45.97 -0.198 -0.169 -0.149 -0.114 -0.066 -0.076 0.010 0.006 0.004 0.002 0.000 0.001 GILD UW Equity GILEAD SCIENCES INC Health Care 56.93 29.69 29.28 30.67 30.88 30.62 32.30 -0.203 -0.172 -0.133 -0.116 -0.074 -0.071 0.014 0.009 0.005 0.002 0.001 0.001 GS UN Equity GOLDMAN SACHS GROUP INC Financials 155.00 1.29% 30.08.2013 21.21 22.32 22.67 22.73 23.30 24.03 -0.272 -0.253 -0.231 -0.200 -0.178 -0.148 0.015 0.010 0.007 0.004 0.003 0.002 GT UW Equity GOODYEAR TIRE & RUBBER CO Consumer Discretionary 13.16 30.67 31.58 32.40 34.04 35.95 36.28 -0.071 -0.239 -0.256 -0.160 -0.132 -0.115 0.013 0.009 0.006 0.002 0.002 0.001 GOOG UW Equity GOOGLE INC-CL A Information Technology 908.36 18.89 22.63 22.26 21.54 21.34 22.47 -0.331 -0.212 -0.162 -0.111 -0.087 -0.074 0.013 0.006 0.004 0.002 0.002 0.001 HRB UN Equity H&R BLOCK INC Consumer Discretionary 28.55 2.80% 10.06.2013 35.77 34.32 33.30 31.96 31.44 31.41 -0.355 -0.314 -0.272 -0.204 -0.164 -0.135 0.019 0.013 0.009 0.005 0.003 0.002 HAL UN Equity HALLIBURTON CO Energy 43.51 1.18% 06.06.2013 26.14 26.15 26.71 27.77 28.32 29.04 -0.311 -0.270 -0.229 -0.171 -0.143 -0.122 0.009 0.007 0.005 0.002 0.002 0.001 HOG UN Equity HARLEY-DAVIDSON INC Consumer Discretionary 58.56 1.50% 27.09.2013 22.52 24.54 25.57 26.17 26.18 27.32 -0.351 -0.262 -0.218 -0.183 -0.150 -0.127 0.012 0.007 0.005 0.003 0.002 0.001 HAR UN Equity HARMAN INTERNATIONAL Consumer Discretionary 50.22 1.59% 22.08.2013 24.26 23.56 24.80 -0.265 -0.291 -0.272 0.009 0.009 0.008 HRS UN Equity HARRIS CORP Information Technology 49.49 3.17% 06.09.2013 19.27 20.13 20.71 21.05 -0.145 -0.186 -0.200 -0.176 0.002 0.004 0.004 0.004 HIG UN Equity HARTFORD FINANCIAL SVCS GRP Financials 30.50 1.77% 31.05.2013 26.56 26.79 27.08 27.96 28.37 29.42 -0.400 -0.314 -0.260 -0.191 -0.173 -0.153 0.015 0.010 0.007 0.003 0.000 0.000 HAS UW Equity HASBRO INC Consumer Discretionary 47.64 3.44% 01.08.2013 19.89 20.31 20.99 22.10 22.43 22.48 -0.229 -0.212 -0.195 -0.158 -0.123 -0.106 0.009 0.009 0.007 0.004 0.002 0.002 HCP UN Equity HCP INC Financials 53.67 4.04% 01.08.2013 15.36 14.55 14.81 -0.162 -0.440 -0.412 0.002 0.015 0.013 HCN UN Equity HEALTH CARE REIT INC Financials 76.30 4.15% 02.08.2013 12.35 12.90 13.27 13.79 16.61 18.30 -0.542 -0.400 -0.303 -0.189 -0.241 -0.199 0.020 0.014 0.010 0.005 0.004 0.003 HP UN Equity HELMERICH & PAYNE Energy 61.85 0.73% 15.08.2013 29.00 29.75 30.22 30.80 31.91 32.62 -0.268 -0.240 -0.219 -0.179 -0.146 -0.131 0.006 0.004 0.003 0.002 0.001 0.001 HSY UN Equity HERSHEY CO/THE Consumer Staples 89.74 1.89% 23.08.2013 14.86 16.23 16.80 16.63 -0.339 -0.252 -0.203 -0.140 0.016 0.011 0.007 0.004 HES UN Equity HESS CORP Energy 71.82 1.39% 20.06.2013 31.92 30.19 30.62 30.38 31.24 30.76 -0.052 -0.116 -0.136 -0.161 -0.139 -0.124 0.014 0.009 0.005 0.003 0.002 0.001 HPQ UN Equity HEWLETT-PACKARD CO Information Technology 21.03 2.76% 10.06.2013 40.91 37.59 36.12 34.50 35.09 35.66 -0.171 -0.161 -0.166 -0.118 -0.114 -0.106 0.006 0.005 0.003 0.002 0.002 0.001 HNZ UN Equity HJ HEINZ CO Consumer Staples 72.43 3.09% 24.06.2013 2.58 2.83 2.67 1.46 1.33 1.05 -0.268 -0.596 -0.661 -0.402 -0.179 -0.123 0.003 0.018 0.022 0.012 0.005 0.004 HD UN Equity HOME DEPOT INC Consumer Discretionary 78.04 2.06% 28.05.2013 18.66 18.32 18.19 19.19 21.41 22.38 -0.306 -0.257 -0.221 -0.197 -0.168 -0.148 0.012 0.011 0.008 0.005 0.003 0.002 HON UN Equity HONEYWELL INTERNATIONAL INC Industrials 78.92 2.83% 21.08.2013 14.77 16.02 16.69 17.90 20.20 21.42 -0.420 -0.333 -0.268 -0.226 -0.181 -0.162 0.015 0.012 0.010 0.006 0.003 0.002 HRL UN Equity HORMEL FOODS CORP Consumer Staples 42.90 1.70% 24.07.2013 20.01 20.26 20.11 18.76 -0.487 -0.359 -0.268 -0.153 0.019 0.012 0.008 0.004 HSP UN Equity HOSPIRA INC Health Care 34.23 29.85 29.90 29.73 28.71 27.95 27.88 -0.217 -0.215 -0.196 -0.121 -0.124 -0.115 0.005 0.008 0.008 0.002 0.004 0.002 HST UN Equity HOST HOTELS & RESORTS INC Financials 18.55 2.70% 28.06.2013 20.78 21.03 21.80 23.39 24.59 25.84 -0.170 -0.297 -0.317 -0.247 -0.182 -0.160 0.003 0.005 0.005 0.004 0.002 0.001 HCBK UW Equity HUDSON CITY BANCORP INC Financials 8.62 0.46% 07.08.2013 19.04 19.04 19.04 0.000 0.000 0.000 0.000 0.000 0.000 HUM UN Equity HUMANA INC Health Care 79.08 1.37% 25.09.2013 24.68 26.71 27.40 26.76 26.65 27.58 -0.247 -0.205 -0.179 -0.146 -0.122 -0.108 0.008 0.006 0.004 0.002 0.001 0.001 HBAN UW Equity HUNTINGTON BANCSHARES INC Financials 7.75 2.58% 17.09.2013 18.99 19.41 19.98 21.47 24.65 27.17 -0.159 -0.274 -0.233 -0.123 -0.091 -0.066 0.002 0.009 0.009 0.005 0.004 0.002 ITW UN Equity ILLINOIS TOOL WORKS Industrials 69.75 2.35% 30.09.2013 15.28 15.99 16.63 18.09 19.07 19.97 -0.341 -0.308 -0.285 -0.244 -0.183 -0.156 0.009 0.009 0.008 0.005 0.003 0.002 IR UN Equity INGERSOLL-RAND PLC Industrials 57.13 1.66% 13.09.2013 21.09 22.15 22.85 23.96 25.20 25.88 -0.351 -0.260 -0.207 -0.163 -0.147 -0.131 0.014 0.009 0.006 0.003 0.001 0.001 TEG UN Equity INTEGRYS ENERGY GROUP INC Utilities 60.96 4.49% 29.05.2013 13.05 13.35 13.87 14.40 -0.231 -0.294 -0.306 -0.238 0.004 0.011 0.012 0.006 INTC UW Equity INTEL CORP Information Technology 24.07 3.82% 05.08.2013 19.17 20.60 20.43 21.11 22.02 22.84 -0.201 -0.248 -0.184 -0.156 -0.119 -0.099 0.011 0.011 0.008 0.005 0.003 0.002 ICE UN Equity INTERCONTINENTALEXCHANGE INC Financials 176.81 18.65 19.26 19.66 20.34 -0.418 -0.338 -0.287 -0.220 0.014 0.011 0.009 0.005 IBM UN Equity INTL BUSINESS MACHINES CORP Information Technology 202.87 1.95% 06.08.2013 15.04 17.46 17.73 17.05 17.53 18.28 -0.348 -0.248 -0.213 -0.184 -0.151 -0.124 0.013 0.011 0.008 0.004 0.003 0.002 IFF UN Equity INTL FLAVORS & FRAGRANCES Materials 81.47 1.78% 16.09.2013 15.17 16.52 17.04 17.11 -0.268 -0.343 -0.345 -0.239 0.004 0.007 0.008 0.006 IGT UN Equity INTL GAME TECHNOLOGY Consumer Discretionary 18.00 1.78% 18.06.2013 28.95 29.73 30.57 32.26 33.51 33.39 -0.094 -0.131 -0.136 -0.122 -0.101 -0.095 0.002 0.007 0.007 0.003 0.001 0.001 IP UN Equity INTERNATIONAL PAPER CO Materials 48.66 2.67% 15.08.2013 25.38 25.89 26.50 27.41 28.04 28.57 -0.372 -0.309 -0.258 -0.188 -0.151 -0.128 0.015 0.010 0.007 0.003 0.001 0.001 IPG UN Equity INTERPUBLIC GROUP OF COS INC Consumer Discretionary 14.87 2.02% 07.06.2013 22.82 23.63 24.91 27.09 28.46 29.92 0.080 -0.127 -0.172 -0.120 -0.122 -0.104 0.002 0.003 0.003 0.003 0.002 0.001 INTU UW Equity INTUIT INC Information Technology 59.57 1.14% 08.07.2013 24.59 23.73 23.29 23.12 23.66 24.18 -0.205 -0.224 -0.209 -0.167 -0.148 -0.135 0.009 0.008 0.006 0.003 0.002 0.001 ISRG UW Equity INTUITIVE SURGICAL INC Health Care 485.41 26.63 30.05 30.91 30.55 30.03 29.96 -0.326 -0.261 -0.223 -0.175 -0.131 -0.116 0.014 0.007 0.004 0.002 0.001 0.001 IVZ UN Equity INVESCO LTD Financials 34.15 2.56% 22.08.2013 20.87 22.01 22.25 -0.173 -0.267 -0.268 0.006 0.007 0.007 IRM UN Equity IRON MOUNTAIN INC Industrials 39.19 2.86% 19.06.2013 21.80 23.23 24.07 24.68 24.49 24.53 -0.348 -0.324 -0.269 -0.181 -0.170 -0.142 0.015 0.011 0.008 0.005 0.002 0.002 JBL UN Equity JABIL CIRCUIT INC Information Technology 19.61 1.22% 15.08.2013 29.98 28.31 27.83 29.26 30.33 31.77 -0.177 -0.170 -0.164 -0.162 -0.104 -0.099 0.000 0.003 0.004 0.003 0.001 0.001 JEC UN Equity JACOBS ENGINEERING GROUP INC Industrials 51.79 23.25 23.90 24.55 -0.243 -0.248 -0.234 0.005 0.009 0.008 At The Money Implied Volatilities by Terms S&P500Index Option Implied Volatility Skew Parameters by Terms: IVt = atx + btx2 + ct Q.M.S Advisors | tel: +41 (0)78 922 08 77 | e-mail: info@qmsadv.com |
- 3. 15.05.2013 Ticker Name GICS_SECTOR_NAME ATM2 Ref Dividend Yield Next Ex- Dividend Date ATM2 Vol - 30D ATM2 Vol - 60D ATM2 Vol - 90D ATM2 Vol - 6M ATM2 Vol - 12M ATM2 Vol - 18M ATM2 Vol - 24M Skew (a) - 30D Skew (a) - 60D Skew (a) - 90D Skew (a) - 6M Skew (a) - 12M Skew (a) - 18M Skew (a) - 24M Skew (b) - 30D Skew (b) - 60D Skew (b) - 90D Skew (b) - 6M Skew (b) - 12M Skew (b) - 18M Skew (b) - 24M JEC UN Equity JACOBS ENGINEERING GROUP INC Industrials 51.79 23.25 23.90 24.55 -0.243 -0.248 -0.234 0.005 0.009 0.008 JCP UN Equity J.C. PENNEY CO INC Consumer Discretionary 19.02 61.05 56.63 57.27 54.76 52.01 52.50 -0.120 -0.164 -0.162 -0.147 -0.110 -0.120 0.003 0.004 0.003 0.002 0.001 0.001 JDSU UW Equity JDS UNIPHASE CORP Information Technology 13.23 36.69 38.73 39.84 40.81 42.34 42.76 -0.303 -0.220 -0.175 -0.145 -0.152 -0.129 0.015 0.009 0.005 0.002 0.000 0.000 SJM UN Equity JM SMUCKER CO/THE Consumer Staples 103.86 2.20% 07.08.2013 17.65 16.58 16.20 -0.410 -0.330 -0.262 0.015 0.012 0.009 JNJ UN Equity JOHNSON & JOHNSON Health Care 87.56 3.02% 23.08.2013 12.38 12.82 12.99 13.05 13.98 15.33 -0.323 -0.259 -0.221 -0.177 -0.128 -0.103 0.018 0.011 0.008 0.006 0.004 0.002 JCI UN Equity JOHNSON CONTROLS INC Consumer Discretionary 36.60 2.19% 05.06.2013 18.37 20.53 21.07 21.52 23.57 24.49 -0.277 -0.307 -0.280 -0.219 -0.174 -0.149 0.008 0.011 0.009 0.004 0.002 0.001 JOY UN Equity JOY GLOBAL INC Industrials 56.26 1.38% 04.06.2013 38.83 36.68 36.27 37.40 38.66 39.06 -0.175 -0.181 -0.173 -0.150 -0.136 -0.123 0.003 0.003 0.002 0.001 0.001 0.001 JPM UN Equity JPMORGAN CHASE & CO Financials 50.89 2.99% 04.10.2013 20.45 21.03 20.82 20.87 21.88 22.92 -0.362 -0.303 -0.280 -0.222 -0.184 -0.151 0.016 0.012 0.007 0.004 0.003 0.002 JNPR UN Equity JUNIPER NETWORKS INC Information Technology 17.04 30.85 31.49 33.18 36.06 36.88 37.78 -0.082 -0.160 -0.169 -0.116 -0.081 -0.082 0.012 0.009 0.007 0.002 0.000 0.000 K UN Equity KELLOGG CO Consumer Staples 65.54 2.78% 30.08.2013 11.34 12.76 13.46 13.89 14.63 14.90 -0.208 -0.249 -0.256 -0.210 -0.114 -0.105 0.005 0.007 0.008 0.005 0.003 0.002 KEY UN Equity KEYCORP Financials 10.58 2.08% 31.05.2013 19.60 20.30 20.93 22.31 24.73 26.42 -0.235 -0.158 -0.123 -0.126 -0.101 -0.088 0.008 0.008 0.008 0.005 0.003 0.002 KMB UN Equity KIMBERLY-CLARK CORP Consumer Staples 104.69 3.16% 04.09.2013 16.34 16.07 16.44 17.25 18.35 19.87 -0.482 -0.434 -0.381 -0.282 -0.204 -0.161 0.017 0.014 0.011 0.007 0.004 0.002 KIM UN Equity KIMCO REALTY CORP Financials 24.70 3.48% 30.09.2013 14.69 15.25 15.87 0.000 -0.150 -0.203 0.000 0.003 0.005 KMI UN Equity KINDER MORGAN INC Energy 40.12 4.29% 31.07.2013 17.10 16.69 16.73 17.79 19.69 20.45 -0.383 -0.275 -0.204 -0.151 -0.117 -0.120 0.020 0.017 0.014 0.007 0.002 0.002 KLAC UW Equity KLA-TENCOR CORPORATION Information Technology 55.12 2.45% 08.08.2013 25.04 26.73 27.54 27.92 27.53 28.18 -0.236 -0.225 -0.211 -0.170 -0.143 -0.126 0.011 0.006 0.004 0.002 0.002 0.001 KSS UN Equity KOHLS CORP Consumer Discretionary 49.32 2.92% 03.06.2013 28.04 25.35 24.37 24.30 24.41 24.78 -0.216 -0.245 -0.239 -0.184 -0.163 -0.152 0.008 0.006 0.004 0.003 0.002 0.001 KRFT UW Equity KRAFT FOODS GROUP INC Consumer Staples 54.66 3.75% 28.06.2013 15.63 15.70 15.81 16.35 16.48 16.62 -0.295 -0.270 -0.244 -0.180 -0.141 -0.125 0.008 0.008 0.007 0.004 0.003 0.002 KR UN Equity KROGER CO Consumer Staples 35.10 1.92% 08.08.2013 22.88 21.32 20.98 21.31 21.26 21.50 -0.261 -0.265 -0.242 -0.180 -0.135 -0.118 0.011 0.011 0.009 0.004 0.002 0.001 LLL UN Equity L-3 COMMUNICATIONS HOLDINGS Industrials 84.43 2.01% 16.08.2013 14.70 15.06 15.69 16.99 -0.404 -0.377 -0.323 -0.233 0.013 0.012 0.010 0.006 LH UN Equity LABORATORY CRP OF AMER HLDGS Health Care 95.77 15.75 17.20 18.09 19.28 -0.213 -0.218 -0.209 -0.162 0.005 0.005 0.005 0.004 LRCX UW Equity LAM RESEARCH CORP Information Technology 47.73 23.71 24.81 25.54 26.72 27.48 28.86 -0.215 -0.214 -0.207 -0.170 -0.154 -0.131 0.006 0.006 0.005 0.003 0.001 0.001 LM UN Equity LEGG MASON INC Financials 34.74 1.50% 04.10.2013 23.71 25.20 26.19 27.37 -0.265 -0.256 -0.250 -0.231 0.004 0.005 0.004 0.002 LEG UN Equity LEGGETT & PLATT INC Consumer Discretionary 34.00 3.50% 13.09.2013 20.17 20.03 20.22 20.92 -0.296 -0.248 -0.219 -0.188 0.005 0.007 0.007 0.005 LEN UN Equity LENNAR CORP-A Consumer Discretionary 43.67 0.37% 05.07.2013 31.48 32.81 33.45 33.74 34.23 34.86 -0.225 -0.200 -0.182 -0.154 -0.082 -0.085 0.008 0.005 0.004 0.002 0.001 0.001 LUK UN Equity LEUCADIA NATIONAL CORP Financials 31.66 0.79% 13.09.2013 23.03 22.72 22.74 23.49 24.64 25.22 0.000 -0.107 -0.151 -0.137 -0.082 -0.037 0.000 0.004 0.005 0.003 0.002 0.001 LIFE UW Equity LIFE TECHNOLOGIES CORP Health Care 73.55 8.23 7.20 6.62 7.35 0.000 -0.428 -0.564 -0.455 0.000 0.011 0.014 0.010 LNC UN Equity LINCOLN NATIONAL CORP Financials 35.53 1.58% 10.07.2013 26.95 26.48 26.83 28.04 29.17 30.19 -0.414 -0.389 -0.343 -0.241 -0.166 -0.151 0.012 0.009 0.007 0.003 0.001 0.001 LLTC UW Equity LINEAR TECHNOLOGY CORP Information Technology 37.89 2.80% 14.08.2013 18.24 19.38 19.99 21.02 -0.109 -0.190 -0.210 -0.184 0.003 0.006 0.007 0.004 LMT UN Equity LOCKHEED MARTIN CORP Industrials 102.50 4.68% 29.08.2013 14.27 14.78 15.19 16.03 16.98 17.69 -0.467 -0.367 -0.308 -0.242 -0.179 -0.159 0.017 0.012 0.009 0.005 0.004 0.003 L UN Equity LOEWS CORP Financials 45.96 0.54% 30.08.2013 13.57 13.93 14.28 15.11 0.000 -0.092 -0.131 -0.150 0.000 0.003 0.004 0.003 LO UN Equity LORILLARD INC Consumer Staples 43.87 5.08% 28.08.2013 30.43 30.52 30.22 27.05 24.14 23.83 -0.396 -0.287 -0.236 -0.182 -0.144 -0.128 0.017 0.009 0.004 0.003 0.002 0.001 LOW UN Equity LOWE'S COS INC Consumer Discretionary 43.06 1.76% 22.07.2013 27.35 25.12 24.51 24.93 25.67 26.64 -0.296 -0.238 -0.207 -0.179 -0.150 -0.131 0.011 0.008 0.006 0.003 0.002 0.001 LSI UW Equity LSI CORP Information Technology 7.01 30.54 30.40 31.08 33.13 35.65 37.19 0.000 -0.142 -0.165 -0.138 -0.138 -0.101 0.000 0.004 0.004 0.002 0.001 0.001 LTD UN Equity L BRANDS INC Consumer Discretionary 50.98 2.43% 05.06.2013 25.81 25.26 25.17 25.61 25.76 26.11 -0.319 -0.282 -0.253 -0.191 -0.154 -0.131 0.010 0.007 0.005 0.003 0.002 0.001 LYB UN Equity LYONDELLBASELL INDU-CL A Materials 64.68 3.40% 21.05.2013 28.32 28.56 28.92 29.93 31.07 31.70 -0.266 -0.251 -0.232 -0.177 -0.153 -0.133 0.008 0.006 0.004 0.003 0.000 0.000 MTB UN Equity M & T BANK CORP Financials 105.02 2.67% 30.05.2013 13.78 14.93 15.78 -0.280 -0.256 -0.244 0.008 0.008 0.007 M UN Equity MACY'S INC Consumer Discretionary 48.23 2.07% 11.09.2013 24.65 24.04 23.94 24.48 25.36 26.01 -0.306 -0.259 -0.235 -0.206 -0.167 -0.145 0.012 0.009 0.006 0.003 0.002 0.001 MRO UN Equity MARATHON OIL CORP Energy 34.63 2.43% 12.08.2013 24.23 24.43 24.73 25.32 26.09 26.77 -0.382 -0.297 -0.243 -0.182 -0.144 -0.127 0.014 0.010 0.007 0.003 0.002 0.001 MPC UN Equity MARATHON PETROLEUM CORP Energy 79.78 1.87% 16.08.2013 33.15 32.40 32.62 33.91 35.57 36.67 -0.214 -0.185 -0.171 -0.137 -0.087 -0.084 0.007 0.005 0.005 0.003 0.000 0.000 MAR UN Equity MARRIOTT INTERNATIONAL -CL A Consumer Discretionary 44.19 1.54% 23.08.2013 18.48 19.96 21.00 22.27 23.63 24.87 -0.314 -0.351 -0.305 -0.201 -0.168 -0.150 0.008 0.009 0.008 0.004 0.002 0.001 MMC UN Equity MARSH & MCLENNAN COS Financials 40.61 2.46% 10.07.2013 14.03 13.44 13.75 15.22 -0.133 -0.226 -0.255 -0.234 0.001 0.003 0.005 0.005 MAS UN Equity MASCO CORP Industrials 22.32 1.37% 03.07.2013 32.52 32.98 34.02 35.86 36.24 36.31 -0.296 -0.289 -0.261 -0.202 -0.159 -0.145 0.002 0.004 0.004 0.001 0.001 0.001 MA UN Equity MASTERCARD INC-CLASS A Information Technology 572.34 0.42% 10.07.2013 17.08 17.06 17.85 19.94 21.78 22.79 -0.413 -0.337 -0.284 -0.218 -0.162 -0.134 0.013 0.009 0.006 0.004 0.002 0.001 MAT UW Equity MATTEL INC Consumer Discretionary 46.72 3.17% 26.08.2013 15.64 18.92 19.79 19.69 20.41 21.74 -0.228 -0.244 -0.226 -0.172 -0.131 -0.112 0.006 0.006 0.006 0.004 0.002 0.002 MKC UN Equity MCCORMICK & CO-NON VTG SHRS Consumer Staples 74.69 1.93% 02.07.2013 13.26 14.50 15.27 16.35 -0.591 -0.387 -0.263 -0.148 0.023 0.018 0.014 0.006 MCD UN Equity MCDONALD'S CORP Consumer Discretionary 101.75 3.22% 30.05.2013 12.99 12.72 13.20 14.15 14.81 15.56 -0.320 -0.254 -0.201 -0.147 -0.109 -0.105 0.016 0.014 0.011 0.007 0.004 0.002 MHP UN Equity MCGRAW HILL FINANCIAL INC Financials 55.18 MCK UN Equity MCKESSON CORP Health Care 116.03 0.83% 30.05.2013 16.20 17.76 18.49 18.63 19.26 20.36 -0.390 -0.316 -0.275 -0.219 -0.200 -0.172 0.013 0.011 0.009 0.005 0.003 0.002 MJN UN Equity MEAD JOHNSON NUTRITION CO Consumer Staples 80.56 1.74% 27.06.2013 22.07 24.62 25.42 24.34 24.53 24.79 -0.300 -0.173 -0.118 -0.146 -0.065 -0.078 0.013 0.007 0.004 0.005 0.000 0.000 MWV UN Equity MEADWESTVACO CORP Materials 35.86 2.96% 30.07.2013 26.22 25.21 24.52 23.43 -0.317 -0.242 -0.195 -0.164 0.022 0.014 0.009 0.004 MDT UN Equity MEDTRONIC INC Health Care 49.93 2.24% 03.07.2013 18.19 17.21 16.89 17.71 18.81 19.45 -0.335 -0.232 -0.173 -0.168 -0.152 -0.140 0.015 0.013 0.011 0.006 0.003 0.002 MRK UN Equity MERCK & CO. INC. Health Care 46.80 3.76% 14.06.2013 15.76 15.90 16.29 17.08 18.46 19.91 -0.378 -0.272 -0.215 -0.167 -0.128 -0.112 0.015 0.010 0.007 0.005 0.003 0.002 MET UN Equity METLIFE INC Financials 42.64 2.58% 06.08.2013 23.75 23.69 24.17 24.94 26.45 27.67 -0.377 -0.342 -0.278 -0.196 -0.155 -0.137 0.010 0.008 0.006 0.003 0.002 0.001 PCS UN Equity METROPCS COMMUNICATIONS INC Telecommunication Services 11.84 MCHP UW Equity MICROCHIP TECHNOLOGY INC Information Technology 37.72 3.77% 20.08.2013 18.83 19.56 20.31 22.01 -0.225 -0.283 -0.267 -0.203 0.006 0.007 0.006 0.002 MU UW Equity MICRON TECHNOLOGY INC Information Technology 10.87 41.62 41.27 41.64 42.79 43.04 42.70 -0.201 -0.227 -0.217 -0.174 -0.159 -0.159 0.007 0.005 0.003 0.002 0.001 0.001 MSFT UW Equity MICROSOFT CORP Information Technology 33.73 2.99% 14.08.2013 19.58 20.21 19.83 19.70 20.75 22.01 -0.392 -0.240 -0.196 -0.143 -0.115 -0.089 0.014 0.008 0.007 0.005 0.003 0.002 MOLX UW Equity MOLEX INC Information Technology 29.48 3.26% 25.09.2013 19.95 22.04 22.71 22.54 0.000 -0.120 -0.158 -0.135 0.000 0.003 0.004 0.005 TAP UN Equity MOLSON COORS BREWING CO -B Consumer Staples 50.93 2.83% 06.06.2013 29.09 29.52 28.68 26.57 25.76 25.79 -0.173 -0.146 -0.131 -0.122 -0.114 -0.094 0.012 0.007 0.005 0.003 0.001 0.001 MDLZ UW Equity MONDELEZ INTERNATIONAL INC-A Consumer Staples 31.39 1.66% 28.06.2013 25.40 22.76 21.21 20.42 18.97 20.84 -0.577 -0.448 -0.349 -0.202 -0.070 -0.048 0.023 0.016 0.012 0.005 0.004 0.002 MON UN Equity MONSANTO CO Materials 108.81 1.50% 03.07.2013 18.72 20.51 21.11 21.61 23.25 24.60 -0.408 -0.277 -0.224 -0.189 -0.155 -0.131 0.015 0.012 0.009 0.004 0.002 0.001 MNST UW Equity MONSTER BEVERAGE CORP Consumer Staples 56.98 34.20 34.56 35.03 36.51 37.15 37.20 -0.309 -0.292 -0.274 -0.225 -0.167 -0.143 0.016 0.010 0.006 0.003 0.001 0.001 MCO UN Equity MOODY'S CORP Financials 67.47 1.24% 22.08.2013 27.17 28.81 29.47 29.68 28.29 28.67 -0.362 -0.311 -0.270 -0.200 -0.172 -0.143 0.010 0.007 0.005 0.003 0.002 0.001 MS UN Equity MORGAN STANLEY Financials 24.48 0.94% 29.07.2013 28.94 30.04 30.08 29.30 29.49 30.65 -0.389 -0.326 -0.283 -0.224 -0.162 -0.128 0.009 0.005 0.003 0.002 0.001 0.001 MOS UN Equity MOSAIC CO/THE Materials 61.37 2.05% 30.07.2013 26.85 27.24 27.56 28.32 28.15 27.63 -0.122 -0.131 -0.136 -0.134 -0.141 -0.133 0.018 0.010 0.006 0.002 0.002 0.001 MSI UN Equity MOTOROLA SOLUTIONS INC Information Technology 56.93 1.98% 13.09.2013 18.49 18.61 19.33 20.97 21.93 22.21 -0.168 -0.223 -0.211 -0.166 -0.149 -0.134 0.006 0.013 0.012 0.004 0.002 0.001 MUR UN Equity MURPHY OIL CORP Energy 63.60 1.47% 16.08.2013 21.44 22.38 23.01 24.14 25.10 25.28 -0.191 -0.249 -0.236 -0.183 -0.163 -0.158 0.005 0.007 0.006 0.003 0.002 0.001 MYL UW Equity MYLAN INC Health Care 29.97 23.79 23.59 23.61 23.79 24.35 25.15 -0.073 -0.139 -0.156 -0.144 -0.111 -0.096 0.004 0.008 0.007 0.003 0.002 0.001 NBR UN Equity NABORS INDUSTRIES LTD Energy 15.67 1.02% 09.09.2013 37.25 38.09 38.63 39.43 40.56 42.25 -0.120 -0.103 -0.096 -0.101 -0.097 -0.081 0.003 0.003 0.002 0.002 0.001 0.001 NDAQ UW Equity NASDAQ OMX GROUP/THE Financials 30.98 1.68% 11.09.2013 25.51 25.31 25.22 25.25 -0.150 -0.121 -0.108 -0.108 0.008 0.006 0.004 0.003 NOV UN Equity NATIONAL OILWELL VARCO INC Energy 66.93 0.81% 12.06.2013 24.07 25.05 25.75 26.82 28.42 29.31 -0.329 -0.239 -0.191 -0.156 -0.139 -0.121 0.013 0.009 0.006 0.003 0.002 0.001 NTAP UW Equity NETAPP INC Information Technology 35.85 39.15 35.03 33.10 31.65 30.15 30.27 -0.215 -0.196 -0.189 -0.170 -0.128 -0.122 0.008 0.005 0.003 0.002 0.000 0.000 NFLX UW Equity NETFLIX INC Consumer Discretionary 243.33 40.31 41.09 45.58 49.49 45.98 44.99 -0.104 -0.152 -0.157 -0.135 -0.105 -0.108 0.006 0.003 0.002 0.001 0.001 0.000 NWL UN Equity NEWELL RUBBERMAID INC Consumer Discretionary 28.07 2.14% 30.08.2013 18.89 20.10 20.90 21.99 -0.252 -0.224 -0.205 -0.174 0.004 0.005 0.005 0.003 NFX UN Equity NEWFIELD EXPLORATION CO Energy 23.36 34.40 36.50 37.68 38.98 40.23 41.15 -0.311 -0.253 -0.215 -0.167 -0.133 -0.114 0.013 0.006 0.003 0.001 0.001 0.001 NEM UN Equity NEWMONT MINING CORP Materials 31.74 5.35% 06.09.2013 31.89 31.95 32.14 32.86 33.15 33.98 -0.165 -0.134 -0.121 -0.093 -0.071 -0.053 0.015 0.010 0.006 0.003 0.001 0.001 NWSA UW Equity NEWS CORP-CL A Consumer Discretionary 33.18 0.60% 09.09.2013 22.17 23.32 24.36 25.16 25.40 27.00 -0.204 -0.187 -0.176 -0.145 -0.101 -0.091 0.005 0.004 0.004 0.002 0.001 0.001 NEE UN Equity NEXTERA ENERGY INC Utilities 80.75 3.36% 29.05.2013 12.32 12.28 12.44 13.14 13.93 14.73 -0.218 -0.244 -0.250 -0.227 -0.173 -0.148 0.004 0.007 0.007 0.006 0.003 0.002 NKE UN Equity NIKE INC -CL B Consumer Discretionary 65.79 1.37% 05.09.2013 18.25 22.36 22.92 22.17 23.40 24.98 -0.349 -0.250 -0.217 -0.191 -0.154 -0.122 0.015 0.010 0.007 0.004 0.002 0.001 NI UN Equity NISOURCE INC Utilities 29.80 3.36% 30.10.2013 15.60 15.23 15.33 -0.120 -0.227 -0.267 0.003 0.004 0.005 NE UN Equity NOBLE CORP Energy 39.32 2.54% 01.08.2013 33.98 33.75 33.67 33.90 33.56 33.72 -0.205 -0.182 -0.164 -0.140 -0.092 -0.089 0.012 0.007 0.004 0.002 0.001 0.001 NBL UN Equity NOBLE ENERGY INC Energy 116.64 0.96% 08.08.2013 24.61 24.76 24.87 25.07 25.60 26.19 -0.335 -0.277 -0.238 -0.189 -0.152 -0.131 0.012 0.007 0.005 0.003 0.002 0.001 JWN UN Equity NORDSTROM INC Consumer Discretionary 61.36 2.00% 04.09.2013 22.05 20.68 20.74 22.08 23.11 23.79 -0.316 -0.300 -0.265 -0.197 -0.170 -0.152 0.010 0.009 0.007 0.003 0.001 0.001 NSC UN Equity NORFOLK SOUTHERN CORP Industrials 80.05 2.87% 07.08.2013 18.05 19.01 19.65 20.68 22.07 23.00 -0.373 -0.308 -0.265 -0.206 -0.170 -0.141 0.013 0.010 0.007 0.004 0.002 0.002 NU UN Equity NORTHEAST UTILITIES Utilities 44.33 3.37% 28.08.2013 13.04 13.49 13.64 0.000 -0.118 -0.159 0.000 0.002 0.003 NTRS UW Equity NORTHERN TRUST CORP Financials 56.86 2.18% 09.09.2013 14.84 16.24 17.05 17.73 -0.061 -0.240 -0.261 -0.230 0.000 0.005 0.006 0.005 NOC UN Equity NORTHROP GRUMMAN CORP Industrials 79.01 3.09% 29.08.2013 14.66 15.91 16.71 17.34 -0.281 -0.280 -0.271 -0.212 0.008 0.009 0.008 0.004 NRG UN Equity NRG ENERGY INC Utilities 27.82 1.74% 31.07.2013 21.79 23.34 24.12 24.55 23.86 24.71 -0.304 -0.266 -0.240 -0.174 -0.190 -0.144 0.013 0.011 0.010 0.005 0.002 0.002 NUE UN Equity NUCOR CORP Materials 45.06 3.27% 28.06.2013 21.45 22.39 22.52 22.62 24.07 25.05 -0.464 -0.317 -0.239 -0.178 -0.155 -0.132 0.017 0.010 0.007 0.004 0.002 0.001 NVDA UW Equity NVIDIA CORP Information Technology 14.72 2.04% 21.08.2013 24.05 24.48 26.36 29.12 29.30 30.03 -0.126 -0.009 -0.005 -0.060 -0.050 -0.051 0.017 0.006 0.001 0.002 0.001 0.001 NYX UN Equity NYSE EURONEXT Financials 41.18 2.91% 13.09.2013 13.32 13.11 13.19 14.28 14.61 14.21 -0.183 -0.227 -0.244 -0.210 -0.127 -0.106 0.007 0.007 0.007 0.005 0.003 0.003 ORLY UW Equity O'REILLY AUTOMOTIVE INC Consumer Discretionary 111.70 17.82 20.60 21.80 22.12 22.31 23.53 -0.293 -0.166 -0.135 -0.179 -0.122 -0.103 0.008 0.010 0.010 0.008 0.001 0.001 OXY UN Equity OCCIDENTAL PETROLEUM CORP Energy 90.15 2.90% 10.09.2013 23.17 24.74 25.50 25.73 26.41 27.26 -0.155 -0.122 -0.118 -0.124 -0.127 -0.109 0.019 0.010 0.005 0.003 0.002 0.001 OMC UN Equity OMNICOM GROUP Consumer Discretionary 63.58 2.60% 14.06.2013 16.35 17.43 17.85 -0.279 -0.312 -0.270 0.007 0.011 0.010 OKE UN Equity ONEOK INC Utilities 49.13 3.30% 07.08.2013 20.14 20.48 20.80 -0.202 -0.189 -0.175 0.008 0.014 0.013 ORCL UW Equity ORACLE CORP Information Technology 34.07 0.62% 07.10.2013 20.44 21.38 21.46 21.74 22.94 24.45 -0.290 -0.299 -0.262 -0.196 -0.157 -0.132 0.012 0.008 0.006 0.004 0.002 0.001 OI UN Equity OWENS-ILLINOIS INC Materials 28.72 27.18 29.06 29.88 30.11 -0.264 -0.239 -0.213 -0.144 0.009 0.006 0.004 0.002 PCAR UW Equity PACCAR INC Industrials 53.12 1.28% 16.08.2013 20.17 22.10 22.97 23.70 24.75 26.18 -0.370 -0.320 -0.279 -0.227 -0.193 -0.170 0.014 0.010 0.008 0.004 0.002 0.002 PLL UN Equity PALL CORP Industrials 69.95 1.52% 31.07.2013 20.00 20.51 20.71 20.59 -0.357 -0.218 -0.142 -0.107 0.012 0.006 0.004 0.005 PH UN Equity PARKER HANNIFIN CORP Industrials 96.88 2.04% 20.08.2013 19.77 21.58 22.55 23.35 -0.335 -0.284 -0.255 -0.221 0.010 0.008 0.006 0.003 PDCO UW Equity PATTERSON COS INC Health Care 38.76 1.70% 05.07.2013 22.11 20.82 20.38 -0.433 -0.436 -0.389 0.010 0.010 0.009 PAYX UW Equity PAYCHEX INC Information Technology 38.36 3.52% 01.08.2013 13.44 14.22 14.75 15.74 16.16 16.65 -0.342 -0.325 -0.298 -0.204 -0.176 -0.150 0.012 0.010 0.009 0.007 0.004 0.003 BTU UN Equity PEABODY ENERGY CORP Energy 19.91 1.93% 30.07.2013 39.06 39.86 40.40 41.26 42.54 43.34 -0.238 -0.194 -0.167 -0.141 -0.115 -0.101 0.009 0.005 0.003 0.002 0.001 0.001 PNR UN Equity PENTAIR LTD-REGISTERED Industrials 57.34 1.85% 24.07.2013 21.65 22.91 23.67 24.67 -0.219 -0.239 -0.230 -0.160 0.005 0.007 0.007 0.005 PBCT UW Equity PEOPLE'S UNITED FINANCIAL Financials 13.78 4.74% 31.07.2013 14.32 14.27 14.22 14.56 -0.155 -0.153 -0.151 -0.083 0.004 0.004 0.004 0.002 POM UN Equity PEPCO HOLDINGS INC Utilities 21.96 4.92% 12.09.2013 13.05 12.79 13.12 14.37 0.000 -0.097 -0.126 -0.064 0.000 0.002 0.002 0.001 PEP UN Equity PEPSICO INC Consumer Staples 83.84 2.71% 04.09.2013 13.15 13.18 13.49 14.04 14.65 15.54 -0.294 -0.299 -0.271 -0.171 -0.143 -0.125 0.022 0.015 0.010 0.007 0.004 0.003 PKI UN Equity PERKINELMER INC Health Care 32.50 0.86% 24.07.2013 28.22 28.39 28.51 28.72 -0.113 -0.116 -0.119 -0.127 0.000 0.003 0.004 0.003 PRGO UW Equity PERRIGO CO Health Care 120.97 0.31% 28.08.2013 15.97 16.92 17.83 20.01 -0.181 -0.056 -0.038 -0.161 0.004 0.006 0.006 0.005 PETM UW Equity PETSMART INC Consumer Discretionary 69.40 1.12% 31.07.2013 28.26 24.72 23.33 23.34 23.74 24.29 -0.279 -0.218 -0.180 -0.149 -0.131 -0.102 0.007 0.006 0.004 0.002 0.001 0.001 PFE UN Equity PFIZER INC Health Care 29.34 3.41% 07.08.2013 16.19 16.28 17.20 17.55 18.87 20.50 -0.269 -0.261 -0.219 -0.165 -0.133 -0.114 0.013 0.013 0.010 0.006 0.004 0.002 PCG UN Equity P G & E CORP Utilities 47.16 3.89% 28.06.2013 15.53 14.51 14.04 14.08 0.000 -0.100 -0.145 -0.147 0.000 0.003 0.004 0.006 PM UN Equity PHILIP MORRIS INTERNATIONAL Consumer Staples 95.47 3.84% 25.06.2013 13.97 15.19 15.87 16.64 17.63 18.66 -0.495 -0.345 -0.258 -0.196 -0.146 -0.133 0.017 0.014 0.011 0.006 0.004 0.002 PSX UN Equity PHILLIPS 66 Energy 64.71 2.50% 11.07.2013 32.67 34.21 34.75 34.30 34.38 34.82 -0.121 -0.123 -0.115 -0.104 -0.095 -0.084 0.007 0.004 0.003 0.001 0.001 0.001 PNW UN Equity PINNACLE WEST CAPITAL Utilities 59.96 3.74% 01.08.2013 10.70 12.57 13.50 0.000 0.002 -0.011 0.000 0.000 0.000 PXD UN Equity PIONEER NATURAL RESOURCES CO Energy 137.61 0.14% 26.09.2013 30.06 30.44 30.76 31.47 32.63 32.73 -0.248 -0.228 -0.215 -0.200 -0.183 -0.162 0.004 0.004 0.003 0.002 0.001 0.001 PBI UN Equity PITNEY BOWES INC Industrials 14.84 10.11% 07.08.2013 31.50 31.33 32.34 34.36 34.52 34.44 -0.217 -0.288 -0.275 -0.205 -0.151 -0.131 0.005 0.010 0.009 0.004 0.002 0.002 PCL UN Equity PLUM CREEK TIMBER CO Financials 52.76 3.37% 14.08.2013 14.15 15.53 16.14 16.38 17.34 18.02 -0.284 -0.253 -0.228 -0.185 -0.175 -0.148 0.009 0.010 0.009 0.006 0.001 0.001 PNC UN Equity PNC FINANCIAL SERVICES GROUP Financials 70.38 2.59% 12.07.2013 15.92 17.00 17.66 18.83 20.27 21.14 -0.490 -0.404 -0.338 -0.239 -0.188 -0.161 0.017 0.012 0.009 0.005 0.003 0.002 PPG UN Equity PPG INDUSTRIES INC Materials 156.78 1.58% 09.08.2013 20.37 21.29 21.84 22.65 23.57 23.96 -0.461 -0.371 -0.320 -0.293 -0.201 -0.172 0.013 0.009 0.007 0.004 0.002 0.001 PPL UN Equity PPL CORPORATION Utilities 31.91 4.65% 09.09.2013 13.23 12.55 12.45 12.79 13.45 13.49 -0.108 -0.125 -0.145 -0.150 -0.111 -0.089 0.001 0.003 0.004 0.006 0.004 0.003 PX UN Equity PRAXAIR INC Materials 114.19 2.15% 05.09.2013 14.62 15.02 15.75 -0.568 -0.467 -0.388 0.019 0.015 0.011 PCP UN Equity PRECISION CASTPARTS CORP Industrials 210.88 0.07% 05.06.2013 18.28 18.99 19.69 21.26 -0.388 -0.274 -0.215 -0.178 0.014 0.012 0.010 0.005 PCLN UW Equity PRICELINE.COM INC Consumer Discretionary 804.74 21.76 22.28 24.13 27.98 29.78 30.41 -0.113 -0.102 -0.107 -0.123 -0.111 -0.107 0.011 0.006 0.003 0.001 0.001 0.001 Option Implied Volatility Skew Parameters by Terms: IVt = atx + btx 2 + ct At The Money Implied Volatilities by Terms S&P500Index Q.M.S Advisors | tel: +41 (0)78 922 08 77 | e-mail: info@qmsadv.com |
- 4. 15.05.2013 Ticker Name GICS_SECTOR_NAME ATM2 Ref Dividend Yield Next Ex- Dividend Date ATM2 Vol - 30D ATM2 Vol - 60D ATM2 Vol - 90D ATM2 Vol - 6M ATM2 Vol - 12M ATM2 Vol - 18M ATM2 Vol - 24M Skew (a) - 30D Skew (a) - 60D Skew (a) - 90D Skew (a) - 6M Skew (a) - 12M Skew (a) - 18M Skew (a) - 24M Skew (b) - 30D Skew (b) - 60D Skew (b) - 90D Skew (b) - 6M Skew (b) - 12M Skew (b) - 18M Skew (b) - 24M PFG UN Equity PRINCIPAL FINANCIAL GROUP Financials 37.87 2.51% 05.09.2013 18.93 18.47 19.10 -0.300 -0.376 -0.364 0.007 0.012 0.011 PG UN Equity PROCTER & GAMBLE CO/THE Consumer Staples 80.82 3.05% 17.07.2013 13.60 13.27 13.52 14.13 14.49 15.51 -0.503 -0.374 -0.283 -0.193 -0.158 -0.125 0.020 0.016 0.013 0.008 0.005 0.003 PGR UN Equity PROGRESSIVE CORP Financials 26.11 1.63% 21.01.2014 16.23 16.80 17.19 17.72 -0.194 -0.257 -0.274 -0.236 0.004 0.006 0.007 0.006 PLD UN Equity PROLOGIS INC Financials 43.58 2.57% 13.09.2013 16.32 16.91 17.59 19.09 -0.275 -0.313 -0.316 -0.241 0.007 0.009 0.008 0.005 PRU UN Equity PRUDENTIAL FINANCIAL INC Financials 66.91 2.43% 23.08.2013 23.15 23.57 23.95 24.71 27.15 27.97 -0.428 -0.344 -0.290 -0.214 -0.175 -0.144 0.014 0.009 0.006 0.004 0.002 0.001 PEG UN Equity PUBLIC SERVICE ENTERPRISE GP Utilities 34.68 4.17% 04.09.2013 13.41 13.58 13.73 14.46 0.000 -0.065 -0.098 -0.116 0.000 0.001 0.002 0.004 PSA UN Equity PUBLIC STORAGE Financials 165.84 3.11% 09.09.2013 13.11 13.86 14.48 15.57 -0.278 -0.303 -0.301 -0.238 0.006 0.007 0.007 0.005 PHM UN Equity PULTEGROUP INC Consumer Discretionary 24.22 36.58 36.49 37.31 38.83 38.81 39.03 -0.221 -0.213 -0.196 -0.148 -0.112 -0.112 0.005 0.003 0.002 0.002 0.001 0.001 PVH UN Equity PVH CORP Consumer Discretionary 119.32 0.16% 23.05.2013 27.24 26.92 26.80 26.88 -0.316 -0.266 -0.234 -0.198 0.010 0.006 0.004 0.003 QEP UN Equity QEP RESOURCES INC Energy 29.06 0.28% 29.05.2013 35.28 33.11 31.81 30.41 -0.054 -0.059 -0.069 -0.089 0.008 0.005 0.004 0.004 QCOM UW Equity QUALCOMM INC Information Technology 65.32 2.14% 04.09.2013 17.22 18.58 19.67 21.39 23.33 24.52 -0.296 -0.237 -0.192 -0.133 -0.098 -0.083 0.013 0.008 0.005 0.003 0.002 0.001 PWR UN Equity QUANTA SERVICES INC Industrials 29.63 25.66 27.14 27.88 28.31 -0.160 -0.195 -0.205 -0.177 0.006 0.005 0.004 0.003 DGX UN Equity QUEST DIAGNOSTICS INC Health Care 59.52 2.12% 28.06.2013 18.44 19.84 20.42 20.45 -0.022 -0.099 -0.115 -0.088 0.003 0.007 0.008 0.004 RL UN Equity RALPH LAUREN CORP Consumer Discretionary 186.26 0.97% 26.06.2013 28.62 25.56 24.70 25.43 25.77 25.96 -0.309 -0.257 -0.221 -0.179 -0.149 -0.131 0.006 0.005 0.004 0.003 0.001 0.001 RRC UN Equity RANGE RESOURCES CORP Energy 75.35 0.24% 14.06.2013 29.39 30.61 31.22 31.42 31.65 30.49 -0.229 -0.197 -0.181 -0.174 -0.169 -0.159 0.012 0.006 0.004 0.002 0.001 0.001 RTN UN Equity RAYTHEON COMPANY Industrials 65.18 3.44% 05.07.2013 14.00 14.68 14.99 15.33 15.89 16.39 -0.392 -0.330 -0.279 -0.209 -0.168 -0.148 0.014 0.012 0.010 0.007 0.004 0.002 RHT UN Equity RED HAT INC Information Technology 54.08 31.10 30.05 29.68 30.54 29.69 30.94 -0.050 -0.116 -0.147 -0.144 -0.134 -0.124 0.002 0.003 0.003 0.002 0.001 0.000 RF UN Equity REGIONS FINANCIAL CORP Financials 9.06 1.32% 18.09.2013 20.19 22.04 23.03 23.76 26.60 28.67 -0.446 -0.313 -0.245 -0.203 -0.150 -0.125 0.017 0.011 0.008 0.007 0.001 0.001 RSG UN Equity REPUBLIC SERVICES INC Industrials 34.10 2.98% 26.09.2013 17.50 19.21 19.77 0.000 -0.163 -0.176 0.000 0.003 0.003 RAI UN Equity REYNOLDS AMERICAN INC Consumer Staples 48.97 5.19% 10.09.2013 13.29 14.21 14.97 15.44 16.13 16.40 -0.309 -0.286 -0.277 -0.238 -0.148 -0.129 0.007 0.009 0.009 0.006 0.004 0.003 RHI UN Equity ROBERT HALF INTL INC Industrials 34.88 1.86% 23.08.2013 27.34 29.43 30.29 29.98 -0.004 0.016 0.020 -0.014 0.007 0.005 0.004 0.003 ROK UN Equity ROCKWELL AUTOMATION INC Industrials 89.61 1.74% 15.08.2013 18.32 18.74 19.44 -0.360 -0.338 -0.307 0.011 0.009 0.008 COL UN Equity ROCKWELL COLLINS INC Industrials 65.98 1.88% 08.08.2013 16.53 16.86 17.36 -0.154 -0.285 -0.306 0.003 0.007 0.008 ROP UN Equity ROPER INDUSTRIES INC Industrials 121.91 0.59% 10.07.2013 16.33 17.20 17.82 19.04 -0.208 -0.252 -0.257 -0.203 0.009 0.008 0.007 0.004 ROST UW Equity ROSS STORES INC Consumer Discretionary 65.83 1.09% 05.06.2013 26.22 25.41 25.07 25.08 25.38 25.80 -0.291 -0.250 -0.223 -0.180 -0.152 -0.125 0.008 0.006 0.005 0.003 0.002 0.001 RDC UN Equity ROWAN COMPANIES PLC-A Energy 34.25 26.82 26.71 27.50 29.08 -0.167 -0.234 -0.226 -0.171 0.004 0.005 0.005 0.002 R UN Equity RYDER SYSTEM INC Industrials 61.70 2.11% 15.08.2013 25.58 27.50 28.28 28.64 -0.226 -0.245 -0.230 -0.142 0.008 0.005 0.003 0.003 SWY UN Equity SAFEWAY INC Consumer Staples 25.34 3.16% 17.09.2013 27.67 30.00 31.06 31.26 30.02 30.03 -0.301 -0.179 -0.124 -0.096 -0.107 -0.090 0.015 0.008 0.005 0.002 0.004 0.002 SAI UN Equity SAIC INC Information Technology 15.15 3.17% 17.07.2013 22.13 21.42 20.99 20.64 22.57 23.27 -0.168 -0.130 -0.125 -0.195 -0.189 -0.137 0.003 0.003 0.004 0.007 0.001 0.001 CRM UN Equity SALESFORCE.COM INC Information Technology 44.80 36.70 34.50 33.39 33.10 34.22 35.42 -0.175 -0.145 -0.127 -0.110 -0.088 -0.080 0.009 0.005 0.003 0.001 0.001 0.001 SNDK UW Equity SANDISK CORP Information Technology 59.09 27.87 32.20 33.26 32.51 32.14 33.26 -0.211 -0.159 -0.148 -0.153 -0.147 -0.124 0.010 0.006 0.004 0.002 0.002 0.001 SCG UN Equity SCANA CORP Utilities 53.11 3.85% 10.09.2013 13.79 13.64 13.49 12.15 -0.140 -0.141 -0.141 -0.075 0.001 0.001 0.001 0.001 SLB UN Equity SCHLUMBERGER LTD Energy 75.21 1.71% 30.08.2013 21.23 22.16 22.87 23.95 25.33 26.25 -0.349 -0.273 -0.228 -0.164 -0.134 -0.115 0.012 0.008 0.006 0.003 0.002 0.001 SNI UN Equity SCRIPPS NETWORKS INTER-CL A Consumer Discretionary 68.62 0.92% 29.05.2013 18.62 21.21 22.47 23.34 -0.167 -0.174 -0.173 -0.150 0.007 0.005 0.004 0.003 STX UW Equity SEAGATE TECHNOLOGY Information Technology 40.85 3.92% 14.08.2013 31.26 32.43 34.13 36.05 36.32 36.18 -0.281 -0.268 -0.236 -0.198 -0.153 -0.138 0.008 0.004 0.003 0.002 0.001 0.001 SEE UN Equity SEALED AIR CORP Materials 23.10 2.25% 28.08.2013 26.75 26.58 27.25 28.91 30.21 31.09 -0.248 -0.150 -0.143 -0.197 -0.155 -0.108 0.007 0.003 0.003 0.004 0.001 0.001 SRE UN Equity SEMPRA ENERGY Utilities 83.09 3.12% 24.06.2013 13.15 13.12 13.34 -0.229 -0.199 -0.192 0.005 0.005 0.005 SHW UN Equity SHERWIN-WILLIAMS CO/THE Materials 193.80 1.14% 14.08.2013 18.47 19.03 19.37 20.20 21.85 22.78 -0.403 -0.351 -0.303 -0.232 -0.171 -0.149 0.013 0.008 0.005 0.003 0.001 0.001 SIAL UW Equity SIGMA-ALDRICH Materials 82.69 1.06% 28.08.2013 12.21 12.05 12.59 -0.192 -0.283 -0.305 0.004 0.007 0.008 SPG UN Equity SIMON PROPERTY GROUP INC Financials 178.17 2.75% 14.08.2013 12.81 13.85 14.74 16.40 17.95 18.98 -0.395 -0.311 -0.252 -0.217 -0.184 -0.164 0.015 0.011 0.008 0.005 0.003 0.002 SLM UW Equity SLM CORP Financials 22.10 2.85% 04.09.2013 21.59 22.46 23.06 24.07 25.80 26.94 -0.395 -0.341 -0.289 -0.216 -0.191 -0.170 0.017 0.012 0.009 0.005 0.003 0.002 SNA UN Equity SNAP-ON INC Industrials 92.02 1.67% 22.08.2013 17.29 18.08 18.59 19.81 -0.394 -0.351 -0.312 -0.246 0.014 0.012 0.010 0.007 SO UN Equity SOUTHERN CO/THE Utilities 46.56 4.41% 08.08.2013 11.48 11.48 11.51 12.02 13.40 14.21 -0.450 -0.409 -0.344 -0.217 -0.120 -0.114 0.012 0.014 0.012 0.007 0.005 0.003 LUV UN Equity SOUTHWEST AIRLINES CO Industrials 14.31 0.28% 04.06.2013 23.58 24.72 25.30 25.72 25.28 25.42 -0.059 -0.120 -0.146 -0.142 -0.109 -0.099 0.003 0.006 0.007 0.004 0.002 0.001 SWN UN Equity SOUTHWESTERN ENERGY CO Energy 37.36 26.69 28.33 29.30 30.54 31.21 31.37 -0.211 -0.169 -0.146 -0.133 -0.109 -0.108 0.014 0.008 0.005 0.002 0.001 0.001 SE UN Equity SPECTRA ENERGY CORP Energy 31.24 4.15% 07.08.2013 15.42 15.93 16.10 15.74 16.98 17.42 -0.205 -0.238 -0.240 -0.171 -0.143 -0.117 0.006 0.010 0.011 0.008 0.005 0.003 S UN Equity SPRINT NEXTEL CORP Telecommunication Services 7.30 26.37 29.96 30.60 28.24 24.23 22.57 -0.269 -0.219 -0.152 -0.037 -0.034 0.009 0.020 0.013 0.009 0.004 0.005 0.003 STJ UN Equity ST JUDE MEDICAL INC Health Care 46.34 2.20% 02.10.2013 20.57 21.87 22.44 23.20 24.68 25.60 -0.222 -0.275 -0.267 -0.206 -0.133 -0.111 0.008 0.008 0.006 0.003 0.002 0.001 SWK UN Equity STANLEY BLACK & DECKER INC Industrials 80.74 2.84% 06.09.2013 18.55 19.76 20.56 21.71 23.20 24.04 -0.327 -0.341 -0.305 -0.217 -0.171 -0.152 0.009 0.009 0.007 0.003 0.002 0.001 SPLS UW Equity STAPLES INC Consumer Discretionary 14.38 3.44% 26.06.2013 36.97 35.28 34.14 32.55 29.39 29.66 -0.147 -0.138 -0.131 -0.122 -0.077 -0.073 0.004 0.004 0.004 0.002 0.002 0.001 SBUX UW Equity STARBUCKS CORP Consumer Discretionary 63.82 1.50% 05.08.2013 18.41 18.83 19.94 22.43 24.34 25.16 -0.350 -0.286 -0.232 -0.161 -0.128 -0.109 0.013 0.010 0.007 0.004 0.002 0.001 HOT UN Equity STARWOOD HOTELS & RESORTS Consumer Discretionary 67.72 1.85% 10.12.2013 20.89 22.05 22.88 24.34 26.18 27.74 -0.381 -0.282 -0.223 -0.163 -0.118 -0.105 0.012 0.008 0.006 0.002 0.001 0.001 STT UN Equity STATE STREET CORP Financials 63.27 1.69% 27.06.2013 18.87 20.32 21.09 21.83 23.35 24.34 -0.396 -0.340 -0.297 -0.234 -0.163 -0.144 0.014 0.008 0.005 0.003 0.002 0.001 SRCL UW Equity STERICYCLE INC Industrials 111.45 14.11 15.22 15.82 16.38 -0.219 -0.262 -0.251 -0.156 0.004 0.007 0.007 0.003 SYK UN Equity STRYKER CORP Health Care 69.45 1.71% 27.09.2013 14.81 16.02 16.70 17.42 18.01 18.56 -0.504 -0.373 -0.293 -0.220 -0.183 -0.161 0.018 0.012 0.008 0.004 0.003 0.002 STI UN Equity SUNTRUST BANKS INC Financials 30.93 1.62% 30.08.2013 20.48 21.39 22.25 23.85 25.39 25.93 -0.462 -0.359 -0.291 -0.212 -0.165 -0.148 0.017 0.012 0.009 0.004 0.001 0.001 SYMC UW Equity SYMANTEC CORP Information Technology 24.51 0.61% 20.79 20.72 21.57 23.66 25.35 26.55 -0.197 -0.210 -0.202 -0.138 -0.104 -0.097 0.023 0.015 0.009 0.004 0.002 0.001 SYY UN Equity SYSCO CORP Consumer Staples 35.08 3.25% 03.07.2013 12.99 13.56 13.75 14.00 14.54 15.23 -0.218 -0.293 -0.304 -0.248 -0.201 -0.165 0.004 0.008 0.009 0.006 0.004 0.002 TROW UW Equity T ROWE PRICE GROUP INC Financials 76.83 2.03% 13.09.2013 18.08 18.05 18.61 -0.283 -0.364 -0.355 0.008 0.010 0.008 TGT UN Equity TARGET CORP Consumer Discretionary 69.96 2.36% 16.08.2013 17.95 16.86 16.64 17.24 18.08 18.36 -0.412 -0.344 -0.291 -0.213 -0.163 -0.148 0.016 0.011 0.008 0.005 0.003 0.002 TEL UN Equity TE CONNECTIVITY LTD Information Technology 44.90 2.23% 31.05.2013 18.24 18.31 18.92 -0.152 -0.154 -0.165 0.003 0.002 0.002 TE UN Equity TECO ENERGY INC Utilities 18.75 4.75% 14.08.2013 15.02 15.02 15.02 13.70 0.000 0.000 0.000 -0.245 0.000 0.000 0.000 0.006 THC UN Equity TENET HEALTHCARE CORP Health Care 47.17 33.26 34.91 35.77 36.33 -0.253 -0.217 -0.194 -0.156 0.007 0.005 0.003 0.002 TDC UN Equity TERADATA CORP Information Technology 53.69 29.53 29.37 30.21 32.10 32.78 33.26 -0.232 -0.162 -0.143 -0.131 -0.080 -0.074 0.007 0.006 0.004 0.002 0.001 0.001 TER UN Equity TERADYNE INC Information Technology 17.45 28.20 28.51 29.75 32.20 33.79 35.12 -0.146 -0.179 -0.185 -0.176 -0.161 -0.138 0.003 0.005 0.004 0.001 0.001 0.001 TSO UN Equity TESORO CORP Energy 57.46 1.48% 28.08.2013 44.49 43.26 42.61 42.25 41.55 41.09 -0.032 -0.070 -0.093 -0.102 -0.097 -0.099 0.005 0.003 0.002 0.001 0.001 0.001 TXN UW Equity TEXAS INSTRUMENTS INC Information Technology 36.62 3.17% 31.07.2013 19.94 20.22 20.82 22.07 23.50 24.57 -0.390 -0.302 -0.244 -0.176 -0.135 -0.121 0.013 0.010 0.007 0.004 0.002 0.001 TXT UN Equity TEXTRON INC Industrials 27.39 0.29% 11.09.2013 27.76 28.47 28.97 29.82 30.96 32.22 -0.316 -0.267 -0.237 -0.199 -0.152 -0.133 0.012 0.007 0.005 0.003 0.001 0.001 TMO UN Equity THERMO FISHER SCIENTIFIC INC Health Care 85.00 0.75% 13.06.2013 19.35 21.30 22.61 24.75 -0.322 -0.280 -0.254 -0.213 0.010 0.009 0.007 0.004 TIF UN Equity TIFFANY & CO Consumer Discretionary 76.64 1.93% 20.06.2013 29.56 26.91 25.91 27.18 27.98 28.24 -0.302 -0.259 -0.230 -0.174 -0.146 -0.122 0.008 0.007 0.006 0.002 0.002 0.001 TWC UN Equity TIME WARNER CABLE Consumer Discretionary 98.34 2.73% 29.05.2013 15.29 15.27 16.31 19.23 21.31 21.61 -0.241 -0.308 -0.281 -0.177 -0.132 -0.123 0.007 0.010 0.008 0.004 0.001 0.001 TWX UN Equity TIME WARNER INC Consumer Discretionary 60.95 1.94% 28.08.2013 18.05 17.96 18.74 20.66 21.92 22.59 -0.425 -0.304 -0.231 -0.170 -0.149 -0.137 0.017 0.012 0.009 0.004 0.002 0.001 TJX UN Equity TJX COMPANIES INC Consumer Discretionary 51.64 1.16% 06.08.2013 18.99 17.69 17.64 18.81 20.11 21.16 -0.293 -0.324 -0.281 -0.191 -0.171 -0.153 0.007 0.010 0.009 0.004 0.002 0.001 TMK UN Equity TORCHMARK CORP Financials 65.05 1.05% 02.10.2013 14.03 14.77 15.32 16.48 -0.158 -0.173 -0.186 -0.213 0.003 0.005 0.006 0.005 TSS UN Equity TOTAL SYSTEM SERVICES INC Information Technology 24.01 1.67% 11.06.2013 18.42 18.71 18.87 18.58 -0.098 -0.058 -0.062 -0.164 0.001 0.000 0.000 0.005 TRV UN Equity TRAVELERS COS INC/THE Financials 87.41 2.32% 06.09.2013 13.74 14.85 15.36 15.89 17.01 17.76 -0.224 -0.302 -0.278 -0.207 -0.180 -0.158 0.005 0.009 0.008 0.004 0.002 0.001 TRIP UW Equity TRIPADVISOR INC Consumer Discretionary 59.65 31.70 33.76 34.95 36.36 36.81 37.36 -0.100 -0.150 -0.167 -0.143 -0.100 -0.093 0.006 0.004 0.003 0.001 0.001 0.001 TYC UN Equity TYCO INTERNATIONAL LTD Industrials 34.00 1.94% 16.10.2013 20.40 20.60 21.16 22.16 23.05 24.05 -0.317 -0.273 -0.238 -0.196 -0.175 -0.149 0.013 0.011 0.008 0.003 0.001 0.001 TSN UN Equity TYSON FOODS INC-CL A Consumer Staples 25.06 0.80% 29.11.2013 21.73 21.43 22.62 23.76 24.39 25.34 -0.204 -0.254 -0.221 -0.135 -0.107 -0.088 0.003 0.009 0.007 0.004 0.002 0.001 UNP UN Equity UNION PACIFIC CORP Industrials 157.12 1.87% 29.05.2013 17.75 18.64 19.28 20.05 21.42 22.67 -0.389 -0.294 -0.245 -0.202 -0.162 -0.148 0.015 0.010 0.008 0.004 0.002 0.001 UPS UN Equity UNITED PARCEL SERVICE-CL B Industrials 88.58 2.17% 22.08.2013 13.34 13.68 13.93 14.43 15.36 15.75 -0.220 -0.250 -0.234 -0.167 -0.147 -0.143 0.012 0.011 0.009 0.007 0.004 0.002 X UN Equity UNITED STATES STEEL CORP Materials 18.05 1.11% 05.08.2013 39.76 38.97 38.65 38.68 39.71 40.78 -0.149 -0.191 -0.193 -0.148 -0.094 -0.101 0.009 0.008 0.006 0.003 0.002 0.001 UTX UN Equity UNITED TECHNOLOGIES CORP Industrials 95.13 2.49% 14.08.2013 13.47 15.05 15.83 17.22 19.14 20.48 -0.377 -0.329 -0.285 -0.230 -0.181 -0.160 0.013 0.011 0.009 0.006 0.004 0.002 UNH UN Equity UNITEDHEALTH GROUP INC Health Care 61.45 1.63% 14.06.2013 17.90 18.88 19.61 20.97 23.11 24.18 -0.223 -0.199 -0.181 -0.150 -0.116 -0.104 0.012 0.009 0.007 0.004 0.002 0.002 UNM UN Equity UNUM GROUP Financials 28.81 2.15% 01.08.2013 20.67 21.42 21.99 22.91 -0.309 -0.303 -0.294 -0.256 0.009 0.008 0.007 0.004 URBN UW Equity URBAN OUTFITTERS INC Consumer Discretionary 44.19 33.93 32.80 32.17 31.85 31.15 31.40 -0.294 -0.233 -0.197 -0.172 -0.143 -0.122 0.007 0.004 0.003 0.002 0.002 0.001 USB UN Equity US BANCORP Financials 34.24 2.80% 26.06.2013 13.19 14.49 15.11 16.41 18.18 19.11 -0.549 -0.428 -0.342 -0.243 -0.176 -0.149 0.020 0.014 0.011 0.006 0.004 0.003 VLO UN Equity VALERO ENERGY CORP Energy 39.95 2.00% 12.08.2013 33.14 34.29 34.95 35.73 36.05 37.37 -0.110 -0.099 -0.095 -0.085 -0.080 -0.074 0.011 0.006 0.004 0.002 0.001 0.001 VAR UN Equity VARIAN MEDICAL SYSTEMS INC Health Care 69.81 18.49 22.03 23.41 23.50 -0.291 -0.240 -0.213 -0.182 0.009 0.006 0.004 0.002 VTR UN Equity VENTAS INC Financials 80.94 3.37% 05.06.2013 13.90 14.39 14.97 16.13 -0.115 -0.217 -0.247 -0.195 0.002 0.006 0.007 0.005 VRSN UW Equity VERISIGN INC Information Technology 49.51 21.29 21.68 23.21 25.58 26.16 26.41 -0.207 -0.200 -0.154 -0.101 -0.080 -0.083 0.016 0.010 0.006 0.002 0.001 0.001 VZ UN Equity VERIZON COMMUNICATIONS INC Telecommunication Services 53.04 3.95% 10.07.2013 15.57 16.62 16.80 16.87 17.96 19.09 -0.358 -0.261 -0.191 -0.146 -0.111 -0.104 0.015 0.011 0.010 0.006 0.003 0.002 VFC UN Equity VF CORP Consumer Discretionary 185.72 2.01% 13.09.2013 17.93 19.76 20.79 21.64 -0.305 -0.260 -0.232 -0.182 0.009 0.008 0.007 0.004 VIAB UW Equity VIACOM INC-CLASS B Consumer Discretionary 69.14 1.74% 14.06.2013 22.17 22.25 22.50 23.41 25.93 27.29 -0.202 -0.184 -0.173 -0.168 -0.117 -0.100 0.008 0.007 0.006 0.003 0.001 0.001 V UN Equity VISA INC-CLASS A SHARES Information Technology 180.94 0.80% 14.08.2013 19.27 19.89 20.28 21.07 21.91 22.92 -0.288 -0.261 -0.235 -0.198 -0.174 -0.144 0.017 0.010 0.007 0.003 0.003 0.002 VNO UN Equity VORNADO REALTY TRUST Financials 87.19 3.46% 07.08.2013 15.74 15.86 16.06 16.77 -0.217 -0.253 -0.261 -0.228 0.004 0.006 0.006 0.004 VMC UN Equity VULCAN MATERIALS CO Materials 54.63 0.07% 27.08.2013 26.90 27.78 28.34 29.05 -0.392 -0.326 -0.278 -0.206 0.013 0.009 0.006 0.002 WMT UN Equity WAL-MART STORES INC Consumer Staples 79.66 2.46% 05.03.2014 15.50 14.32 14.38 15.31 16.09 17.11 -0.458 -0.343 -0.254 -0.179 -0.149 -0.125 0.015 0.012 0.010 0.006 0.004 0.002 WAG UN Equity WALGREEN CO Consumer Staples 50.26 2.28% 19.08.2013 20.17 22.84 23.37 23.26 23.76 24.24 -0.449 -0.337 -0.270 -0.216 -0.175 -0.148 0.018 0.016 0.012 0.005 0.002 0.001 DIS UN Equity WALT DISNEY CO/THE Consumer Discretionary 67.43 1.33% 11.12.2013 18.58 18.81 19.53 20.98 22.33 23.70 -0.323 -0.233 -0.192 -0.171 -0.133 -0.112 0.015 0.011 0.008 0.004 0.002 0.002 WPO UN Equity WASHINGTON POST-CLASS B Consumer Discretionary 452.00 1.13% 23.01.2014 WM UN Equity WASTE MANAGEMENT INC Industrials 41.77 3.56% 06.09.2013 13.32 13.70 14.14 14.78 15.37 16.06 -0.123 -0.297 -0.274 -0.179 -0.155 -0.127 0.002 0.010 0.010 0.005 0.003 0.002 WAT UN Equity WATERS CORP Health Care 98.39 16.84 19.79 21.01 21.26 -0.314 -0.257 -0.235 -0.221 0.008 0.009 0.008 0.004 WLP UN Equity WELLPOINT INC Health Care 77.84 1.78% 05.06.2013 18.38 19.23 19.92 21.40 22.29 23.12 -0.438 -0.318 -0.248 -0.185 -0.146 -0.127 0.015 0.011 0.008 0.004 0.001 0.001 WFC UN Equity WELLS FARGO & CO Financials 38.93 3.08% 07.08.2013 15.00 16.61 17.17 17.66 19.33 20.41 -0.449 -0.373 -0.311 -0.217 -0.159 -0.131 0.016 0.013 0.010 0.006 0.003 0.002 WDC UW Equity WESTERN DIGITAL CORP Information Technology 59.57 1.78% 26.06.2013 29.83 30.59 32.08 34.31 34.33 34.52 -0.252 -0.240 -0.219 -0.167 -0.131 -0.131 0.011 0.006 0.004 0.002 0.001 0.001 WU UN Equity WESTERN UNION CO Information Technology 16.45 3.22% 13.06.2013 21.31 23.51 24.43 24.25 24.32 25.20 -0.168 -0.180 -0.177 -0.150 -0.130 -0.109 0.003 0.009 0.010 0.004 0.003 0.002 WY UN Equity WEYERHAEUSER CO Financials 32.16 2.86% 28.08.2013 23.41 23.86 24.27 24.82 25.41 26.11 -0.342 -0.333 -0.288 -0.201 -0.157 -0.135 0.011 0.011 0.008 0.004 0.002 0.002 WHR UN Equity WHIRLPOOL CORP Consumer Discretionary 128.22 1.95% 28.08.2013 27.54 29.63 30.58 31.19 30.82 31.87 -0.216 -0.190 -0.164 -0.132 -0.105 -0.097 0.008 0.005 0.003 0.002 0.001 0.001 WFM UW Equity WHOLE FOODS MARKET INC Consumer Staples 103.32 0.87% 26.06.2013 21.69 25.07 26.53 26.96 26.82 27.42 -0.320 -0.224 -0.178 -0.153 -0.131 -0.116 0.013 0.008 0.005 0.002 0.001 0.001 WMB UN Equity WILLIAMS COS INC Energy 36.42 4.17% 05.06.2013 21.24 22.48 24.39 25.54 26.45 27.41 -0.150 -0.116 -0.122 -0.116 -0.101 -0.080 0.020 0.010 0.005 0.002 0.001 0.001 WIN UW Equity WINDSTREAM CORP Telecommunication Services 8.49 11.79% 27.09.2013 24.60 25.58 25.66 24.15 24.25 23.93 0.040 -0.064 -0.071 -0.091 -0.032 0.002 0.000 0.007 0.009 0.006 0.004 0.004 WEC UN Equity WISCONSIN ENERGY CORP Utilities 43.37 3.30% 12.08.2013 13.25 13.26 13.30 -0.152 -0.152 -0.119 0.001 0.001 0.001 WPX UN Equity WPX ENERGY INC Energy 17.99 36.97 36.59 36.60 37.54 -0.071 -0.048 -0.034 -0.011 0.006 0.006 0.005 0.001 GWW UN Equity WW GRAINGER INC Industrials 260.97 1.43% 15.08.2013 17.98 19.86 20.61 -0.378 -0.310 -0.264 0.012 0.007 0.005 WYN UN Equity WYNDHAM WORLDWIDE CORP Consumer Discretionary 63.51 1.91% 20.08.2013 21.84 22.71 23.19 23.38 -0.130 -0.220 -0.241 -0.167 0.006 0.009 0.009 0.004 WYNN UW Equity WYNN RESORTS LTD Consumer Discretionary 141.52 2.19% 31.07.2013 23.91 24.93 25.45 25.82 25.98 25.98 -0.284 -0.217 -0.171 -0.116 -0.042 -0.042 0.012 0.007 0.004 0.002 0.001 0.001 XEL UN Equity XCEL ENERGY INC Utilities 30.32 3.69% 18.06.2013 12.64 13.21 13.38 14.17 0.000 -0.368 -0.445 -0.181 0.000 0.009 0.012 0.006 XRX UN Equity XEROX CORP Information Technology 8.97 2.56% 28.06.2013 22.65 24.54 25.61 27.13 29.32 30.63 -0.061 -0.195 -0.183 -0.120 -0.118 -0.108 0.005 0.009 0.007 0.003 0.002 0.002 XLNX UW Equity XILINX INC Information Technology 38.71 2.66% 05.08.2013 19.00 20.67 21.49 22.02 22.73 24.00 -0.390 -0.290 -0.230 -0.177 -0.140 -0.125 0.014 0.009 0.006 0.004 0.002 0.001 XL UN Equity XL GROUP PLC Financials 32.65 1.72% 11.09.2013 16.48 16.84 17.82 19.77 -0.441 -0.358 -0.300 -0.232 0.015 0.011 0.008 0.004 XYL UN Equity XYLEM INC Industrials 28.59 1.64% 05.09.2013 21.04 20.96 20.65 -0.146 -0.146 -0.071 0.002 0.002 0.005 YHOO UW Equity YAHOO! INC Information Technology 27.56 25.44 28.16 28.51 27.96 29.12 30.22 -0.070 -0.143 -0.129 -0.069 -0.046 -0.036 0.013 0.010 0.007 0.003 0.002 0.001 YUM UN Equity YUM! BRANDS INC Consumer Discretionary 70.44 2.12% 10.07.2013 20.88 23.02 23.52 23.15 23.48 24.69 -0.392 -0.301 -0.244 -0.173 -0.121 -0.104 0.012 0.007 0.005 0.003 0.002 0.001 ZMH UN Equity ZIMMER HOLDINGS INC Health Care 80.76 1.02% 25.06.2013 15.28 16.62 17.34 18.14 -0.172 -0.208 -0.222 -0.217 0.003 0.006 0.006 0.004 ZION UW Equity ZIONS BANCORPORATION Financials 27.05 0.59% 23.08.2013 19.46 19.13 19.94 22.51 24.56 25.23 -0.375 -0.358 -0.316 -0.230 -0.184 -0.163 0.012 0.010 0.007 0.003 0.001 0.001 S&P500Index At The Money Implied Volatilities by Terms Option Implied Volatility Skew Parameters by Terms: IVt = atx + btx2 + ct Q.M.S Advisors | tel: +41 (0)78 922 08 77 | e-mail: info@qmsadv.com |