Financial Analysis - Swiss Re AG - Swiss Re AG offers reinsurance, insurance and insurance linked financial market products. The Company offers automobile, liability, accident, engineering, marine, aviation, life, and health insurance
•
1 gostou•1,156 visualizações

Financial Analysis - Swiss Re AG - Swiss Re AG offers reinsurance, insurance and insurance linked financial market products. The Company offers automobile, liability, accident, engineering, marine, aviation, life, and health insurance

Recomendados
Recomendados
Mais conteúdo relacionado
Mais de BCV
Mais de BCV (20)
Último
Último (20)
Financial Analysis - Swiss Re AG - Swiss Re AG offers reinsurance, insurance and insurance linked financial market products. The Company offers automobile, liability, accident, engineering, marine, aviation, life, and health insurance
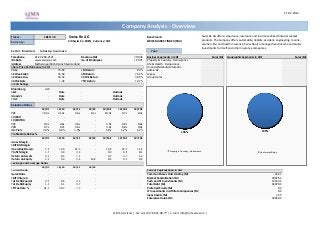
- 1. 21.02.2013 Company Analysis - Overview Ticker: SREN VX Swiss Re AG Benchmark: Swiss Re AG offers reinsurance, insurance and insurance linked financial market SIX Swiss Ex: SREN, Currency: CHF SWISS MARKET INDEX (SMI) products. The Company offers automobile, liability, accident, engineering, marine, Currency: aviation, life, and health insurance. Swiss Re also manages fixed-income and equity investments for itself and other insurance companies. Sector: Financials Industry: Insurance Year: Telephone 41-43-285-2121 Revenue (M) 24'646 Business Segments in CHF Sales (M) Geographic Segments in CHF Sales (M) Website www.swissre.com No of Employees 11'071 Property & Casualty - Reinsurance 1 Unallocated Sales 1 Address Mythenquai 50/60 Zurich Switzerland Life & Health - Reinsurance Share Price Performance in CHF Financial Markets/Allocation Price 75.60 1M Return 9.3% Admin Re 52 Week High 76.60 6M Return 23.2% Legacy 52 Week Low 50.33 52 Wk Return 46.5% Group Items 52 Wk Beta 1.03 YTD Return 14.7% Credit Ratings Bloomberg IG9 S&P - Date - Outlook - Moody's - Date - Outlook - Fitch - Date - Outlook - Valuation Ratios 12/09 12/10 12/11 12/12 12/13E 12/14E 12/15E P/E 33.4x 21.3x 6.6x 6.1x 10.0x 9.7x 9.3x EV/EBIT - - - - - - - EV/EBITDA - - - - - - - P/S 0.5x 0.6x 0.6x - 0.9x 0.9x 0.8x P/B 0.7x 0.7x 0.6x - 0.9x 0.8x 0.8x Div Yield 2.0% 4.9% 5.9% - 5.1% 5.2% 5.2% 100% 100% Profitability Ratios % 12/09 12/10 12/11 12/12 12/13E 12/14E 12/15E Gross Margin - - - - - - - EBITDA Margin - - - - - - - Operating Margin 5.5 12.0 12.4 - 12.8 12.1 11.6 Property & Casualty - Reinsurance Profit Margin 1.5 3.0 9.4 - 9.0 8.6 8.1 Unallocated Sales Return on Assets 0.2 0.4 1.2 - 3.3 3.3 1.2 Return on Equity 2.2 3.4 9.6 13.2 8.4 8.9 9.0 Leverage and Coverage Ratios 12/09 12/10 12/11 12/12 Current Ratio - - - - Current Capitalization in CHF Quick Ratio - - - - Common Shares Outstanding (M) 342.7 EBIT/Interest - - - - Market Capitalization (M) 28025.4 Tot Debt/Capital 0.5 0.5 0.4 - Cash and ST Investments (M) 12163.1 Tot Debt/Equity 1.1 1.1 0.7 - Total Debt (M) 18070.0 Eff Tax Rate % 31.3 34.7 2.7 - Preferred Equity (M) 0.0 LT Investments in Affiliate Companies (M) 0.0 Investments (M) 22.5 Enterprise Value (M) 33954.9 Q.M.S Advisors | tel: +41 (0)78 922 08 77 | e-mail: info@qmsadv.com |
- 2. Company Analysis - Analysts Ratings Swiss Re AG Target price in CHF Broker Recommendation Buy and Sell Recommendations vs Price and Target Price Price Brokers' Target Price 80 100 100% 90 18% 22% 22% 21% 21% 18% 70 80 23% 23% 23% 26% 24% 27% 70 80% 60 60 50 50 40 60% 43% 30 44% 44% 44% 45% 48% 54% 46% 42% 41% 41% 20 51% 40 10 0 40% 30 Day by Day Bryan Garnier & Cie Morgan Stanley Bankhaus Metzler Barclays Canaccord Genuity Corp Main First Bank AG Kepler Capital Markets RBC Capital Markets Espirito Santo Investment Bank S&P Capital IQ Raymond James CA Cheuvreux Macquarie Credit Suisse Helvea Oddo & Cie JPMorgan Exane BNP Paribas Sanford C. Bernstein & Co Nord/LB Societe Generale Nomura DZ Bank AG Bank Vontobel AG Mediobanca SpA HSBC EVA Dimensions Berenberg Bank AlphaValue Goldman Sachs Hamburger Sparkasse Zuercher Kantonalbank Keefe, Bruyette & Woods Landesbank Baden- 20 20% 40% 36% 35% 34% 34% 30% 34% 31% 32% 32% 28% 26% 10 0% 0 févr.12 mars.12 avr.12 mai.12 juin.12 juil.12 août.12 sept.12 oct.12 nov.12 déc.12 janv.13 Buy Hold Sell Price Target Price Date Buy Hold Sell Date Price Target Price Broker Analyst Recommendation Target Date 31-Jan-13 32% 41% 27% 21-Feb-13 75.55 71.93 Societe Generale JASON KALAMBOUSSIS buy 75.00 21-Feb-13 31-Dec-12 35% 41% 24% 20-Feb-13 73.80 71.93 Bryan Garnier & Cie OLIVIER PAUCHAUT sell 70.00 21-Feb-13 30-Nov-12 32% 42% 26% 19-Feb-13 73.35 71.93 Bankhaus Metzler JOCHEN SCHMITT buy 78.00 19-Feb-13 31-Oct-12 31% 46% 23% 18-Feb-13 73.15 71.80 Main First Bank AG RENE LOCHER underperform 72.00 19-Feb-13 28-Sep-12 26% 51% 23% 15-Feb-13 72.90 71.16 CA Cheuvreux FRANK KOPFINGER select list 86.00 18-Feb-13 31-Aug-12 28% 54% 18% 14-Feb-13 73.80 71.16 Credit Suisse ADAM MCINALLY neutral 67.50 15-Feb-13 31-Jul-12 34% 45% 21% 13-Feb-13 73.00 71.16 Berenberg Bank TOM CARSTAIRS sell 66.10 15-Feb-13 29-Jun-12 36% 44% 21% 12-Feb-13 72.05 71.16 Day by Day VALERIE GASTALDY hold 14-Feb-13 31-May-12 30% 48% 23% 11-Feb-13 71.35 71.16 AlphaValue DIETER HEIN sell 63.40 14-Feb-13 30-Apr-12 34% 44% 22% 8-Feb-13 70.35 71.40 Helvea DANIEL BISCHOF neutral 70.00 13-Feb-13 30-Mar-12 34% 44% 22% 7-Feb-13 69.65 71.40 Keefe, Bruyette & Woods WILLIAM HAWKINS market perform 79.00 12-Feb-13 29-Feb-12 40% 43% 18% 6-Feb-13 70.75 71.40 Nomura MICHAEL KLIEN reduce 60.00 12-Feb-13 5-Feb-13 70.50 71.26 Zuercher Kantonalbank GEORG MARTI market perform 6-Feb-13 4-Feb-13 67.75 70.89 Bank Vontobel AG STEFAN SCHUERMANN buy 80.00 6-Feb-13 1-Feb-13 68.20 70.89 Kepler Capital Markets FABRIZIO CROCE buy 83.00 5-Feb-13 31-Jan-13 67.75 70.89 Oddo & Cie NICOLAS JACOB buy 78.00 4-Feb-13 30-Jan-13 68.00 70.89 Barclays ANDREW BROADFIELD overweight 77.89 4-Feb-13 29-Jan-13 69.10 71.03 JPMorgan MICHAEL HUTTNER overweight 71.00 31-Jan-13 28-Jan-13 69.45 71.03 Mediobanca SpA GIANLUCA FERRARI neutral 75.00 30-Jan-13 25-Jan-13 70.00 70.89 RBC Capital Markets GORDON AITKEN sector perform 66.00 28-Jan-13 24-Jan-13 69.80 70.89 Exane BNP Paribas NICCOLO DALLA PALMA neutral 67.00 28-Jan-13 23-Jan-13 69.40 70.75 Goldman Sachs VINIT MALHOTRA Sell/Neutral 67.00 18-Jan-13 22-Jan-13 68.90 70.75 EVA Dimensions AUSTIN BURKETT buy 17-Jan-13 21-Jan-13 69.15 70.75 HSBC THOMAS FOSSARD neutral 75.00 16-Jan-13 18-Jan-13 69.85 70.75 Canaccord Genuity Corp BEN COHEN buy 70.00 9-Jan-13 17-Jan-13 71.05 70.68 Sanford C. Bernstein & Co THOMAS SEIDL underperform 50.00 13-Dec-12 16-Jan-13 69.65 70.68 S&P Capital IQ RODERICK WALLACE hold 78.00 30-Nov-12 15-Jan-13 69.50 70.51 Macquarie HADLEY COHEN neutral 72.00 27-Nov-12 14-Jan-13 68.90 69.89 Morgan Stanley MACIEJ WASILEWICZ Equalwt/In-Line 70.70 15-Nov-12 11-Jan-13 69.45 69.71 Hamburger Sparkasse CHRISTIAN HAMANN buy 14-Nov-12 Q.M.S Advisors | tel: +41 (0)78 922 08 77 | e-mail: info@qmsadv.com |
- 3. 21.02.2013 Swiss Re AG Company Analysis - Ownership Ownership Type Ownership Statistics Geographic Ownership Distribution Geographic Ownership 0% Shares Outstanding (M) 342.7 United States 54.59% Float 99.9% Britain 20.42% 1% 1% 1% 3% Short Interest (M) Luxembourg 10.90% 9% Short Interest as % of Float Switzerland 9.40% 43% Days to Cover Shorts Canada 0.69% Institutional Ownership 43.20% Germany 0.68% 11% 57% 54% Retail Ownership 56.67% Ireland 0.67% Insider Ownership 0.13% Others 2.66% Institutional Ownership Distribution 20% Investment Advisor 72.24% Unclassified 16.99% Mutual Fund Manager 10.04% Institutional Ownership Retail Ownership Insider Ownership Insurance Company 0.43% United States Britain Luxembourg Switzerland Pricing data is in CHF Others 0.31% Canada Germany Ireland Others Top 20 Owners: TOP 20 ALL Institutional Ownership Holder Name Position Position Change Market Value % of Ownership Report Date Source Country SWISS RE 27'282'124 -1'396'672 2'062'528'574 7.36% 29.03.2012 EXCH BRITAIN 0% 0% FRANKLIN RESOURCES 19'016'988 -465'989 1'437'684'293 5.13% 31.12.2012 ULT-AGG UNITED STATES 10% BLACKROCK 15'114'719 763'755 1'142'672'756 4.08% 19.02.2013 ULT-AGG UNITED STATES VANGUARD GROUP INC 13'188'586 -222'639 997'057'102 3.56% 31.12.2012 MF-AGG UNITED STATES DODGE & COX 12'639'368 0 955'536'221 3.41% 31.12.2011 Co File UNITED STATES MFS INVESTMENT MANAG 11'485'890 0 868'333'284 3.10% 31.12.2011 Co File LUXEMBOURG 17% BERKSHIRE HATHAWAY I 11'262'000 0 851'407'200 3.04% 31.12.2011 ULT-AGG UNITED STATES CREDIT SUISSE ASSET 5'610'148 -9'893 424'127'189 1.51% 28.12.2012 MF-AGG SWITZERLAND MASSACHUSETTS FINANC 5'482'330 154'354 414'464'148 1.48% 31.12.2012 MF-AGG UNITED STATES 73% UBS FUND MANAGEMENT 2'870'923 -16'783 217'041'779 0.77% 31.10.2012 MF-AGG SWITZERLAND PICTET & CIE 2'181'639 -8'205 164'931'908 0.59% 31.10.2012 MF-AGG SWITZERLAND SARASIN 1'986'440 4'568 150'174'864 0.54% 28.12.2012 ULT-AGG SWISSCANTO FONDSLEIT 1'464'844 -33'255 110'742'206 0.40% 30.11.2012 MF-AGG SWITZERLAND TEMPLETON INVESTMENT 1'299'889 -264'683 98'271'608 0.35% 30.11.2012 MF-AGG BRITAIN Investment Advisor Unclassified Mutual Fund Manager Insurance Company Others DIMENSIONAL FUND ADV 1'238'106 0 93'600'814 0.33% 30.04.2012 MF-AGG UNITED STATES JP MORGAN 1'214'600 -801 91'823'760 0.33% 31.12.2012 ULT-AGG HARTFORD INVESTMENT 1'102'833 -174'506 83'374'175 0.30% 31.12.2012 MF-AGG UNITED STATES FMR LLC 833'022 -181'060 62'976'463 0.22% 31.12.2012 ULT-AGG UNITED STATES BESSEMER GROUP INCOR 819'676 145'000 61'967'506 0.22% 31.10.2012 MF-AGG UNITED STATES VONTOBEL ASSET MANAG 635'477 -6'100 48'042'061 0.17% 31.10.2012 MF-AGG SWITZERLAND Top 5 Insiders: Holder Name Position Position Change Market Value % of Ownership Report Date Source KIELHOLZ WALTER B 185'000 13'986'000 0.05% 31.12.2011 Co File COOMBER JOHN R 134'707 10'183'849 0.04% 31.12.2011 Co File BAER JAKOB 34'922 2'640'103 0.01% 31.12.2011 Co File BREU RAYMUND 31'789 2'403'248 0.01% 31.12.2011 Co File SCOTT ROBERT AVISSON 24'096 1'821'658 0.01% 31.12.2011 Co File Q.M.S Advisors | tel: +41 (0)78 922 08 77 | e-mail: info@qmsadv.com |
- 4. Company Analysis - Financials I/IV Swiss Re AG Financial information is in CHF (M) Equivalent Estimates Periodicity: Fiscal Year 12/02 12/03 12/04 12/05 12/06 12/07 12/08 12/09 12/10 12/11 12/12 12/13E 12/14E 12/15E Income Statement Revenue 34'347 36'469 36'070 37'592 39'877 42'464 25'922 33'155 29'688 24'646 29'457 31'691 34'977 - Cost of Goods Sold Gross Income - Selling, General & Admin Expenses 3'590 3'257 3'217 3'081 4'111 4'077 3'211 3'198 2'633 2'705 (Research & Dev Costs) Operating Income -32 2'375 3'344 2'139 5'467 6'591 1'095 1'820 3'562 3'050 3'762 3'824 4'072 - Interest Expense 0 0 0 1'814 1'501 1'311 2'304 755 - Foreign Exchange Losses (Gains) - Net Non-Operating Losses (Gains) -68 39 -23 -420 -389 -410 944 -228 -366 -254 Pretax Income 36 2'336 3'367 2'559 5'856 5'187 -1'350 737 1'624 2'549 3'701 3'932 4'094 - Income Tax Expense 127 634 892 255 1'296 1'025 -486 231 564 68 Income Before XO Items -91 1'702 2'475 2'304 4'560 4'162 -864 506 1'060 2'481 - Extraordinary Loss Net of Tax 0 0 0 0 0 - Minority Interests 0 0 0 161 153 Diluted EPS Before XO Items 7.14 12.53 11.23 (2.61) 1.48 2.53 6.64 Net Income Adjusted* 2'328 3'939 2'637 2'723 2'841 EPS Adjusted 6.80 11.11 7.46 7.69 8.02 Dividends Per Share 1.00 1.10 1.60 2.50 3.40 4.00 0.10 1.00 2.75 2.66 3.84 3.88 3.93 Payout Ratio % 20.1 20.1 33.7 26.7 33.3 69.9 39.2 0.52 0.50 0.49 Total Shares Outstanding 321 321 321 310 358 347 336 343 343 343 Diluted Shares Outstanding 310 320 325 333 375 383 331 342 449 352 EBITDA *Net income excludes extraordinary gains and losses and one-time charges. Q.M.S Advisors | tel: +41 (0)78 922 08 77 | e-mail: info@qmsadv.com |
- 5. Company Analysis - Financials II/IV Periodicity: 12/02 12/03 12/04 12/05 12/06 12/07 12/08 12/09 12/10 12/11 12/12 12/13E 12/14E 12/15E Balance Sheet Total Current Assets + Cash & Near Cash Items 3'773 5'429 6'402 8'368 13'606 11'531 17'268 28'749 15'809 10'708 + Short Term Investments 3'356 7'339 5'514 98'340 125'213 168'389 123'201 112'563 106'136 108'619 + Accounts & Notes Receivable 38'116 39'189 32'365 39'251 49'418 44'917 37'059 35'348 31'905 31'505 + Inventories + Other Current Assets Total Long-Term Assets + Long Term Investments 86'591 88'095 98'506 130'601 172'507 227'812 163'965 156'449 146'573 152'280 Gross Fixed Assets Accumulated Depreciation 4'142 4'754 4'875 5'393 5'270 5'152 4'311 4'025 3'335 3'683 + Net Fixed Assets + Other Long Term Assets 29'098 32'121 42'344 37'686 50'499 17'875 17'274 16'033 15'684 13'877 Total Current Liabilities + Accounts Payable + Short Term Borrowings 1'331 1'207 693 1'015 1'917 12'658 6'522 8'378 10'084 3'874 + Other Short Term Liabilities 30'079 33'985 33'559 43'683 57'072 47'992 33'379 28'543 21'977 23'193 Total Long Term Liabilities + Long Term Borrowings 5'663 4'807 5'296 5'852 7'973 23'337 20'453 19'831 17'209 15'527 + Other Long Term Borrowings 1'423 4'013 14'645 2'838 2'685 3'817 1'329 959 1'603 2'678 Total Liabilities 145'171 151'187 165'315 196'906 260'416 275'420 219'424 214'403 188'178 182'682 + Long Preferred Equity 0 0 0 0 + Minority Interest 0 0 0 1'461 1'593 + Share Capital & APIC 6'001 5'853 5'865 6'884 11'173 11'245 10'812 11'193 9'867 8'467 + Retained Earnings & Other Equity 10'548 12'548 13'312 17'509 19'711 20'622 9'641 15'008 13'800 19'309 31'098 Total Shareholders Equity 16'549 18'401 19'177 24'393 30'884 31'867 20'453 26'201 25'128 29'369 31'098 Total Liabilities & Equity 161'720 169'588 184'492 221'299 291'300 307'287 239'877 240'604 213'306 212'051 Book Value Per Share 51.52 57.36 59.72 78.58 86.21 91.92 60.93 76.45 69.08 81.04 86.98 90.17 97.54 Tangible Book Value Per Share 41.03 48.37 51.99 67.54 72.70 77.80 48.23 63.98 57.95 69.95 Q.M.S Advisors | tel: +41 (0)78 922 08 77 | e-mail: info@qmsadv.com |
- 6. Company Analysis - Financials III/IV Periodicity: 12/02 12/03 12/04 12/05 12/06 12/07 12/08 12/09 12/10 12/11 12/12 12/13E 12/14E 12/15E Cash Flows Net Income -91 1'702 2'475 2'304 4'560 4'162 -864 506 899 2'328 2'672 2'763 2'808 + Depreciation & Amortization 983 1'366 1'271 782 886 676 871 21 283 2'762 + Other Non-Cash Adjustments 645 3 -1'615 -3'379 210 13'393 -2'321 -4'187 -6'975 -1'571 + Changes in Non-Cash Capital -212 -1'412 2'628 2'265 -3'290 -19'977 -3'775 -4'506 -1'716 -2'192 Cash From Operating Activities 1'325 1'659 4'759 1'972 2'366 -1'746 -6'089 -8'166 -7'508 1'327 + Disposal of Fixed Assets 0 0 0 + Capital Expenditures 0 0 0 + Increase in Investments -96'798 -74'620 -47'595 -48'971 -60'347 -61'542 -83'727 -180'631 -134'343 -132'045 + Decrease in Investments 89'180 72'947 43'951 44'698 66'897 59'059 102'376 196'074 132'204 134'994 + Other Investing Activities 1'056 -50 -1'342 643 -3'506 1'615 170 103 71 Cash From Investing Activities -6'562 -1'723 -4'986 -3'630 3'044 -868 18'819 15'546 -2'139 3'020 + Dividends Paid -776 -310 -341 -497 -776 -1'162 -1'331 -34 -332 -918 + Change in Short Term Borrowings 747 -1'017 -965 -599 -380 2'057 -5'354 -1'383 -4'341 -7'972 + Increase in Long Term Borrowings 1'655 135 1'016 987 3'146 4'342 1'327 3'440 1'096 + Decrease in Long Term Borrowings 0 0 0 -29 + Increase in Capital Stocks 212 0 0 32 1'323 38 1 1 + Decrease in Capital Stocks 0 -148 -119 -63 -2'303 -1'553 -231 + Other Financing Activities -451 -92 -198 422 -2'610 -415 -83 2'077 717 -92 Cash From Financing Activities 2'964 1'720 1'200 345 640 2'557 -6'993 4'101 -2'860 -9'242 Net Changes in Cash -2'273 1'656 973 -1'313 6'050 -57 5'737 11'481 -12'506 -4'895 Free Cash Flow (CFO-CAPEX) 1'325 1'659 4'759 Free Cash Flow To Firm 1'325 1'659 4'759 Free Cash Flow To Equity 3'727 777 4'810 Free Cash Flow per Share 4.27 5.35 15.39 Q.M.S Advisors | tel: +41 (0)78 922 08 77 | e-mail: info@qmsadv.com |
- 7. Company Analysis - Financials IV/IV Periodicity: 12/02 12/03 12/04 12/05 12/06 12/07 12/08 12/09 12/10 12/11 12/12 12/13E 12/14E 12/15E Ratio Analysis Valuation Ratios Price Earnings 15.2x 10.2x 12.9x 7.7x 6.8x 33.4x 21.3x 6.6x 6.1x 10.1x 9.8x 9.4x EV to EBIT EV to EBITDA Price to Sales 0.8x 0.7x 0.7x 0.8x 0.9x 0.7x 0.6x 0.5x 0.6x 0.6x 0.9x 0.9x 0.8x Price to Book 1.8x 1.5x 1.4x 1.2x 1.2x 0.9x 0.8x 0.7x 0.7x 0.6x 0.9x 0.8x 0.8x Dividend Yield 1.1% 1.3% 2.0% 2.6% 3.3% 4.9% 0.2% 2.0% 4.9% 5.9% 5.1% 5.2% 5.2% Profitability Ratios Gross Margin EBITDA Margin - - - Operating Margin -0.1% 6.5% 9.3% 5.7% 13.7% 15.5% 4.2% 5.5% 12.0% 12.4% 12.8% 12.1% 11.6% Profit Margin -0.3% 4.7% 6.9% 6.1% 11.4% 9.8% -3.3% 1.5% 3.0% 9.4% 9.0% 8.6% 8.1% Return on Assets -0.1% 1.0% 1.4% 1.1% 1.8% 1.4% -0.3% 0.2% 0.4% 1.2% 3.3% 3.3% 1.2% Return on Equity -0.5% 9.7% 13.2% 10.6% 16.5% 13.3% -3.3% 2.2% 3.4% 9.6% 13.2% 8.4% 8.9% 9.0% Leverage & Coverage Ratios Current Ratio Quick Ratio Interest Coverage Ratio (EBIT/I) Tot Debt/Capital 0.30 0.25 0.24 0.22 0.24 0.53 0.57 0.52 0.52 0.40 Tot Debt/Equity 0.42 0.33 0.31 0.28 0.32 1.13 1.32 1.08 1.09 0.66 Others Asset Turnover 0.21 0.22 0.20 0.19 0.16 0.14 0.09 0.14 0.12 0.12 Accounts Receivable Turnover Accounts Payable Turnover Inventory Turnover Effective Tax Rate 352.8% 27.1% 26.5% 10.0% 22.1% 19.8% 31.3% 34.7% 2.7% Q.M.S Advisors | tel: +41 (0)78 922 08 77 | e-mail: info@qmsadv.com |
- 8. Company Analysis - Peers Comparision MUENCHENER HANNOVER RUE- REINSURANCE ARCH CAPITAL EVEREST RE ZURICH SWISS RE AG SCOR SE ALLIANZ SE-REG AXA XL GROUP PLC PARTNERRE LTD RENAISSANCERE SWISS LIFE H AG RUE-R REG GROU GRP GROUP INSURANCE Latest Fiscal Year: 12/2012 12/2012 12/2011 12/2011 12/2012 12/2012 12/2012 12/2012 12/2012 12/2012 12/2012 12/2012 12/2012 12/2011 52-Week High 76.60 139.75 60.60 22.24 108.65 13.98 28.91 61.86 91.24 87.38 49.98 123.26 264.00 148.00 52-Week High Date 21.02.2013 05.02.2013 03.01.2013 07.02.2013 02.01.2013 19.02.2013 19.02.2013 01.02.2013 07.02.2013 07.02.2013 12.02.2013 20.02.2013 28.01.2013 19.02.2013 52-Week Low 50.00 95.85 39.80 17.06 68.50 8.65 19.52 48.36 62.59 70.00 36.08 85.99 192.50 74.35 52-Week Low Date 22.02.2012 04.06.2012 06.03.2012 01.06.2012 04.06.2012 04.06.2012 05.06.2012 16.11.2012 07.03.2012 01.08.2012 23.03.2012 22.02.2012 05.06.2012 01.06.2012 Daily Volume 806'188 144'918 27'668 67'085 547'294 3'323'441 2'303'229 290'787 452'574 272'045 533'072 427'053 116'985 38'073 Current Price (2/dd/yy) 75.50 133.45 57.86 21.71 103.05 13.31 28.53 59.00 86.43 84.23 47.83 122.38 253.60 143.80 52-Week High % Change -1.4% -4.5% -4.5% -2.4% -5.2% -4.8% -1.3% -4.6% -5.3% -3.6% -4.3% -0.7% -3.9% -2.8% 52-Week Low % Change 51.0% 39.2% 45.4% 27.2% 50.4% 53.8% 46.2% 22.0% 38.1% 20.3% 32.6% 42.3% 31.7% 93.4% Total Common Shares (M) 342.7 177.6 120.6 184.7 452.5 2'374.0 298.7 73.9 58.9 45.5 133.8 51.4 147.0 31.9 Market Capitalization 27'988.4 23'933.1 6'977.8 4'166.9 46'985.6 31'785.6 8'522.8 4'361.7 5'229.0 4'056.2 6'401.7 6'292.5 37'608.9 4'613.3 Total Debt 20'668.0 5'562.0 1'934.4 1'425.0 28'411.0 16'693.0 1'672.8 2'467.3 821.0 351.8 400.0 818.2 12'521.0 2'624.0 Preferred Stock - - - - - 6'059.0 - - 893.8 400.0 325.0 - - - Minority Interest 1'697.0 247.0 636.0 7.0 2'338.0 2'371.0 1'346.3 - - 972.3 - - 2'368.0 35.0 Cash and Equivalents 11'407.0 2'490.0 507.0 1'281.0 10'492.0 31'072.0 2'618.4 1'259.9 1'121.7 325.4 371.0 537.1 9'098.0 5'084.0 Enterprise Value 36'375.5 27'506.1 8'917.1 4'595.9 65'617.6 26'630.6 8'923.6 5'569.1 5'822.0 5'454.9 6'755.7 6'573.6 46'202.2 2'282.3 Valuation Total Revenue LFY 27'797.0 60'908.0 12'125.7 7'405.0 106'400.0 118'423.0 7'172.0 9'840.9 5'562.6 1'377.5 3'408.9 4'922.8 70'446.0 17'291.0 LTM 33'328.0 66'138.0 13'374.4 8'524.0 96'790.0 118'423.0 7'172.0 9'840.9 5'562.6 1'377.5 3'408.9 4'922.8 70'446.0 18'137.0 CY+1 31'900.3 57'929.3 12'952.6 9'062.4 105'751.4 99'780.0 7'554.8 10'159.0 5'595.0 1'314.3 3'589.9 4'807.6 60'452.2 17'263.0 CY+2 34'319.4 61'480.0 13'582.2 9'570.5 108'336.4 101'989.9 7'764.8 10'723.0 5'951.2 1'350.0 3'778.6 4'955.8 62'644.9 17'277.9 EV/Total Revenue LFY 1.1x 0.4x 0.7x 0.6x 0.6x 0.2x 1.1x 0.5x 1.0x 3.7x 1.8x 1.2x 0.6x 0.0x LTM 0.9x 0.4x 0.6x 0.5x 0.6x 0.2x 1.1x 0.5x 1.0x 3.7x 1.8x 1.2x 0.6x 0.0x CY+1 1.3x 0.5x 0.7x 0.6x 0.5x 0.4x 1.3x 0.6x 1.0x 4.3x 1.9x - 0.9x 0.0x CY+2 - - 0.7x 0.6x 0.5x - 1.2x - 0.9x 4.2x 1.8x - - 0.0x EBITDA LFY - - - - - - - - - - - - - - LTM - - - - - - - - - - - - - - CY+1 - - - - - - - - - - - - - - CY+2 - - - - - - - - - - - - - - EV/EBITDA LFY - - - - - - - - - - - - - - LTM - - - - - - - - - - - - - - CY+1 - - - - - - - - - - - - - - CY+2 - - - - - - - - - - - - - - EPS LFY 7.49 3.94 5.02 1.77 11.42 1.81 1.98 6.96 10.57 7.93 3.07 13.62 26.48 19.21 LTM 12.22 17.99 7.42 2.71 11.42 1.71 1.97 6.96 10.55 7.84 3.06 13.58 26.46 17.66 CY+1 8.08 15.89 6.78 2.24 12.11 1.93 2.54 7.41 8.51 9.04 3.09 13.83 28.80 19.00 CY+2 8.33 16.25 6.61 2.54 12.65 2.08 2.75 8.07 8.04 9.61 3.19 15.00 30.39 18.10 P/E LFY 6.6x 7.4x 7.8x 8.0x 9.0x 7.8x 14.5x 8.5x 8.2x 10.7x 15.6x 9.0x 10.3x 8.1x LTM 6.7x 7.1x 7.8x 8.2x 9.0x 7.2x 14.5x 8.5x 8.2x 10.7x 15.6x 9.0x 10.3x 8.1x CY+1 10.0x 8.4x 8.5x 9.7x 8.5x 6.9x 11.2x 8.0x 10.2x 9.3x 15.5x 8.8x 9.5x 7.6x CY+2 9.7x 8.2x 8.7x 8.6x 8.1x 6.4x 10.4x 7.3x 10.8x 8.8x 15.0x 8.2x 9.0x 7.9x Revenue Growth 1 Year - - 6.2% 10.1% 21.8% 20.4% 7.5% 11.5% 3.9% 21.0% 10.9% 4.9% 33.0% (3.1%) 5 Year 11.9% 9.2% 15.6% 15.2% 3.7% 61.3% 2.0% 13.9% 4.9% 11.8% 2.4% 7.3% 11.8% (1.1%) EBITDA Growth 1 Year - - - - - - - - - - - - - - 5 Year - - - - - - - - - - - - - - EBITDA Margin LTM - - - - - - - - - - - - - - CY+1 - - - - - - - - - - - - - - CY+2 - - - - - - - - - - - - - - Leverage/Coverage Ratios Total Debt / Equity % 0.0% 0.0% 38.9% 32.4% 0.0% 0.0% 15.9% 35.7% 13.6% 11.3% 8.3% 12.2% 36.3% 28.7% FALSE Total Debt / Capital % 39.8% 19.3% 25.7% 24.4% 37.5% 24.7% 12.4% 26.3% 10.6% 7.3% 7.2% 10.8% 25.4% 22.3% FALSE Total Debt / EBITDA - - - - - - - - - - - - - - FALSE Net Debt / EBITDA - - - - - - - - - - - - - - FALSE EBITDA / Int. Expense - - - - - - - - - - - - - - FALSE Credit Ratings S&P LT Credit Rating - AA- AA- A+ AA A- NR A- A- A A- A- - BBB FALSE S&P LT Credit Rating Date - 22.12.2006 10.06.2006 04.06.2012 27.01.2012 18.12.2012 31.12.2011 01.07.2005 17.02.2012 13.12.2007 29.07.2010 07.04.2010 - 03.05.2012 FALSE Moody's LT Credit Rating - - - WR Aa3 A2 WR Baa1 - A3 A3 - - - FALSE Moody's LT Credit Rating Date - - - 21.06.2007 03.05.2004 19.03.2003 31.12.2011 14.07.2005 - 02.11.2009 16.12.2011 - - - FALSE Q.M.S Advisors | tel: +41 (0)78 922 08 77 | e-mail: info@qmsadv.com |