Financial Analysis - Northrop Grumman Corporation is a global security company. The Company provides systems, products, and solutions in aerospace, electronics, information systems and technical services
•
1 gostou•848 visualizações

Financial Analysis - Northrop Grumman Corporation is a global security company. The Company provides systems, products, and solutions in aerospace, electronics, information systems and technical services

Recomendados
Recomendados
Mais conteúdo relacionado
Mais de BCV
Mais de BCV (20)
Último
Último (20)
Financial Analysis - Northrop Grumman Corporation is a global security company. The Company provides systems, products, and solutions in aerospace, electronics, information systems and technical services
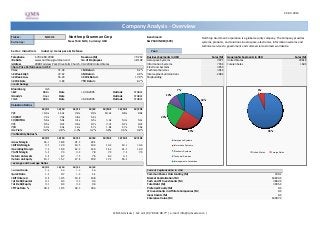
- 1. 24.04.2013 Ticker: Northrop Grumman Corp Benchmark: Currency: New York: NOC, Currency: USD S&P 500 INDEX (SPX) Sector: Industrials Industry: Aerospace & Defense Year: Telephone 1-703-280-2900 Revenue (M) Business Segments in USD Sales (M) Geographic Segments in USD Sales (M) Website www.northropgrumman.com No of Employees Aerospace Systems 9977 United States 23618 Address 2980 Fairview Park Drive Falls Church, VA 22042 United States Information Systems 7356 Foreign Sales 1600 Share Price Performance in USD Electronic Systems 6950 Price 71.49 1M Return 5.1% Technical Services 3019 52 Week High 72.67 6M Return 4.9% Intersegment eliminations -2084 52 Week Low 55.20 52 Wk Return 17.9% Shipbuilding 52 Wk Beta 0.84 YTD Return 6.7% Credit Ratings Bloomberg IG5 S&P BBB+ Date 12.08.2005 Outlook STABLE Moody's Baa2 Date - Outlook STABLE Fitch BBB+ Date 26.08.2005 Outlook STABLE Valuation Ratios 12/09 12/10 12/11 12/12 12/13E 12/14E 12/15E P/E 10.4x 11.2x 9.0x 9.0x 10.2x 9.8x 9.0x EV/EBIT 7.3x 7.0x 4.8x 5.2x - - - EV/EBITDA 5.6x 5.9x 4.1x 4.5x 5.3x 5.3x 5.1x P/S 0.5x 0.7x 0.6x 0.7x 0.7x 0.7x 0.7x P/B 1.4x 1.4x 1.4x 1.7x 1.8x 1.7x 1.6x Div Yield 3.0% 2.8% 3.4% 3.2% 3.2% 3.5% 3.8% Profitability Ratios % 12/09 12/10 12/11 12/12 12/13E 12/14E 12/15E Gross Margin 16.7 18.8 21.3 22.1 - - - EBITDA Margin 9.5 12.0 14.5 14.4 13.4 13.7 14.6 Operating Margin 7.4 10.0 12.4 12.4 11.2 11.3 12.0 Profit Margin 5.0 7.3 8.0 7.8 7.0 7.1 7.6 Return on Assets 5.6 6.7 7.5 7.6 6.3 6.3 - Return on Equity 13.7 15.7 17.8 19.9 17.2 16.9 - Leverage and Coverage Ratios 12/09 12/10 12/11 12/12 Current Ratio 1.2 1.4 1.3 1.4 Current Capitalization in USD Quick Ratio 1.0 0.7 1.0 1.1 Common Shares Outstanding (M) 239.2 EBIT/Interest 8.8 10.5 14.8 14.8 Market Capitalization (M) 16834.0 Tot Debt/Capital 0.3 0.3 0.3 0.3 Cash and ST Investments (M) 3862.0 Tot Debt/Equity 0.3 0.4 0.4 0.4 Total Debt (M) 3935.0 Eff Tax Rate % 30.6 19.5 32.3 33.3 Preferred Equity (M) 0.0 LT Investments in Affiliate Companies (M) 0.0 Investments (M) 0.0 Enterprise Value (M) 16907.0 Northrop Grumman Corporation is a global security company. The Company provides systems, products, and solutions in aerospace, electronics, information systems and technical services to government and commercial customers worldwide. NOC US 25'218 68'100 Company Analysis - Overview 34% 25% 24% 10% 7% Aerospace Systems Information Systems Electronic Systems Technical Services Intersegment eliminations 94% 6% United States Foreign Sales Q.M.S Advisors | tel: +41 (0)78 922 08 77 | e-mail: info@qmsadv.com |
- 2. Northrop Grumman Corp Target price in USD Date Buy Hold Sell Date Price Target Price Broker Analyst Recommendation Target Date 29-Mar-13 14% 62% 24% 24-Apr-13 71.49 68.43 Sanford C. Bernstein & Co DOUGLAS S HARNED market perform 76.00 22-Apr-13 28-Feb-13 14% 62% 24% 23-Apr-13 71.49 68.43 Jefferies HOWARD A RUBEL buy 80.00 19-Apr-13 31-Jan-13 14% 62% 24% 22-Apr-13 70.78 68.43 Credit Suisse ROBERT M SPINGARN neutral 72.00 16-Apr-13 31-Dec-12 10% 67% 24% 19-Apr-13 70.98 68.43 CRT Capital Group BRIAN W RUTTENBUR sell 52.00 16-Apr-13 30-Nov-12 10% 67% 24% 18-Apr-13 69.87 68.43 Deutsche Bank MYLES WALTON hold 73.00 15-Apr-13 31-Oct-12 14% 64% 23% 17-Apr-13 70.12 68.43 Stifel WILLIAM R LOOMIS hold 15-Apr-13 28-Sep-12 18% 59% 23% 16-Apr-13 71.29 68.43 Barclays CARTER COPELAND equalweight 69.00 15-Apr-13 31-Aug-12 18% 64% 18% 15-Apr-13 70.83 68.43 Buckingham Research Group RICHARD SAFRAN neutral 68.00 11-Apr-13 31-Jul-12 18% 68% 14% 12-Apr-13 72.11 68.43 Cowen and Company CAI VON RUMOHR neutral 11-Apr-13 29-Jun-12 18% 68% 14% 11-Apr-13 72.45 68.43 Drexel Hamilton LLC RICHARD WHITTINGTON hold 70.00 11-Apr-13 31-May-12 18% 68% 14% 10-Apr-13 71.77 66.92 RBC Capital Markets ROBERT STALLARD sector perform 66.00 10-Apr-13 30-Apr-12 19% 67% 14% 9-Apr-13 71.56 66.92 Wells Fargo Securities, LLC SAMUEL J PEARLSTEIN market perform 10-Apr-13 8-Apr-13 71.72 66.92 Goldman Sachs NOAH POPONAK neutral/neutral 65.00 8-Apr-13 5-Apr-13 71.56 66.61 JPMorgan JOSEPH B NADOL III neutral 68.00 8-Apr-13 4-Apr-13 71.07 66.61 Argus Research Corp NATHANIEL GABRIEL hold 12-Mar-13 3-Apr-13 70.18 66.61 FBR Capital Markets PATRICK J MCCARTHY market perform 58.97 31-Jan-13 2-Apr-13 69.40 66.61 Oppenheimer & Co YAIR REINER market perform 31-Jan-13 1-Apr-13 69.90 66.61 EVA Dimensions CRAIG STERLING buy 15-Jan-13 29-Mar-13 70.15 66.61 28-Mar-13 70.15 66.61 27-Mar-13 69.90 66.61 26-Mar-13 69.29 66.61 25-Mar-13 67.91 66.61 22-Mar-13 68.05 66.61 21-Mar-13 68.00 66.61 20-Mar-13 68.64 66.61 19-Mar-13 68.44 66.61 18-Mar-13 68.43 66.61 15-Mar-13 68.80 66.61 14-Mar-13 67.54 66.61 Company Analysis - Analysts Ratings Buy and Sell Recommendations vs Price and Target Price 19% 18% 18% 18% 18% 18% 14% 10% 10% 14% 14% 14% 67% 68% 68% 68% 64% 59% 64% 67% 67% 62% 62% 62% 14% 14% 14% 14% 18% 23% 23% 24% 24% 24% 24% 24% 0% 20% 40% 60% 80% 100% avr.12 mai.12 juin.12 juil.12 août.12 sept.12 oct.12 nov.12 déc.12 janv.13 févr.13 mars.13 BrokerRecommendation 0 10 20 30 40 50 60 70 80 Price Buy Hold Sell Price Target Price Brokers' Target Price 0 10 20 30 40 50 60 70 80 90 SanfordC.Bernstein&Co Jefferies CreditSuisse CRTCapitalGroup DeutscheBank Stifel Barclays BuckinghamResearchGroup CowenandCompany DrexelHamiltonLLC RBCCapitalMarkets WellsFargoSecurities,LLC GoldmanSachs JPMorgan ArgusResearchCorp FBRCapitalMarkets Oppenheimer&Co EVADimensions Q.M.S Advisors | tel: +41 (0)78 922 08 77 | e-mail: info@qmsadv.com |
- 3. 24.04.2013 Northrop Grumman Corp Ownership Statistics Geographic Ownership Distribution Shares Outstanding (M) 239.2 United States 87.23% Float 99.4% Britain 4.22% Short Interest (M) 10.0 Germany 1.64% Short Interest as % of Float 4.20% Canada 1.52% Days to Cover Shorts 6.98 Japan 1.09% Institutional Ownership 112.77% France 1.00% Retail Ownership -13.36% Luxembourg 0.84% Insider Ownership 0.59% Others 2.48% Institutional Ownership Distribution Investment Advisor 87.32% Hedge Fund Manager 7.07% Pension Fund (Erisa) 2.53% Insurance Company 1.40% Pricing data is in USD Others 1.68% Top 20 Owners: Holder Name Position Position Change Market Value % of Ownership Report Date Source Country STATE STREET 29'466'273 -2'149'144 2'106'543'857 12.51% 23.04.2013 ULT-AGG UNITED STATES BLACKROCK 20'469'117 0 1'463'337'174 8.69% 22.04.2013 ULT-AGG UNITED STATES CAPITAL GROUP COMPAN 19'563'613 -6'390'166 1'398'602'693 8.31% 31.03.2013 ULT-AGG UNITED STATES VANGUARD GROUP INC 11'372'246 199'000 813'001'867 4.83% 31.03.2013 13F UNITED STATES SUN LIFE FINANCIAL I 7'627'933 -219'648 545'320'930 3.24% 28.02.2013 ULT-AGG CANADA FIRST EAGLE INVESTME 6'267'995 6'512 448'098'963 2.66% 31.12.2012 13F UNITED STATES HARRIS ASSOCIATES LP 5'977'000 -900 427'295'730 2.54% 31.12.2012 13F UNITED STATES ALLIANZ ASSET MANAGE 5'543'660 -149'126 396'316'253 2.35% 31.03.2013 ULT-AGG GERMANY BANK OF NEW YORK MEL 5'254'288 111'814 375'629'049 2.23% 31.03.2013 13F UNITED STATES LSV ASSET MANAGEMENT 4'488'460 -219'325 320'880'005 1.91% 31.12.2012 13F UNITED STATES WELLINGTON MANAGEMEN 4'218'108 154'526 301'552'541 1.79% 31.12.2012 13F UNITED STATES DEUTSCHE BANK AG 3'970'675 -1'315'317 283'863'556 1.69% 31.12.2012 13F GERMANY LONGVIEW PARTNERS (G 3'950'402 -55'410 282'414'239 1.68% 31.12.2012 13F BRITAIN PZENA INVESTMENT MAN 3'852'775 -1'167'948 275'434'885 1.64% 31.12.2012 13F UNITED STATES ACADIAN ASSET MANAGE 3'539'674 430'959 253'051'294 1.50% 31.03.2013 13F UNITED STATES MACQUARIE GROUP 3'516'486 2'333 251'393'584 1.49% 31.12.2012 ULT-AGG AUSTRALIA AJO, LP 3'408'670 -82'120 243'685'818 1.45% 31.12.2012 13F UNITED STATES PUTNAM INVESTMENT MA 3'329'094 13'385 237'996'930 1.41% 31.12.2012 13F UNITED STATES AMERIPRISE FINANCIAL 3'291'589 164'030 235'315'698 1.40% 31.12.2012 13F UNITED STATES NORTHERN TRUST CORPO 3'120'280 -30'026 223'068'817 1.33% 31.12.2012 13F UNITED STATES Top 5 Insiders: Holder Name Position Position Change Market Value % of Ownership Report Date Source BUSH WESLEY G 443'585 31'711'892 0.19% 27.02.2013 Form 4 SUGAR RONALD D 409'000 29'239'410 0.17% 13.11.2009 Form 4 PALMER JAMES F 144'928 28'922 10'360'903 0.06% 20.02.2013 Form 4 MILLS LINDA A 70'415 5'033'968 0.03% 20.02.2013 Form 4 LIVANOS ALEXIS C 39'638 13'117 2'833'721 0.02% 14.02.2012 Form 4 Company Analysis - Ownership Ownership Type 89% 11% 0% Institutional Ownership Retail Ownership Insider Ownership Geographic Ownership 87% 2% 2% 1% 2% 1% 1% 4% United States Britain Germany Canada Japan France Luxembourg Others Institutional Ownership 87% 3% 2%1% 7% Investment Advisor Hedge Fund Manager Pension Fund (Erisa) Insurance Company Others TOP 20 ALL Q.M.S Advisors | tel: +41 (0)78 922 08 77 | e-mail: info@qmsadv.com |
- 4. Northrop Grumman Corp Financial information is in USD (M) Periodicity: 12/02 12/03 12/04 12/05 12/06 12/07 12/08 12/09 12/10 12/11 12/12 12/13E 12/14E 12/15E Income Statement Revenue 17'206 26'206 29'853 30'067 30'113 31'828 32'315 33'755 28'143 26'412 25'218 23'970 23'332 22'505 - Cost of Goods Sold 14'104 22'322 25'135 24'994 24'622 25'637 26'375 28'130 22'849 20'786 19'638 Gross Income 3'102 3'884 4'718 5'073 5'491 6'191 5'940 5'625 5'294 5'626 5'580 - Selling, General & Admin Expenses 1'711 2'393 2'712 2'880 3'027 3'173 3'143 3'142 2'467 2'350 2'450 (Research & Dev Costs) 1'328 429 504 538 572 534 564 610 580 543 520 Operating Income 1'391 1'538 2'006 2'193 2'464 3'018 2'797 2'483 2'827 3'276 3'130 2'695 2'640 2'694 - Interest Expense 422 497 431 388 347 336 295 281 269 221 212 - Foreign Exchange Losses (Gains) 0 0 0 0 0 0 0 0 0 0 - Net Non-Operating Losses (Gains) -40 -90 -40 -254 -169 -16 3'022 -64 192 -28 -47 Pretax Income 1'009 1'131 1'615 2'059 2'286 2'698 -520 2'266 2'366 3'083 2'965 2'499 2'460 2'546 - Income Tax Expense 312 323 522 667 713 887 859 693 462 997 987 Income Before XO Items 697 808 1'093 1'392 1'573 1'811 -1'379 1'573 1'904 2'086 1'978 - Extraordinary Loss Net of Tax 633 -58 9 -8 31 21 -117 -113 -149 -32 0 - Minority Interests 0 0 0 0 0 0 0 0 0 0 Diluted EPS Before XO Items 2.86 2.16 2.99 3.83 4.46 5.18 (4.12) 4.87 6.32 7.41 7.81 Net Income Adjusted* 713 840 1'093 1'383 1'600 1'707 1'779 1'686 2'038 2'086 1'978 1'675 1'659 1'707 EPS Adjusted 3.04 2.25 2.99 3.81 4.46 5.12 5.21 5.21 6.77 7.41 7.81 7.01 7.31 7.91 Dividends Per Share 0.80 0.80 0.89 1.01 1.16 1.48 1.57 1.69 1.84 1.97 2.15 2.31 2.51 2.70 Payout Ratio % 26.8 37.7 29.5 25.8 26.3 28.7 34.3 28.6 26.0 27.0 0.33 0.34 0.34 Total Shares Outstanding 365 362 364 347 346 338 327 307 291 254 239 Diluted Shares Outstanding 235 368 365 363 359 354 335 323 301 282 253 EBITDA 1'916 2'173 2'740 2'965 3'169 3'745 3'558 3'219 3'382 3'820 3'640 3'212 3'193 3'283 *Net income excludes extraordinary gains and losses and one-time charges. Equivalent Estimates Company Analysis - Financials I/IV Fiscal Year Q.M.S Advisors | tel: +41 (0)78 922 08 77 | e-mail: info@qmsadv.com |
- 5. Periodicity: 12/02 12/03 12/04 12/05 12/06 12/07 12/08 12/09 12/10 12/11 12/12 12/13E 12/14E 12/15E Balance Sheet Total Current Assets 15835 5745 6849 7551 6719 6797 8243 8635 13774 7746 8392 + Cash & Near Cash Items 1'412 342 1'230 1'605 1'015 963 1'504 3'275 3'701 3'002 3'862 + Short Term Investments 0 0 0 0 0 0 0 0 0 0 0 + Accounts & Notes Receivable 2'889 3'198 3'492 3'553 3'566 3'790 3'701 3'394 3'329 2'964 2'858 + Inventories 1'091 1'147 1'057 1'164 1'178 1'000 1'003 1'170 896 873 798 + Other Current Assets 10'443 1'058 1'070 1'229 960 1'044 2'035 796 5'848 907 874 Total Long-Term Assets 26'431 27'264 26'454 26'663 25'290 26'576 21'954 21'617 17'636 17'665 18'151 + Long Term Investments 0 0 0 0 0 0 0 0 0 0 0 Gross Fixed Assets 4'996 5'780 6'399 6'998 7'546 8'114 8'567 9'084 6'757 6'980 7'033 Accumulated Depreciation 1'391 1'744 2'189 2'595 3'015 3'424 3'782 4'216 3'712 3'933 4'146 + Net Fixed Assets 3'605 4'036 4'210 4'403 4'531 4'690 4'785 4'868 3'045 3'047 2'887 + Other Long Term Assets 22'826 23'228 22'244 22'260 20'759 21'886 17'169 16'749 14'591 14'618 15'264 Total Current Liabilities 11'373 6'361 6'165 7'974 6'753 6'432 7'449 6'985 10'027 6'135 6'056 + Accounts Payable 1'427 1'491 1'750 1'589 1'686 1'890 1'887 1'921 1'573 1'481 1'392 + Short Term Borrowings 225 471 42 1'264 170 137 501 103 784 13 5 + Other Short Term Liabilities 9'721 4'399 4'373 5'121 4'897 4'405 5'061 4'961 7'670 4'641 4'659 Total Long Term Liabilities 16'082 10'850 10'438 9'412 8'641 9'254 10'828 10'580 7'947 8'940 10'973 + Long Term Borrowings 9'398 5'760 5'466 4'231 4'342 4'268 3'443 4'191 3'940 3'935 3'930 + Other Long Term Borrowings 6'684 5'090 4'972 5'181 4'299 4'986 7'385 6'389 4'007 5'005 7'043 Total Liabilities 27'455 17'211 16'603 17'386 15'394 15'686 18'277 17'565 17'974 15'075 17'029 + Long Preferred Equity 350 0 0 0 0 0 0 0 0 0 0 + Minority Interest 139 13 0 0 0 0 0 0 0 0 0 + Share Capital & APIC 12'511 12'433 12'790 11'918 11'692 10'999 9'972 8'964 8'069 4'127 3'163 + Retained Earnings & Other Equity 1'811 3'352 3'910 4'910 4'923 6'688 1'948 3'723 5'367 6'209 6'351 Total Shareholders Equity 14'811 15'798 16'700 16'828 16'615 17'687 11'920 12'687 13'436 10'336 9'514 Total Liabilities & Equity 42'266 33'009 33'303 34'214 32'009 33'373 30'197 30'252 31'410 25'411 26'543 Book Value Per Share 39.22 43.58 45.82 48.45 48.03 52.35 36.45 41.34 46.18 40.71 39.77 40.38 42.90 44.87 Tangible Book Value Per Share -10.65 -8.99 -5.38 -5.26 -5.04 -3.13 -7.76 -5.55 2.98 -8.64 -12.77 Company Analysis - Financials II/IV Q.M.S Advisors | tel: +41 (0)78 922 08 77 | e-mail: info@qmsadv.com |
- 6. Periodicity: 12/02 12/03 12/04 12/05 12/06 12/07 12/08 12/09 12/10 12/11 12/12 12/13E 12/14E 12/15E Cash Flows Net Income 64 866 1'084 1'400 1'542 1'790 -1'262 1'686 2'053 2'118 1'978 1'672 1'654 1'708 + Depreciation & Amortization 525 635 734 772 705 727 761 736 555 544 510 + Other Non-Cash Adjustments 899 185 5'558 194 -553 267 3'184 -248 300 -538 133 + Changes in Non-Cash Capital 201 -830 -5'440 261 62 106 528 -41 -455 -9 19 Cash From Operating Activities 1'689 856 1'936 2'627 1'756 2'890 3'211 2'133 2'453 2'115 2'640 + Disposal of Fixed Assets 45 86 28 11 21 22 19 0 0 0 0 + Capital Expenditures -538 -635 -672 -824 -737 -682 -681 -654 -579 -488 -331 -393 -388 -343 + Increase in Investments 0 0 0 0 0 0 0 0 0 0 0 + Decrease in Investments 0 0 0 0 0 0 0 0 0 0 0 + Other Investing Activities 375 3'430 653 -42 115 -770 36 1'521 -181 1'168 247 Cash From Investing Activities -118 2'881 9 -855 -601 -1'430 -626 867 -760 680 -84 + Dividends Paid -205 -305 -322 -359 -402 -504 -525 -539 -545 -543 -535 + Change in Short Term Borrowings 6 -12 0 41 44 -69 -2 -12 0 0 0 + Increase in Long Term Borrowings 0 0 101 0 200 0 0 843 1'484 0 0 + Decrease in Long Term Borrowings -500 -3'805 -836 -32 -1'212 -90 -113 -474 -1'011 -768 0 + Increase in Capital Stocks 76 33 834 163 450 326 151 53 164 118 233 + Decrease in Capital Stocks 0 -200 -786 -1'210 -825 -1'175 -1'555 -1'100 -1'177 -2'295 -1'316 + Other Financing Activities 0 -460 0 0 0 0 0 0 -181 -6 -78 Cash From Financing Activities -623 -4'749 -1'009 -1'397 -1'745 -1'512 -2'044 -1'229 -1'266 -3'494 -1'696 Net Changes in Cash 948 -1'012 936 375 -590 -52 541 1'771 427 -699 860 Free Cash Flow (CFO-CAPEX) 1'151 221 1'264 1'803 1'019 2'208 2'530 1'479 1'874 1'627 2'309 1'759 2'066 1'940 Free Cash Flow To Firm 1'443 576 1'556 2'065 1'258 2'434 1'674 2'090 1'777 2'450 Free Cash Flow To Equity 677 -3'860 557 1'823 72 2'071 2'434 1'836 2'347 859 2'309 Free Cash Flow per Share 4.98 0.61 3.51 5.06 2.95 6.46 7.56 4.63 6.31 5.88 9.29 Company Analysis - Financials III/IV Q.M.S Advisors | tel: +41 (0)78 922 08 77 | e-mail: info@qmsadv.com |
- 7. Periodicity: 12/02 12/03 12/04 12/05 12/06 12/07 12/08 12/09 12/10 12/11 12/12 12/13E 12/14E 12/15E Ratio Analysis Valuation Ratios Price Earnings 16.0x 21.3x 18.2x 16.5x 15.2x 15.3x 9.0x 10.4x 11.2x 9.0x 9.0x 10.2x 9.8x 9.0x EV to EBIT 19.0x 15.1x 12.0x 11.3x 10.9x 9.9x 6.1x 7.3x 7.0x 4.8x 5.2x EV to EBITDA 13.8x 10.7x 8.8x 8.4x 8.5x 8.0x 4.8x 5.6x 5.9x 4.1x 4.5x 5.3x 5.3x 5.1x Price to Sales 0.7x 0.7x 0.7x 0.7x 0.8x 0.8x 0.5x 0.5x 0.7x 0.6x 0.7x 0.7x 0.7x 0.7x Price to Book 1.2x 1.1x 1.2x 1.2x 1.4x 1.5x 1.2x 1.4x 1.4x 1.4x 1.7x 1.8x 1.7x 1.6x Dividend Yield 1.6% 1.7% 1.6% 1.7% 1.7% 1.9% 3.5% 3.0% 2.8% 3.4% 3.2% 3.2% 3.5% 3.8% Profitability Ratios Gross Margin 18.0% 14.8% 15.8% 16.9% 18.2% 19.5% 18.4% 16.7% 18.8% 21.3% 22.1% EBITDA Margin 11.1% 8.3% 9.2% 9.9% 10.5% 11.8% 11.0% 9.5% 12.0% 14.5% 14.4% 13.4% 13.7% 14.6% Operating Margin 8.1% 5.9% 6.7% 7.3% 8.2% 9.5% 8.7% 7.4% 10.0% 12.4% 12.4% 11.2% 11.3% 12.0% Profit Margin 0.4% 3.3% 3.6% 4.7% 5.1% 5.6% -3.9% 5.0% 7.3% 8.0% 7.8% 7.0% 7.1% 7.6% Return on Assets 0.2% 2.3% 3.3% 4.1% 4.7% 5.5% -4.0% 5.6% 6.7% 7.5% 7.6% 6.3% 6.3% Return on Equity 0.4% 5.8% 6.7% 8.4% 9.2% 10.4% -8.5% 13.7% 15.7% 17.8% 19.9% 17.2% 16.9% Leverage & Coverage Ratios Current Ratio 1.39 0.90 1.11 0.95 0.99 1.06 1.11 1.24 1.37 1.26 1.39 Quick Ratio 0.38 0.56 0.77 0.65 0.68 0.74 0.70 0.95 0.70 0.97 1.11 Interest Coverage Ratio (EBIT/I) 3.30 3.09 4.65 5.65 7.10 8.98 9.48 8.84 10.51 14.82 14.76 Tot Debt/Capital 0.39 0.28 0.25 0.25 0.21 0.20 0.25 0.25 0.26 0.28 0.29 Tot Debt/Equity 0.65 0.39 0.33 0.33 0.27 0.25 0.33 0.34 0.35 0.38 0.41 Others Asset Turnover 0.54 0.70 0.90 0.89 0.91 0.97 1.02 1.12 0.91 0.93 0.97 Accounts Receivable Turnover 6.12 8.61 8.92 8.54 8.46 8.65 8.63 9.52 8.37 8.39 8.66 Accounts Payable Turnover 11.42 15.34 15.46 15.04 15.04 14.24 13.97 14.86 12.92 13.60 13.62 Inventory Turnover 12.17 19.95 22.81 22.51 21.03 23.54 26.34 25.89 22.12 23.50 23.50 Effective Tax Rate 30.9% 28.6% 32.3% 32.4% 31.2% 32.9% 30.6% 19.5% 32.3% 33.3% Company Analysis - Financials IV/IV Q.M.S Advisors | tel: +41 (0)78 922 08 77 | e-mail: info@qmsadv.com |
- 8. NORTHROP GRUMMAN BOEING CO/THE LOCKHEED MARTIN GENERAL DYNAMICS RAYTHEON CO ROCKWELL COLLINS EADS NV EXELIS INC GENERAL ELECTRIC BAE SYSTEMS PLC GENCORP INC L-3 COMM HLDGS SPIRIT AEROSYS-A UNITED TECH CORP CUBIC CORP 12/2012 12/2012 12/2012 12/2012 12/2012 09/2012 12/2012 12/2012 12/2012 12/2012 11/2012 12/2012 12/2012 12/2012 09/2012 72.67 89.46 99.49 72.01 59.34 64.16 42.59 12.32 23.90 399.70 13.87 83.99 25.90 95.84 52.53 11.04.2013 11.04.2013 23.04.2013 07.01.2013 21.12.2012 20.03.2013 15.03.2013 04.05.2012 08.03.2013 11.04.2013 04.04.2013 11.04.2013 03.05.2012 11.04.2013 14.09.2012 56.59 66.82 80.14 61.09 49.03 46.37 24.26 9.01 18.02 268.60 5.69 63.74 13.96 70.71 40.61 05.06.2012 05.06.2012 05.06.2012 02.08.2012 04.06.2012 24.07.2012 23.11.2012 25.07.2012 05.06.2012 01.06.2012 04.06.2012 23.05.2012 16.11.2012 05.06.2012 22.04.2013 1'085'687 3'131'828 2'489'368 1'719'533 1'580'180 1'104'822 1'038'087 855'123 65'822'433 2'861'153 495'884 508'235 849'376 6'506'123 84'796 71.49 88.18 97.06 67.10 57.39 61.35 40.68 10.53 21.50 379.60 12.76 81.35 19.39 92.89 41.69 -1.6% -1.4% -2.4% -6.8% -3.3% -4.4% -4.5% -14.5% -10.0% -5.0% -8.0% -3.1% -25.1% -3.1% -20.6% 26.3% 32.0% 21.1% 9.8% 17.1% 32.3% 67.7% 16.9% 19.3% 41.3% 124.3% 27.6% 38.9% 31.4% 2.7% 239.2 755.6 321.0 353.7 328.0 142.2 822.1 187.6 10'405.6 3'250.9 59.3 90.4 143.7 918.8 26.7 16'834 66'780 31'310 23'699 18'730 8'323 33'810 1'983 222'975 12'308 772 7'338 2'735 85'147 1'115 3'935.0 10'409.0 6'308.0 3'908.0 4'731.0 779.0 4'779.0 649.0 17'469.0 2'988.0 248.7 3'629.0 1'176.2 23'221.0 11.5 - - - - - - - - - - - - - - - - 100.0 - - 164.0 5.0 25.0 - 5'444.0 54.0 - 76.0 0.5 1'393.0 (0.0) 3'862.0 13'558.0 1'898.0 3'296.0 4'044.0 335.0 11'084.0 292.0 15'583.0 3'355.0 162.1 349.0 440.7 4'819.0 212.3 16'907 63'731 34'549 23'863 19'581 9'149 27'530 2'340 218'475 11'995 1'339 10'694 3'471 104'828 973 LFY 25'218.0 81'698.0 47'182.0 31'513.0 24'414.0 4'726.0 56'480.0 5'522.0 144'796.0 16'620.0 994.9 13'146.0 5'397.7 57'708.0 1'381.5 LTM 25'124.0 81'208.0 46'959.0 31'338.0 24'414.0 4'664.0 56'480.0 5'522.0 143'566.0 16'620.0 1'036.7 13'989.0 5'397.7 59'691.0 1'376.1 CY+1 23'969.6 83'857.5 44'972.5 31'427.9 23'805.9 4'642.8 58'708.5 5'015.3 148'360.5 19'266.1 1'437.5 12'600.9 5'982.3 64'780.5 1'355.7 CY+2 23'332.4 91'482.0 43'970.9 31'243.3 23'343.6 4'779.8 62'639.5 4'797.2 153'732.3 19'032.2 1'845.5 12'171.2 6'562.3 68'435.8 1'392.6 LFY 0.6x 0.7x 0.7x 0.8x 0.8x 2.0x 0.3x 0.4x 1.6x 0.6x 1.3x 0.8x 0.6x 1.8x 0.8x LTM 0.6x 0.7x 0.7x 0.8x 0.8x 2.0x 0.3x 0.4x 1.6x 0.6x 1.2x 0.7x 0.6x 1.8x 0.8x CY+1 0.7x 0.8x 0.8x 0.7x 0.8x 1.9x 0.5x 0.4x 3.3x 0.7x - 0.8x 0.6x 1.5x 0.5x CY+2 0.7x 0.7x 0.8x 0.7x 0.8x 1.9x 0.5x 0.4x 3.1x 0.7x - 0.8x 0.6x 1.4x - LFY 3'640.0 8'118.0 5'470.0 3'447.0 3'444.0 1'033.0 3'927.0 710.0 25'000.0 2'199.0 57.2 1'579.0 102.3 9'208.0 150.9 LTM 3'640.0 8'118.0 5'515.0 1'428.0 3'444.0 1'026.0 3'987.0 710.0 25'000.0 2'199.0 49.4 1'647.0 219.7 9'625.0 139.8 CY+1 3'212.5 8'123.1 5'377.1 4'111.3 3'124.9 1'070.3 5'494.9 601.8 29'765.6 2'407.5 157.0 1'486.8 692.0 10'882.4 118.6 CY+2 3'192.7 9'149.4 5'376.0 4'215.3 3'147.2 1'127.7 6'451.1 618.2 32'078.5 2'337.4 226.0 1'446.0 762.2 11'930.5 129.3 LFY 4.5x 6.6x 6.3x 7.3x 5.7x 9.1x 4.6x 3.5x 9.4x 4.8x 22.4x 6.5x 31.0x 11.4x 7.6x LTM 4.5x 6.6x 6.2x 17.6x 5.7x 9.2x 4.5x 3.5x 9.0x 4.8x 26.0x 6.2x 14.4x 10.9x 8.2x CY+1 5.4x 7.8x 6.4x 5.7x 6.2x 8.4x 5.4x 3.7x 16.4x 5.4x - 7.0x 5.5x 9.1x 5.3x CY+2 5.4x 6.8x 6.3x 5.5x 6.2x 8.0x 4.5x 3.4x 14.7x 5.6x - 7.1x 4.9x 8.2x - LFY 7.47 5.11 10.19 6.48 6.20 4.41 1.45 1.85 1.54 0.32 0.05 8.10 2.30 5.40 3.44 LTM 7.52 5.31 10.49 6.48 6.22 4.54 1.50 1.87 1.53 0.33 -0.18 8.41 2.47 5.60 3.11 CY+1 7.01 6.37 8.96 6.67 5.31 4.60 2.68 1.67 1.67 0.42 0.14 8.19 2.15 6.11 2.65 CY+2 7.31 7.14 9.03 7.12 5.53 4.92 3.58 1.50 1.82 0.41 0.83 8.24 2.53 6.98 3.00 LFY 9.5x 16.6x 9.3x 10.4x 9.2x 13.5x 27.2x 5.6x 14.1x 11.6x - 9.7x 7.9x 16.6x 13.4x LTM 9.5x 16.6x 9.3x 10.4x 9.2x 13.5x 27.2x 5.6x 14.1x 11.8x - 9.7x 7.9x 16.6x 13.4x CY+1 10.2x 13.8x 10.8x 10.1x 10.8x 13.3x 15.2x 6.3x 12.9x 9.0x 91.1x 9.9x 9.0x 15.2x 15.7x CY+2 9.8x 12.4x 10.7x 9.4x 10.4x 12.5x 11.4x 7.0x 11.8x 9.2x 15.4x 9.9x 7.7x 13.3x 13.9x 1 Year (4.5%) 18.9% 1.5% (3.6%) (1.5%) (1.7%) 15.0% (5.4%) 1.8% (6.5%) 8.4% (0.1%) 11.0% 3.5% 6.6% 5 Year (4.4%) 4.2% 2.1% 1.5% 1.6% (0.9%) 11.5% - (4.3%) 2.9% 7.1% (1.0%) 12.6% 1.0% 9.4% 1 Year (4.7%) 8.5% 6.8% (22.0%) 5.2% 4.7% 23.8% 2.7% (0.2%) (3.6%) (17.1%) (5.6%) (79.1%) 1.1% 11.1% 5 Year (0.6%) 2.2% 0.5% (0.5%) 5.0% 1.5% 23.1% - (7.0%) 4.1% (4.8%) (0.9%) (27.9%) 2.3% 16.3% LTM 14.4% 9.9% 11.7% 4.6% 14.1% 22.0% 7.1% 12.9% 17.3% 13.2% 4.8% 11.8% 4.1% 16.1% 10.2% CY+1 13.4% 9.7% 12.0% 13.1% 13.1% 23.1% 9.4% 12.0% 20.1% 12.5% 10.9% 11.8% 11.6% 16.8% 8.7% CY+2 13.7% 10.0% 12.2% 13.5% 13.5% 23.6% 10.3% 12.9% 20.9% 12.3% 12.2% 11.9% 11.6% 17.4% 9.3% Total Debt / Equity % 41.4% 177.4% 16174.4% 34.3% 58.9% 61.9% 45.9% 63.9% 274.3% 80.3% - 66.4% 58.9% 89.6% 1.7% Total Debt / Capital % 29.3% 63.6% 99.4% 25.5% 36.6% 38.1% 31.4% 39.0% 72.4% 44.2% - 39.6% 37.1% 46.0% 1.7% Total Debt / EBITDA 1.081x 1.282x 1.143x 2.737x 1.374x 1.129x 1.199x 0.914x 0.699x 1.359x 14.334x 2.203x 5.354x 2.371x 0.232x Net Debt / EBITDA 0.020x -0.388x 0.587x 0.115x 0.199x 0.800x -1.581x 0.503x 0.075x -0.167x 11.486x 1.991x 3.348x 1.876x -1.014x EBITDA / Int. Expense 17.170x 15.117x 14.282x 20.518x 16.800x 38.259x 7.523x 19.189x 18.103x 1.377x 2.565x 8.582x 1.132x 10.096x 97.341x S&P LT Credit Rating BBB+ A A- A A- A A- BBB- AA+ BBB+ B BBB- - A - S&P LT Credit Rating Date 12.08.2005 29.07.2009 27.04.2007 09.07.1999 04.09.2008 17.05.2001 22.09.2010 28.09.2012 12.03.2009 16.10.2007 19.12.2012 01.08.2005 - 02.10.2003 - Moody's LT Credit Rating Baa2 A2 Baa1 A2 A3 A2 (P)A2 Baa3 Aa3 Baa2 - Ba1 - A2 - Moody's LT Credit Rating Date 27.07.2009 15.03.2006 26.01.2006 07.08.2003 17.10.2011 08.01.2013 06.12.2012 14.09.2011 03.04.2012 14.04.2005 - 18.05.2010 - 22.04.1993 - 52-Week High Date 52-Week Low Latest Fiscal Year: 52-Week High Total Debt Market Capitalization Daily Volume 52-Week Low % Change Current Price (4/dd/yy) 52-Week High % Change Cash and Equivalents EBITDA EV/EBITDA Enterprise Value Valuation Preferred Stock 52-Week Low Date Minority Interest Total Common Shares (M) P/E Revenue Growth Total Revenue EV/Total Revenue EPS EBITDA Growth EBITDA Margin Credit Ratings Leverage/Coverage Ratios Company Analysis - Peers Comparision Q.M.S Advisors | tel: +41 (0)78 922 08 77 | e-mail: info@qmsadv.com |