SlideShare uma empresa Scribd logo
1 de 8
Baixar para ler offline
04.03.2013


                                                                                         Company Analysis - Overview
                                                                                                                                                               Facebook Inc. operates a social networking website. The Company's website allows
Ticker:                    FB UN           Facebook Inc                                                       Benchmark:                                       people to communicate with their family, friends, and coworkers. Facebook develops
Currency:                                  NASDAQ GS: FB, Currency: USD                                       S&P 500 INDEX (SPX)                              technologies that facilitate the sharing of information, photographs, website links, and
                                                                                                                                                               videos. Facebook users have the ability to share and restrict information based on their
Sector: Information Technology      Industry: Internet Software & Services                                       Year:                                         own specific criteria.

Telephone         1-650-308-7300                     Revenue (M)                                   5'089      Business Segments in USD                                 Sales (M)    Geographic Segments in USD                                  Sales (M)
Website           investor.fb.com                    No of Employees                               4'619      Advertising                                                  4279     US & Canada                                                     2520
Address           1601 Willow Road Menlo Park, CA 94025 United States                                         Payments and Other Fees                                        810    Europe                                                          1449
Share Price Performance in USD                                                                                                                                                      Asia                                                              606
Price                          #N/A N/A              1M Return                                  #VALUE!                                                                             Rest of World                                                     498
52 Week High                   #N/A N/A              6M Return                                  #VALUE!                                                                             Adjustments (Rounding)                                             16
52 Week Low                    #N/A N/A              52 Wk Return                               #VALUE!
52 Wk Beta                     #N/A N/A              YTD Return                                 #VALUE!
Credit Ratings
Bloomberg                    -                                                                                                                                                                            10%       0%
S&P                          -      Date              -                           Outlook                 -                     16%
Moody's                      -      Date              -                           Outlook                 -
Fitch                        -      Date              -                           Outlook                 -                                                                                       12%

Valuation Ratios
                         12/09     12/10      12/11          12/12      12/13E        12/14E      12/15E                                                                                                                                 50%
P/E                          -         -          -       2'662.0x            -             -           -
EV/EBIT                      -         -          -         103.9x            -             -           -
EV/EBITDA                    -         -          -          47.1x       17.2x         13.1x       10.1x
P/S                          -         -          -          10.5x         9.9x          7.8x        6.2x                                                                                          28%
P/B                          -         -          -            5.4x           -             -           -
Div Yield                    -         -          -           0.0%            -             -           -                                              84%
Profitability Ratios %
                       12/09       12/10      12/11         12/12       12/13E        12/14E      12/15E
Gross Margin            71.3        75.0       76.8          73.2         73.8          73.9        74.4                                                                                                     US & Canada
EBITDA Margin           43.8        59.3       56.0          23.3         50.9          53.1        55.0                                                                                                     Europe
Operating Margin        33.7        52.3       47.3          10.6         33.6          36.2        37.6
                                                                                                                             Advertising   Payments and Other Fees
Profit Margin           15.7        18.8       18.0           0.6         21.6          24.2        28.5                                                                                                     Asia
Return on Assets        15.1        18.2       14.3           0.3          8.7           9.8        13.2                                                                                                     Rest of World
Return on Equity        20.3        30.8       22.9           0.4          9.2          11.0        14.1
                                                                                                                                                                                                             Adjustments (Rounding)
Leverage and Coverage Ratios
                       12/09       12/10      12/11         12/12
Current Ratio               -        5.8        5.1          10.7                                             Current Capitalization in USD
Quick Ratio                 -        5.5        5.0           9.8                                             Common Shares Outstanding (M)                                                                                    2372.0
EBIT/Interest           26.2        46.9       41.8          10.5                                             Market Capitalization (M)                                                                                      #N/A N/A
Tot Debt/Capital            -        0.2        0.1           0.2                                             Cash and ST Investments (M)                                                                                      9626.0
Tot Debt/Equity             -        0.2        0.1           0.2                                             Total Debt (M)                                                                                                   2356.0
Eff Tax Rate %            9.8       39.9       41.0          89.3                                             Preferred Equity (M)                                                                                                 0.0
                                                                                                              LT Investments in Affiliate Companies (M)                                                                            0.0
                                                                                                              Investments (M)                                                                                                      0.0
                                                                                                              Enterprise Value (M)


                                                                                  Q.M.S Advisors | tel: +41 (0)78 922 08 77 | e-mail: info@qmsadv.com |
Company Analysis - Analysts Ratings
Facebook Inc
Target price in USD
Broker Recommendation


                                                                Buy and Sell Recommendations vs Price and Target Price


                                                                                                                                                                        Price
                                                                                                                                                                                                                             Brokers' Target Price
                                                                                                                                                                   50           50
                        100%                                                5%         5%                             5%           5%          5%
                                                                  8%                               7%      7%                                            8%
                                                     15%                                                                                                           45           45
                                                                                                                                                                   40           40
                        80%                                                                                           33%          30%
                                                                                                           32%                                36%                               35
                                                     23%                    44%       44%         40%                                                   36%
                                                                 45%                                                                                               35
                                                                                                                                                                                30
                        60%                                                                                                                                        30
                                                                                                                                                                                25
                                                                                                                                                                   25           20
                        40%                                                                                                                                        20           15
                                                     62%                                                   61%        63%          65%
                                                                                                                                              59%                  15           10
                                                                                                  52%                                                   56%
                                                                            51%       51%
                                                                 47%                                                                                                              5
                        20%                                                                                                                                        10
                                                                                                                                                                                  0
                                                                                                                                                                   5


                                                                                                                                                                                       Telsey Advisory
                                                                                                                                                                                       Morgan Stanley


                                                                                                                                                                                                Barclays


                                                                                                                                                                                         Lazard Capital
                                                                                                                                                                                           BMO Capital


                                                                                                                                                                                           Piper Jaffray
                                                                                                                                                                                      Raymond James


                                                                                                                                                                                        S&P Capital IQ
                                                                                                                                                                                        Credit Agricole


                                                                                                                                                                                       Atlantic Equities
                                                                                                                                                                                      Pivotal Research


                                                                                                                                                                                           RBC Capital


                                                                                                                                                                                              Macquarie

                                                                                                                                                                                        Sterne, Agee &
                                                                                                                                                                                               Evercore


                                                                                                                                                                                            Battle Road
                                                                                                                                                                                                  Cantor


                                                                                                                                                                                              JPMorgan


                                                                                                                                                                                          Credit Suisse


                                                                                                                                                                                            Cowen and
                                                                                                                                                                                             Sanford C.


                                                                                                                                                                                         Edward Jones


                                                                                                                                                                                         Stifel Nicolaus


                                                                                                                                                                                       Oppenheimer &
                                                                                                                                                                                                Nomura


                                                                                                                                                                                           Pacific Crest
                                                                                                                                                                                        Needham & Co


                                                                                                                                                                                      EVA Dimensions
                                                                                                                                                                                      IPOfinancial.com
                                                                                                                                                                                              BTIG LLC


                                                                                                                                                                                       Argus Research


                                                                                                                                                                                       Goldman Sachs
                                                                                                                                                                                        Deutsche Bank


                                                                                                                                                                                                Jefferies


                                                                                                                                                                                        Topeka Capital
                                                                                                                                                                                         William Blair &
                                                                                                                                                                                       Robert W. Baird


                                                                                                                                                                                           Wells Fargo


                                                                                                                                                                                       Wedge Partners
                                                                                                                                                                                               Wedbush
                         0%       0%        0%                                                                                                                     0
                                mars.12    avr.12   mai.12      juin.12    juil.12   août.12    sept.12   oct.12     nov.12      déc.12      janv.13   févr.13
                                                                          Buy        Hold          Sell      Price          Target Price

                               Date                    Buy                 Hold                 Sell                    Date                Price Target Price                  Broker                             Analyst                       Recommendation          Target      Date
                               28-Feb-13               56%                  36%                  8%                   4-Mar-13   #N/A N/A                  33.61                Robert W. Baird & Co               COLIN SEBASTIAN                      outperform         34.00    1-Mar-13
                               31-Jan-13               59%                  36%                  5%                   1-Mar-13   #N/A N/A                  33.61                Sanford C. Bernstein & Co          CARLOS KIRJNER                     market perform       27.00    1-Mar-13
                               31-Dec-12               65%                  30%                  5%                  28-Feb-13   #N/A N/A                  33.61                Cantor Fitzgerald                  YOUSSEF H SQUALI                         buy            35.00    1-Mar-13
                               30-Nov-12               63%                  33%                  5%                  27-Feb-13   #N/A N/A                  33.61                Morgan Stanley                     SCOTT W DEVITT                    Overwt/Attractive     34.00   28-Feb-13
                               31-Oct-12               61%                  32%                  7%                  26-Feb-13   #N/A N/A                  33.61                Needham & Co                       LAURA A MARTIN                           buy            33.00   22-Feb-13
                               28-Sep-12               52%                  40%                  7%                  25-Feb-13   #N/A N/A                  33.61                BTIG LLC                           RICHARD GREENFIELD                       sell           22.00   14-Feb-13
                               31-Aug-12               51%                  44%                  5%                  22-Feb-13   #N/A N/A                  33.61                Pivotal Research Group LLC         BRIAN WIESER                             buy            36.00   12-Feb-13
                               31-Jul-12               51%                  44%                  5%                  21-Feb-13   #N/A N/A                  33.61                Telsey Advisory Group              THOMAS FORTE                      no rating system      38.00   10-Feb-13
                               29-Jun-12               47%                  45%                  8%                  20-Feb-13   #N/A N/A                  33.61                JPMorgan                           DOUGLAS ANMUTH                       overweight         35.00    4-Feb-13
                               31-May-12               62%                  23%                 15%                  19-Feb-13   #N/A N/A                  33.61                Wells Fargo Securities, LLC        JASON MAYNARD                        outperform                  4-Feb-13
                               30-Apr-12              #DIV/0!              #DIV/0!             #DIV/0!               18-Feb-13   #N/A N/A                  33.61                Argus Research Corp                JOSEPH F BONNER                          hold                    1-Feb-13
                               30-Mar-12              #DIV/0!              #DIV/0!             #DIV/0!               15-Feb-13   #N/A N/A                  33.61                BMO Capital Markets                DANIEL SALMON                      market perform       32.00   31-Jan-13
                                                                                                                     14-Feb-13   #N/A N/A                  33.61                Deutsche Bank                      ROSS SANDLER                             buy            37.00   31-Jan-13
                                                                                                                     13-Feb-13   #N/A N/A                  33.61                Goldman Sachs                      HEATHER BELLINI                     Buy/Neutral         40.00   31-Jan-13
                                                                                                                     12-Feb-13   #N/A N/A                  33.61                RBC Capital Markets                MARK S MAHANEY                       outperform         32.00   31-Jan-13
                                                                                                                     11-Feb-13   #N/A N/A                  34.26                Credit Suisse                      STEPHEN JU                             neutral          31.00   31-Jan-13
                                                                                                                      8-Feb-13   #N/A N/A                  34.26                Edward Jones                       JOSH OLSON                               buy                    31-Jan-13
                                                                                                                      7-Feb-13   #N/A N/A                  34.26                Jefferies                          BRIAN J PITZ                             hold           30.00   31-Jan-13
                                                                                                                      6-Feb-13   #N/A N/A                  34.26                Wedbush                            MICHAEL PACHTER                      outperform         35.00   31-Jan-13
                                                                                                                      5-Feb-13   #N/A N/A                  34.26                William Blair & Co                 RALPH SCHACKART                      outperform                 31-Jan-13
                                                                                                                      4-Feb-13   #N/A N/A                  34.26                Raymond James                      AARON M KESSLER                      outperform         37.00   31-Jan-13
                                                                                                                      1-Feb-13   #N/A N/A                  34.29                Macquarie                          BENJAMIN A SCHACHTER                 outperform         30.00   31-Jan-13
                                                                                                                     31-Jan-13   #N/A N/A                  34.29                Stifel Nicolaus                    JORDAN ROHAN                             hold                   31-Jan-13
                                                                                                                     30-Jan-13   #N/A N/A                  33.86                Sterne, Agee & Leach               ARVIND BHATIA                            buy            37.00   31-Jan-13
                                                                                                                     29-Jan-13   #N/A N/A                  33.72                Evercore Partners                  KEN SENA                            equalweight         32.00   31-Jan-13
                                                                                                                     28-Jan-13   #N/A N/A                  33.82                Oppenheimer & Co                   JASON S HELFSTEIN                    outperform         33.00   31-Jan-13
                                                                                                                     25-Jan-13   #N/A N/A                  33.67                Nomura                             BRIAN NOWAK                              buy            32.00   31-Jan-13
                                                                                                                     24-Jan-13   #N/A N/A                  33.32                Cowen and Company                  JOHN BLACKLEDGE                        neutral                  31-Jan-13
                                                                                                                     23-Jan-13   #N/A N/A                  33.32                S&P Capital IQ                     SCOTT H KESSLER                          hold           31.00   31-Jan-13
                                                                                                                     22-Jan-13   #N/A N/A                  33.32                Credit Agricole Securities (USA)   JAMES LEE                                buy            40.00   31-Jan-13

                                                                                                                 Q.M.S Advisors | tel: +41 (0)78 922 08 77 | e-mail: info@qmsadv.com |
04.03.2013


Facebook Inc
                                                                              Company Analysis - Ownership
                                                                                     Ownership Type
Ownership Statistics                                                                                                                  Geographic Ownership Distribution                                           Geographic Ownership
                                                                                          2%
Shares Outstanding (M)                         2372.0                                                                                 United States                             83.30%
Float                                           96.8%                                                                                 Britain                                   5.34%                                   1% 1% 1% 2%
                                                                                                                                                                                                                2%
Short Interest (M)                                25.4                                                                                Unknown Country                           4.71%                          5%
Short Interest as % of Float                    1.11%                                                                                 Luxembourg                                1.53%
                                                                                                                                                                                                               5%
Days to Cover Shorts                              0.48                                                                                Japan                                     1.29%
Institutional Ownership                        51.60%               46%                                       52%                     Switzerland                               0.82%
Retail Ownership                               46.03%                                                                                 Germany                                   0.60%
Insider Ownership                               2.36%                                                                                 Others                                    2.42%

                                                                                                                                      Institutional Ownership Distribution                                                                 83%
                                                                                                                                      Investment Advisor                        76.43%
                                                                                                                                      Hedge Fund Manager                        12.06%
                                                                                                                                      Individual                                4.38%
                                                                                                                                                                                                      United States        Britain           Unknown Country
                                                           Institutional Ownership      Retail Ownership   Insider Ownership          Venture Capital                           2.53%
                                                                                                                                                                                                      Luxembourg           Japan             Switzerland
Pricing data is in USD                                                                                                                Others                                    4.61%                 Germany              Others
Top 20 Owners:                 TOP 20 ALL

                                                                                                                                                                                                                  Institutional Ownership
Holder Name                                    Position   Position Change                      Market Value          % of Ownership   Report Date                  Source       Country
FMR LLC                                     77'644'473         37'380'569                                                 4.61%                      31.12.2012   ULT-AGG    UNITED STATES                                     5%
                                                                                                                                                                                                                   3%
CAPITAL GROUP COMPAN                        39'095'420         15'722'220                                                 2.32%                      31.12.2012   ULT-AGG    UNITED STATES
                                                                                                                                                                                                                  4%
MORGAN STANLEY                              33'281'620          6'803'009                                                 1.98%                      31.12.2012   ULT-AGG    UNITED STATES
T ROWE PRICE ASSOCIA                        33'193'967         13'789'661                                                 1.97%                      31.12.2012     13F      UNITED STATES
SANDS CAPITAL MANAGE                        26'797'536          9'685'751                                                 1.59%                      31.12.2012     13F      UNITED STATES                     12%
VANGUARD GROUP INC                          26'311'904         12'411'139                                                 1.56%                      31.12.2012     13F      UNITED STATES
BLACKROCK                                   22'993'914          6'546'408                                                 1.37%                      28.02.2013   ULT-AGG    UNITED STATES
JENNISON ASSOCIATES                         22'376'854          9'675'216                                                 1.33%                      31.12.2012     13F      UNITED STATES
UBS                                         21'977'538          5'431'928                                                 1.30%                      31.12.2012   ULT-AGG                                                                  76%
WINSLOW CAPITAL MANA                        21'263'110         21'263'110                                                 1.26%                      31.12.2012     13F      UNITED STATES
BAILLIE GIFFORD AND                         20'578'390            364'134                                                 1.22%                      31.12.2012     13F         BRITAIN
WELLINGTON MANAGEMEN                        20'370'317         20'370'317                                                 1.21%                      31.12.2012     13F      UNITED STATES
GOLDMAN SACHS GROUP                         18'422'852        -20'142'720                                                 1.09%                      31.12.2012     13F      UNITED STATES
INVESCO LTD                                 18'204'867         17'235'166                                                 1.08%                      31.12.2012     13F      UNITED STATES   Investment Advisor       Hedge Fund Manager    Individual
                                                                                                                                                                                             Venture Capital          Others
AMERIPRISE FINANCIAL                        18'122'565         17'425'168                                                 1.08%                      31.12.2012     13F      UNITED STATES
SANDBERG SHERYL KARA                        17'806'956           -176'452                                                 1.06%                      21.02.2013    Form 4         n/a
ELEVATION MANAGEMENT                        16'989'027         16'989'027                                                 1.01%                      31.12.2012     13F      UNITED STATES
MERITECH CAPITAL ASS                        16'268'858         16'268'858                                                 0.97%                      31.12.2012   ULT-AGG    UNITED STATES
ALLIANZ ASSET MANAGE                        14'465'499          4'414'890                                                 0.86%                      31.01.2013   ULT-AGG      GERMANY
MACKAY SHIELDS LLC                          14'176'100          1'643'500                                                 0.84%                      31.12.2012   MF-AGG     UNITED STATES
Top 5 Insiders:


Holder Name                                   Position    Position Change                      Market Value          % of Ownership   Report Date                  Source
SANDBERG SHERYL KARA                        17'806'956            -176'452                                                 1.06%                     21.02.2013    Form 4
BREYER JAMES W                               9'166'654          -3'000'000                                                 0.54%                     04.02.2013    Form 4
ANDREESSEN MARC LOWELL                       6'842'256              15'344                                                 0.41%                     20.02.2013    Form 4
EBERSMAN DAVID A                             2'263'500              35'519                                                 0.13%                     20.02.2013    Form 4
SCHROEPFER MICHAEL TODD                      1'271'705             -55'000                                                 0.08%                     25.02.2013    Form 4


                                                                               Q.M.S Advisors | tel: +41 (0)78 922 08 77 | e-mail: info@qmsadv.com |
Company Analysis - Financials I/IV
Facebook Inc
Financial information is in USD (M)                                                                                                                                             Equivalent Estimates
Periodicity:             Fiscal Year                 12/02         12/03    12/04      12/05        12/06       12/07        12/08       12/09       12/10   12/11   12/12   12/13E      12/14E        12/15E
Income Statement
Revenue                                                                                                           153          272         777       1'974   3'711   5'089    6'678       8'435        10'561
  - Cost of Goods Sold                                                                                             41          124         223         493     860   1'364

Gross Income                                                                                                      112          148         554       1'481   2'851   3'725    4'928       6'235         7'853
  - Selling, General & Admin Expenses                                                                             236          203         292         449   1'095   3'187
          (Research & Dev Costs)                                                                                   81           47          87         144     388   1'399

Operating Income                                                                                                  -124         -55         262       1'032   1'756    538     2'245       3'049         3'974
  - Interest Expense                                                                                                                        10          22      42     51
  - Foreign Exchange Losses (Gains)
  - Net Non-Operating Losses (Gains)                                                                               11            1           -2         2      19       -7

Pretax Income                                                                                                     -135         -56         254       1'008   1'695    494     2'133       2'904         4'038
  - Income Tax Expense                                                                                               3           0          25         402     695    441

Income Before XO Items                                                                                            -138         -56         229        606    1'000     53
   - Extraordinary Loss Net of Tax
   - Minority Interests                                                                                                                    107        234     332      21

Diluted EPS Before XO Items                                                                                     (0.16)       (0.06)       0.10       0.28    0.46    0.01

Net Income Adjusted*                                                                                                                                                 1'137    1'444       2'039         3'011
EPS Adjusted                                                                                                                                                         0.52     0.57        0.78          1.07
Dividends Per Share                                                                                              0.00        0.00         0.00       0.00    0.00    0.00     0.00        0.00          0.00
        Payout Ratio %                                                                                                                     0.0        0.0     0.0      0.0    0.00        0.00          0.00

Total Shares Outstanding                                                                                                                             1'112   1'330   2'372
Diluted Shares Outstanding                                                                                                                1'366      1'414   1'508   2'166

EBITDA                                                                                                                                     340       1'171   2'079   1'187    3'400       4'480         5'808

*Net income excludes extraordinary gains and losses and one-time charges.


                                                                             Q.M.S Advisors | tel: +41 (0)78 922 08 77 | e-mail: info@qmsadv.com |
Company Analysis - Financials II/IV
Periodicity:                           12/02   12/03   12/04      12/05        12/06       12/07        12/08       12/09       12/10   12/11   12/12    12/13E   12/14E   12/15E
Balance Sheet
Total Current Assets                                                                                                            2246    4604    11267
  + Cash & Near Cash Items                                                                   305          297         633       1'785   1'512    2'384
  + Short Term Investments                                                                                                          0   2'396    7'242
  + Accounts & Notes Receivable                                                                                                   373     547      719
  + Inventories                                                                                                                     0       0        0
  + Other Current Assets                                                                                                           88     149      922

Total Long-Term Assets                                                                        82          131         148        744    1'727    3'836
  + Long Term Investments
         Gross Fixed Assets                                                                                                      820    1'925    3'273
         Accumulated Depreciation                                                                                                246      450      882
  + Net Fixed Assets                                                                          82          131         148        574    1'475    2'391
  + Other Long Term Assets                                                                                                       170      252    1'445

Total Current Liabilities                                                                                                        389     899     1'052
  + Accounts Payable                                                                                                              29      63        65
  + Short Term Borrowings                                                                                                        106     279       365
  + Other Short Term Liabilities                                                                                                 254     557       622

Total Long Term Liabilities                                                                                                      439     533     2'296
  + Long Term Borrowings                                                                                                         367     398     1'991
  + Other Long Term Borrowings                                                                                                    72     135       305

Total Liabilities                                                                                                                828    1'432    3'348
  + Long Preferred Equity                                                                                                        615      615        0
  + Minority Interest                                                                                                                                0
  + Share Capital & APIC                                                                                                         947    2'684   10'094
  + Retained Earnings & Other Equity                                                         273          335         868        600    1'600    1'661

Total Shareholders Equity                                                                    273          335         868       2'162   4'899   11'755

Total Liabilities & Equity                                                                                                      2'990   6'331   15'103

Book Value Per Share                                                                                                             1.39    3.22     4.96     5.43     6.18     7.29
  Tangible Book Value Per Share                                                                                                  1.22    3.04     4.37


                                                        Q.M.S Advisors | tel: +41 (0)78 922 08 77 | e-mail: info@qmsadv.com |
Company Analysis - Financials III/IV
Periodicity:                           12/02   12/03   12/04      12/05        12/06       12/07        12/08       12/09       12/10   12/11    12/12    12/13E   12/14E   12/15E
Cash Flows
Net Income                                                                                                            122         372     668       32      898     1'377    2'311
  + Depreciation & Amortization                                                                                        78         139     323      649
  + Other Non-Cash Adjustments                                                                                        135         294     568    1'467
  + Changes in Non-Cash Capital                                                                                      -180        -107     -10     -536

Cash From Operating Activities                                                                                        155        698    1'549    1'612
  + Disposal of Fixed Assets
  + Capital Expenditures                                                                                               -33       -293     -606   -1'235   -1'604   -1'714   -1'823
  + Increase in Investments                                                                                              0          0       -3       -2
  + Decrease in Investments                                                                                                                  0        0
  + Other Investing Activities                                                                                         -29        -31   -2'414   -5'787

Cash From Investing Activities                                                                                         -62       -324   -3'023   -7'024
  + Dividends Paid
  + Change in Short Term Borrowings                                                                                                         0    1'496
  + Increase in Long Term Borrowings                                                                                    0        250        0        0
  + Decrease in Long Term Borrowings                                                                                    0          0     -250        0
  + Increase in Capital Stocks                                                                                        260        621    1'459    7'810
  + Decrease in Capital Stocks
  + Other Financing Activities                                                                                         -17        -93       -8   -3'022

Cash From Financing Activities                                                                                        243        778    1'201    6'284

Net Changes in Cash                                                                                                   336       1'152    -273      872

Free Cash Flow (CFO-CAPEX)                                                                                            122        405      943      377      408      829     1'356

Free Cash Flow To Firm                                                                                                131        418     968       382
Free Cash Flow To Equity                                                                                                                 693     1'258
Free Cash Flow per Share                                                                                              0.12       0.37    0.73     0.19


                                                        Q.M.S Advisors | tel: +41 (0)78 922 08 77 | e-mail: info@qmsadv.com |
Company Analysis - Financials IV/IV
Periodicity:                         12/02   12/03   12/04      12/05        12/06       12/07        12/08       12/09       12/10   12/11     12/12    12/13E   12/14E   12/15E
Ratio Analysis

Valuation Ratios
  Price Earnings                                                                                                                              2'662.0x
  EV to EBIT                                                                                                                                    103.9x
  EV to EBITDA                                                                                                                                   47.1x    17.2x    13.1x    10.1x
  Price to Sales                                                                                                                                 10.5x     9.9x     7.8x     6.2x
  Price to Book                                                                                                                                   5.4x
  Dividend Yield                                                                                                                                 0.0%

Profitability Ratios
  Gross Margin                                                                           73.2%        54.4%       71.3%       75.0%   76.8%     73.2%    73.8%    73.9%    74.4%
  EBITDA Margin                                                                                                   43.8%       59.3%   56.0%     23.3%    50.9%    53.1%    55.0%
  Operating Margin                                                                      -81.0%       -20.2%       33.7%       52.3%   47.3%     10.6%    33.6%    36.2%    37.6%
  Profit Margin                                                                         -90.2%       -20.6%       15.7%       18.8%   18.0%      0.6%    21.6%    24.2%    28.5%
  Return on Assets                                                                                   -11.8%       15.1%       18.2%   14.3%      0.3%     8.7%     9.8%    13.2%
  Return on Equity                                                                                   -18.4%       20.3%       30.8%   22.9%      0.4%     9.2%    11.0%    14.1%

Leverage & Coverage Ratios
  Current Ratio                                                                                                                5.77    5.12     10.71
  Quick Ratio                                                                                                                  5.55    4.96      9.83
  Interest Coverage Ratio (EBIT/I)                                                                                26.20       46.91   41.81     10.55
  Tot Debt/Capital                                                                                                             0.18    0.12      0.17
  Tot Debt/Equity                                                                                                              0.22    0.14      0.20

Others
  Asset Turnover                                                                                       0.57         0.96       0.96    0.80      0.47
  Accounts Receivable Turnover                                                                                                         8.07      8.04
  Accounts Payable Turnover                                                                                                           18.70     21.31
  Inventory Turnover

  Effective Tax Rate                                                                                               9.8%       39.9%   41.0%     89.3%


                                                      Q.M.S Advisors | tel: +41 (0)78 922 08 77 | e-mail: info@qmsadv.com |
Company Analysis - Peers Comparision
                                                                                                                       #N/A Invalid
                                         FACEBOOK INC-A       GOOGLE INC-CL A    TWITTER INC        MYSPACE INC                              CRAIGSLIST           YELP INC           MICROSOFT CORP IAC/INTERACTIVEC       APPLE INC        YAHOO! INC        EBAY INC        AOL INC         AMAZON.COM INC    GROUPON INC
                                                                                                                         Security

Latest Fiscal Year:                             12/2012              12/2012           12/2011                    -                    -                   -           12/2012              06/2012             12/2012        09/2012           12/2012          12/2012        12/2012             12/2012          12/2012
52-Week High                                          -                814.47                -                    -                    -                   -                 -                 32.95               55.57         705.07             22.62            57.27          39.75              284.72            19.21
52-Week High Date                                     -            04.03.2013                -                    -                    -                   -                 -            16.03.2012          16.10.2012     21.09.2012        04.03.2013       01.02.2013     19.02.2013          25.01.2013       05.03.2012
52-Week Low                                           -                556.52                -                    -                    -                   -                 -                 26.26               38.20         424.55             14.35            34.83          14.49              178.04              2.60
52-Week Low Date                                      -            14.06.2012                -                    -                    -                   -                 -            05.12.2012          24.01.2013     04.03.2013        06.03.2012       06.03.2012     06.03.2012          06.03.2012       12.11.2012
Daily Volume                                          0               872'724                0                    0                    -                   0                 0             6'245'098             175'767      5'380'198        10'465'454        2'539'774        204'422             732'834       11'541'690
  Current Price (3/dd/yy)                               -              813.71                  -                  -                    -                   -                     -             27.79              40.76          424.68             22.36           54.59           37.09             268.84              5.24
  52-Week High % Change                                   -              -0.1%                 -                  -                    -                   -                     -            -15.7%             -26.7%          -39.8%              -1.2%            -4.7%         -6.7%               -5.6%          -72.7%
  52-Week Low % Change                                    -             46.2%                  -                  -                    -                   -                     -              5.8%               6.7%            0.0%             55.8%            56.7%         155.9%              51.0%           101.5%
Total Common Shares (M)                         2'372.0                 330.0                  -                  -                    -                   -                     -           8'381.0               87.6           939.2           1'182.7          1'294.0           76.6              454.0            656.9
  Market Capitalization                                 -          269'449.8                   -                  -                    -                   -                     -        232'734.0             3'434.5      398'800.1          26'439.6         70'776.6        2'860.1           122'201.5          3'436.0
Total Debt                                      2'356.0               5'537.0                  -                  -                    -                  -                -                11'944.0              595.8             -                 -            4'519.0          105.9            4'218.0               -
Preferred Stock                                     -                     -                    -                  -                    -                  -                -                     -                  -               -                 -                -              -                  -                 -
Minority Interest                                   -                     -                    -                  -                    -                  -                -                     -                110.0             -                45.4              -             13.1                -                (1.9)
Cash and Equivalents                            9'626.0              49'557.0                  -                  -                    -                  -               95.1              63'040.0              770.6       121'251.0           6'022.4          9'408.0          466.6           11'448.0           1'209.3
   Enterprise Value                                     -          225'429.9                   -                  -                    -                   -                     -        178'610.0             3'369.8      261'688.1          20'462.6         65'887.6        2'512.5           114'971.5          2'224.7
                                                                                                                                                                 Valuation
Total Revenue                      LFY          5'089.0              50'175.0                   -                  -                    -                  -             137.6              73'723.0            2'800.9       156'508.0           4'986.6        14'072.0         2'191.7           61'093.0           2'334.5
                                  LTM           5'089.0              51'379.0                  -                  -                    -                  -              137.6              72'930.0            2'800.9       164'687.0           4'986.6        14'071.0         2'191.7           61'093.0           2'334.5
                                 CY+1           6'677.7              49'451.2                  -                  -                    -                  -              211.4              79'605.0            3'253.9       182'372.5           4'674.1        16'345.5         2'222.9           75'751.6           2'561.5
                                 CY+2           8'434.7              57'163.0                  -                  -                    -                  -              294.9              86'100.8            3'636.6       205'752.0           4'845.7        18'730.9         2'289.2           93'067.6           2'833.0
EV/Total Revenue                   LFY             11.0x                  3.8x                  -                  -                    -                  -                8.0x                 2.3x               1.5x            2.2x               3.5x           4.3x            0.9x               1.7x              0.8x
                                  LTM              11.0x                  3.7x                  -                  -                    -                  -                8.0x                 2.3x               1.5x            2.1x               3.5x           4.3x            0.9x               1.7x              0.8x
                                 CY+1               8.5x                  4.4x                  -                  -                    -                  -                    -                2.0x               0.9x            1.5x               4.6x           3.9x            1.1x               1.5x              0.8x
                                 CY+2               6.6x                  3.6x                  -                  -                    -                  -                    -                1.6x               0.8x            1.3x               4.2x           3.2x            0.8x               1.2x              0.6x
EBITDA                             LFY          1'187.0              15'722.0                   -                  -                    -                  -              (10.3)            30'923.0              411.8        58'518.0           1'457.1         4'088.0           330.0            2'835.0             155.4
                                  LTM           1'187.0              15'684.0                  -                  -                    -                  -               (10.3)            29'120.0              411.8        59'255.0           1'457.1         4'090.0           330.0            2'834.0             143.7
                                 CY+1           3'400.1              22'087.3                  -                  -                    -                  -                21.1             32'414.5              613.6        60'649.2           1'664.4         5'383.4           427.3            4'646.4             254.9
                                 CY+2           4'479.8              25'944.5                  -                  -                    -                  -                46.6             35'504.1              711.8        68'430.3           1'740.8         6'241.8           449.4            6'384.0             319.3
EV/EBITDA                          LFY             47.1x                 12.0x                  -                  -                    -                  -            -107.2x                  5.5x               9.9x            5.8x             12.0x           14.9x            5.8x              37.6x             12.8x
                                  LTM              47.1x                 12.1x                  -                  -                    -                  -                    -                5.8x               9.9x            5.8x             12.0x           14.9x            5.8x              37.6x             13.8x
                                 CY+1              16.7x                  9.9x                  -                  -                    -                  -                    -                5.0x               5.0x            4.5x             12.9x           11.9x            5.6x              24.6x              7.8x
                                 CY+2              12.4x                  7.8x                  -                  -                    -                  -                    -                3.9x               3.9x            3.8x             11.7x            9.6x            4.3x              17.1x              5.2x
EPS                                LFY              0.01                 34.02                  -                  -                    -                  -                    -                2.73               2.02           44.15              1.17            1.95            4.81               0.05             -0.03
                                  LTM               0.02                 33.74                  -                  -                    -                  -                    -                2.56               2.04           44.10              1.17            1.94            4.64               0.36             -0.08
                                 CY+1              0.57                 45.71                  -                  -                    -                  -                0.09                 2.85               3.55           44.55              1.16            2.75            1.93               3.13              0.20
                                 CY+2              0.78                 53.86                  -                  -                    -                  -                0.37                 3.15               4.24           50.73              1.27            3.21            2.18               5.54              0.29
P/E                                LFY                  -                24.1x                  -                  -                    -                  -                    -               10.9x              20.0x            9.6x             19.1x           28.1x            8.0x            746.8x                   -
                                  LTM                   -                24.1x                  -                  -                    -                  -                    -               10.9x              20.0x            9.6x             19.1x           28.1x            8.0x            746.8x                   -
                                 CY+1                   -                17.8x                  -                  -                    -                  -                    -                9.7x              11.5x            9.5x             19.4x           19.8x           19.2x              85.9x             26.3x
                                 CY+2                   -                15.1x                  -                  -                    -                  -                    -                8.8x               9.6x            8.4x             17.6x           17.0x           17.0x              48.6x             18.1x
Revenue Growth                  1 Year            37.1%                 32.4%                   -                  -                    -                  -             65.2%                  5.4%              36.0%           44.6%               0.0%          20.8%           (0.5%)             27.1%             45.0%
                                5 Year                  -               24.7%                   -                  -                    -                  -                    -               5.7%              16.3%           41.5%             (5.8%)          13.7%                 -            30.6%                   -
EBITDA Growth                   1 Year          (42.9%)                 15.7%                   -                  -                    -                  -             13.9%                  3.3%              48.9%           64.4%             (1.1%)          23.4%           (2.5%)             45.8%                   -
                                5 Year                  -               21.0%                   -                  -                    -                  -                    -               9.1%              89.0%           65.4%               1.5%           9.4%         (30.0%)              25.8%                   -
EBITDA Margin                     LTM             23.3%                 30.5%                   -                  -                    -                  -             (7.5%)                39.9%              14.7%           36.0%             29.2%           29.1%           15.1%               4.6%              6.2%
                                 CY+1             50.9%                 44.7%                   -                  -                    -                  -             10.0%                 40.7%              18.9%           33.3%             35.6%           32.9%           19.2%               6.1%             10.0%
                                 CY+2             53.1%                 45.4%                   -                  -                    -                  -             15.8%                 41.2%              19.6%           33.3%             35.9%           33.3%           19.6%               6.9%             11.3%
                                                                                                                                                        Leverage/Coverage Ratios
Total Debt / Equity %                             20.0%                  7.7%                  -                  -                    -                   -                 0.0%             18.0%              36.0%              0.0%             0.0%           21.7%             5.0%             51.5%              0.0%
Total Debt / Capital %                            16.7%                  7.2%                  -                  -                    -                   -                 0.0%             15.3%              25.2%              0.0%             0.0%           17.8%             4.7%             34.0%              0.0%
Total Debt / EBITDA                               1.985x               0.353x                  -                  -                    -                   -                     -            0.487x             1.447x           0.000x           0.000x           1.105x          0.321x             1.488x           0.000x
Net Debt / EBITDA                                -6.125x              -2.807x                  -                  -                    -                   -                     -           -1.859x            -0.424x          -2.314x          -4.133x          -1.195x         -1.093x            -2.551x          -8.416x
EBITDA / Int. Expense                            23.275x             187.167x                  -                  -                    -                   -                     -           81.376x            50.928x                 -                -         64.889x                -           30.815x                 -
                                                                                                                                                               Credit Ratings
S&P LT Credit Rating                                   -                  AA                   -                  -                    -                  -                     -               AAA                 BB+             NR                NR                A                -                AA-                 -
S&P LT Credit Rating Date                               -          19.11.2012                   -                  -                    -                  -                     -        22.09.2008          17.12.2012     16.04.2004        18.04.2008       02.03.2010                -        26.11.2012                  -
Moody's LT Credit Rating                               -                 Aa2                   -                  -                    -                  -                     -               Aaa                 Ba3             WR                  -              A2                -              Baa1                  -
Moody's LT Credit Rating Date                           -          16.05.2011                   -                  -                    -                  -                     -        11.05.2009          21.08.2008     31.03.2004                  -      21.10.2010                -        26.11.2012                  -


                                                                                                                                      Q.M.S Advisors | tel: +41 (0)78 922 08 77 | e-mail: info@qmsadv.com |

Mais conteúdo relacionado

Destaque

Business Strategy Analysis on Facebook
Business Strategy Analysis on FacebookBusiness Strategy Analysis on Facebook
Business Strategy Analysis on FacebookShanker Naik
 
Facebook Financial Analysis May 2014
Facebook Financial Analysis May 2014Facebook Financial Analysis May 2014
Facebook Financial Analysis May 2014Theodore Le
 
Facebook Case Study + Solutions 2013
Facebook Case Study + Solutions 2013Facebook Case Study + Solutions 2013
Facebook Case Study + Solutions 2013André L. Campino
 
SWOT and PESTLE analysis of Facebook
SWOT and PESTLE analysis of FacebookSWOT and PESTLE analysis of Facebook
SWOT and PESTLE analysis of FacebookMouad Gouffia
 
Vision, Mission, Goals and Objectives: What's the Difference?
Vision, Mission, Goals and Objectives:  What's the Difference?Vision, Mission, Goals and Objectives:  What's the Difference?
Vision, Mission, Goals and Objectives: What's the Difference?Johan Koren
 

Destaque (8)

Business Strategy Analysis on Facebook
Business Strategy Analysis on FacebookBusiness Strategy Analysis on Facebook
Business Strategy Analysis on Facebook
 
Facebook Financial Analysis May 2014
Facebook Financial Analysis May 2014Facebook Financial Analysis May 2014
Facebook Financial Analysis May 2014
 
Facebook - Strategic Analysis
Facebook - Strategic AnalysisFacebook - Strategic Analysis
Facebook - Strategic Analysis
 
Facebook Case Study + Solutions 2013
Facebook Case Study + Solutions 2013Facebook Case Study + Solutions 2013
Facebook Case Study + Solutions 2013
 
Facebook case study
Facebook case study Facebook case study
Facebook case study
 
SWOT and PESTLE analysis of Facebook
SWOT and PESTLE analysis of FacebookSWOT and PESTLE analysis of Facebook
SWOT and PESTLE analysis of Facebook
 
Financial analysis facebook
Financial analysis facebookFinancial analysis facebook
Financial analysis facebook
 
Vision, Mission, Goals and Objectives: What's the Difference?
Vision, Mission, Goals and Objectives:  What's the Difference?Vision, Mission, Goals and Objectives:  What's the Difference?
Vision, Mission, Goals and Objectives: What's the Difference?
 

Semelhante a Financial Analysis - Facebook Inc. operates a social networking website. The Company's website allows people to communicate with their family, friends, and coworkers

Financial Analysis - LinkedIn Corporation operates a social networking websit...
Financial Analysis - LinkedIn Corporation operates a social networking websit...Financial Analysis - LinkedIn Corporation operates a social networking websit...
Financial Analysis - LinkedIn Corporation operates a social networking websit...BCV
 
Financial analysis nobel biocare holding ag develops and produces dental im...
Financial analysis   nobel biocare holding ag develops and produces dental im...Financial analysis   nobel biocare holding ag develops and produces dental im...
Financial analysis nobel biocare holding ag develops and produces dental im...BCV
 
Financial Analysis - Prysmian SP¨a develops, designs, produces, supplies a…
Financial Analysis - Prysmian SP¨a develops, designs, produces, supplies a…Financial Analysis - Prysmian SP¨a develops, designs, produces, supplies a…
Financial Analysis - Prysmian SP¨a develops, designs, produces, supplies a…BCV
 
Fundamental Analysis & Financial Analyst Recommandations - Google Inc - US382...
Fundamental Analysis & Financial Analyst Recommandations - Google Inc - US382...Fundamental Analysis & Financial Analyst Recommandations - Google Inc - US382...
Fundamental Analysis & Financial Analyst Recommandations - Google Inc - US382...BCV
 
Financial analysis - MBIA Inc. provides financial guarantee insurance and …
Financial analysis - MBIA Inc. provides financial guarantee insurance and …Financial analysis - MBIA Inc. provides financial guarantee insurance and …
Financial analysis - MBIA Inc. provides financial guarantee insurance and …BCV
 
Financial Analysis - Herbalife Ltd. is a network marketing company that sell...
 Financial Analysis - Herbalife Ltd. is a network marketing company that sell... Financial Analysis - Herbalife Ltd. is a network marketing company that sell...
Financial Analysis - Herbalife Ltd. is a network marketing company that sell...BCV
 
Financial Analysis - National Oilwell Varco Inc. is a worldwide provider of e...
Financial Analysis - National Oilwell Varco Inc. is a worldwide provider of e...Financial Analysis - National Oilwell Varco Inc. is a worldwide provider of e...
Financial Analysis - National Oilwell Varco Inc. is a worldwide provider of e...BCV
 
Financial Analysis - American International Group, Inc. is an internationa…
Financial Analysis - American International Group, Inc. is an internationa…Financial Analysis - American International Group, Inc. is an internationa…
Financial Analysis - American International Group, Inc. is an internationa…BCV
 
Financial Analysis - Zhejiang Expressway Co., ltd., through its subsidiari…
Financial Analysis - Zhejiang Expressway Co., ltd., through its subsidiari…Financial Analysis - Zhejiang Expressway Co., ltd., through its subsidiari…
Financial Analysis - Zhejiang Expressway Co., ltd., through its subsidiari…BCV
 
Financial Analysis - Two Harbors Investment Corporation is a re…
Financial Analysis - Two Harbors Investment Corporation is a re…Financial Analysis - Two Harbors Investment Corporation is a re…
Financial Analysis - Two Harbors Investment Corporation is a re…BCV
 
Financial analysis goldcorp, inc. is engaged in the acquisition, exploratio...
Financial analysis   goldcorp, inc. is engaged in the acquisition, exploratio...Financial analysis   goldcorp, inc. is engaged in the acquisition, exploratio...
Financial analysis goldcorp, inc. is engaged in the acquisition, exploratio...BCV
 
Financial Analysis - Assured Guaranty Ltd. provides financial guaranty insura...
Financial Analysis - Assured Guaranty Ltd. provides financial guaranty insura...Financial Analysis - Assured Guaranty Ltd. provides financial guaranty insura...
Financial Analysis - Assured Guaranty Ltd. provides financial guaranty insura...BCV
 
Financial Analysis - Technip SA designs and constructs industrial facilities....
Financial Analysis - Technip SA designs and constructs industrial facilities....Financial Analysis - Technip SA designs and constructs industrial facilities....
Financial Analysis - Technip SA designs and constructs industrial facilities....BCV
 
Financial analysis total sa - total sa explores for, produces, refines, tra...
Financial analysis   total sa - total sa explores for, produces, refines, tra...Financial analysis   total sa - total sa explores for, produces, refines, tra...
Financial analysis total sa - total sa explores for, produces, refines, tra...BCV
 
Financial analysis adecoagro sa - adecoagro s.a. is an agricultural company...
Financial analysis   adecoagro sa - adecoagro s.a. is an agricultural company...Financial analysis   adecoagro sa - adecoagro s.a. is an agricultural company...
Financial analysis adecoagro sa - adecoagro s.a. is an agricultural company...BCV
 
Financial Analysis - PetroChina Company Limited explores, develops, and produ...
Financial Analysis - PetroChina Company Limited explores, develops, and produ...Financial Analysis - PetroChina Company Limited explores, develops, and produ...
Financial Analysis - PetroChina Company Limited explores, develops, and produ...BCV
 
Financial Analysis - EFG Financial Products Holding AG provides financial ser...
Financial Analysis - EFG Financial Products Holding AG provides financial ser...Financial Analysis - EFG Financial Products Holding AG provides financial ser...
Financial Analysis - EFG Financial Products Holding AG provides financial ser...BCV
 
Financial Analysis - China Communications Construction Company Ltd. is a tran...
Financial Analysis - China Communications Construction Company Ltd. is a tran...Financial Analysis - China Communications Construction Company Ltd. is a tran...
Financial Analysis - China Communications Construction Company Ltd. is a tran...BCV
 
Financial Analysis - China State Construction Engineering Corporation Limited...
Financial Analysis - China State Construction Engineering Corporation Limited...Financial Analysis - China State Construction Engineering Corporation Limited...
Financial Analysis - China State Construction Engineering Corporation Limited...BCV
 
Financial Analysis - J.C. Penney Company, Inc., through a subsidiary, operat...
 Financial Analysis - J.C. Penney Company, Inc., through a subsidiary, operat... Financial Analysis - J.C. Penney Company, Inc., through a subsidiary, operat...
Financial Analysis - J.C. Penney Company, Inc., through a subsidiary, operat...BCV
 

Semelhante a Financial Analysis - Facebook Inc. operates a social networking website. The Company's website allows people to communicate with their family, friends, and coworkers (20)

Financial Analysis - LinkedIn Corporation operates a social networking websit...
Financial Analysis - LinkedIn Corporation operates a social networking websit...Financial Analysis - LinkedIn Corporation operates a social networking websit...
Financial Analysis - LinkedIn Corporation operates a social networking websit...
 
Financial analysis nobel biocare holding ag develops and produces dental im...
Financial analysis   nobel biocare holding ag develops and produces dental im...Financial analysis   nobel biocare holding ag develops and produces dental im...
Financial analysis nobel biocare holding ag develops and produces dental im...
 
Financial Analysis - Prysmian SP¨a develops, designs, produces, supplies a…
Financial Analysis - Prysmian SP¨a develops, designs, produces, supplies a…Financial Analysis - Prysmian SP¨a develops, designs, produces, supplies a…
Financial Analysis - Prysmian SP¨a develops, designs, produces, supplies a…
 
Fundamental Analysis & Financial Analyst Recommandations - Google Inc - US382...
Fundamental Analysis & Financial Analyst Recommandations - Google Inc - US382...Fundamental Analysis & Financial Analyst Recommandations - Google Inc - US382...
Fundamental Analysis & Financial Analyst Recommandations - Google Inc - US382...
 
Financial analysis - MBIA Inc. provides financial guarantee insurance and …
Financial analysis - MBIA Inc. provides financial guarantee insurance and …Financial analysis - MBIA Inc. provides financial guarantee insurance and …
Financial analysis - MBIA Inc. provides financial guarantee insurance and …
 
Financial Analysis - Herbalife Ltd. is a network marketing company that sell...
 Financial Analysis - Herbalife Ltd. is a network marketing company that sell... Financial Analysis - Herbalife Ltd. is a network marketing company that sell...
Financial Analysis - Herbalife Ltd. is a network marketing company that sell...
 
Financial Analysis - National Oilwell Varco Inc. is a worldwide provider of e...
Financial Analysis - National Oilwell Varco Inc. is a worldwide provider of e...Financial Analysis - National Oilwell Varco Inc. is a worldwide provider of e...
Financial Analysis - National Oilwell Varco Inc. is a worldwide provider of e...
 
Financial Analysis - American International Group, Inc. is an internationa…
Financial Analysis - American International Group, Inc. is an internationa…Financial Analysis - American International Group, Inc. is an internationa…
Financial Analysis - American International Group, Inc. is an internationa…
 
Financial Analysis - Zhejiang Expressway Co., ltd., through its subsidiari…
Financial Analysis - Zhejiang Expressway Co., ltd., through its subsidiari…Financial Analysis - Zhejiang Expressway Co., ltd., through its subsidiari…
Financial Analysis - Zhejiang Expressway Co., ltd., through its subsidiari…
 
Financial Analysis - Two Harbors Investment Corporation is a re…
Financial Analysis - Two Harbors Investment Corporation is a re…Financial Analysis - Two Harbors Investment Corporation is a re…
Financial Analysis - Two Harbors Investment Corporation is a re…
 
Financial analysis goldcorp, inc. is engaged in the acquisition, exploratio...
Financial analysis   goldcorp, inc. is engaged in the acquisition, exploratio...Financial analysis   goldcorp, inc. is engaged in the acquisition, exploratio...
Financial analysis goldcorp, inc. is engaged in the acquisition, exploratio...
 
Financial Analysis - Assured Guaranty Ltd. provides financial guaranty insura...
Financial Analysis - Assured Guaranty Ltd. provides financial guaranty insura...Financial Analysis - Assured Guaranty Ltd. provides financial guaranty insura...
Financial Analysis - Assured Guaranty Ltd. provides financial guaranty insura...
 
Financial Analysis - Technip SA designs and constructs industrial facilities....
Financial Analysis - Technip SA designs and constructs industrial facilities....Financial Analysis - Technip SA designs and constructs industrial facilities....
Financial Analysis - Technip SA designs and constructs industrial facilities....
 
Financial analysis total sa - total sa explores for, produces, refines, tra...
Financial analysis   total sa - total sa explores for, produces, refines, tra...Financial analysis   total sa - total sa explores for, produces, refines, tra...
Financial analysis total sa - total sa explores for, produces, refines, tra...
 
Financial analysis adecoagro sa - adecoagro s.a. is an agricultural company...
Financial analysis   adecoagro sa - adecoagro s.a. is an agricultural company...Financial analysis   adecoagro sa - adecoagro s.a. is an agricultural company...
Financial analysis adecoagro sa - adecoagro s.a. is an agricultural company...
 
Financial Analysis - PetroChina Company Limited explores, develops, and produ...
Financial Analysis - PetroChina Company Limited explores, develops, and produ...Financial Analysis - PetroChina Company Limited explores, develops, and produ...
Financial Analysis - PetroChina Company Limited explores, develops, and produ...
 
Financial Analysis - EFG Financial Products Holding AG provides financial ser...
Financial Analysis - EFG Financial Products Holding AG provides financial ser...Financial Analysis - EFG Financial Products Holding AG provides financial ser...
Financial Analysis - EFG Financial Products Holding AG provides financial ser...
 
Financial Analysis - China Communications Construction Company Ltd. is a tran...
Financial Analysis - China Communications Construction Company Ltd. is a tran...Financial Analysis - China Communications Construction Company Ltd. is a tran...
Financial Analysis - China Communications Construction Company Ltd. is a tran...
 
Financial Analysis - China State Construction Engineering Corporation Limited...
Financial Analysis - China State Construction Engineering Corporation Limited...Financial Analysis - China State Construction Engineering Corporation Limited...
Financial Analysis - China State Construction Engineering Corporation Limited...
 
Financial Analysis - J.C. Penney Company, Inc., through a subsidiary, operat...
 Financial Analysis - J.C. Penney Company, Inc., through a subsidiary, operat... Financial Analysis - J.C. Penney Company, Inc., through a subsidiary, operat...
Financial Analysis - J.C. Penney Company, Inc., through a subsidiary, operat...
 

Mais de BCV

Vers la couverture des risques systémiques
Vers la couverture des risques systémiquesVers la couverture des risques systémiques
Vers la couverture des risques systémiquesBCV
 
Le plus convexe des investissements linéaires
Le plus convexe des investissements linéairesLe plus convexe des investissements linéaires
Le plus convexe des investissements linéairesBCV
 
Keine angst vor zinsanstieg
Keine angst vor zinsanstiegKeine angst vor zinsanstieg
Keine angst vor zinsanstiegBCV
 
Des performances stables avec les certificats de primes de risque
Des performances stables avec les certificats de primes de risqueDes performances stables avec les certificats de primes de risque
Des performances stables avec les certificats de primes de risqueBCV
 
Evaluation de l'incidence des produits structurés sur les marchés actions
Evaluation de l'incidence des produits structurés sur les marchés actionsEvaluation de l'incidence des produits structurés sur les marchés actions
Evaluation de l'incidence des produits structurés sur les marchés actionsBCV
 
Erfolg ohne Absturzrisiko - Derivate machen es möglich
Erfolg ohne Absturzrisiko - Derivate machen es möglichErfolg ohne Absturzrisiko - Derivate machen es möglich
Erfolg ohne Absturzrisiko - Derivate machen es möglichBCV
 
Vers la couverture des risques systémiques?
Vers la couverture des risques systémiques?Vers la couverture des risques systémiques?
Vers la couverture des risques systémiques?BCV
 
qCIO Global Macro Hedge Fund Strategy - March 2015
qCIO Global Macro Hedge Fund Strategy - March 2015qCIO Global Macro Hedge Fund Strategy - March 2015
qCIO Global Macro Hedge Fund Strategy - March 2015BCV
 
qCIO Global Macro Hedge Fund Strategy - November 2014
qCIO Global Macro Hedge Fund Strategy - November 2014qCIO Global Macro Hedge Fund Strategy - November 2014
qCIO Global Macro Hedge Fund Strategy - November 2014BCV
 
Le Temps - 20 Octobre 2014 - Eclairage psychologique d'un choix rationnel
Le Temps - 20 Octobre 2014 - Eclairage psychologique d'un choix rationnelLe Temps - 20 Octobre 2014 - Eclairage psychologique d'un choix rationnel
Le Temps - 20 Octobre 2014 - Eclairage psychologique d'un choix rationnelBCV
 
Le Temps - 21 octobre 2013 - Benchmarker un produit structuré
Le Temps - 21 octobre 2013 - Benchmarker un produit structuréLe Temps - 21 octobre 2013 - Benchmarker un produit structuré
Le Temps - 21 octobre 2013 - Benchmarker un produit structuréBCV
 
Le temps - 30 juin 2014 - Des instruments plus flexibles dans l'obligataire
Le temps - 30 juin 2014 - Des instruments plus flexibles dans l'obligataireLe temps - 30 juin 2014 - Des instruments plus flexibles dans l'obligataire
Le temps - 30 juin 2014 - Des instruments plus flexibles dans l'obligataireBCV
 
INDICES Mai 2014 Produits financiers - Surévaluation de la volatilité implicit...
INDICES Mai 2014 Produits financiers - Surévaluation de la volatilité implicit...INDICES Mai 2014 Produits financiers - Surévaluation de la volatilité implicit...
INDICES Mai 2014 Produits financiers - Surévaluation de la volatilité implicit...BCV
 
Fundamental analysis & recommendations qms advisors flex index spi index - ...
Fundamental analysis & recommendations   qms advisors flex index spi index - ...Fundamental analysis & recommendations   qms advisors flex index spi index - ...
Fundamental analysis & recommendations qms advisors flex index spi index - ...BCV
 
Fundamental Analysis & Recommendations - QMS Advisors FlexIndex KOSPI 100
Fundamental Analysis & Recommendations - QMS Advisors FlexIndex KOSPI 100 Fundamental Analysis & Recommendations - QMS Advisors FlexIndex KOSPI 100
Fundamental Analysis & Recommendations - QMS Advisors FlexIndex KOSPI 100 BCV
 
Fundamental Equity Analysis - QMS Advisors HDAX FlexIndex 110
Fundamental Equity Analysis - QMS Advisors HDAX FlexIndex 110Fundamental Equity Analysis - QMS Advisors HDAX FlexIndex 110
Fundamental Equity Analysis - QMS Advisors HDAX FlexIndex 110BCV
 
Fundamental Analysis & Recommendations - OEX Index - The Standard & Poor's 10...
Fundamental Analysis & Recommendations - OEX Index - The Standard & Poor's 10...Fundamental Analysis & Recommendations - OEX Index - The Standard & Poor's 10...
Fundamental Analysis & Recommendations - OEX Index - The Standard & Poor's 10...BCV
 
Fundamental analysis & recommendations spi index - the swiss performance in...
Fundamental analysis & recommendations   spi index - the swiss performance in...Fundamental analysis & recommendations   spi index - the swiss performance in...
Fundamental analysis & recommendations spi index - the swiss performance in...BCV
 
Fundamental Equity Analysis - QMS Global Agriculture FlexIndex - The QMS Advi...
Fundamental Equity Analysis - QMS Global Agriculture FlexIndex - The QMS Advi...Fundamental Equity Analysis - QMS Global Agriculture FlexIndex - The QMS Advi...
Fundamental Equity Analysis - QMS Global Agriculture FlexIndex - The QMS Advi...BCV
 
Fundamental Equity Analysis and Analyst Recommandations - MSCI Emerging Marke...
Fundamental Equity Analysis and Analyst Recommandations - MSCI Emerging Marke...Fundamental Equity Analysis and Analyst Recommandations - MSCI Emerging Marke...
Fundamental Equity Analysis and Analyst Recommandations - MSCI Emerging Marke...BCV
 

Mais de BCV (20)

Vers la couverture des risques systémiques
Vers la couverture des risques systémiquesVers la couverture des risques systémiques
Vers la couverture des risques systémiques
 
Le plus convexe des investissements linéaires
Le plus convexe des investissements linéairesLe plus convexe des investissements linéaires
Le plus convexe des investissements linéaires
 
Keine angst vor zinsanstieg
Keine angst vor zinsanstiegKeine angst vor zinsanstieg
Keine angst vor zinsanstieg
 
Des performances stables avec les certificats de primes de risque
Des performances stables avec les certificats de primes de risqueDes performances stables avec les certificats de primes de risque
Des performances stables avec les certificats de primes de risque
 
Evaluation de l'incidence des produits structurés sur les marchés actions
Evaluation de l'incidence des produits structurés sur les marchés actionsEvaluation de l'incidence des produits structurés sur les marchés actions
Evaluation de l'incidence des produits structurés sur les marchés actions
 
Erfolg ohne Absturzrisiko - Derivate machen es möglich
Erfolg ohne Absturzrisiko - Derivate machen es möglichErfolg ohne Absturzrisiko - Derivate machen es möglich
Erfolg ohne Absturzrisiko - Derivate machen es möglich
 
Vers la couverture des risques systémiques?
Vers la couverture des risques systémiques?Vers la couverture des risques systémiques?
Vers la couverture des risques systémiques?
 
qCIO Global Macro Hedge Fund Strategy - March 2015
qCIO Global Macro Hedge Fund Strategy - March 2015qCIO Global Macro Hedge Fund Strategy - March 2015
qCIO Global Macro Hedge Fund Strategy - March 2015
 
qCIO Global Macro Hedge Fund Strategy - November 2014
qCIO Global Macro Hedge Fund Strategy - November 2014qCIO Global Macro Hedge Fund Strategy - November 2014
qCIO Global Macro Hedge Fund Strategy - November 2014
 
Le Temps - 20 Octobre 2014 - Eclairage psychologique d'un choix rationnel
Le Temps - 20 Octobre 2014 - Eclairage psychologique d'un choix rationnelLe Temps - 20 Octobre 2014 - Eclairage psychologique d'un choix rationnel
Le Temps - 20 Octobre 2014 - Eclairage psychologique d'un choix rationnel
 
Le Temps - 21 octobre 2013 - Benchmarker un produit structuré
Le Temps - 21 octobre 2013 - Benchmarker un produit structuréLe Temps - 21 octobre 2013 - Benchmarker un produit structuré
Le Temps - 21 octobre 2013 - Benchmarker un produit structuré
 
Le temps - 30 juin 2014 - Des instruments plus flexibles dans l'obligataire
Le temps - 30 juin 2014 - Des instruments plus flexibles dans l'obligataireLe temps - 30 juin 2014 - Des instruments plus flexibles dans l'obligataire
Le temps - 30 juin 2014 - Des instruments plus flexibles dans l'obligataire
 
INDICES Mai 2014 Produits financiers - Surévaluation de la volatilité implicit...
INDICES Mai 2014 Produits financiers - Surévaluation de la volatilité implicit...INDICES Mai 2014 Produits financiers - Surévaluation de la volatilité implicit...
INDICES Mai 2014 Produits financiers - Surévaluation de la volatilité implicit...
 
Fundamental analysis & recommendations qms advisors flex index spi index - ...
Fundamental analysis & recommendations   qms advisors flex index spi index - ...Fundamental analysis & recommendations   qms advisors flex index spi index - ...
Fundamental analysis & recommendations qms advisors flex index spi index - ...
 
Fundamental Analysis & Recommendations - QMS Advisors FlexIndex KOSPI 100
Fundamental Analysis & Recommendations - QMS Advisors FlexIndex KOSPI 100 Fundamental Analysis & Recommendations - QMS Advisors FlexIndex KOSPI 100
Fundamental Analysis & Recommendations - QMS Advisors FlexIndex KOSPI 100
 
Fundamental Equity Analysis - QMS Advisors HDAX FlexIndex 110
Fundamental Equity Analysis - QMS Advisors HDAX FlexIndex 110Fundamental Equity Analysis - QMS Advisors HDAX FlexIndex 110
Fundamental Equity Analysis - QMS Advisors HDAX FlexIndex 110
 
Fundamental Analysis & Recommendations - OEX Index - The Standard & Poor's 10...
Fundamental Analysis & Recommendations - OEX Index - The Standard & Poor's 10...Fundamental Analysis & Recommendations - OEX Index - The Standard & Poor's 10...
Fundamental Analysis & Recommendations - OEX Index - The Standard & Poor's 10...
 
Fundamental analysis & recommendations spi index - the swiss performance in...
Fundamental analysis & recommendations   spi index - the swiss performance in...Fundamental analysis & recommendations   spi index - the swiss performance in...
Fundamental analysis & recommendations spi index - the swiss performance in...
 
Fundamental Equity Analysis - QMS Global Agriculture FlexIndex - The QMS Advi...
Fundamental Equity Analysis - QMS Global Agriculture FlexIndex - The QMS Advi...Fundamental Equity Analysis - QMS Global Agriculture FlexIndex - The QMS Advi...
Fundamental Equity Analysis - QMS Global Agriculture FlexIndex - The QMS Advi...
 
Fundamental Equity Analysis and Analyst Recommandations - MSCI Emerging Marke...
Fundamental Equity Analysis and Analyst Recommandations - MSCI Emerging Marke...Fundamental Equity Analysis and Analyst Recommandations - MSCI Emerging Marke...
Fundamental Equity Analysis and Analyst Recommandations - MSCI Emerging Marke...
 

Financial Analysis - Facebook Inc. operates a social networking website. The Company's website allows people to communicate with their family, friends, and coworkers

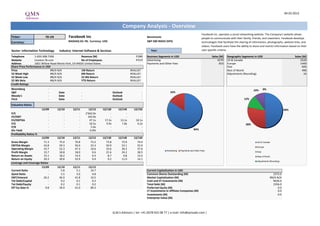
  • 1. 04.03.2013 Company Analysis - Overview Facebook Inc. operates a social networking website. The Company's website allows Ticker: FB UN Facebook Inc Benchmark: people to communicate with their family, friends, and coworkers. Facebook develops Currency: NASDAQ GS: FB, Currency: USD S&P 500 INDEX (SPX) technologies that facilitate the sharing of information, photographs, website links, and videos. Facebook users have the ability to share and restrict information based on their Sector: Information Technology Industry: Internet Software & Services Year: own specific criteria. Telephone 1-650-308-7300 Revenue (M) 5'089 Business Segments in USD Sales (M) Geographic Segments in USD Sales (M) Website investor.fb.com No of Employees 4'619 Advertising 4279 US & Canada 2520 Address 1601 Willow Road Menlo Park, CA 94025 United States Payments and Other Fees 810 Europe 1449 Share Price Performance in USD Asia 606 Price #N/A N/A 1M Return #VALUE! Rest of World 498 52 Week High #N/A N/A 6M Return #VALUE! Adjustments (Rounding) 16 52 Week Low #N/A N/A 52 Wk Return #VALUE! 52 Wk Beta #N/A N/A YTD Return #VALUE! Credit Ratings Bloomberg - 10% 0% S&P - Date - Outlook - 16% Moody's - Date - Outlook - Fitch - Date - Outlook - 12% Valuation Ratios 12/09 12/10 12/11 12/12 12/13E 12/14E 12/15E 50% P/E - - - 2'662.0x - - - EV/EBIT - - - 103.9x - - - EV/EBITDA - - - 47.1x 17.2x 13.1x 10.1x P/S - - - 10.5x 9.9x 7.8x 6.2x 28% P/B - - - 5.4x - - - Div Yield - - - 0.0% - - - 84% Profitability Ratios % 12/09 12/10 12/11 12/12 12/13E 12/14E 12/15E Gross Margin 71.3 75.0 76.8 73.2 73.8 73.9 74.4 US & Canada EBITDA Margin 43.8 59.3 56.0 23.3 50.9 53.1 55.0 Europe Operating Margin 33.7 52.3 47.3 10.6 33.6 36.2 37.6 Advertising Payments and Other Fees Profit Margin 15.7 18.8 18.0 0.6 21.6 24.2 28.5 Asia Return on Assets 15.1 18.2 14.3 0.3 8.7 9.8 13.2 Rest of World Return on Equity 20.3 30.8 22.9 0.4 9.2 11.0 14.1 Adjustments (Rounding) Leverage and Coverage Ratios 12/09 12/10 12/11 12/12 Current Ratio - 5.8 5.1 10.7 Current Capitalization in USD Quick Ratio - 5.5 5.0 9.8 Common Shares Outstanding (M) 2372.0 EBIT/Interest 26.2 46.9 41.8 10.5 Market Capitalization (M) #N/A N/A Tot Debt/Capital - 0.2 0.1 0.2 Cash and ST Investments (M) 9626.0 Tot Debt/Equity - 0.2 0.1 0.2 Total Debt (M) 2356.0 Eff Tax Rate % 9.8 39.9 41.0 89.3 Preferred Equity (M) 0.0 LT Investments in Affiliate Companies (M) 0.0 Investments (M) 0.0 Enterprise Value (M) Q.M.S Advisors | tel: +41 (0)78 922 08 77 | e-mail: info@qmsadv.com |
  • 2. Company Analysis - Analysts Ratings Facebook Inc Target price in USD Broker Recommendation Buy and Sell Recommendations vs Price and Target Price Price Brokers' Target Price 50 50 100% 5% 5% 5% 5% 5% 8% 7% 7% 8% 15% 45 45 40 40 80% 33% 30% 32% 36% 35 23% 44% 44% 40% 36% 45% 35 30 60% 30 25 25 20 40% 20 15 62% 61% 63% 65% 59% 15 10 52% 56% 51% 51% 47% 5 20% 10 0 5 Telsey Advisory Morgan Stanley Barclays Lazard Capital BMO Capital Piper Jaffray Raymond James S&P Capital IQ Credit Agricole Atlantic Equities Pivotal Research RBC Capital Macquarie Sterne, Agee & Evercore Battle Road Cantor JPMorgan Credit Suisse Cowen and Sanford C. Edward Jones Stifel Nicolaus Oppenheimer & Nomura Pacific Crest Needham & Co EVA Dimensions IPOfinancial.com BTIG LLC Argus Research Goldman Sachs Deutsche Bank Jefferies Topeka Capital William Blair & Robert W. Baird Wells Fargo Wedge Partners Wedbush 0% 0% 0% 0 mars.12 avr.12 mai.12 juin.12 juil.12 août.12 sept.12 oct.12 nov.12 déc.12 janv.13 févr.13 Buy Hold Sell Price Target Price Date Buy Hold Sell Date Price Target Price Broker Analyst Recommendation Target Date 28-Feb-13 56% 36% 8% 4-Mar-13 #N/A N/A 33.61 Robert W. Baird & Co COLIN SEBASTIAN outperform 34.00 1-Mar-13 31-Jan-13 59% 36% 5% 1-Mar-13 #N/A N/A 33.61 Sanford C. Bernstein & Co CARLOS KIRJNER market perform 27.00 1-Mar-13 31-Dec-12 65% 30% 5% 28-Feb-13 #N/A N/A 33.61 Cantor Fitzgerald YOUSSEF H SQUALI buy 35.00 1-Mar-13 30-Nov-12 63% 33% 5% 27-Feb-13 #N/A N/A 33.61 Morgan Stanley SCOTT W DEVITT Overwt/Attractive 34.00 28-Feb-13 31-Oct-12 61% 32% 7% 26-Feb-13 #N/A N/A 33.61 Needham & Co LAURA A MARTIN buy 33.00 22-Feb-13 28-Sep-12 52% 40% 7% 25-Feb-13 #N/A N/A 33.61 BTIG LLC RICHARD GREENFIELD sell 22.00 14-Feb-13 31-Aug-12 51% 44% 5% 22-Feb-13 #N/A N/A 33.61 Pivotal Research Group LLC BRIAN WIESER buy 36.00 12-Feb-13 31-Jul-12 51% 44% 5% 21-Feb-13 #N/A N/A 33.61 Telsey Advisory Group THOMAS FORTE no rating system 38.00 10-Feb-13 29-Jun-12 47% 45% 8% 20-Feb-13 #N/A N/A 33.61 JPMorgan DOUGLAS ANMUTH overweight 35.00 4-Feb-13 31-May-12 62% 23% 15% 19-Feb-13 #N/A N/A 33.61 Wells Fargo Securities, LLC JASON MAYNARD outperform 4-Feb-13 30-Apr-12 #DIV/0! #DIV/0! #DIV/0! 18-Feb-13 #N/A N/A 33.61 Argus Research Corp JOSEPH F BONNER hold 1-Feb-13 30-Mar-12 #DIV/0! #DIV/0! #DIV/0! 15-Feb-13 #N/A N/A 33.61 BMO Capital Markets DANIEL SALMON market perform 32.00 31-Jan-13 14-Feb-13 #N/A N/A 33.61 Deutsche Bank ROSS SANDLER buy 37.00 31-Jan-13 13-Feb-13 #N/A N/A 33.61 Goldman Sachs HEATHER BELLINI Buy/Neutral 40.00 31-Jan-13 12-Feb-13 #N/A N/A 33.61 RBC Capital Markets MARK S MAHANEY outperform 32.00 31-Jan-13 11-Feb-13 #N/A N/A 34.26 Credit Suisse STEPHEN JU neutral 31.00 31-Jan-13 8-Feb-13 #N/A N/A 34.26 Edward Jones JOSH OLSON buy 31-Jan-13 7-Feb-13 #N/A N/A 34.26 Jefferies BRIAN J PITZ hold 30.00 31-Jan-13 6-Feb-13 #N/A N/A 34.26 Wedbush MICHAEL PACHTER outperform 35.00 31-Jan-13 5-Feb-13 #N/A N/A 34.26 William Blair & Co RALPH SCHACKART outperform 31-Jan-13 4-Feb-13 #N/A N/A 34.26 Raymond James AARON M KESSLER outperform 37.00 31-Jan-13 1-Feb-13 #N/A N/A 34.29 Macquarie BENJAMIN A SCHACHTER outperform 30.00 31-Jan-13 31-Jan-13 #N/A N/A 34.29 Stifel Nicolaus JORDAN ROHAN hold 31-Jan-13 30-Jan-13 #N/A N/A 33.86 Sterne, Agee & Leach ARVIND BHATIA buy 37.00 31-Jan-13 29-Jan-13 #N/A N/A 33.72 Evercore Partners KEN SENA equalweight 32.00 31-Jan-13 28-Jan-13 #N/A N/A 33.82 Oppenheimer & Co JASON S HELFSTEIN outperform 33.00 31-Jan-13 25-Jan-13 #N/A N/A 33.67 Nomura BRIAN NOWAK buy 32.00 31-Jan-13 24-Jan-13 #N/A N/A 33.32 Cowen and Company JOHN BLACKLEDGE neutral 31-Jan-13 23-Jan-13 #N/A N/A 33.32 S&P Capital IQ SCOTT H KESSLER hold 31.00 31-Jan-13 22-Jan-13 #N/A N/A 33.32 Credit Agricole Securities (USA) JAMES LEE buy 40.00 31-Jan-13 Q.M.S Advisors | tel: +41 (0)78 922 08 77 | e-mail: info@qmsadv.com |
  • 3. 04.03.2013 Facebook Inc Company Analysis - Ownership Ownership Type Ownership Statistics Geographic Ownership Distribution Geographic Ownership 2% Shares Outstanding (M) 2372.0 United States 83.30% Float 96.8% Britain 5.34% 1% 1% 1% 2% 2% Short Interest (M) 25.4 Unknown Country 4.71% 5% Short Interest as % of Float 1.11% Luxembourg 1.53% 5% Days to Cover Shorts 0.48 Japan 1.29% Institutional Ownership 51.60% 46% 52% Switzerland 0.82% Retail Ownership 46.03% Germany 0.60% Insider Ownership 2.36% Others 2.42% Institutional Ownership Distribution 83% Investment Advisor 76.43% Hedge Fund Manager 12.06% Individual 4.38% United States Britain Unknown Country Institutional Ownership Retail Ownership Insider Ownership Venture Capital 2.53% Luxembourg Japan Switzerland Pricing data is in USD Others 4.61% Germany Others Top 20 Owners: TOP 20 ALL Institutional Ownership Holder Name Position Position Change Market Value % of Ownership Report Date Source Country FMR LLC 77'644'473 37'380'569 4.61% 31.12.2012 ULT-AGG UNITED STATES 5% 3% CAPITAL GROUP COMPAN 39'095'420 15'722'220 2.32% 31.12.2012 ULT-AGG UNITED STATES 4% MORGAN STANLEY 33'281'620 6'803'009 1.98% 31.12.2012 ULT-AGG UNITED STATES T ROWE PRICE ASSOCIA 33'193'967 13'789'661 1.97% 31.12.2012 13F UNITED STATES SANDS CAPITAL MANAGE 26'797'536 9'685'751 1.59% 31.12.2012 13F UNITED STATES 12% VANGUARD GROUP INC 26'311'904 12'411'139 1.56% 31.12.2012 13F UNITED STATES BLACKROCK 22'993'914 6'546'408 1.37% 28.02.2013 ULT-AGG UNITED STATES JENNISON ASSOCIATES 22'376'854 9'675'216 1.33% 31.12.2012 13F UNITED STATES UBS 21'977'538 5'431'928 1.30% 31.12.2012 ULT-AGG 76% WINSLOW CAPITAL MANA 21'263'110 21'263'110 1.26% 31.12.2012 13F UNITED STATES BAILLIE GIFFORD AND 20'578'390 364'134 1.22% 31.12.2012 13F BRITAIN WELLINGTON MANAGEMEN 20'370'317 20'370'317 1.21% 31.12.2012 13F UNITED STATES GOLDMAN SACHS GROUP 18'422'852 -20'142'720 1.09% 31.12.2012 13F UNITED STATES INVESCO LTD 18'204'867 17'235'166 1.08% 31.12.2012 13F UNITED STATES Investment Advisor Hedge Fund Manager Individual Venture Capital Others AMERIPRISE FINANCIAL 18'122'565 17'425'168 1.08% 31.12.2012 13F UNITED STATES SANDBERG SHERYL KARA 17'806'956 -176'452 1.06% 21.02.2013 Form 4 n/a ELEVATION MANAGEMENT 16'989'027 16'989'027 1.01% 31.12.2012 13F UNITED STATES MERITECH CAPITAL ASS 16'268'858 16'268'858 0.97% 31.12.2012 ULT-AGG UNITED STATES ALLIANZ ASSET MANAGE 14'465'499 4'414'890 0.86% 31.01.2013 ULT-AGG GERMANY MACKAY SHIELDS LLC 14'176'100 1'643'500 0.84% 31.12.2012 MF-AGG UNITED STATES Top 5 Insiders: Holder Name Position Position Change Market Value % of Ownership Report Date Source SANDBERG SHERYL KARA 17'806'956 -176'452 1.06% 21.02.2013 Form 4 BREYER JAMES W 9'166'654 -3'000'000 0.54% 04.02.2013 Form 4 ANDREESSEN MARC LOWELL 6'842'256 15'344 0.41% 20.02.2013 Form 4 EBERSMAN DAVID A 2'263'500 35'519 0.13% 20.02.2013 Form 4 SCHROEPFER MICHAEL TODD 1'271'705 -55'000 0.08% 25.02.2013 Form 4 Q.M.S Advisors | tel: +41 (0)78 922 08 77 | e-mail: info@qmsadv.com |
  • 4. Company Analysis - Financials I/IV Facebook Inc Financial information is in USD (M) Equivalent Estimates Periodicity: Fiscal Year 12/02 12/03 12/04 12/05 12/06 12/07 12/08 12/09 12/10 12/11 12/12 12/13E 12/14E 12/15E Income Statement Revenue 153 272 777 1'974 3'711 5'089 6'678 8'435 10'561 - Cost of Goods Sold 41 124 223 493 860 1'364 Gross Income 112 148 554 1'481 2'851 3'725 4'928 6'235 7'853 - Selling, General & Admin Expenses 236 203 292 449 1'095 3'187 (Research & Dev Costs) 81 47 87 144 388 1'399 Operating Income -124 -55 262 1'032 1'756 538 2'245 3'049 3'974 - Interest Expense 10 22 42 51 - Foreign Exchange Losses (Gains) - Net Non-Operating Losses (Gains) 11 1 -2 2 19 -7 Pretax Income -135 -56 254 1'008 1'695 494 2'133 2'904 4'038 - Income Tax Expense 3 0 25 402 695 441 Income Before XO Items -138 -56 229 606 1'000 53 - Extraordinary Loss Net of Tax - Minority Interests 107 234 332 21 Diluted EPS Before XO Items (0.16) (0.06) 0.10 0.28 0.46 0.01 Net Income Adjusted* 1'137 1'444 2'039 3'011 EPS Adjusted 0.52 0.57 0.78 1.07 Dividends Per Share 0.00 0.00 0.00 0.00 0.00 0.00 0.00 0.00 0.00 Payout Ratio % 0.0 0.0 0.0 0.0 0.00 0.00 0.00 Total Shares Outstanding 1'112 1'330 2'372 Diluted Shares Outstanding 1'366 1'414 1'508 2'166 EBITDA 340 1'171 2'079 1'187 3'400 4'480 5'808 *Net income excludes extraordinary gains and losses and one-time charges. Q.M.S Advisors | tel: +41 (0)78 922 08 77 | e-mail: info@qmsadv.com |
  • 5. Company Analysis - Financials II/IV Periodicity: 12/02 12/03 12/04 12/05 12/06 12/07 12/08 12/09 12/10 12/11 12/12 12/13E 12/14E 12/15E Balance Sheet Total Current Assets 2246 4604 11267 + Cash & Near Cash Items 305 297 633 1'785 1'512 2'384 + Short Term Investments 0 2'396 7'242 + Accounts & Notes Receivable 373 547 719 + Inventories 0 0 0 + Other Current Assets 88 149 922 Total Long-Term Assets 82 131 148 744 1'727 3'836 + Long Term Investments Gross Fixed Assets 820 1'925 3'273 Accumulated Depreciation 246 450 882 + Net Fixed Assets 82 131 148 574 1'475 2'391 + Other Long Term Assets 170 252 1'445 Total Current Liabilities 389 899 1'052 + Accounts Payable 29 63 65 + Short Term Borrowings 106 279 365 + Other Short Term Liabilities 254 557 622 Total Long Term Liabilities 439 533 2'296 + Long Term Borrowings 367 398 1'991 + Other Long Term Borrowings 72 135 305 Total Liabilities 828 1'432 3'348 + Long Preferred Equity 615 615 0 + Minority Interest 0 + Share Capital & APIC 947 2'684 10'094 + Retained Earnings & Other Equity 273 335 868 600 1'600 1'661 Total Shareholders Equity 273 335 868 2'162 4'899 11'755 Total Liabilities & Equity 2'990 6'331 15'103 Book Value Per Share 1.39 3.22 4.96 5.43 6.18 7.29 Tangible Book Value Per Share 1.22 3.04 4.37 Q.M.S Advisors | tel: +41 (0)78 922 08 77 | e-mail: info@qmsadv.com |
  • 6. Company Analysis - Financials III/IV Periodicity: 12/02 12/03 12/04 12/05 12/06 12/07 12/08 12/09 12/10 12/11 12/12 12/13E 12/14E 12/15E Cash Flows Net Income 122 372 668 32 898 1'377 2'311 + Depreciation & Amortization 78 139 323 649 + Other Non-Cash Adjustments 135 294 568 1'467 + Changes in Non-Cash Capital -180 -107 -10 -536 Cash From Operating Activities 155 698 1'549 1'612 + Disposal of Fixed Assets + Capital Expenditures -33 -293 -606 -1'235 -1'604 -1'714 -1'823 + Increase in Investments 0 0 -3 -2 + Decrease in Investments 0 0 + Other Investing Activities -29 -31 -2'414 -5'787 Cash From Investing Activities -62 -324 -3'023 -7'024 + Dividends Paid + Change in Short Term Borrowings 0 1'496 + Increase in Long Term Borrowings 0 250 0 0 + Decrease in Long Term Borrowings 0 0 -250 0 + Increase in Capital Stocks 260 621 1'459 7'810 + Decrease in Capital Stocks + Other Financing Activities -17 -93 -8 -3'022 Cash From Financing Activities 243 778 1'201 6'284 Net Changes in Cash 336 1'152 -273 872 Free Cash Flow (CFO-CAPEX) 122 405 943 377 408 829 1'356 Free Cash Flow To Firm 131 418 968 382 Free Cash Flow To Equity 693 1'258 Free Cash Flow per Share 0.12 0.37 0.73 0.19 Q.M.S Advisors | tel: +41 (0)78 922 08 77 | e-mail: info@qmsadv.com |
  • 7. Company Analysis - Financials IV/IV Periodicity: 12/02 12/03 12/04 12/05 12/06 12/07 12/08 12/09 12/10 12/11 12/12 12/13E 12/14E 12/15E Ratio Analysis Valuation Ratios Price Earnings 2'662.0x EV to EBIT 103.9x EV to EBITDA 47.1x 17.2x 13.1x 10.1x Price to Sales 10.5x 9.9x 7.8x 6.2x Price to Book 5.4x Dividend Yield 0.0% Profitability Ratios Gross Margin 73.2% 54.4% 71.3% 75.0% 76.8% 73.2% 73.8% 73.9% 74.4% EBITDA Margin 43.8% 59.3% 56.0% 23.3% 50.9% 53.1% 55.0% Operating Margin -81.0% -20.2% 33.7% 52.3% 47.3% 10.6% 33.6% 36.2% 37.6% Profit Margin -90.2% -20.6% 15.7% 18.8% 18.0% 0.6% 21.6% 24.2% 28.5% Return on Assets -11.8% 15.1% 18.2% 14.3% 0.3% 8.7% 9.8% 13.2% Return on Equity -18.4% 20.3% 30.8% 22.9% 0.4% 9.2% 11.0% 14.1% Leverage & Coverage Ratios Current Ratio 5.77 5.12 10.71 Quick Ratio 5.55 4.96 9.83 Interest Coverage Ratio (EBIT/I) 26.20 46.91 41.81 10.55 Tot Debt/Capital 0.18 0.12 0.17 Tot Debt/Equity 0.22 0.14 0.20 Others Asset Turnover 0.57 0.96 0.96 0.80 0.47 Accounts Receivable Turnover 8.07 8.04 Accounts Payable Turnover 18.70 21.31 Inventory Turnover Effective Tax Rate 9.8% 39.9% 41.0% 89.3% Q.M.S Advisors | tel: +41 (0)78 922 08 77 | e-mail: info@qmsadv.com |
  • 8. Company Analysis - Peers Comparision #N/A Invalid FACEBOOK INC-A GOOGLE INC-CL A TWITTER INC MYSPACE INC CRAIGSLIST YELP INC MICROSOFT CORP IAC/INTERACTIVEC APPLE INC YAHOO! INC EBAY INC AOL INC AMAZON.COM INC GROUPON INC Security Latest Fiscal Year: 12/2012 12/2012 12/2011 - - - 12/2012 06/2012 12/2012 09/2012 12/2012 12/2012 12/2012 12/2012 12/2012 52-Week High - 814.47 - - - - - 32.95 55.57 705.07 22.62 57.27 39.75 284.72 19.21 52-Week High Date - 04.03.2013 - - - - - 16.03.2012 16.10.2012 21.09.2012 04.03.2013 01.02.2013 19.02.2013 25.01.2013 05.03.2012 52-Week Low - 556.52 - - - - - 26.26 38.20 424.55 14.35 34.83 14.49 178.04 2.60 52-Week Low Date - 14.06.2012 - - - - - 05.12.2012 24.01.2013 04.03.2013 06.03.2012 06.03.2012 06.03.2012 06.03.2012 12.11.2012 Daily Volume 0 872'724 0 0 - 0 0 6'245'098 175'767 5'380'198 10'465'454 2'539'774 204'422 732'834 11'541'690 Current Price (3/dd/yy) - 813.71 - - - - - 27.79 40.76 424.68 22.36 54.59 37.09 268.84 5.24 52-Week High % Change - -0.1% - - - - - -15.7% -26.7% -39.8% -1.2% -4.7% -6.7% -5.6% -72.7% 52-Week Low % Change - 46.2% - - - - - 5.8% 6.7% 0.0% 55.8% 56.7% 155.9% 51.0% 101.5% Total Common Shares (M) 2'372.0 330.0 - - - - - 8'381.0 87.6 939.2 1'182.7 1'294.0 76.6 454.0 656.9 Market Capitalization - 269'449.8 - - - - - 232'734.0 3'434.5 398'800.1 26'439.6 70'776.6 2'860.1 122'201.5 3'436.0 Total Debt 2'356.0 5'537.0 - - - - - 11'944.0 595.8 - - 4'519.0 105.9 4'218.0 - Preferred Stock - - - - - - - - - - - - - - - Minority Interest - - - - - - - - 110.0 - 45.4 - 13.1 - (1.9) Cash and Equivalents 9'626.0 49'557.0 - - - - 95.1 63'040.0 770.6 121'251.0 6'022.4 9'408.0 466.6 11'448.0 1'209.3 Enterprise Value - 225'429.9 - - - - - 178'610.0 3'369.8 261'688.1 20'462.6 65'887.6 2'512.5 114'971.5 2'224.7 Valuation Total Revenue LFY 5'089.0 50'175.0 - - - - 137.6 73'723.0 2'800.9 156'508.0 4'986.6 14'072.0 2'191.7 61'093.0 2'334.5 LTM 5'089.0 51'379.0 - - - - 137.6 72'930.0 2'800.9 164'687.0 4'986.6 14'071.0 2'191.7 61'093.0 2'334.5 CY+1 6'677.7 49'451.2 - - - - 211.4 79'605.0 3'253.9 182'372.5 4'674.1 16'345.5 2'222.9 75'751.6 2'561.5 CY+2 8'434.7 57'163.0 - - - - 294.9 86'100.8 3'636.6 205'752.0 4'845.7 18'730.9 2'289.2 93'067.6 2'833.0 EV/Total Revenue LFY 11.0x 3.8x - - - - 8.0x 2.3x 1.5x 2.2x 3.5x 4.3x 0.9x 1.7x 0.8x LTM 11.0x 3.7x - - - - 8.0x 2.3x 1.5x 2.1x 3.5x 4.3x 0.9x 1.7x 0.8x CY+1 8.5x 4.4x - - - - - 2.0x 0.9x 1.5x 4.6x 3.9x 1.1x 1.5x 0.8x CY+2 6.6x 3.6x - - - - - 1.6x 0.8x 1.3x 4.2x 3.2x 0.8x 1.2x 0.6x EBITDA LFY 1'187.0 15'722.0 - - - - (10.3) 30'923.0 411.8 58'518.0 1'457.1 4'088.0 330.0 2'835.0 155.4 LTM 1'187.0 15'684.0 - - - - (10.3) 29'120.0 411.8 59'255.0 1'457.1 4'090.0 330.0 2'834.0 143.7 CY+1 3'400.1 22'087.3 - - - - 21.1 32'414.5 613.6 60'649.2 1'664.4 5'383.4 427.3 4'646.4 254.9 CY+2 4'479.8 25'944.5 - - - - 46.6 35'504.1 711.8 68'430.3 1'740.8 6'241.8 449.4 6'384.0 319.3 EV/EBITDA LFY 47.1x 12.0x - - - - -107.2x 5.5x 9.9x 5.8x 12.0x 14.9x 5.8x 37.6x 12.8x LTM 47.1x 12.1x - - - - - 5.8x 9.9x 5.8x 12.0x 14.9x 5.8x 37.6x 13.8x CY+1 16.7x 9.9x - - - - - 5.0x 5.0x 4.5x 12.9x 11.9x 5.6x 24.6x 7.8x CY+2 12.4x 7.8x - - - - - 3.9x 3.9x 3.8x 11.7x 9.6x 4.3x 17.1x 5.2x EPS LFY 0.01 34.02 - - - - - 2.73 2.02 44.15 1.17 1.95 4.81 0.05 -0.03 LTM 0.02 33.74 - - - - - 2.56 2.04 44.10 1.17 1.94 4.64 0.36 -0.08 CY+1 0.57 45.71 - - - - 0.09 2.85 3.55 44.55 1.16 2.75 1.93 3.13 0.20 CY+2 0.78 53.86 - - - - 0.37 3.15 4.24 50.73 1.27 3.21 2.18 5.54 0.29 P/E LFY - 24.1x - - - - - 10.9x 20.0x 9.6x 19.1x 28.1x 8.0x 746.8x - LTM - 24.1x - - - - - 10.9x 20.0x 9.6x 19.1x 28.1x 8.0x 746.8x - CY+1 - 17.8x - - - - - 9.7x 11.5x 9.5x 19.4x 19.8x 19.2x 85.9x 26.3x CY+2 - 15.1x - - - - - 8.8x 9.6x 8.4x 17.6x 17.0x 17.0x 48.6x 18.1x Revenue Growth 1 Year 37.1% 32.4% - - - - 65.2% 5.4% 36.0% 44.6% 0.0% 20.8% (0.5%) 27.1% 45.0% 5 Year - 24.7% - - - - - 5.7% 16.3% 41.5% (5.8%) 13.7% - 30.6% - EBITDA Growth 1 Year (42.9%) 15.7% - - - - 13.9% 3.3% 48.9% 64.4% (1.1%) 23.4% (2.5%) 45.8% - 5 Year - 21.0% - - - - - 9.1% 89.0% 65.4% 1.5% 9.4% (30.0%) 25.8% - EBITDA Margin LTM 23.3% 30.5% - - - - (7.5%) 39.9% 14.7% 36.0% 29.2% 29.1% 15.1% 4.6% 6.2% CY+1 50.9% 44.7% - - - - 10.0% 40.7% 18.9% 33.3% 35.6% 32.9% 19.2% 6.1% 10.0% CY+2 53.1% 45.4% - - - - 15.8% 41.2% 19.6% 33.3% 35.9% 33.3% 19.6% 6.9% 11.3% Leverage/Coverage Ratios Total Debt / Equity % 20.0% 7.7% - - - - 0.0% 18.0% 36.0% 0.0% 0.0% 21.7% 5.0% 51.5% 0.0% Total Debt / Capital % 16.7% 7.2% - - - - 0.0% 15.3% 25.2% 0.0% 0.0% 17.8% 4.7% 34.0% 0.0% Total Debt / EBITDA 1.985x 0.353x - - - - - 0.487x 1.447x 0.000x 0.000x 1.105x 0.321x 1.488x 0.000x Net Debt / EBITDA -6.125x -2.807x - - - - - -1.859x -0.424x -2.314x -4.133x -1.195x -1.093x -2.551x -8.416x EBITDA / Int. Expense 23.275x 187.167x - - - - - 81.376x 50.928x - - 64.889x - 30.815x - Credit Ratings S&P LT Credit Rating - AA - - - - - AAA BB+ NR NR A - AA- - S&P LT Credit Rating Date - 19.11.2012 - - - - - 22.09.2008 17.12.2012 16.04.2004 18.04.2008 02.03.2010 - 26.11.2012 - Moody's LT Credit Rating - Aa2 - - - - - Aaa Ba3 WR - A2 - Baa1 - Moody's LT Credit Rating Date - 16.05.2011 - - - - - 11.05.2009 21.08.2008 31.03.2004 - 21.10.2010 - 26.11.2012 - Q.M.S Advisors | tel: +41 (0)78 922 08 77 | e-mail: info@qmsadv.com |