SlideShare a Scribd company logo
1 of 279
Seismograph. Learn more at….
http://earthquake.usgs.gov/learn/topics/seismology/keeping_track.php
• RED SLIDE: These are notes that are very
important and should be recorded in your
science journal.
Copyright © 2010 Ryan P. Murphy
-Nice neat notes that are legible and use indentations
when appropriate.
-Example of indent.
-Skip a line between topics
-Don’t skip pages
-Make visuals clear and well drawn.
• RED SLIDE: These are notes that are very
important and should be recorded in your
science journal.
• BLACK SLIDE: Pay attention, follow
directions, complete projects as described
and answer required questions neatly.
Copyright © 2010 Ryan P. Murphy
http://sciencepowerpoint.com/Website Link:
• What is this?
• Recreation ancient Chinese Seismograph
from 132 AD.
– Copper balls would fall out into a frogs mouth
forecasting and reporting an earthquake.
• The seismograph uses a counterweight
system, pen, and moving piece of paper.
Copyright © 2010 Ryan P. Murphy
 Seismograph: An instrument used to
measure the shaking caused by an
earthquake.
Copyright © 2010 Ryan P. Murphy
 Seismograph: An instrument used to
measure the shaking caused by an
earthquake.
Copyright © 2010 Ryan P. Murphy
Inertia:
Counterweight wants
to remain at rest.
 Seismograph: An instrument used to
measure the shaking caused by an
earthquake.
Copyright © 2010 Ryan P. Murphy
Inertia: But once in
motion wants to stay
in motion.
 Seismograph: An instrument used to
measure the shaking caused by an
earthquake.
Copyright © 2010 Ryan P. Murphy
Inertia: But once in
motion wants to stay
in motion.
• Activity Link! Make a seismograph
• http://pbskids.org/zoom/activities/sci/seism
ometer.html or http://science-
mattersblog.blogspot.com/2011/04/earthq
uakes-make-seismograph.html
• iSeismometer for the Ipad
– Learn more at…
http://www.iseismometer.com/
• Video Link! Seismographs and Seismomitor
– http://www.youtube.com/watch?v=Gbd1FcuLJLQ
• Activity! Human Seismograph.
– Need person in rolling chair.
– String.
– Weight on end of string.
– Pen tied to weight.
– Paper that two students move.
Copyright © 2010 Ryan P. Murphy
Seismograph. Learn more at….
http://earthquake.usgs.gov/learn/topics/seismology/keeping_track.php
• Activity! Creating a mini earthquake.
– Patter feet and hands on desk quietly as small
vibrations are recorded.
– Increase the magnitude of the noise when the
magnitude of the lines increase.
– Stop at end, repeat one more time.
Copyright © 2010 Ryan P. Murphy
 Richter Scale - Scale for measuring
earthquake magnitude.
Copyright © 2010 Ryan P. Murphy
 Richter Scale - Scale for measuring
earthquake magnitude.
 A magnitude 7.0 earthquake generates 10
times larger amplitude waves than those of a
magnitude 6.0.
Copyright © 2010 Ryan P. Murphy
 Richter Scale - Scale for measuring
earthquake magnitude.
 A magnitude 7.0 earthquake generates 10
times larger amplitude waves than those of a
magnitude 6.0.
Copyright © 2010 Ryan P. Murphy
10 times larger
 Richter Scale - Scale for measuring
earthquake magnitude.
 A magnitude 7.0 earthquake generates 10
times larger amplitude waves than those of a
magnitude 6.0.
Copyright © 2010 Ryan P. Murphy
10 times larger
10 times larger
 Richter Scale - Scale for measuring
earthquake magnitude.
 A magnitude 7.0 earthquake generates 10
times larger amplitude waves than those of a
magnitude 6.0.
Copyright © 2010 Ryan P. Murphy
10 times larger
10 times larger
Richter Scale: Learn More at..
http://earthquake.usgs.gov/learn/topics/richter.php
• Top 10 Largest earthquakes in the world
since 1900.
Learn more about the Top Ten Earthquakes at…
http://earthquake.usgs.gov/earthquakes/world/10_
largest_world.php
• #10) 1957 Andreanof Islands, Alaska
Magnitude 8.6
Copyright © 2010 Ryan P. Murphy
• #9) 1950 Assam - Tibet
• Magnitude 8.6
Copyright © 2010 Ryan P. Murphy
• #8) 2005 Northern Sumatra, Indonesia
• Magnitude 8.6
Copyright © 2010 Ryan P. Murphy
• #8) 2005 Northern
Sumatra, Indonesia
• Magnitude 8.6
Copyright © 2010 Ryan P. Murphy
“Hoot” “Hoot” “I sure
hope everyone is
safe.”
• #8) 2005 Northern
Sumatra, Indonesia
• Magnitude 8.6
Copyright © 2010 Ryan P. Murphy
“Hoot” “Hoot” “I sure
hope everyone is
safe.”
• #7) 1965 Rat Islands, Alaska
• Magnitude 8.7
Copyright © 2010 Ryan P. Murphy
• #6) 1906 Off the Coast of Ecuador
• Magnitude 8.8
Copyright © 2010 Ryan P. Murphy
• #5) 2010 Offshore of Chile
• Magnitude 8.8
Copyright © 2010 Ryan P. Murphy
• #4) 1952 Kamchatka
• Magnitude 9.0
Copyright © 2010 Ryan P. Murphy
• #4) 2011 Japan
• Magnitude 9.0
Copyright © 2010 Ryan P. Murphy
• Japanese earthquake, tsunami, and
dangers associated with nuclear power /
meltdown occurred.
• #3) 2004 Off the coast of Northern
Sumatra,
• Magnitude 9.1
Copyright © 2010 Ryan P. Murphy
• #2) 1964 Prince William Sound, Alaska
• Magnitude 9.2
Copyright © 2010 Ryan P. Murphy
• #1) Chile 1960
• Magnitude 9.5
Copyright © 2010 Ryan P. Murphy
• Other notable earthquakes.
– New Madrid Missouri Earthquake 1811-1812
– Between 7 and 8 on Richter Scale
– Area was sparsely populated in the 1800‟s
• Other notable earthquakes.
– New Madrid Missouri Earthquake 1811-1812
– Between 7 and 8 on Richter Scale
– Area was sparsely populated in the 1800‟s
• The Loma Prieta Earthquake (World Series
Earthquake) 1989
– Hit San Francisco Bay Area (6.9)
• San Francisco Earthquake 1906
– Huge death toll from collapse of buildings and
fire storm that emerged as a result.
– Magnitude 7.7 – 8.25
• The Great Kantō earthquake (1923) Mainland
Japan.
– 7.9 on the Richter Scale (140,000 dead)
– Occurred at lunchtime and many fires erupted
from stoves that fell over. (Firestorm)
– Typhoon also hit the area at the same time.
• Many more earthquakes have devastated
humanity than were presented in this short
list.
• Many more earthquakes have devastated
humanity than were presented in this short
list.
• Many more earthquakes have devastated
humanity than were presented in this short
list.
• Final Warning. The Cascadia Fault
– The US Northwest is struck by a major
earthquake every 240 years on average.
– It‟s been 311 years since the last major quake.
• Recent earthquakes over last seven days
from around the world and magnitude.
– Note how most earthquakes will be on plate
boundaries.
– http://earthquake.usgs.gov/earthquakes/map/
• You can now skip ahead a bit to complete
this question.
• You can now skip ahead a bit to complete
this question.
 Epicenter: The point on the earth's surface
that is directly above the hypocenter or
focus.
 -
Copyright © 2010 Ryan P. Murphy
 Epicenter: The point on the earth's surface
that is directly above the hypocenter or
focus.
Just above the earthquake
Copyright © 2010 Ryan P. Murphy
 Epicenter: The point on the earth's surface
that is directly above the hypocenter or
focus.
Just above the earthquake / focus
Copyright © 2010 Ryan P. Murphy
 Epicenter: The point on the earth's surface
that is directly above the hypocenter or
focus.
Just above the earthquake / focus /
hypocenter
Copyright © 2010 Ryan P. Murphy
 Epicenter: The point on the earth's surface
that is directly above the hypocenter or
focus.
Just above the earthquake / focus /
hypocenter
Copyright © 2010 Ryan P. Murphy
• Activity! Sheet
Provided
– Locating the Epicenter,
Hypocenter, and some
basic Origami
– Please cut out the box
– Color it / label
epicenter, hypocenter,
fault line.
• Color Seismic Waves
Red
– Fold it correctly and
tape it together.
– Be ready for quiz on
next slide.
• Activity! Sheet
Provided
– Locating the Epicenter,
Hypocenter, and some
basic Origami
– Please cut out the box
– Color it / label
epicenter, hypocenter,
fault line.
• Color Seismic Waves
Red
– Fold it correctly and
tape it together.
– Be ready for quiz on
next slide.
• Activity! Sheet
Provided
– Locating the Epicenter,
Hypocenter, and some
basic Origami
– Please cut out the box
– Color it / label
epicenter, hypocenter,
fault line.
• Color Seismic Waves
Red
– Fold it correctly and
tape it together.
– Be ready for quiz on
next slide.
• Activity! Sheet
Provided
– Locating the Epicenter,
Hypocenter, and some
basic Origami
– Please cut out the box
– Color it / label
epicenter, hypocenter,
fault line.
• Color Seismic Waves
Red
– Fold it correctly and
tape it together.
– Be ready for quiz on
next slide.
• Activity! Sheet
Provided
– Locating the Epicenter,
Hypocenter, and some
basic Origami
– Please cut out the box
– Color it / label
epicenter, hypocenter,
fault line.
• Color Seismic Waves
Red
– Fold it correctly and
tape it together.
– Be ready for quiz on
next slide.
• Activity! Sheet
Provided
– Locating the Epicenter,
Hypocenter, and some
basic Origami
– Please cut out the box
– Color it / label
epicenter, hypocenter,
fault line.
• Color Seismic Waves
Red
– Fold it correctly and
tape it together.
– Be ready for quiz on
next slide.
• Activity! Sheet
Provided
– Locating the Epicenter,
Hypocenter, and some
basic Origami
– Please cut out the box
– Color it / label
epicenter, hypocenter,
fault line.
• Color Seismic Waves
Red
– Fold it correctly and
tape it together.
– Be ready for quiz on
next slide.
• Activity! Sheet
Provided
– Locating the Epicenter,
Hypocenter, and some
basic Origami
– Please cut out the box
– Color it / label
epicenter, hypocenter,
fault line.
• Color Seismic Waves
Red
– Fold it correctly and
tape it together.
– Be ready for quiz on
next slide.
No directions on folding. Science
is learning through experience in
its simplest form. Figure it out.
Hypocenter / Focus
Hypocenter / Focus
Hypocenter / Focus
Primary Waves
Secondary
Waves
Hypocenter / Focus
Primary Waves
Secondary
Waves
Hypocenter / Focus
Primary Waves
Secondary
Waves
Fault Line
Hypocenter / Focus
Primary Waves
Secondary
Waves
Fault Line
Hypocenter / Focus
Epicenter
Primary Waves
Secondary
Waves
Fault Line
Hypocenter / Focus
Epicenter
Primary Waves
Secondary
Waves
Fault Line
Hypocenter / Focus
Epicenter
Primary Waves
Secondary
Waves
Reverse /
Thrust Fault
Fault Line
Hypocenter / Focus
Epicenter
Primary Waves
Secondary
Waves
Reverse /
Thrust Fault
Fault Line
Hypocenter / Focus
Epicenter
Primary Waves
Secondary
Waves
Reverse /
Thrust Fault
Fault Line
Hypocenter / Focus
Epicenter
Primary Waves
Secondary
Waves
Reverse /
Thrust Fault
Fault Line
“OH-No!”
“One more time.”
Reverse /
Thrust Fault
Reverse /
Thrust Fault
Reverse /
Thrust Fault
Fault Line
Reverse /
Thrust Fault
Fault Line
Hypocenter / Focus
Reverse /
Thrust Fault
Fault Line
Hypocenter / Focus
Reverse /
Thrust Fault
Fault Line
Hypocenter / Focus
Primary Waves
Secondary
Waves
Reverse /
Thrust Fault
Fault Line
Hypocenter / Focus
Primary Waves
Secondary
Waves
Reverse /
Thrust Fault
Fault Line
Hypocenter / Focus
Epicenter
Primary Waves
Secondary
Waves
Reverse /
Thrust Fault
Fault Line
Hypocenter / Focus
Epicenter
Primary Waves
Secondary
Waves
Reverse /
Thrust Fault
Fault Line
• An earthquake requires three monitoring
stations to determine it‟s location.
• An earthquake requires three monitoring
stations to determine it‟s location.
P and S waves travel at known
velocities through the earth. S waves
are slower than P waves by a known
amount.
• An earthquake requires three monitoring
stations to determine it‟s location.
P and S waves travel at known
velocities through the earth. S waves
are slower than P waves by a known
amount. Therefore, the farther a
seismic recording station is from the
earthquake epicenter the greater the
difference in time of arrival between
the P and S wave.
S and P
interval
S and P
interval
S and P
interval
S and P
interval
S and P
interval
S and P
interval
S and P
interval
S and P
interval
S and P
interval
S and P
interval
S and P
interval
S and P
interval
S and P
interval
S and P
interval
S and P
interval
S and P
interval
S and P
interval
S and P
interval
S and P
interval
S and P
interval
S and P
interval
S and P
interval
• Activity! S and P Gap.
– Have two students line up next to each other
against the wall.
– Label one as the fast walker (P-wave) and one as
the slow walker (S-wave “Side to Side Macho
Man”)
– Each students begins walking across room at
same time and various students (monitoring
stations) time the gap between the two students
as they walk by.
– Start timer when P-wave passes, and end when
S-wave arrives.
– Have the monitor stations share times.
• Activity! S and P Gap.
P-Wave
S-Wave
• Activity! S and P Gap.
P-Wave
S-Wave
• Activity! S and P Gap.
P-Wave
S-Wave
• Activity! S and P Gap.
P-Wave
S-Wave
• Activity! S and P Gap.
P-Wave
S-Wave
• Activity! S and P Gap.
P-Wave
S-Wave
START TIMER
• Activity! S and P Gap.
P-Wave
S-Wave
START TIMER
• Activity! S and P Gap.
P-Wave
S-Wave
START TIMER
• Activity! S and P Gap.
P-Wave
S-Wave
START TIMER
• Activity! S and P Gap.
P-Wave
S-Wave
END TIMER START TIMER
• Activity! S and P Gap.
P-Wave
S-Wave
END TIMER START TIMER
• Activity! S and P Gap.
P-Wave
S-Wave
END TIMER START TIMER START
• Activity! S and P Gap.
P-Wave
S-Wave
END TIMER START TIMER START
• Activity! S and P Gap.
P-Wave
S-Wave
END TIMER END TIMER START
• Activity! S and P Gap.
P-Wave
S-Wave
END TIMER END TIMER START
• Activity! S and P Gap.
P-Wave
S-Wave
END TIMER END TIMER START
• Activity! S and P Gap.
P-Wave
S-Wave
END TIMER END TIMER START
• Activity! S and P Gap.
P-Wave
S-Wave
END TIMER END TIMER END
• Activity! S and P Gap.
P-Wave
S-Wave
END TIMER END TIMER END
• Activity! S and P Gap.
P-Wave
S-Wave
END TIMER END TIMER END
• Activity! S and P Gap.
P-Wave
S-Wave
END TIMER END TIMER END
• Activity! S and P Gap.
P-Wave
S-Wave
END TIMER END TIMER END
Compare times of the gap
between the P wave and the S
wave (should be close)
0:00 0:00 0:00
• An earthquake requires three monitoring
stations to determine its location.
– Where‟s the epicenter of the earthquake
below?
A
A
A
S and P Wave gap
time / distance
measured from
monitoring station
B
A
B
A
B
A
B
C
A
• Where „s the earthquake below?
B
C
A
• Where „s the earthquake below?
B
C
A Epicenter
• Where „s the earthquake epicenter below?
B
C
A
D
E
F
G
• Where „s the earthquake epicenter below?
B
C
A
D
E
F
G
• Where „s the earthquake epicenter below?
B
C
A
D
E
F
G
• Where „s the earthquake epicenter below?
B
C
A
D
E
F
G
• Where „s the earthquake epicenter below?
B
C
A
D
E
F
G
• Where „s the earthquake epicenter below?
B
C
A
Epicenter
D
E
F
G
• Where „s the earthquake epicenter below?
B C
A
D
E
F
G
• Where „s the earthquake epicenter below?
B C
A
D
E
F
G
• Where „s the earthquake epicenter below?
B C
A
D
E
F
G
• Where „s the earthquake epicenter below?
B C
A
D
E
F
G
• Where „s the earthquake epicenter below?
B C
A
D
E
F
G
• Where „s the earthquake epicenter below?
B C
A
D
E
F
G
• Where „s the earthquake epicenter below?
B C
A
D
E
F
G
• Quick Activity! Working the process
backwards.
– Make a right triangle in the middle of your page.
– Mark each point (A, B, C) These are seismic
activity monitoring stations.
– Create and epicenter near the triangle.
– Use a compass to create a circle from each
monitoring station (center of circle) through the
epicenter (perimeter of circle).
– Record radius (distance from monitoring station
to the epicenter). Visual next slide 
• Quick Activity! Working the process
backwards.
– Make a right triangle in the middle of your page.
– Mark each point (A, B, C) These are seismic
activity monitoring stations.
– Create a epicenter near the triangle.
– Use a compass to create a circle from each
monitoring station (center of circle) through the
epicenter (perimeter of circle).
– Record radius (distance from monitoring station
to the epicenter). Visual next slide 
A
A
B
A
B
C
A
B
C
*
Epicenter
A
B
C
*
Epicenter
A
B
C
*
Epicenter
A
B
C
*
Epicenter
A
B
C
*
Epicenter
A
B
C
*
Epicenter
A
B
C
*
Epicenter
*
A
B
C
*
Epicenter
*
Measure the distances from
each monitoring station to
the epicenter.
A
B
C
*
Epicenter
*
Measure the distances from
each monitoring station to
the epicenter.
Distance to epicenter determined by the
gap between the arrival of the first P
wave and the first S wave
• Activity – Finding the Epicenter
• http://www.geology.ar.gov/pdf/Locating_an_e
picenter_activity.pdf
• http://www.oakton.edu/user/4/billtong/eas100
lab/lab10quake.htm
• (Advanced)
• http://www.geo.mtu.edu/UPSeis/locating.html
Copyright © 2010 Ryan P. Murphy
Learn more at…
http://www.geo.mtu.edu
/UPSeis/locating.html
• Do earthquakes kill people?
Copyright © 2010 Ryan P. Murphy
• Answer! Earthquakes don‟t generally kill
people,
Copyright © 2010 Ryan P. Murphy
• Answer! Earthquakes don‟t generally kill
people, poorly built buildings do.
Copyright © 2010 Ryan P. Murphy
• The type of soil a building is on, and the
design / construction of the building has a lot
to do with how well the building will fare in an
earthquake.
Copyright © 2010 Ryan P. Murphy
• Liquefaction: A process where sand or
landfill will often change from a wet solid
into a dense liquid, which further amplifies
shaking.
Copyright © 2010 Ryan P. Murphy
• Liquefaction: A process where sand or
landfill will often change from a wet solid
into a dense liquid, which further amplifies
shaking.
Copyright © 2010 Ryan P. Murphy
Liquefaction Activity / Demo at…
http://www.exploratorium.edu/faultline/activezone/liquefactio
n.html
More activities and info found at…
https://media.up.edu/Physics/TOLE/EarthquakeTsunamiHazar
ds/LessonPlans/EQHazardMaps_Liquefaction-TOTLE.pdf
• Activity!
– Fill a tray with dry sand several inches or at
least 12 cm.
– Fill a one liter soda bottle with water and cap
and bury into the sand.
• Activity!
– Fill a tray with dry sand several inches or at
least 12 cm.
– Fill a one liter soda bottle with water and cap
and bury into the sand.
– Shake tray and observe what happens.
• Activity!
– Fill a tray with dry sand several inches or at
least 12 cm.
– Fill a one liter soda bottle with water and cap
and bury into the sand.
– Shake tray and observe what happens.
• Activity!
– Moisten sand but don‟t super saturate.
– Shake tray and observe what happens.
• Activity!
– Moisten sand but don‟t super saturate.
– Shake tray and observe what happens.
• Activity!
– Fill tray with lots of water so water is visible on
the surface..
– Shake tray and observe what happens.
• Activity!
– Fill tray with lots of water so water is visible on
the surface..
– Shake tray and observe what happens.
• Activity!
– Fill tray with lots of water so water is visible on
the surface..
– Shake tray and observe what happens.
– Why?
• Activity!
– Fill tray with lots of water so water is visible on
the surface..
– Shake tray and observe what happens.
– Why? Liquefaction. The sand (solid) mixed
with water (liquid) and acted as a liquid.
• Activity!
– Fill tray with lots of water so water is visible on
the surface..
– Shake tray and observe what happens.
– Why? Liquefaction. The sand (solid) mixed
with water (liquid) and acted as a liquid.
• Videos (Optional) Liquefaction
– http://www.youtube.com/watch?v=rn3oAvmZY8k
Japan
– http://www.youtube.com/watch?v=tvYKcCS_J7Y
Christchurch New Zealand (How it happens)
Copyright © 2010 Ryan P. Murphy
• Building on loose sand and poorly packed fill
material increases the intensity of the an
earthquake.
Copyright © 2010 Ryan P. Murphy
• Building on loose sand and poorly packed fill
material increases the intensity of the an
earthquake.
– Building on solid bedrock is better.
Copyright © 2010 Ryan P. Murphy
• Many of our major cities have large areas
that are built on sand and fill. 
Copyright © 2010 Ryan P. Murphy
• Which area experienced liquefaction
based on the seismic waves?
A
B
Copyright © 2010 Ryan P. Murphy
• Answer! Area A because the seismic
waves were more severe.
A
B
Copyright © 2010 Ryan P. Murphy
• Try and figure out the picture beneath the
boxes. Raise your hand when you think
you know.
– You only get one guess.
Copyright © 2010 Ryan P. Murphy
http://sciencepowerpoint.com/Website Link:
• This part of the PowerPoint roadmap is just one small
part of my Geology Topics Unit. This unit includes…
• A six part 6,000 Slide PowerPoint Presentation / unit
roadmap full of activities, review questions, games, video
links, flashcards, materials list, and much more.
• A 18 bundled homework package, modified version, 19
pages of unit notes, 6 PowerPoint Review Games of
100+ slides each, videos, rubrics, and much more that
all chronologically follow the unit slideshow.
• This is a fantastic unit for any Earth Science Class.
• http://sciencepowerpoint.com/Geology_Unit.html
Areas of Focus within The Geology Topics Unit:
-Areas of Focus within The Geology Topics Unit: Plate Tectonics, Evidence for
Plate Tectonics, Pangea, Energy Waves, Layers of the Earth, Heat Transfer,
Types of Crust, Plate Boundaries, Hot Spots, Volcanoes, Positives and
Negatives of Volcanoes, Types of Volcanoes, Parts of a Volcano, Magma, Types
of Lava, Viscosity, Earthquakes, Faults, Folds, Seismograph, Richter Scale,
Seismograph, Tsunami‟s, Rocks, Minerals, Crystals, Uses of Minerals, Types of
Crystals, Physical Properties of Minerals, Rock Cycle, Common Igneous Rocks,
Common Sedimentary Rocks, Common Metamorphic Rocks., Age of the Earth,
Uniformitarianism, Principle of Superposition, Earth History, Time Units,
Timeline of Events, Basic Evolution, Mass Extinction Events, Dinosaurs, Early
Mammals, and more.
Full Unit can be found at…
http://sciencepowerpoint.com/Geology_Unit.html
• This was a very brief tour. Please visit the
links below to learn more about each of the
units in this curriculum package.
– These units take me about four years to complete
with my students in grades 5-10.
Earth Science Units Extended Tour Link and Curriculum Guide
Geology Topics Unit http://sciencepowerpoint.com/Geology_Unit.html
Astronomy Topics Unit http://sciencepowerpoint.com/Astronomy_Unit.html
Weather and Climate Unit http://sciencepowerpoint.com/Weather_Climate_Unit.html
Soil Science, Weathering, More http://sciencepowerpoint.com/Soil_and_Glaciers_Unit.html
Water Unit http://sciencepowerpoint.com/Water_Molecule_Unit.html
Rivers Unit http://sciencepowerpoint.com/River_and_Water_Quality_Unit.html
= Easier = More Difficult = Most Difficult
5th – 7th grade 6th – 8th grade 8th – 10th grade
Physical Science Units Extended Tour Link and Curriculum Guide
Science Skills Unit http://sciencepowerpoint.com/Science_Introduction_Lab_Safety_Metric_Methods.
html
Motion and Machines Unit http://sciencepowerpoint.com/Newtons_Laws_Motion_Machines_Unit.html
Matter, Energy, Envs. Unit http://sciencepowerpoint.com/Energy_Topics_Unit.html
Atoms and Periodic Table Unit http://sciencepowerpoint.com/Atoms_Periodic_Table_of_Elements_Unit.html
Life Science Units Extended Tour Link and Curriculum Guide
Human Body / Health Topics
http://sciencepowerpoint.com/Human_Body_Systems_and_Health_Topics_Unit.html
DNA and Genetics Unit http://sciencepowerpoint.com/DNA_Genetics_Unit.html
Cell Biology Unit http://sciencepowerpoint.com/Cellular_Biology_Unit.html
Infectious Diseases Unit http://sciencepowerpoint.com/Infectious_Diseases_Unit.html
Taxonomy and Classification Unit http://sciencepowerpoint.com/Taxonomy_Classification_Unit.html
Evolution / Natural Selection Unit http://sciencepowerpoint.com/Evolution_Natural_Selection_Unit.html
Botany Topics Unit http://sciencepowerpoint.com/Plant_Botany_Unit.html
Ecology Feeding Levels Unit http://sciencepowerpoint.com/Ecology_Feeding_Levels_Unit.htm
Ecology Interactions Unit http://sciencepowerpoint.com/Ecology_Interactions_Unit.html
Ecology Abiotic Factors Unit http://sciencepowerpoint.com/Ecology_Abiotic_Factors_Unit.html
• More Units Available at…
Earth Science: The Soil Science and Glaciers Unit, The Geology Topics
Unit, The Astronomy Topics Unit, The Weather and Climate Unit, and The
Rivers and Water Quality Unit, The Water Molecule Unit.
Physical Science: The Laws of Motion and Machines Unit, The Atoms
and Periodic Table Unit, The Energy and the Environment Unit, and
Science Skills Unit.
Life Science: The Diseases and Cells Unit, The DNA and Genetics Unit,
The Life Topics Unit, The Plant Unit, The Taxonomy and Classification
Unit, Ecology: Feeding Levels Unit, Ecology: Interactions Unit, Ecology:
Abiotic Factors, The Evolution and Natural Selection Unit and The Human
Body Systems and Health Topics Unit
Copyright © 2010 Ryan P. Murphy
• The entire four year curriculum can be found at...
http://sciencepowerpoint.com/ Please feel free to
contact me with any questions you may have.
Thank you for your interest in this curriculum.
Sincerely,
Ryan Murphy M.Ed
www.sciencepowerpoint@gmail.com
http://sciencepowerpoint.com/Website Link:

More Related Content

What's hot (20)

Earthquake
EarthquakeEarthquake
Earthquake
 
earthquake prediction
earthquake predictionearthquake prediction
earthquake prediction
 
EarthQuakes
EarthQuakesEarthQuakes
EarthQuakes
 
Earthquakes
EarthquakesEarthquakes
Earthquakes
 
3.4.1 Earthquake Hazards
3.4.1 Earthquake Hazards3.4.1 Earthquake Hazards
3.4.1 Earthquake Hazards
 
What Causes Earthquakes?
What Causes Earthquakes?What Causes Earthquakes?
What Causes Earthquakes?
 
Earthquake
EarthquakeEarthquake
Earthquake
 
Earthquakes-In The Eye of Civil Engineer
Earthquakes-In The Eye of Civil EngineerEarthquakes-In The Eye of Civil Engineer
Earthquakes-In The Eye of Civil Engineer
 
Landslides
LandslidesLandslides
Landslides
 
Volcanoes - A Presentation
Volcanoes - A PresentationVolcanoes - A Presentation
Volcanoes - A Presentation
 
Tsunami
TsunamiTsunami
Tsunami
 
Seismic waves
Seismic wavesSeismic waves
Seismic waves
 
Earthquake and effects of it
Earthquake and effects of itEarthquake and effects of it
Earthquake and effects of it
 
Fault
FaultFault
Fault
 
Tides & Waves
Tides & WavesTides & Waves
Tides & Waves
 
Earthquake and its causes
Earthquake and its causesEarthquake and its causes
Earthquake and its causes
 
Faults
FaultsFaults
Faults
 
Earthquake
EarthquakeEarthquake
Earthquake
 
Earthquakes
EarthquakesEarthquakes
Earthquakes
 
LANDSLIDE HAZARDS: LEARNING FROM GLOBAL DISASTER LABORATORIES
LANDSLIDE HAZARDS: LEARNING FROM GLOBAL DISASTER LABORATORIESLANDSLIDE HAZARDS: LEARNING FROM GLOBAL DISASTER LABORATORIES
LANDSLIDE HAZARDS: LEARNING FROM GLOBAL DISASTER LABORATORIES
 

Viewers also liked

4.2 recording earthquakes
4.2 recording earthquakes4.2 recording earthquakes
4.2 recording earthquakesmojavehack
 
Richter Scale 1 To 10
Richter Scale 1 To 10Richter Scale 1 To 10
Richter Scale 1 To 10guest61f30cd
 
Science Aftershock
Science AftershockScience Aftershock
Science AftershockOmegapride
 
Flood detection and warning system
Flood detection and warning systemFlood detection and warning system
Flood detection and warning systemSatham BE
 
Tsunami warning system
Tsunami warning systemTsunami warning system
Tsunami warning systemPushkar Dutt
 
Tsunami warning system
Tsunami warning systemTsunami warning system
Tsunami warning systems1180052
 
Sea floor spreading powerpoint
Sea floor spreading powerpointSea floor spreading powerpoint
Sea floor spreading powerpointkristannsnyder
 
Ppt on water level indicator
Ppt on water level indicatorPpt on water level indicator
Ppt on water level indicatorpalwinder virk
 

Viewers also liked (12)

Richter Scale
Richter ScaleRichter Scale
Richter Scale
 
4.2 recording earthquakes
4.2 recording earthquakes4.2 recording earthquakes
4.2 recording earthquakes
 
Richter Scale 1 To 10
Richter Scale 1 To 10Richter Scale 1 To 10
Richter Scale 1 To 10
 
earthquakes ppt
earthquakes pptearthquakes ppt
earthquakes ppt
 
Science Aftershock
Science AftershockScience Aftershock
Science Aftershock
 
Flood detection and warning system
Flood detection and warning systemFlood detection and warning system
Flood detection and warning system
 
Earthquake seismology
Earthquake seismologyEarthquake seismology
Earthquake seismology
 
Tsunami warning system
Tsunami warning systemTsunami warning system
Tsunami warning system
 
Tsunami
TsunamiTsunami
Tsunami
 
Tsunami warning system
Tsunami warning systemTsunami warning system
Tsunami warning system
 
Sea floor spreading powerpoint
Sea floor spreading powerpointSea floor spreading powerpoint
Sea floor spreading powerpoint
 
Ppt on water level indicator
Ppt on water level indicatorPpt on water level indicator
Ppt on water level indicator
 

Similar to Seismograph, Richter Scale, Epicenter, Hypocenter Earth Science Lesson PowerPoint

Volcanoes, Hawaii Hot Spot, Yellowstone Supervolcano Earth Science Lesson Pow...
Volcanoes, Hawaii Hot Spot, Yellowstone Supervolcano Earth Science Lesson Pow...Volcanoes, Hawaii Hot Spot, Yellowstone Supervolcano Earth Science Lesson Pow...
Volcanoes, Hawaii Hot Spot, Yellowstone Supervolcano Earth Science Lesson Pow...www.sciencepowerpoint.com
 
Taxonomy and Classification Lesson PowerPoint
Taxonomy and Classification Lesson PowerPoint Taxonomy and Classification Lesson PowerPoint
Taxonomy and Classification Lesson PowerPoint www.sciencepowerpoint.com
 
Minerals, Geology, Earth Science Lesson PowerPoint
Minerals, Geology, Earth Science Lesson PowerPointMinerals, Geology, Earth Science Lesson PowerPoint
Minerals, Geology, Earth Science Lesson PowerPointwww.sciencepowerpoint.com
 
Tides, Neap Tide, Spring Tide, Astronomy Lesson PowerPoint
Tides, Neap Tide, Spring Tide, Astronomy Lesson PowerPointTides, Neap Tide, Spring Tide, Astronomy Lesson PowerPoint
Tides, Neap Tide, Spring Tide, Astronomy Lesson PowerPointwww.sciencepowerpoint.com
 
Kingdoms of Life, Whittakers System of Organization, Biology Lesson PowerPoint
Kingdoms of Life, Whittakers System of Organization, Biology Lesson PowerPointKingdoms of Life, Whittakers System of Organization, Biology Lesson PowerPoint
Kingdoms of Life, Whittakers System of Organization, Biology Lesson PowerPointwww.sciencepowerpoint.com
 
Magnetism PowerPoint, Physical Science Lesson
Magnetism PowerPoint, Physical Science LessonMagnetism PowerPoint, Physical Science Lesson
Magnetism PowerPoint, Physical Science Lessonwww.sciencepowerpoint.com
 
Positive and Negatives of Volcanoes Earth Science Lesson PowerPoint
Positive and Negatives of Volcanoes Earth Science Lesson PowerPointPositive and Negatives of Volcanoes Earth Science Lesson PowerPoint
Positive and Negatives of Volcanoes Earth Science Lesson PowerPointwww.sciencepowerpoint.com
 
Periodic Table of the Elements Lesson PowerPoint
Periodic Table of the Elements Lesson PowerPointPeriodic Table of the Elements Lesson PowerPoint
Periodic Table of the Elements Lesson PowerPointwww.sciencepowerpoint.com
 
Faults and earthquakes
Faults and earthquakesFaults and earthquakes
Faults and earthquakessssshekhar
 
Earth System History, Timeline of Earth Events, Geology Lesson PowerPoint
Earth System History, Timeline of Earth Events, Geology Lesson PowerPointEarth System History, Timeline of Earth Events, Geology Lesson PowerPoint
Earth System History, Timeline of Earth Events, Geology Lesson PowerPointwww.sciencepowerpoint.com
 
Volcano Features, Earth Science Lesson PowerPoint, Buld a Volcano
Volcano Features, Earth Science Lesson PowerPoint, Buld a VolcanoVolcano Features, Earth Science Lesson PowerPoint, Buld a Volcano
Volcano Features, Earth Science Lesson PowerPoint, Buld a Volcanowww.sciencepowerpoint.com
 
Earth System History, Timeline of Earth Events, Geologic History Earth Scienc...
Earth System History, Timeline of Earth Events, Geologic History Earth Scienc...Earth System History, Timeline of Earth Events, Geologic History Earth Scienc...
Earth System History, Timeline of Earth Events, Geologic History Earth Scienc...www.sciencepowerpoint.com
 
Winds, Global Winds, Weather and Climate Unit PowerPoint, Earth Science
Winds, Global Winds, Weather and Climate Unit PowerPoint, Earth ScienceWinds, Global Winds, Weather and Climate Unit PowerPoint, Earth Science
Winds, Global Winds, Weather and Climate Unit PowerPoint, Earth Sciencewww.sciencepowerpoint.com
 
Earthquake Presentation
Earthquake PresentationEarthquake Presentation
Earthquake Presentationsingingstar818
 
Earthquake Presentation
Earthquake PresentationEarthquake Presentation
Earthquake Presentationcarlicosenza
 
GEOG 100--Lecture 14--Earthquakes
GEOG 100--Lecture 14--EarthquakesGEOG 100--Lecture 14--Earthquakes
GEOG 100--Lecture 14--Earthquakesangelaorr
 
Einstein, E=mc2, relativity, gravity, spacetime lesson PowerPoint
Einstein, E=mc2, relativity, gravity, spacetime lesson PowerPointEinstein, E=mc2, relativity, gravity, spacetime lesson PowerPoint
Einstein, E=mc2, relativity, gravity, spacetime lesson PowerPointwww.sciencepowerpoint.com
 

Similar to Seismograph, Richter Scale, Epicenter, Hypocenter Earth Science Lesson PowerPoint (20)

Tsunami Earth Science Lesson PowerPoint
Tsunami Earth Science Lesson PowerPointTsunami Earth Science Lesson PowerPoint
Tsunami Earth Science Lesson PowerPoint
 
Volcanoes, Hawaii Hot Spot, Yellowstone Supervolcano Earth Science Lesson Pow...
Volcanoes, Hawaii Hot Spot, Yellowstone Supervolcano Earth Science Lesson Pow...Volcanoes, Hawaii Hot Spot, Yellowstone Supervolcano Earth Science Lesson Pow...
Volcanoes, Hawaii Hot Spot, Yellowstone Supervolcano Earth Science Lesson Pow...
 
Taxonomy and Classification Lesson PowerPoint
Taxonomy and Classification Lesson PowerPoint Taxonomy and Classification Lesson PowerPoint
Taxonomy and Classification Lesson PowerPoint
 
Minerals, Geology, Earth Science Lesson PowerPoint
Minerals, Geology, Earth Science Lesson PowerPointMinerals, Geology, Earth Science Lesson PowerPoint
Minerals, Geology, Earth Science Lesson PowerPoint
 
Tides, Neap Tide, Spring Tide, Astronomy Lesson PowerPoint
Tides, Neap Tide, Spring Tide, Astronomy Lesson PowerPointTides, Neap Tide, Spring Tide, Astronomy Lesson PowerPoint
Tides, Neap Tide, Spring Tide, Astronomy Lesson PowerPoint
 
Kingdoms of Life, Whittakers System of Organization, Biology Lesson PowerPoint
Kingdoms of Life, Whittakers System of Organization, Biology Lesson PowerPointKingdoms of Life, Whittakers System of Organization, Biology Lesson PowerPoint
Kingdoms of Life, Whittakers System of Organization, Biology Lesson PowerPoint
 
Magnetism PowerPoint, Physical Science Lesson
Magnetism PowerPoint, Physical Science LessonMagnetism PowerPoint, Physical Science Lesson
Magnetism PowerPoint, Physical Science Lesson
 
Positive and Negatives of Volcanoes Earth Science Lesson PowerPoint
Positive and Negatives of Volcanoes Earth Science Lesson PowerPointPositive and Negatives of Volcanoes Earth Science Lesson PowerPoint
Positive and Negatives of Volcanoes Earth Science Lesson PowerPoint
 
Periodic Table of the Elements Lesson PowerPoint
Periodic Table of the Elements Lesson PowerPointPeriodic Table of the Elements Lesson PowerPoint
Periodic Table of the Elements Lesson PowerPoint
 
Faults and earthquakes
Faults and earthquakesFaults and earthquakes
Faults and earthquakes
 
Earth System History, Timeline of Earth Events, Geology Lesson PowerPoint
Earth System History, Timeline of Earth Events, Geology Lesson PowerPointEarth System History, Timeline of Earth Events, Geology Lesson PowerPoint
Earth System History, Timeline of Earth Events, Geology Lesson PowerPoint
 
Volcano Features, Earth Science Lesson PowerPoint, Buld a Volcano
Volcano Features, Earth Science Lesson PowerPoint, Buld a VolcanoVolcano Features, Earth Science Lesson PowerPoint, Buld a Volcano
Volcano Features, Earth Science Lesson PowerPoint, Buld a Volcano
 
Newton's 3rd Law of Motion PowerPoint
Newton's 3rd Law of Motion PowerPointNewton's 3rd Law of Motion PowerPoint
Newton's 3rd Law of Motion PowerPoint
 
Earth System History, Timeline of Earth Events, Geologic History Earth Scienc...
Earth System History, Timeline of Earth Events, Geologic History Earth Scienc...Earth System History, Timeline of Earth Events, Geologic History Earth Scienc...
Earth System History, Timeline of Earth Events, Geologic History Earth Scienc...
 
Winds, Global Winds, Weather and Climate Unit PowerPoint, Earth Science
Winds, Global Winds, Weather and Climate Unit PowerPoint, Earth ScienceWinds, Global Winds, Weather and Climate Unit PowerPoint, Earth Science
Winds, Global Winds, Weather and Climate Unit PowerPoint, Earth Science
 
Earthquake Presentation
Earthquake PresentationEarthquake Presentation
Earthquake Presentation
 
Earthquake Presentation
Earthquake PresentationEarthquake Presentation
Earthquake Presentation
 
Earthquakes notes
Earthquakes notesEarthquakes notes
Earthquakes notes
 
GEOG 100--Lecture 14--Earthquakes
GEOG 100--Lecture 14--EarthquakesGEOG 100--Lecture 14--Earthquakes
GEOG 100--Lecture 14--Earthquakes
 
Einstein, E=mc2, relativity, gravity, spacetime lesson PowerPoint
Einstein, E=mc2, relativity, gravity, spacetime lesson PowerPointEinstein, E=mc2, relativity, gravity, spacetime lesson PowerPoint
Einstein, E=mc2, relativity, gravity, spacetime lesson PowerPoint
 

More from www.sciencepowerpoint.com

Flooding, Dams, Levee's PowerPoint Quiz Game
Flooding, Dams, Levee's PowerPoint Quiz GameFlooding, Dams, Levee's PowerPoint Quiz Game
Flooding, Dams, Levee's PowerPoint Quiz Gamewww.sciencepowerpoint.com
 
Flooding PowerPoint, Flood, Hydroelectric Dams
Flooding PowerPoint, Flood, Hydroelectric DamsFlooding PowerPoint, Flood, Hydroelectric Dams
Flooding PowerPoint, Flood, Hydroelectric Damswww.sciencepowerpoint.com
 
Name that Benthic Macroinvertebrates Quiz, Aquatic Insects
Name that Benthic Macroinvertebrates Quiz, Aquatic InsectsName that Benthic Macroinvertebrates Quiz, Aquatic Insects
Name that Benthic Macroinvertebrates Quiz, Aquatic Insectswww.sciencepowerpoint.com
 
Benthic Macroinvertebrates Lesson PowerPoint, Water Quality, Insects
Benthic Macroinvertebrates Lesson PowerPoint, Water Quality, InsectsBenthic Macroinvertebrates Lesson PowerPoint, Water Quality, Insects
Benthic Macroinvertebrates Lesson PowerPoint, Water Quality, Insectswww.sciencepowerpoint.com
 
Stream Table Lesson PowerPoint, Parts of River, River Erosion
Stream Table Lesson PowerPoint, Parts of River, River ErosionStream Table Lesson PowerPoint, Parts of River, River Erosion
Stream Table Lesson PowerPoint, Parts of River, River Erosionwww.sciencepowerpoint.com
 
Stream Order Lesson PowerPoint, River and Water Unit
Stream Order Lesson PowerPoint, River and Water UnitStream Order Lesson PowerPoint, River and Water Unit
Stream Order Lesson PowerPoint, River and Water Unitwww.sciencepowerpoint.com
 
Features of a River Visual Quiz, Stream Table
Features of a River Visual Quiz, Stream TableFeatures of a River Visual Quiz, Stream Table
Features of a River Visual Quiz, Stream Tablewww.sciencepowerpoint.com
 
River Unit Lesson PowerPoint, Watersheds, Stream Table,
River Unit Lesson PowerPoint, Watersheds, Stream Table, River Unit Lesson PowerPoint, Watersheds, Stream Table,
River Unit Lesson PowerPoint, Watersheds, Stream Table, www.sciencepowerpoint.com
 
Lake Turnover PowerPoint, Summer Stagnation, Epilimnion, Thermocline, Hypolim...
Lake Turnover PowerPoint, Summer Stagnation, Epilimnion, Thermocline, Hypolim...Lake Turnover PowerPoint, Summer Stagnation, Epilimnion, Thermocline, Hypolim...
Lake Turnover PowerPoint, Summer Stagnation, Epilimnion, Thermocline, Hypolim...www.sciencepowerpoint.com
 
Properties of Water PowerPoint, Adhesion, Cohesion, Surface Tension
Properties of Water PowerPoint, Adhesion, Cohesion, Surface TensionProperties of Water PowerPoint, Adhesion, Cohesion, Surface Tension
Properties of Water PowerPoint, Adhesion, Cohesion, Surface Tensionwww.sciencepowerpoint.com
 
Science Skills Unit Quiz Game, Metric System
Science Skills Unit Quiz Game, Metric SystemScience Skills Unit Quiz Game, Metric System
Science Skills Unit Quiz Game, Metric Systemwww.sciencepowerpoint.com
 

More from www.sciencepowerpoint.com (20)

Bacteria Quiz Game Lesson
Bacteria Quiz Game LessonBacteria Quiz Game Lesson
Bacteria Quiz Game Lesson
 
Rivers and Water Quality Quiz Game
Rivers and Water Quality Quiz GameRivers and Water Quality Quiz Game
Rivers and Water Quality Quiz Game
 
Flooding, Dams, Levee's PowerPoint Quiz Game
Flooding, Dams, Levee's PowerPoint Quiz GameFlooding, Dams, Levee's PowerPoint Quiz Game
Flooding, Dams, Levee's PowerPoint Quiz Game
 
Salmon and Fish Unit PowerPoint
Salmon and Fish Unit PowerPointSalmon and Fish Unit PowerPoint
Salmon and Fish Unit PowerPoint
 
Flooding PowerPoint, Flood, Hydroelectric Dams
Flooding PowerPoint, Flood, Hydroelectric DamsFlooding PowerPoint, Flood, Hydroelectric Dams
Flooding PowerPoint, Flood, Hydroelectric Dams
 
Name that Benthic Macroinvertebrates Quiz, Aquatic Insects
Name that Benthic Macroinvertebrates Quiz, Aquatic InsectsName that Benthic Macroinvertebrates Quiz, Aquatic Insects
Name that Benthic Macroinvertebrates Quiz, Aquatic Insects
 
Benthic Macroinvertebrates Lesson PowerPoint, Water Quality, Insects
Benthic Macroinvertebrates Lesson PowerPoint, Water Quality, InsectsBenthic Macroinvertebrates Lesson PowerPoint, Water Quality, Insects
Benthic Macroinvertebrates Lesson PowerPoint, Water Quality, Insects
 
Water Quality Unit Lesson PowerPoint
Water Quality Unit Lesson PowerPointWater Quality Unit Lesson PowerPoint
Water Quality Unit Lesson PowerPoint
 
Stream Table Lesson PowerPoint, Parts of River, River Erosion
Stream Table Lesson PowerPoint, Parts of River, River ErosionStream Table Lesson PowerPoint, Parts of River, River Erosion
Stream Table Lesson PowerPoint, Parts of River, River Erosion
 
Stream Order Lesson PowerPoint, River and Water Unit
Stream Order Lesson PowerPoint, River and Water UnitStream Order Lesson PowerPoint, River and Water Unit
Stream Order Lesson PowerPoint, River and Water Unit
 
Features of a River Visual Quiz, Stream Table
Features of a River Visual Quiz, Stream TableFeatures of a River Visual Quiz, Stream Table
Features of a River Visual Quiz, Stream Table
 
Watersheds PowerPoint
Watersheds PowerPointWatersheds PowerPoint
Watersheds PowerPoint
 
River Unit Lesson PowerPoint, Watersheds, Stream Table,
River Unit Lesson PowerPoint, Watersheds, Stream Table, River Unit Lesson PowerPoint, Watersheds, Stream Table,
River Unit Lesson PowerPoint, Watersheds, Stream Table,
 
Water Unit PowerPoint Quiz Game
Water Unit PowerPoint Quiz GameWater Unit PowerPoint Quiz Game
Water Unit PowerPoint Quiz Game
 
Lake Turnover PowerPoint, Summer Stagnation, Epilimnion, Thermocline, Hypolim...
Lake Turnover PowerPoint, Summer Stagnation, Epilimnion, Thermocline, Hypolim...Lake Turnover PowerPoint, Summer Stagnation, Epilimnion, Thermocline, Hypolim...
Lake Turnover PowerPoint, Summer Stagnation, Epilimnion, Thermocline, Hypolim...
 
Properties of Water Visual Quiz Game
Properties of Water Visual Quiz GameProperties of Water Visual Quiz Game
Properties of Water Visual Quiz Game
 
pH Lesson PowerPoint, Acid, Base, Science
pH Lesson PowerPoint, Acid, Base, Science pH Lesson PowerPoint, Acid, Base, Science
pH Lesson PowerPoint, Acid, Base, Science
 
Properties of Water PowerPoint, Adhesion, Cohesion, Surface Tension
Properties of Water PowerPoint, Adhesion, Cohesion, Surface TensionProperties of Water PowerPoint, Adhesion, Cohesion, Surface Tension
Properties of Water PowerPoint, Adhesion, Cohesion, Surface Tension
 
Water on Earth, H2O Lesson PowerPoint
Water on Earth, H2O Lesson PowerPointWater on Earth, H2O Lesson PowerPoint
Water on Earth, H2O Lesson PowerPoint
 
Science Skills Unit Quiz Game, Metric System
Science Skills Unit Quiz Game, Metric SystemScience Skills Unit Quiz Game, Metric System
Science Skills Unit Quiz Game, Metric System
 

Recently uploaded

The Most Excellent Way | 1 Corinthians 13
The Most Excellent Way | 1 Corinthians 13The Most Excellent Way | 1 Corinthians 13
The Most Excellent Way | 1 Corinthians 13Steve Thomason
 
Accessible design: Minimum effort, maximum impact
Accessible design: Minimum effort, maximum impactAccessible design: Minimum effort, maximum impact
Accessible design: Minimum effort, maximum impactdawncurless
 
Sanyam Choudhary Chemistry practical.pdf
Sanyam Choudhary Chemistry practical.pdfSanyam Choudhary Chemistry practical.pdf
Sanyam Choudhary Chemistry practical.pdfsanyamsingh5019
 
Separation of Lanthanides/ Lanthanides and Actinides
Separation of Lanthanides/ Lanthanides and ActinidesSeparation of Lanthanides/ Lanthanides and Actinides
Separation of Lanthanides/ Lanthanides and ActinidesFatimaKhan178732
 
Beyond the EU: DORA and NIS 2 Directive's Global Impact
Beyond the EU: DORA and NIS 2 Directive's Global ImpactBeyond the EU: DORA and NIS 2 Directive's Global Impact
Beyond the EU: DORA and NIS 2 Directive's Global ImpactPECB
 
Activity 01 - Artificial Culture (1).pdf
Activity 01 - Artificial Culture (1).pdfActivity 01 - Artificial Culture (1).pdf
Activity 01 - Artificial Culture (1).pdfciinovamais
 
Z Score,T Score, Percential Rank and Box Plot Graph
Z Score,T Score, Percential Rank and Box Plot GraphZ Score,T Score, Percential Rank and Box Plot Graph
Z Score,T Score, Percential Rank and Box Plot GraphThiyagu K
 
Measures of Central Tendency: Mean, Median and Mode
Measures of Central Tendency: Mean, Median and ModeMeasures of Central Tendency: Mean, Median and Mode
Measures of Central Tendency: Mean, Median and ModeThiyagu K
 
The basics of sentences session 2pptx copy.pptx
The basics of sentences session 2pptx copy.pptxThe basics of sentences session 2pptx copy.pptx
The basics of sentences session 2pptx copy.pptxheathfieldcps1
 
URLs and Routing in the Odoo 17 Website App
URLs and Routing in the Odoo 17 Website AppURLs and Routing in the Odoo 17 Website App
URLs and Routing in the Odoo 17 Website AppCeline George
 
CARE OF CHILD IN INCUBATOR..........pptx
CARE OF CHILD IN INCUBATOR..........pptxCARE OF CHILD IN INCUBATOR..........pptx
CARE OF CHILD IN INCUBATOR..........pptxGaneshChakor2
 
Q4-W6-Restating Informational Text Grade 3
Q4-W6-Restating Informational Text Grade 3Q4-W6-Restating Informational Text Grade 3
Q4-W6-Restating Informational Text Grade 3JemimahLaneBuaron
 
18-04-UA_REPORT_MEDIALITERAСY_INDEX-DM_23-1-final-eng.pdf
18-04-UA_REPORT_MEDIALITERAСY_INDEX-DM_23-1-final-eng.pdf18-04-UA_REPORT_MEDIALITERAСY_INDEX-DM_23-1-final-eng.pdf
18-04-UA_REPORT_MEDIALITERAСY_INDEX-DM_23-1-final-eng.pdfssuser54595a
 
Contemporary philippine arts from the regions_PPT_Module_12 [Autosaved] (1).pptx
Contemporary philippine arts from the regions_PPT_Module_12 [Autosaved] (1).pptxContemporary philippine arts from the regions_PPT_Module_12 [Autosaved] (1).pptx
Contemporary philippine arts from the regions_PPT_Module_12 [Autosaved] (1).pptxRoyAbrique
 
Advanced Views - Calendar View in Odoo 17
Advanced Views - Calendar View in Odoo 17Advanced Views - Calendar View in Odoo 17
Advanced Views - Calendar View in Odoo 17Celine George
 
How to Make a Pirate ship Primary Education.pptx
How to Make a Pirate ship Primary Education.pptxHow to Make a Pirate ship Primary Education.pptx
How to Make a Pirate ship Primary Education.pptxmanuelaromero2013
 
Student login on Anyboli platform.helpin
Student login on Anyboli platform.helpinStudent login on Anyboli platform.helpin
Student login on Anyboli platform.helpinRaunakKeshri1
 

Recently uploaded (20)

The Most Excellent Way | 1 Corinthians 13
The Most Excellent Way | 1 Corinthians 13The Most Excellent Way | 1 Corinthians 13
The Most Excellent Way | 1 Corinthians 13
 
Accessible design: Minimum effort, maximum impact
Accessible design: Minimum effort, maximum impactAccessible design: Minimum effort, maximum impact
Accessible design: Minimum effort, maximum impact
 
Sanyam Choudhary Chemistry practical.pdf
Sanyam Choudhary Chemistry practical.pdfSanyam Choudhary Chemistry practical.pdf
Sanyam Choudhary Chemistry practical.pdf
 
Separation of Lanthanides/ Lanthanides and Actinides
Separation of Lanthanides/ Lanthanides and ActinidesSeparation of Lanthanides/ Lanthanides and Actinides
Separation of Lanthanides/ Lanthanides and Actinides
 
Beyond the EU: DORA and NIS 2 Directive's Global Impact
Beyond the EU: DORA and NIS 2 Directive's Global ImpactBeyond the EU: DORA and NIS 2 Directive's Global Impact
Beyond the EU: DORA and NIS 2 Directive's Global Impact
 
Activity 01 - Artificial Culture (1).pdf
Activity 01 - Artificial Culture (1).pdfActivity 01 - Artificial Culture (1).pdf
Activity 01 - Artificial Culture (1).pdf
 
Z Score,T Score, Percential Rank and Box Plot Graph
Z Score,T Score, Percential Rank and Box Plot GraphZ Score,T Score, Percential Rank and Box Plot Graph
Z Score,T Score, Percential Rank and Box Plot Graph
 
Measures of Central Tendency: Mean, Median and Mode
Measures of Central Tendency: Mean, Median and ModeMeasures of Central Tendency: Mean, Median and Mode
Measures of Central Tendency: Mean, Median and Mode
 
Código Creativo y Arte de Software | Unidad 1
Código Creativo y Arte de Software | Unidad 1Código Creativo y Arte de Software | Unidad 1
Código Creativo y Arte de Software | Unidad 1
 
The basics of sentences session 2pptx copy.pptx
The basics of sentences session 2pptx copy.pptxThe basics of sentences session 2pptx copy.pptx
The basics of sentences session 2pptx copy.pptx
 
URLs and Routing in the Odoo 17 Website App
URLs and Routing in the Odoo 17 Website AppURLs and Routing in the Odoo 17 Website App
URLs and Routing in the Odoo 17 Website App
 
CARE OF CHILD IN INCUBATOR..........pptx
CARE OF CHILD IN INCUBATOR..........pptxCARE OF CHILD IN INCUBATOR..........pptx
CARE OF CHILD IN INCUBATOR..........pptx
 
Q4-W6-Restating Informational Text Grade 3
Q4-W6-Restating Informational Text Grade 3Q4-W6-Restating Informational Text Grade 3
Q4-W6-Restating Informational Text Grade 3
 
TataKelola dan KamSiber Kecerdasan Buatan v022.pdf
TataKelola dan KamSiber Kecerdasan Buatan v022.pdfTataKelola dan KamSiber Kecerdasan Buatan v022.pdf
TataKelola dan KamSiber Kecerdasan Buatan v022.pdf
 
Mattingly "AI & Prompt Design: The Basics of Prompt Design"
Mattingly "AI & Prompt Design: The Basics of Prompt Design"Mattingly "AI & Prompt Design: The Basics of Prompt Design"
Mattingly "AI & Prompt Design: The Basics of Prompt Design"
 
18-04-UA_REPORT_MEDIALITERAСY_INDEX-DM_23-1-final-eng.pdf
18-04-UA_REPORT_MEDIALITERAСY_INDEX-DM_23-1-final-eng.pdf18-04-UA_REPORT_MEDIALITERAСY_INDEX-DM_23-1-final-eng.pdf
18-04-UA_REPORT_MEDIALITERAСY_INDEX-DM_23-1-final-eng.pdf
 
Contemporary philippine arts from the regions_PPT_Module_12 [Autosaved] (1).pptx
Contemporary philippine arts from the regions_PPT_Module_12 [Autosaved] (1).pptxContemporary philippine arts from the regions_PPT_Module_12 [Autosaved] (1).pptx
Contemporary philippine arts from the regions_PPT_Module_12 [Autosaved] (1).pptx
 
Advanced Views - Calendar View in Odoo 17
Advanced Views - Calendar View in Odoo 17Advanced Views - Calendar View in Odoo 17
Advanced Views - Calendar View in Odoo 17
 
How to Make a Pirate ship Primary Education.pptx
How to Make a Pirate ship Primary Education.pptxHow to Make a Pirate ship Primary Education.pptx
How to Make a Pirate ship Primary Education.pptx
 
Student login on Anyboli platform.helpin
Student login on Anyboli platform.helpinStudent login on Anyboli platform.helpin
Student login on Anyboli platform.helpin
 

Seismograph, Richter Scale, Epicenter, Hypocenter Earth Science Lesson PowerPoint

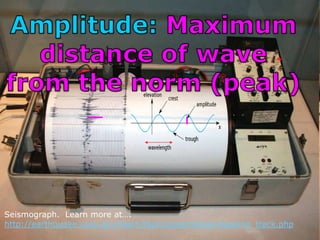
  • 1. Seismograph. Learn more at…. http://earthquake.usgs.gov/learn/topics/seismology/keeping_track.php
  • 2.
  • 3. • RED SLIDE: These are notes that are very important and should be recorded in your science journal. Copyright © 2010 Ryan P. Murphy
  • 4. -Nice neat notes that are legible and use indentations when appropriate. -Example of indent. -Skip a line between topics -Don’t skip pages -Make visuals clear and well drawn.
  • 5. • RED SLIDE: These are notes that are very important and should be recorded in your science journal. • BLACK SLIDE: Pay attention, follow directions, complete projects as described and answer required questions neatly. Copyright © 2010 Ryan P. Murphy
  • 7.
  • 8. • What is this?
  • 9. • Recreation ancient Chinese Seismograph from 132 AD. – Copper balls would fall out into a frogs mouth forecasting and reporting an earthquake.
  • 10. • The seismograph uses a counterweight system, pen, and moving piece of paper. Copyright © 2010 Ryan P. Murphy
  • 11.  Seismograph: An instrument used to measure the shaking caused by an earthquake. Copyright © 2010 Ryan P. Murphy
  • 12.  Seismograph: An instrument used to measure the shaking caused by an earthquake. Copyright © 2010 Ryan P. Murphy Inertia: Counterweight wants to remain at rest.
  • 13.  Seismograph: An instrument used to measure the shaking caused by an earthquake. Copyright © 2010 Ryan P. Murphy Inertia: But once in motion wants to stay in motion.
  • 14.  Seismograph: An instrument used to measure the shaking caused by an earthquake. Copyright © 2010 Ryan P. Murphy Inertia: But once in motion wants to stay in motion.
  • 15. • Activity Link! Make a seismograph • http://pbskids.org/zoom/activities/sci/seism ometer.html or http://science- mattersblog.blogspot.com/2011/04/earthq uakes-make-seismograph.html
  • 16. • iSeismometer for the Ipad – Learn more at… http://www.iseismometer.com/
  • 17. • Video Link! Seismographs and Seismomitor – http://www.youtube.com/watch?v=Gbd1FcuLJLQ
  • 18. • Activity! Human Seismograph. – Need person in rolling chair. – String. – Weight on end of string. – Pen tied to weight. – Paper that two students move. Copyright © 2010 Ryan P. Murphy
  • 19.
  • 20.
  • 21.
  • 22. Seismograph. Learn more at…. http://earthquake.usgs.gov/learn/topics/seismology/keeping_track.php
  • 23.
  • 24.
  • 25.
  • 26. • Activity! Creating a mini earthquake. – Patter feet and hands on desk quietly as small vibrations are recorded. – Increase the magnitude of the noise when the magnitude of the lines increase. – Stop at end, repeat one more time. Copyright © 2010 Ryan P. Murphy
  • 27.
  • 28.  Richter Scale - Scale for measuring earthquake magnitude. Copyright © 2010 Ryan P. Murphy
  • 29.  Richter Scale - Scale for measuring earthquake magnitude.  A magnitude 7.0 earthquake generates 10 times larger amplitude waves than those of a magnitude 6.0. Copyright © 2010 Ryan P. Murphy
  • 30.  Richter Scale - Scale for measuring earthquake magnitude.  A magnitude 7.0 earthquake generates 10 times larger amplitude waves than those of a magnitude 6.0. Copyright © 2010 Ryan P. Murphy 10 times larger
  • 31.  Richter Scale - Scale for measuring earthquake magnitude.  A magnitude 7.0 earthquake generates 10 times larger amplitude waves than those of a magnitude 6.0. Copyright © 2010 Ryan P. Murphy 10 times larger 10 times larger
  • 32.  Richter Scale - Scale for measuring earthquake magnitude.  A magnitude 7.0 earthquake generates 10 times larger amplitude waves than those of a magnitude 6.0. Copyright © 2010 Ryan P. Murphy 10 times larger 10 times larger Richter Scale: Learn More at.. http://earthquake.usgs.gov/learn/topics/richter.php
  • 33.
  • 34. • Top 10 Largest earthquakes in the world since 1900. Learn more about the Top Ten Earthquakes at… http://earthquake.usgs.gov/earthquakes/world/10_ largest_world.php
  • 35. • #10) 1957 Andreanof Islands, Alaska Magnitude 8.6 Copyright © 2010 Ryan P. Murphy
  • 36. • #9) 1950 Assam - Tibet • Magnitude 8.6 Copyright © 2010 Ryan P. Murphy
  • 37. • #8) 2005 Northern Sumatra, Indonesia • Magnitude 8.6 Copyright © 2010 Ryan P. Murphy
  • 38. • #8) 2005 Northern Sumatra, Indonesia • Magnitude 8.6 Copyright © 2010 Ryan P. Murphy “Hoot” “Hoot” “I sure hope everyone is safe.”
  • 39. • #8) 2005 Northern Sumatra, Indonesia • Magnitude 8.6 Copyright © 2010 Ryan P. Murphy “Hoot” “Hoot” “I sure hope everyone is safe.”
  • 40. • #7) 1965 Rat Islands, Alaska • Magnitude 8.7 Copyright © 2010 Ryan P. Murphy
  • 41. • #6) 1906 Off the Coast of Ecuador • Magnitude 8.8 Copyright © 2010 Ryan P. Murphy
  • 42. • #5) 2010 Offshore of Chile • Magnitude 8.8 Copyright © 2010 Ryan P. Murphy
  • 43. • #4) 1952 Kamchatka • Magnitude 9.0 Copyright © 2010 Ryan P. Murphy
  • 44. • #4) 2011 Japan • Magnitude 9.0 Copyright © 2010 Ryan P. Murphy
  • 45. • Japanese earthquake, tsunami, and dangers associated with nuclear power / meltdown occurred.
  • 46. • #3) 2004 Off the coast of Northern Sumatra, • Magnitude 9.1 Copyright © 2010 Ryan P. Murphy
  • 47. • #2) 1964 Prince William Sound, Alaska • Magnitude 9.2 Copyright © 2010 Ryan P. Murphy
  • 48. • #1) Chile 1960 • Magnitude 9.5 Copyright © 2010 Ryan P. Murphy
  • 49. • Other notable earthquakes. – New Madrid Missouri Earthquake 1811-1812 – Between 7 and 8 on Richter Scale – Area was sparsely populated in the 1800‟s
  • 50. • Other notable earthquakes. – New Madrid Missouri Earthquake 1811-1812 – Between 7 and 8 on Richter Scale – Area was sparsely populated in the 1800‟s
  • 51. • The Loma Prieta Earthquake (World Series Earthquake) 1989 – Hit San Francisco Bay Area (6.9)
  • 52. • San Francisco Earthquake 1906 – Huge death toll from collapse of buildings and fire storm that emerged as a result. – Magnitude 7.7 – 8.25
  • 53. • The Great Kantō earthquake (1923) Mainland Japan. – 7.9 on the Richter Scale (140,000 dead) – Occurred at lunchtime and many fires erupted from stoves that fell over. (Firestorm) – Typhoon also hit the area at the same time.
  • 54. • Many more earthquakes have devastated humanity than were presented in this short list.
  • 55. • Many more earthquakes have devastated humanity than were presented in this short list.
  • 56. • Many more earthquakes have devastated humanity than were presented in this short list.
  • 57. • Final Warning. The Cascadia Fault – The US Northwest is struck by a major earthquake every 240 years on average. – It‟s been 311 years since the last major quake.
  • 58. • Recent earthquakes over last seven days from around the world and magnitude. – Note how most earthquakes will be on plate boundaries. – http://earthquake.usgs.gov/earthquakes/map/
  • 59. • You can now skip ahead a bit to complete this question.
  • 60. • You can now skip ahead a bit to complete this question.
  • 61.
  • 62.
  • 63.  Epicenter: The point on the earth's surface that is directly above the hypocenter or focus.  - Copyright © 2010 Ryan P. Murphy
  • 64.  Epicenter: The point on the earth's surface that is directly above the hypocenter or focus. Just above the earthquake Copyright © 2010 Ryan P. Murphy
  • 65.  Epicenter: The point on the earth's surface that is directly above the hypocenter or focus. Just above the earthquake / focus Copyright © 2010 Ryan P. Murphy
  • 66.  Epicenter: The point on the earth's surface that is directly above the hypocenter or focus. Just above the earthquake / focus / hypocenter Copyright © 2010 Ryan P. Murphy
  • 67.  Epicenter: The point on the earth's surface that is directly above the hypocenter or focus. Just above the earthquake / focus / hypocenter Copyright © 2010 Ryan P. Murphy
  • 68. • Activity! Sheet Provided – Locating the Epicenter, Hypocenter, and some basic Origami – Please cut out the box – Color it / label epicenter, hypocenter, fault line. • Color Seismic Waves Red – Fold it correctly and tape it together. – Be ready for quiz on next slide.
  • 69. • Activity! Sheet Provided – Locating the Epicenter, Hypocenter, and some basic Origami – Please cut out the box – Color it / label epicenter, hypocenter, fault line. • Color Seismic Waves Red – Fold it correctly and tape it together. – Be ready for quiz on next slide.
  • 70. • Activity! Sheet Provided – Locating the Epicenter, Hypocenter, and some basic Origami – Please cut out the box – Color it / label epicenter, hypocenter, fault line. • Color Seismic Waves Red – Fold it correctly and tape it together. – Be ready for quiz on next slide.
  • 71. • Activity! Sheet Provided – Locating the Epicenter, Hypocenter, and some basic Origami – Please cut out the box – Color it / label epicenter, hypocenter, fault line. • Color Seismic Waves Red – Fold it correctly and tape it together. – Be ready for quiz on next slide.
  • 72. • Activity! Sheet Provided – Locating the Epicenter, Hypocenter, and some basic Origami – Please cut out the box – Color it / label epicenter, hypocenter, fault line. • Color Seismic Waves Red – Fold it correctly and tape it together. – Be ready for quiz on next slide.
  • 73. • Activity! Sheet Provided – Locating the Epicenter, Hypocenter, and some basic Origami – Please cut out the box – Color it / label epicenter, hypocenter, fault line. • Color Seismic Waves Red – Fold it correctly and tape it together. – Be ready for quiz on next slide.
  • 74. • Activity! Sheet Provided – Locating the Epicenter, Hypocenter, and some basic Origami – Please cut out the box – Color it / label epicenter, hypocenter, fault line. • Color Seismic Waves Red – Fold it correctly and tape it together. – Be ready for quiz on next slide.
  • 75. • Activity! Sheet Provided – Locating the Epicenter, Hypocenter, and some basic Origami – Please cut out the box – Color it / label epicenter, hypocenter, fault line. • Color Seismic Waves Red – Fold it correctly and tape it together. – Be ready for quiz on next slide. No directions on folding. Science is learning through experience in its simplest form. Figure it out.
  • 76.
  • 77.
  • 78.
  • 81. Hypocenter / Focus Primary Waves Secondary Waves
  • 82. Hypocenter / Focus Primary Waves Secondary Waves
  • 83. Hypocenter / Focus Primary Waves Secondary Waves Fault Line
  • 84. Hypocenter / Focus Primary Waves Secondary Waves Fault Line
  • 85. Hypocenter / Focus Epicenter Primary Waves Secondary Waves Fault Line
  • 86. Hypocenter / Focus Epicenter Primary Waves Secondary Waves Fault Line
  • 87. Hypocenter / Focus Epicenter Primary Waves Secondary Waves Reverse / Thrust Fault Fault Line
  • 88. Hypocenter / Focus Epicenter Primary Waves Secondary Waves Reverse / Thrust Fault Fault Line
  • 89. Hypocenter / Focus Epicenter Primary Waves Secondary Waves Reverse / Thrust Fault Fault Line
  • 90. Hypocenter / Focus Epicenter Primary Waves Secondary Waves Reverse / Thrust Fault Fault Line
  • 92.
  • 93.
  • 94.
  • 99. Hypocenter / Focus Reverse / Thrust Fault Fault Line
  • 100. Hypocenter / Focus Reverse / Thrust Fault Fault Line
  • 101. Hypocenter / Focus Primary Waves Secondary Waves Reverse / Thrust Fault Fault Line
  • 102. Hypocenter / Focus Primary Waves Secondary Waves Reverse / Thrust Fault Fault Line
  • 103. Hypocenter / Focus Epicenter Primary Waves Secondary Waves Reverse / Thrust Fault Fault Line
  • 104. Hypocenter / Focus Epicenter Primary Waves Secondary Waves Reverse / Thrust Fault Fault Line
  • 105. • An earthquake requires three monitoring stations to determine it‟s location.
  • 106. • An earthquake requires three monitoring stations to determine it‟s location. P and S waves travel at known velocities through the earth. S waves are slower than P waves by a known amount.
  • 107. • An earthquake requires three monitoring stations to determine it‟s location. P and S waves travel at known velocities through the earth. S waves are slower than P waves by a known amount. Therefore, the farther a seismic recording station is from the earthquake epicenter the greater the difference in time of arrival between the P and S wave.
  • 108. • An earthquake requires three monitoring stations to determine it‟s location. P and S waves travel at known velocities through the earth. S waves are slower than P waves by a known amount. Therefore, the farther a seismic recording station is from the earthquake epicenter the greater the difference in time of arrival between the P and S wave.
  • 109. • An earthquake requires three monitoring stations to determine it‟s location. P and S waves travel at known velocities through the earth. S waves are slower than P waves by a known amount. Therefore, the farther a seismic recording station is from the earthquake epicenter the greater the difference in time of arrival between the P and S wave.
  • 110. • An earthquake requires three monitoring stations to determine it‟s location. P and S waves travel at known velocities through the earth. S waves are slower than P waves by a known amount. Therefore, the farther a seismic recording station is from the earthquake epicenter the greater the difference in time of arrival between the P and S wave.
  • 111. • An earthquake requires three monitoring stations to determine it‟s location. P and S waves travel at known velocities through the earth. S waves are slower than P waves by a known amount. Therefore, the farther a seismic recording station is from the earthquake epicenter the greater the difference in time of arrival between the P and S wave.
  • 112. • An earthquake requires three monitoring stations to determine it‟s location. P and S waves travel at known velocities through the earth. S waves are slower than P waves by a known amount. Therefore, the farther a seismic recording station is from the earthquake epicenter the greater the difference in time of arrival between the P and S wave.
  • 113. • An earthquake requires three monitoring stations to determine it‟s location. P and S waves travel at known velocities through the earth. S waves are slower than P waves by a known amount. Therefore, the farther a seismic recording station is from the earthquake epicenter the greater the difference in time of arrival between the P and S wave.
  • 114. • An earthquake requires three monitoring stations to determine it‟s location. P and S waves travel at known velocities through the earth. S waves are slower than P waves by a known amount. Therefore, the farther a seismic recording station is from the earthquake epicenter the greater the difference in time of arrival between the P and S wave.
  • 115. • An earthquake requires three monitoring stations to determine it‟s location. P and S waves travel at known velocities through the earth. S waves are slower than P waves by a known amount. Therefore, the farther a seismic recording station is from the earthquake epicenter the greater the difference in time of arrival between the P and S wave.
  • 116. • An earthquake requires three monitoring stations to determine it‟s location. P and S waves travel at known velocities through the earth. S waves are slower than P waves by a known amount. Therefore, the farther a seismic recording station is from the earthquake epicenter the greater the difference in time of arrival between the P and S wave.
  • 117. • An earthquake requires three monitoring stations to determine it‟s location. P and S waves travel at known velocities through the earth. S waves are slower than P waves by a known amount. Therefore, the farther a seismic recording station is from the earthquake epicenter the greater the difference in time of arrival between the P and S wave.
  • 118. • An earthquake requires three monitoring stations to determine it‟s location. P and S waves travel at known velocities through the earth. S waves are slower than P waves by a known amount. Therefore, the farther a seismic recording station is from the earthquake epicenter the greater the difference in time of arrival between the P and S wave.
  • 119. • An earthquake requires three monitoring stations to determine it‟s location. P and S waves travel at known velocities through the earth. S waves are slower than P waves by a known amount. Therefore, the farther a seismic recording station is from the earthquake epicenter the greater the difference in time of arrival between the P and S wave.
  • 120. • An earthquake requires three monitoring stations to determine it‟s location. P and S waves travel at known velocities through the earth. S waves are slower than P waves by a known amount. Therefore, the farther a seismic recording station is from the earthquake epicenter the greater the difference in time of arrival between the P and S wave.
  • 121. • An earthquake requires three monitoring stations to determine it‟s location. P and S waves travel at known velocities through the earth. S waves are slower than P waves by a known amount. Therefore, the farther a seismic recording station is from the earthquake epicenter the greater the difference in time of arrival between the P and S wave.
  • 122. • An earthquake requires three monitoring stations to determine it‟s location. P and S waves travel at known velocities through the earth. S waves are slower than P waves by a known amount. Therefore, the farther a seismic recording station is from the earthquake epicenter the greater the difference in time of arrival between the P and S wave.
  • 123. • An earthquake requires three monitoring stations to determine it‟s location. P and S waves travel at known velocities through the earth. S waves are slower than P waves by a known amount. Therefore, the farther a seismic recording station is from the earthquake epicenter the greater the difference in time of arrival between the P and S wave.
  • 146. • Activity! S and P Gap. – Have two students line up next to each other against the wall. – Label one as the fast walker (P-wave) and one as the slow walker (S-wave “Side to Side Macho Man”) – Each students begins walking across room at same time and various students (monitoring stations) time the gap between the two students as they walk by. – Start timer when P-wave passes, and end when S-wave arrives. – Have the monitor stations share times.
  • 147. • Activity! S and P Gap. P-Wave S-Wave
  • 148. • Activity! S and P Gap. P-Wave S-Wave
  • 149. • Activity! S and P Gap. P-Wave S-Wave
  • 150. • Activity! S and P Gap. P-Wave S-Wave
  • 151. • Activity! S and P Gap. P-Wave S-Wave
  • 152. • Activity! S and P Gap. P-Wave S-Wave START TIMER
  • 153. • Activity! S and P Gap. P-Wave S-Wave START TIMER
  • 154. • Activity! S and P Gap. P-Wave S-Wave START TIMER
  • 155. • Activity! S and P Gap. P-Wave S-Wave START TIMER
  • 156. • Activity! S and P Gap. P-Wave S-Wave END TIMER START TIMER
  • 157. • Activity! S and P Gap. P-Wave S-Wave END TIMER START TIMER
  • 158. • Activity! S and P Gap. P-Wave S-Wave END TIMER START TIMER START
  • 159. • Activity! S and P Gap. P-Wave S-Wave END TIMER START TIMER START
  • 160. • Activity! S and P Gap. P-Wave S-Wave END TIMER END TIMER START
  • 161. • Activity! S and P Gap. P-Wave S-Wave END TIMER END TIMER START
  • 162. • Activity! S and P Gap. P-Wave S-Wave END TIMER END TIMER START
  • 163. • Activity! S and P Gap. P-Wave S-Wave END TIMER END TIMER START
  • 164. • Activity! S and P Gap. P-Wave S-Wave END TIMER END TIMER END
  • 165. • Activity! S and P Gap. P-Wave S-Wave END TIMER END TIMER END
  • 166. • Activity! S and P Gap. P-Wave S-Wave END TIMER END TIMER END
  • 167. • Activity! S and P Gap. P-Wave S-Wave END TIMER END TIMER END
  • 168. • Activity! S and P Gap. P-Wave S-Wave END TIMER END TIMER END Compare times of the gap between the P wave and the S wave (should be close) 0:00 0:00 0:00
  • 169. • An earthquake requires three monitoring stations to determine its location. – Where‟s the epicenter of the earthquake below?
  • 170. A
  • 171. A
  • 172. A S and P Wave gap time / distance measured from monitoring station
  • 173. B A
  • 174. B A
  • 175. B A
  • 176. B C A
  • 177. • Where „s the earthquake below? B C A
  • 178. • Where „s the earthquake below? B C A Epicenter
  • 179.
  • 180. • Where „s the earthquake epicenter below? B C A D E F G
  • 181. • Where „s the earthquake epicenter below? B C A D E F G
  • 182. • Where „s the earthquake epicenter below? B C A D E F G
  • 183. • Where „s the earthquake epicenter below? B C A D E F G
  • 184. • Where „s the earthquake epicenter below? B C A D E F G
  • 185. • Where „s the earthquake epicenter below? B C A Epicenter D E F G
  • 186.
  • 187. • Where „s the earthquake epicenter below? B C A D E F G
  • 188. • Where „s the earthquake epicenter below? B C A D E F G
  • 189. • Where „s the earthquake epicenter below? B C A D E F G
  • 190. • Where „s the earthquake epicenter below? B C A D E F G
  • 191. • Where „s the earthquake epicenter below? B C A D E F G
  • 192. • Where „s the earthquake epicenter below? B C A Epicenter D E F G
  • 193.
  • 194. • Where „s the earthquake epicenter below? B C A D E F G
  • 195. • Where „s the earthquake epicenter below? B C A D E F G
  • 196. • Where „s the earthquake epicenter below? B C A D E F G
  • 197. • Where „s the earthquake epicenter below? B C A D E F G
  • 198. • Where „s the earthquake epicenter below? B C A D E F G
  • 199. • Where „s the earthquake epicenter below? B C A D E F G
  • 200. • Where „s the earthquake epicenter below? B C A D E F G
  • 201.
  • 202. • Quick Activity! Working the process backwards. – Make a right triangle in the middle of your page. – Mark each point (A, B, C) These are seismic activity monitoring stations. – Create and epicenter near the triangle. – Use a compass to create a circle from each monitoring station (center of circle) through the epicenter (perimeter of circle). – Record radius (distance from monitoring station to the epicenter). Visual next slide 
  • 203. • Quick Activity! Working the process backwards. – Make a right triangle in the middle of your page. – Mark each point (A, B, C) These are seismic activity monitoring stations. – Create and epicenter near the triangle. – Use a compass to create a circle from each monitoring station (center of circle) through the epicenter (perimeter of circle). – Record radius (distance from monitoring station to the epicenter). Visual next slide 
  • 204. • Quick Activity! Working the process backwards. – Make a right triangle in the middle of your page. – Mark each point (A, B, C) These are seismic activity monitoring stations. – Create a epicenter near the triangle. – Use a compass to create a circle from each monitoring station (center of circle) through the epicenter (perimeter of circle). – Record radius (distance from monitoring station to the epicenter). Visual next slide 
  • 205. • Quick Activity! Working the process backwards. – Make a right triangle in the middle of your page. – Mark each point (A, B, C) These are seismic activity monitoring stations. – Create a epicenter near the triangle. – Use a compass to create a circle from each monitoring station (center of circle) through the epicenter (perimeter of circle). – Record radius (distance from monitoring station to the epicenter). Visual next slide 
  • 206. • Quick Activity! Working the process backwards. – Make a right triangle in the middle of your page. – Mark each point (A, B, C) These are seismic activity monitoring stations. – Create a epicenter near the triangle. – Use a compass to create a circle from each monitoring station (center of circle) through the epicenter (perimeter of circle). – Record radius (distance from monitoring station to the epicenter). Visual next slide 
  • 207. • Quick Activity! Working the process backwards. – Make a right triangle in the middle of your page. – Mark each point (A, B, C) These are seismic activity monitoring stations. – Create a epicenter near the triangle. – Use a compass to create a circle from each monitoring station (center of circle) through the epicenter (perimeter of circle). – Record radius (distance from monitoring station to the epicenter). Visual next slide 
  • 208. • Quick Activity! Working the process backwards. – Make a right triangle in the middle of your page. – Mark each point (A, B, C) These are seismic activity monitoring stations. – Create a epicenter near the triangle. – Use a compass to create a circle from each monitoring station (center of circle) through the epicenter (perimeter of circle). – Record radius (distance from monitoring station to the epicenter). Visual next slide 
  • 209. • Quick Activity! Working the process backwards. – Make a right triangle in the middle of your page. – Mark each point (A, B, C) These are seismic activity monitoring stations. – Create a epicenter near the triangle. – Use a compass to create a circle from each monitoring station (center of circle) through the epicenter (perimeter of circle). – Record radius (distance from monitoring station to the epicenter). Visual next slide 
  • 210. • Quick Activity! Working the process backwards. – Make a right triangle in the middle of your page. – Mark each point (A, B, C) These are seismic activity monitoring stations. – Create a epicenter near the triangle. – Use a compass to create a circle from each monitoring station (center of circle) through the epicenter (perimeter of circle). – Record radius (distance from monitoring station to the epicenter). Visual next slide 
  • 211.
  • 212. A
  • 213. A B
  • 214. A B C
  • 222. A B C * Epicenter * Measure the distances from each monitoring station to the epicenter.
  • 223. A B C * Epicenter * Measure the distances from each monitoring station to the epicenter. Distance to epicenter determined by the gap between the arrival of the first P wave and the first S wave
  • 224. • Activity – Finding the Epicenter • http://www.geology.ar.gov/pdf/Locating_an_e picenter_activity.pdf • http://www.oakton.edu/user/4/billtong/eas100 lab/lab10quake.htm • (Advanced) • http://www.geo.mtu.edu/UPSeis/locating.html Copyright © 2010 Ryan P. Murphy Learn more at… http://www.geo.mtu.edu /UPSeis/locating.html
  • 225. • Do earthquakes kill people? Copyright © 2010 Ryan P. Murphy
  • 226. • Answer! Earthquakes don‟t generally kill people, Copyright © 2010 Ryan P. Murphy
  • 227. • Answer! Earthquakes don‟t generally kill people, poorly built buildings do. Copyright © 2010 Ryan P. Murphy
  • 228. • The type of soil a building is on, and the design / construction of the building has a lot to do with how well the building will fare in an earthquake. Copyright © 2010 Ryan P. Murphy
  • 229. • Liquefaction: A process where sand or landfill will often change from a wet solid into a dense liquid, which further amplifies shaking. Copyright © 2010 Ryan P. Murphy
  • 230. • Liquefaction: A process where sand or landfill will often change from a wet solid into a dense liquid, which further amplifies shaking. Copyright © 2010 Ryan P. Murphy Liquefaction Activity / Demo at… http://www.exploratorium.edu/faultline/activezone/liquefactio n.html More activities and info found at… https://media.up.edu/Physics/TOLE/EarthquakeTsunamiHazar ds/LessonPlans/EQHazardMaps_Liquefaction-TOTLE.pdf
  • 231.
  • 232.
  • 233.
  • 234.
  • 235.
  • 236. • Activity! – Fill a tray with dry sand several inches or at least 12 cm. – Fill a one liter soda bottle with water and cap and bury into the sand.
  • 237. • Activity! – Fill a tray with dry sand several inches or at least 12 cm. – Fill a one liter soda bottle with water and cap and bury into the sand. – Shake tray and observe what happens.
  • 238. • Activity! – Fill a tray with dry sand several inches or at least 12 cm. – Fill a one liter soda bottle with water and cap and bury into the sand. – Shake tray and observe what happens.
  • 239. • Activity! – Moisten sand but don‟t super saturate. – Shake tray and observe what happens.
  • 240. • Activity! – Moisten sand but don‟t super saturate. – Shake tray and observe what happens.
  • 241. • Activity! – Fill tray with lots of water so water is visible on the surface.. – Shake tray and observe what happens.
  • 242. • Activity! – Fill tray with lots of water so water is visible on the surface.. – Shake tray and observe what happens.
  • 243. • Activity! – Fill tray with lots of water so water is visible on the surface.. – Shake tray and observe what happens. – Why?
  • 244. • Activity! – Fill tray with lots of water so water is visible on the surface.. – Shake tray and observe what happens. – Why? Liquefaction. The sand (solid) mixed with water (liquid) and acted as a liquid.
  • 245. • Activity! – Fill tray with lots of water so water is visible on the surface.. – Shake tray and observe what happens. – Why? Liquefaction. The sand (solid) mixed with water (liquid) and acted as a liquid.
  • 246. • Videos (Optional) Liquefaction – http://www.youtube.com/watch?v=rn3oAvmZY8k Japan – http://www.youtube.com/watch?v=tvYKcCS_J7Y Christchurch New Zealand (How it happens) Copyright © 2010 Ryan P. Murphy
  • 247. • Building on loose sand and poorly packed fill material increases the intensity of the an earthquake. Copyright © 2010 Ryan P. Murphy
  • 248. • Building on loose sand and poorly packed fill material increases the intensity of the an earthquake. – Building on solid bedrock is better. Copyright © 2010 Ryan P. Murphy
  • 249. • Many of our major cities have large areas that are built on sand and fill.  Copyright © 2010 Ryan P. Murphy
  • 250. • Which area experienced liquefaction based on the seismic waves? A B Copyright © 2010 Ryan P. Murphy
  • 251. • Answer! Area A because the seismic waves were more severe. A B Copyright © 2010 Ryan P. Murphy
  • 252. • Try and figure out the picture beneath the boxes. Raise your hand when you think you know. – You only get one guess. Copyright © 2010 Ryan P. Murphy
  • 253.
  • 254.
  • 255.
  • 256.
  • 257.
  • 258.
  • 259.
  • 260.
  • 261.
  • 262.
  • 263.
  • 264.
  • 266. • This part of the PowerPoint roadmap is just one small part of my Geology Topics Unit. This unit includes… • A six part 6,000 Slide PowerPoint Presentation / unit roadmap full of activities, review questions, games, video links, flashcards, materials list, and much more. • A 18 bundled homework package, modified version, 19 pages of unit notes, 6 PowerPoint Review Games of 100+ slides each, videos, rubrics, and much more that all chronologically follow the unit slideshow. • This is a fantastic unit for any Earth Science Class. • http://sciencepowerpoint.com/Geology_Unit.html
  • 267.
  • 268. Areas of Focus within The Geology Topics Unit: -Areas of Focus within The Geology Topics Unit: Plate Tectonics, Evidence for Plate Tectonics, Pangea, Energy Waves, Layers of the Earth, Heat Transfer, Types of Crust, Plate Boundaries, Hot Spots, Volcanoes, Positives and Negatives of Volcanoes, Types of Volcanoes, Parts of a Volcano, Magma, Types of Lava, Viscosity, Earthquakes, Faults, Folds, Seismograph, Richter Scale, Seismograph, Tsunami‟s, Rocks, Minerals, Crystals, Uses of Minerals, Types of Crystals, Physical Properties of Minerals, Rock Cycle, Common Igneous Rocks, Common Sedimentary Rocks, Common Metamorphic Rocks., Age of the Earth, Uniformitarianism, Principle of Superposition, Earth History, Time Units, Timeline of Events, Basic Evolution, Mass Extinction Events, Dinosaurs, Early Mammals, and more. Full Unit can be found at… http://sciencepowerpoint.com/Geology_Unit.html
  • 269.
  • 270.
  • 271.
  • 272.
  • 273.
  • 274.
  • 275. • This was a very brief tour. Please visit the links below to learn more about each of the units in this curriculum package. – These units take me about four years to complete with my students in grades 5-10. Earth Science Units Extended Tour Link and Curriculum Guide Geology Topics Unit http://sciencepowerpoint.com/Geology_Unit.html Astronomy Topics Unit http://sciencepowerpoint.com/Astronomy_Unit.html Weather and Climate Unit http://sciencepowerpoint.com/Weather_Climate_Unit.html Soil Science, Weathering, More http://sciencepowerpoint.com/Soil_and_Glaciers_Unit.html Water Unit http://sciencepowerpoint.com/Water_Molecule_Unit.html Rivers Unit http://sciencepowerpoint.com/River_and_Water_Quality_Unit.html = Easier = More Difficult = Most Difficult 5th – 7th grade 6th – 8th grade 8th – 10th grade
  • 276. Physical Science Units Extended Tour Link and Curriculum Guide Science Skills Unit http://sciencepowerpoint.com/Science_Introduction_Lab_Safety_Metric_Methods. html Motion and Machines Unit http://sciencepowerpoint.com/Newtons_Laws_Motion_Machines_Unit.html Matter, Energy, Envs. Unit http://sciencepowerpoint.com/Energy_Topics_Unit.html Atoms and Periodic Table Unit http://sciencepowerpoint.com/Atoms_Periodic_Table_of_Elements_Unit.html Life Science Units Extended Tour Link and Curriculum Guide Human Body / Health Topics http://sciencepowerpoint.com/Human_Body_Systems_and_Health_Topics_Unit.html DNA and Genetics Unit http://sciencepowerpoint.com/DNA_Genetics_Unit.html Cell Biology Unit http://sciencepowerpoint.com/Cellular_Biology_Unit.html Infectious Diseases Unit http://sciencepowerpoint.com/Infectious_Diseases_Unit.html Taxonomy and Classification Unit http://sciencepowerpoint.com/Taxonomy_Classification_Unit.html Evolution / Natural Selection Unit http://sciencepowerpoint.com/Evolution_Natural_Selection_Unit.html Botany Topics Unit http://sciencepowerpoint.com/Plant_Botany_Unit.html Ecology Feeding Levels Unit http://sciencepowerpoint.com/Ecology_Feeding_Levels_Unit.htm Ecology Interactions Unit http://sciencepowerpoint.com/Ecology_Interactions_Unit.html Ecology Abiotic Factors Unit http://sciencepowerpoint.com/Ecology_Abiotic_Factors_Unit.html
  • 277. • More Units Available at… Earth Science: The Soil Science and Glaciers Unit, The Geology Topics Unit, The Astronomy Topics Unit, The Weather and Climate Unit, and The Rivers and Water Quality Unit, The Water Molecule Unit. Physical Science: The Laws of Motion and Machines Unit, The Atoms and Periodic Table Unit, The Energy and the Environment Unit, and Science Skills Unit. Life Science: The Diseases and Cells Unit, The DNA and Genetics Unit, The Life Topics Unit, The Plant Unit, The Taxonomy and Classification Unit, Ecology: Feeding Levels Unit, Ecology: Interactions Unit, Ecology: Abiotic Factors, The Evolution and Natural Selection Unit and The Human Body Systems and Health Topics Unit Copyright © 2010 Ryan P. Murphy
  • 278. • The entire four year curriculum can be found at... http://sciencepowerpoint.com/ Please feel free to contact me with any questions you may have. Thank you for your interest in this curriculum. Sincerely, Ryan Murphy M.Ed www.sciencepowerpoint@gmail.com