SlideShare uma empresa Scribd logo
1 de 73
PROJECT REPORT
ON
“STOCK EXCHANGE AND RETAIL PARTICIPATION OF CLIENTS IN
SECURITIES MARKET”
INDEX OF CONTENTS
CHAPTER PAGE NOS.
1. Rationale for the Study
2. Objective of the Study
• Title of the project
• Objective of the study
• Scope of the study
3. Profile of the securities market
4. Theoretical Perspective
5. Research Methodology
• Research Design
• Data collection methods/sources
• Sampling plan
6. Data Analysis and interpretation using
various charts and graphs
7. Findings.
1
8. Limitation if any
9. Expected contribution from the study
APPENDIX
• Copies of questionnaire
• Bibligraphy
CHAPTER 1
RATIONALE OF THE STUDY
Reforms of the Indian economy during the 1990’s have helped to bring the Indian
securities market into the main stream of the Indian financial system. As a result, the
growth in investment by individual investors has become quite significant. This made it
pertinent to have a first hand in depth view of the extent of public participation directly in
the securities market or through mutual funds.
The terms of reference of the study were to estimate the number of
household and the population of individual investors, their economic and demographic
profile, portfolio size, investment preferences for equity as well as other saving
instruments. The study was also designed to elicit information from households on their
risk perceptions, experiences in investing in security market, return on investment and the
like. Other areas to be covered included awareness of investor rights, experiences with
grievance redressal mechanisms; indications of investors’ future plans of investment and
their expectations from the securities market were also obtained. The study also provided
estimates of non-investor households and population, their economic and demographic
2
profile, their pattern of investment in various instruments and reasons of non-investment
in the equity market.
An important feature of the securities market is the depth and breadth of
public participation in the market. Millions of households and individual investors
provide a pool of capital and a diversity of decision-making that creates liquidity in the
market and makes it dynamic. Thus, the number of households and individual stock
holders are the two most commonly cited summary statistics denoting the breadth of
stock ownership in the population. These two statistics are useful tools for understanding
the changes that take place in the equity market and for policy formulation. It is therefore
important to estimate these statistics to assess retail participation in securities market.
The securities market in India has grown dramatically in the 1990s; this
has led to the expansion of direct equity ownership in the country. A large number of
households have also indirectly owned equity shares and debentures through their
participation in mutual funds. To help guage the impact of the growth of the securities
market on the households to conduct a comprehensive survey of Indian Investor
households.
The markets were transformed in the 1990s
The 1990s was the decade of reforms of the Indian economy; it was the
period of transformation of the Indian securities market; it was the age of the emergence
of the securities market from the backwaters into the mainstream of the Indian financial
system.
The mutual funds as an investment vehicle helped spread of the equity cult
3
among the households and individual investors. Embracing of new technology redefined
the stock exchanges in the country, as elsewhere, and made the geographical location of a
stock exchange irrelevant. Automation of trading in the stock exchanges brought in train
several changes. It helped improve the level of transparency, reduced spreads, and
lowered transaction costs. It also allowed for the expansion of the stock exchanges,
through the spread of trading terminals in cities and towns in the country and brought the
stock exchanges closer to the investors.
These changes were the outcome mainly of the economic reforms, macro-
economic changes, and the regulations for the securities market. The flagship of
government’s reforms, SEBI, had an important role to play in inducing the change in the
market place. Established in 1992 as the apex, statutory regulatory body for the securities
market, with the express mandate of investor protection, development and market
regulation, it was able to put in place in a very short period of time, a credible regulatory
structure for the securities market for the first time. SEBI thus became the prime catalyst
for market development bringing about far reaching changes in market practices,
introducing international best practices and procedures and modernizing the market
infrastructure taking advantage of technology and enforcing regulations.
When the market was in a bearish trend, the interest rates were high, and
the confidence of the investors on the securities market had waned considerably, the
in vestors opted for fixed income investments, which were providing higher returns
owing to the high interest rates prevailing during the period.
The study relates to estimating the number of households and the
4
population of individual investors who have invested in the equity market directly or
indirectly through mutual funds. Drawing a profile of the households and investors, and
describe their demographic, economic, financial and equity ownership characteristics;
understand their investment preferences for equity as well as other savings instruments
available in the market, their perceptions about market risks, their expectations from the
market, the nature of their grievances and difficulties; and estimating the number of
households which have refrained from investing in the equity market, describe their
demographic characteristics, and analyse the reasons for their reluctance to invest in
equity.
The study also relates to improvement in the service given by
brokers/sub-brokers, boosting the investors’ confidence in the securities market,
to enable Non-investors who do not invest in securities market either directly or
indirectly to invest in equities and understanding the needs of the investor/non-investor
households and preparing tailor-made plans to suit those needs.
5
CHAPTER 2
Objective of the Study
Title of the project
The project is titled as ‘STOCK MARKET AND RETAIL PARTICIPATION OF
CLIENTS IN SECURITIES MARKET’
Objective of the study
 Estimate the number of households and the population of individual investors
who have invested in the equity market directly or indirectly through mutual
funds.
 Draw a profile of the households and investors, and describe their demographic,
economic, financial and equity ownership characteristics;
 Understand their investment preferences for equity as well as other savings
instruments available in the market, their perceptions about market risks, their
expectations from the market, the nature of their grievances and difficulties;
 Estimate the number of households which have refrained from investing in the
equity market, describe their demographic characteristics, and analyse the reasons
for their reluctance to invest in equity.
 Improvement in the service given by brokers/sub-brokers.
 Boosting the investors’ confidence in the securities market.
 To enable Non-investors who do not invest in securities market either directly or
indirectly to invest in equities.
 Understanding the needs of the investor/non-investor households and preparing
6
tailor-made plans to suit those needs.
Scope of the study
• Reforms of the Indian economy during the 1990’s have helped to bring the Indian
securities market into the main stream of the Indian financial system. As a result,
the growth in investment by individual investors has become quite significant.
This made it pertinent to have a first hand in depth view of the extent of public
participation directly in the securities market or through mutual funds.
• The Evolution of Stock Exchanges in India – Origin of Bombay Stock Exchange
in 1875 and 23 other Stock Exchanges throughout India. The securities traded
were equity, debt, derivatives such as options, futures, index.
• The securities market has essentially three categories of participants, viz., the
issuer of securities, the investors in the securities and the intermediaries. The
securities has two interdependent and inseparable segments, the new issues
(primary) and the stock (secondary) market. The primary market provides the
channel for creation and sale of new securities, while the secondary market deals
in securities previously issued. The secondary market operated through two
mediums, namely, the over-the-counter (OTC) market and the exchange-traded
market. All the trades taking place over a trading cycle (day=T) are settled
together after a certain time (T+2 day). The trades executed on the National Stock
Exchange (NSE) are cleared and settled by a clearing corporation. The clearing
corporation acts as a counter party and guarantees settlement.
• Exchanges in the country, which offer screen based trading system. The trading
7
system is connected using the VSAT technology from over 281 cities. There are
9,335 trading members registered with SEBI as at end March 2006. Inorder to
provide efficiency, liquidity and transparency, NSE introduced a nation-wide on-
line fully automated screen based trading system (SBTS).
• Presently only two exchanges viz., NSE and Stock Exchange, Mumbai (BSE)
provides trading in the derivatives of securities.
• Despite having a large number of companies listed on its exchanges, India
accounted for a meager 0.94% in total world turnover in 2005.
• Market capitalization as percent for GDP in India stood at 56.1% as at end-2004.
There are two depositories in India, viz. NSDL and CDSL. They have been set up
to provide instantaneous electronic transfer of securities. The number of
dematerialized securities increased to 201.9 billion at the end of March 2006 from
147.7 billion at the end of March, 2005
• According to the RBI data, household sector accounted for 85.4% of gross
domestic savings during 2004-05. However, this has decreased to 83.9% in 2005-
06. In the last fiscal 2005-06, they have invested 47.4% of financial savings in
deposits, 24.2% in insurance/provident funds, 12.3% on small savings, and 7.2%
in securities. Thus the fixed income bearing instruments are the most preferred
assets of the household sector.
• It appears that more and more people prefer mutual funds (MFs) as their
investment vehicle. This change in investor behaviour is induced by the evolution
of a regulatory framework for MFs, tax concessions offered by government and
8
preference of investors for passive investing. Starting with an asset base of
Rs.250 million in 1964, the total assets under management at the end of March
2006 has risen to Rs.2,318,620 million. During the last one decade, the resources
mobilized by the MFs are increased from Rs.112, 440 million in 1993-94 to
Rs.527,800 million in 2005-06.
• The total exchange traded derivatives witnessed a value of Rs.48,242,592 million
during 2005-06 as against Rs.25,641,269 million during the preceding year. NSE
proved itself as the market leader contributing 99.9% of the total turnover in
2005-06 in India.
• In the interest of investors, SEBI issued the Disclosure and Investor Protection
(DIP) guidelines. These guidelines contain a substantial body of requirements for
issuers/intermediaries, with a broad intention to ensure that all the concerned
entities observe high standards of integrity and fair dealing.
• DEA, DCA, the SEBI and the stock exchanges have set up investor grievance
cells for redressal of investor grievance. The exchanges maintain investor
protection funds to take care of investor claims.
• Government Securities Market: Non-competitive bids are accepted from retail
investors inorder to widen investor base. Further, to facilitate retail investors to
invest in government securities, RBI permitted select entities to provide custody
(Constituent SGL) accounts. Other measures include abolition of TDS on
government securities and stamp duty on transfer of demat debt securities.
• The terms of reference of the study were to estimate the number of household and
the population of individual investors, their economic and demographic profile,
9
portfolio size, investment preferences for equity as well as other saving
instruments. The study was also designed to elicit information from households
on their risk perceptions, experiences in investing in security market, return on
investment and the like. Other areas to be covered included awareness of investor
rights, experiences with grievance redressal mechanisms; indications of investors’
future plans of investment and their expectations from the securities market were
also obtained. The study also provided estimates of non-investor households and
population, their economic and demographic profile, their pattern of investment in
various instruments and reasons of non-investment in the equity market.
• To help guage the impact of the growth of the securities market on the households
to conduct a comprehensive survey of Indian Investor households.
• The project also covers to study the basic investor/potential investor/non-
investment preferences, intentions, attitudes, perception, interests, likes and
dislikes towards investment in securities market.
• It also focuses its attention towards the brokers’ services, the extent of attracting
investors, the opportunities and their ability to face the challenges in the global
competitive environment.
• Lastly, on the basis of the study, to determine the measures to be adopted to
improve the level of confidence of investors in the securities market.
10
CHAPTER 3
PROFILE OF THE SECURITIES MARKET
Evolution of Stock Exchanges in India
The origin of the stock market relates back to the year 1494, when the Amsterdam Stock
Exchange was set up. In India it dates back to the 18th
Century, an era when the East
India Company was a dominant institution in India.
“The Bombay Stock Exchange”(BSE) was founded in the year 1875. “The
Ahmedabad Shares and Stock Association” was formed in the year 1894. The Calcutta
Stock Exchange Association was formed by about 150 brokers on 15th
June 1908. In the
year 1920, one stock exchange was established in Northern India and one in Madras
called “The Madras Stock Exchange”. “The Madras Stock Exchange Association Pvt.
Ltd” was established in the year 1941. On 29th
April, 1959, it was reorganized as a
company limited by guarantee under the name and style of “Madras Stock
Exchange”(MSE). The Lahore Stock Exchange was formed in the year 1934. However,
in the year 1936 after the Punjab Stock Exchange Ltd. Came into existence, the Lahore
Stock Exchange merged with it. In Calcutta, a second Stock Exchange by name “The
Bengal Share & Stock Exchange Ltd” was established in the year 1937 and likewise once
again in the year 1938, Bombay also witnessed a rival Stock Exchange formed in the
name of “Indian Stock Exchange Ltd.” The U.P.Stock Exchange was formed in Kanpur
and the Nagpur Stock Exchange Ltd. In Nagpur in the year 1940. The Hyderabad Stock
Exchange Ltd. Was incorporated in the year 1944. Two stock exchanges which came
into being in Delhi by the name “The Delhi Stock & Share Brokers Association Ltd.”
11
And “The Delhi Stocks & Shares Exchange Association Ltd.” Were amalgamated into
“The Delhi Stock Exchange Association Ltd.” In the year 1947. Subsequently, the
Bangalore Stock Exchange was registered in the year 1957 and recognized in the year
1963. The Third Stock Exchange in the state of Gujarat the “Vadodara Stock
Exchange Ltd.” Was incorporated in 1990. The Over the Counter Exchange of India
(OTCEI) broadly based on the lines of NASDAQ (National Association of Securities
Dealers Automated Quotation) of the USA was promoted and approved on August 1989.
The National Stock Exchange of India Ltd. Was incorporated in November, 1992.
Today, there are 23 Stock Exchanges in India, including the 3 Stock Exchanges in
Mumbai- Bombay Stock Exchange (BSE), National Stock Exchange (NSE) and Over the
Counter Exchange of India (OTCEI).
The Bombay Stock Exchange is the oldest Stock Exchange in Asia located in
Dalal Street, Mumbai in India. The Bombay Stock Exchange was established in 1875 as
the “Native Share and Stock Brokers Association” earned a formal status under the
Securities and Exchange Board of India (SEBI) in 1956. Market Capitalisation of BSE
was about Rs.33.4 trillion as on 2006, October. The Bombay Stock Exchange uses the
Bombay Stock Exchange as the market index in Asia and India.
The Bombay Stock Exchange deals with trading in derivatives, equity and other debt
instruments.
Derivatives Market
The Bombay Stock Exchange introduces the first Exchange Traded Index Derivative
Contract in 2000, the Index Option be traded from 2001 whereas the single stock futures
12
were traded from 2002. The weekly options were introduced.
Index Futures: Index futures are basically futures whose underlying asset is the BSE
index itself.
Index options: The index options like any other option gives the holder, the right but not
the obligation to buy or sell the underlying asset at a specified date and price. Then
underlying asset in the case of the index option is again the BSE index itself.
Stock Futures and Options
Stock Futures and the stock options have the normal characteristics as any other stock
future or option traded by them where the underlying asset is some stock.
Equity Futures and Options: The Bombay Stock Exchange also introduced the Equity
Futures and Options.
Leaving aside the BSE Sensex there are many other indices that are used
by the Bombay Stock Exchange and they are as follows:
• BSE 500
• BSE 100
• BSE 200
• BSE PSU
• BSE MIDCAP
• BSE SMLCAP
• BSE BANKEX
• BSE Tech
• BSE Auto
• BSE Pharma
13
The securities market has essentially three categories of participants, viz., the issuer of
securities, the investors in the securities and the intermediaries. The issuers are the
borrowers or deficit savers, who issue securities to raise funds. The investors, who are
surplus savers, deploy their saving by subscribing to these securities. The intermediaries’
are the agents who match the needs of users and suppliers of funds for a commission.
14
These intermediaries perform functions to help both the issuers and investors to achieve
their respective goals. This process of mobilizations of resources is carried out under the
supervision and overview of the regulators. The regulators develop fair market practices
and regulate the conduct issuers of securities and the intermediaries. They are also in
charge of protecting the interests of the investors.
Market Segments
The securities has two interdependent and inseparable segments, the new issues (primary)
and the stock (secondary) market. The primary market provides the channel for creation
and sale of new securities, while the secondary market deals in securities previously
issued. The securities issued in the primary market are issued by public limited
companies or by government agencies. The resources in this kind of market are mobilized
either through the public issue or through private placement route. It is a public issue if
anybody and everybody can subscribe for it, whereas if the issue is made available to a
selected group of persons it is termed as private placement. There are two major types of
issuers of securities, the corporate entities who issue mainly debt and equity instruments
and the government (central as well as state) who issue debt securities (dated securities
and treasury bills).
The secondary market enables participants who hold securities to adjust
their holdings in response to changes in their assessment of risks and returns. Once the
new securities are issued in the primary market they are traded in the stock (secondary)
market. The secondary market operated through two mediums, namely, the over-the-
counter (OTC) market and the exchange-traded market. OTC markets are informal
markets where trades are negotiated. Most of the trades in the government securities are
15
in the OTC market. All the spot trades where securities are traded for immediate delivery
and payment take place in the OTC market. All the spot trades where securities are traded
for immediate delivery and payment take place in the OTC market. All the spot trades
where securities are traded for immediate delivery and payment take place in the OTC
market. The other option is to trade using the infrastructure provided by the stock
exchanges. There are 23 exchanges in India and all of them follow a systematic
settlement period. All the trades taking place over a trading cycle (day=T) are settled
together after a certain time (T+2 day). The trades executed on the National Stock
Exchange (NSE) are cleared and settled by a clearing corporation. The clearing
corporation acts as a counterparty and guarantees settlement. Nearly 100% of the trades
in capital market segment are settled through demat delivery. NSE also provides a formal
trading platform for trading of a wide range of debt securities, including government
securities. A variant of the secondary market is the forward market, where securities are
traded for future delivery and payment. A variant of the forward market is Futures and
Options market. Presently only two exchanges viz., NSE and Stock Exchange, Mumbai
(BSE) provides trading in the derivatives of securities.
International Scenario
Following the implementation of reforms in the securities industry during the last decade,
Indian stock markets. As may be seen out in the world ranking as well as in the
developed and emerging markets. India has a turnover ratio of 94.2%, which is quite
comparable to the other developed market like the US and UK which has turnover ratios
of 129.1% and 141.9% respectively. As per Standard and Poor’s Fact book India ranked
17th
in terms of market capitalization (18th
in 2004) and 18th
in terms of total value traded
16
in stock exchanges and 20th
terms of turnover ratio as on December 2005.
During the year 2007-08, NSE reported a turnover of Rs.3,551,038 crores in the
equities segment. 199 companies have used the on-line IPO system of NSE by the end of
March 2007.
A comparative study of concentration of market indices and indices stocks in
different world markets is presented in the table below. It is seen that the index stocks’
share of total market capitalization in India is 77.9% whereas US index accounted for
92.7%.The ten largest index stocks of total market capitalization is 33.9% in India and
13.9% in case of US.
Market Concentration in the World Index as on End 2005.
Market Index Stocks Share of
Total
Market Capitalization
10 largest Index Stocks’
Share of total Market
Capitalization
Japan 98.5 18.0
Singapore 91.9 49.3
France 95.1 42.9
Germany 92.3 46.0
Italy 98.1 55.0
United Kingdom 86.8 36.4
United States 92.7 13.9
India 77.9 33.9
Source: S&P Emerging Stock Market Factbook, 2006. Data is for the S&P CNX 500
Index.
17
The stock markets worldwide have grown in size as well as depth over the last one
decade. As can be observed from Table 1-3, the turnover on all markets taken together
though have grown from US $ 29.70 trillion in 2003 to $47.32 trillion in 2005. It is
significant to note that US alone accounted for about 45.46% of worldwide turnover in
2005. Despite having a large number of companies listed on its exchanges, India
accounted for a meager 0.94% in total world turnover in 2005.The market capitalization
of all listed companies taken together on all markets stood at US $ 43.64 trillion in 2005
($38.90 trillion in 2004). The share of US in worldwide market capitalization decreased
from 41.96% as at end-2004 to 38.95% in end-2005, while Indian listed companies
accounted for 1.27% of total market capitalization in 2005.
There has also been an increase in market capitalization as per cent of GDP in some of
the major country groups as is evident from Table 1-4. The increase, however, has not
been uniform across countries. The market capitalization as percent of GDP was the
highest at 108.9% for the high income countries as at end-2004 and lowest for middle
income countries at 43.7%. Market capitalization as percent for GDP in India stood at
56.1% as at end-2004. The turnover ratio, which is a measure of liquidity, however was
approximately same for both the high-income countries and low-income countries 14%
and 107.6% respectively. The total number of listed companies stood at 28,001 for high-
income countries, 14,117 for middle income countries as at end-2005.
18
CHAPTER 4
THEORETICAL PERSPECTIVE
OVERVIEW OF SECURITIES MARKET
Share holding pattern
In the interest of transparency, the issuers are required to disclose share holding pattern
on a quarterly basis. Table 1.5 presents the sector wise shareholding pattern of 1069
companies listed on NSE at end march 06. Though the non-promoters holding is about
48%, the public held only 15.26% and the institutional holdings by (FIIs, MFs, FIs)
accounted for 20.675. There is not much significant difference in the shareholding pattern
of companies in different sectors. About 80% of shares in companies in Infrastructure
sector are held by Indian Promoters.
Households.
According to the RBI data, household sector accounted for 85.4% of gross domestic
savings during 2004-05. However, this has decreased to 83.9% in 2005-06. In the last
fiscal 2005-06, they have invested 47.4% of financial savings in deposits, 24.2% in
insurance/provident funds, 12.3% on small savings, and 7.2% in securities (out of which
the investment in Gilts has been 2.4%), including government securities and units of
mutual funds (Table 1-6). Thus the fixed income bearing instruments are the most
preferred assets of the household sector.
19
Savings of Household Sector in Financial Assets
Financial Assets
Currency
Fixed income investments
Deposits
Insurance/Provident/Pension Funds
Small Savings
Securities Market
Mutual Funds
Government Securities
Other Securities
2002-03(P)
8.9
86.9
4.09
31.1
14.9
4.2
1.3
2.5
0.4
2003-04(P)
11.2
81.6
38.8
27.3
15.5
7.5
1.2
7.5
-1.2
2004-05 #
8.5
85.4
37
28.9
19.5
6.0
0.4
4.9
0.7
2005-06 #
8.8
83.9
47.4
24.2
12.3
7.2
3.6
2.4
1.2
Total 100.0 100.0 100.0 100.0
Source: RBI
Corporate Securities
It appears that more and more people prefer mutual funds (MFs) as their
investment vehicle. This change in investor behaviour is induced by the evolution of a
regulatory framework for MFs, tax concessions offered by government and preference of
investors for passive investing. Starting with an asset base of Rs.250 million in 1964, the
total assets under management at the end of March 2006 has risen to Rs.2,318,620
million. During the last one decade, the resources mobilized by the MFs are increased
from Rs.112, 440 million in 1993-94 to Rs.527,800 million in 2005-06.
20
Table Resoure Mobilisation from the Primary Market
Issues 2001-02 2002-03 2003-04 2004-05 2005-06
Corporate
Securities
744032 752411 748500 1092970 1346660
a)Domestic
Issues
720612 718147 717520 1059440 1233080
Non-Govt.
Public Cos.
56920 18777 36750 134820 211540
PSU Bonds - - - - -
Govt. Cos. 3500 - 1000 26840 3730
Banks & FIs 10700 29890 40760 57260 54130
Pvt.Placement 649500 669480 639010 840520 963680
b)Euro Issues 23420 34264 30980 33530 113580
Govt.
securities
1525080 1819790 1981570 1456020 1817470
Central Govt. 1338010 1511260 1476360 1065010 1600180
State Govts. 187070 308530 505210 391010 217290
Total 2269112 2562201 2730070 2548990 3164130
Alongwith growth of the market, the investor base has also widened. In
addition to banks and insurance companies, corporates and individual investors are also
investing in government securities. The weighted average cost of borrowing has
increased to 7.34% in 2005-06. The maturity structure of government debt is also
changing. About 74% of primary issues were raised through securities with maturities
above 5 years and upto 10 years. As a result the weighted average maturity of dated
securities increased to 16.9 years in 2005-06.
21
Secondary Market
Corporate Securities
Exchanges in the country, which offer screen based trading system. The
trading system is connected using the VSAT technology from over 281 cities. There are
9,335 trading members registered with SEBI as at end March 2006.
The relative importance of various stock exchanges in the market has
undergone dramatic change during this decade. The increase in turnover took place
mostly at the big exchanges. The NSE yet again registered as the market leader with
more than 89% of total turnover (volumes on all segment) in 2005-06. Top 2 stock
exchanges accounted for 99.9% of turnover, while the rest 21 exchange had negligible
volumes during 2005-06.
Derivatives Market
The number of instruments available in derivatives has been expanded. To begin
with, SEBI only approved trading in index future contracts based on S&P CNX Nifty
Index and BSE-30 (Sensex) Index. This was followed by approval for trading in options
based on these indices and options on individual securities and also futures on interest
rates derivative instruments (91 day Notional T-Bills and 10 year Notional 6% coupon
bearing as well as zero coupon bonds. Now, there are futures and options based on
benchmark index S&P CNX Nifty, CNX IT Index and Bank Nifty Index as well as
options and futures on single stocks (122 stocks). Futures and options contracts were
introduced on CNX Nifty Junior and CNX 100 indices for trading in F&O segment on
June 1, 2007. The turnover in the derivatives segment has witnessed considerable
22
growth since inception. In the global market, NSE ranks first (1st) in the world in terms
of number of contracts traded in the Single Stock Futures, second (2nd) in Asia in terms
of number of contracts traded in equity derivatives instrument. Since inception, NSE
established itself as the sole market leader in this segment in the country with more than
98 % market share.
As on March 30 2007, 68 members on the F&O segment provided internet
based trading facility to the investors. About 167 lakh trades amounting to Rs.
922,887.03 crore ( US $211, 719.90 million) constituting about 12.55 % of the total
trading volume in this segment were routed and executed through the internet.
At NSE, the F&O segment reported a total trading value (notional) of
Rs.7,356,271 crore (US $1,687,605 million) during 2006-07 as against Rs. 4,824,250
crore (US $ 1,687,605 million), a rise of more than 52.49 % in the past one year.
Regulatory Framework
The four main legislations governing the securities market are (a) the SEBI Act, 1992 (b)
the Companies Act, 1956 (c) the Securities Contract (Regulation) Act, 1956 and (d) the
Depositories Act, 1996.
SEBI Act, 1992: The SEBI Act, 1992 was enacted to empower SEBI with statutory
powers for (a) protecting the interests of investors in securities (b) promoting the
development of the securities market, and (c) regulating the securities market. Its
regulatory jurisdiction extends over corporates in the issuing capital and all
intermediaries and persons associated with securities market. It can conduct enquiries,
audits and inspection of all concerned participants and adjudicate offences under this Act.
It has powers to register and regulate all the market intermediaries. Further it can also
23
penalize them in case of violations of the provisions of the Act, Rules and Regulations
made there under. SEBI has full autonomy and authority to regulate and develop an
orderly securities market.
Securities Contract (Regulation) Act, 1956: It provides for direct and indirect control of
virtually all aspects of the securities trading including the running of stock exchanges
with a aims to prevent undesirable transactions in securities. It gives the Central
Government regulatory jurisdiction over (a) stock exchanges through a process of
recognition and continued supervision, (b) contracts in securities, and (c) listing of
securities on stock exchanges. As a condition of recognition, a stock exchange complies
with the requirements prescribed by the Central Government. The stock exchanges frame
their own listing regulations in consonance with the minimum listing criteria set out in
the Rules.
Depositories Act, 1996: The Depositories Act, 1996 provides for the establishment of
depositories for securities to ensure transferability of securities with speed, accuracy and
security. Provisions have been made for (a) dematerializing the securities in the
depository mode, and (b) making securities of public limited companies freely
transferable subject to certain exceptions (c) providing for maintenance of ownership
records in a book entry form. In order to streamline the settlement process, the Act
envisages transfer of ownership of securities electronically by book entry without moving
the securities from persons to persons. The Act has made the securities of all public
limited companies freely transferable, restricting the company’s right to use discretion in
effecting the transfer of securities, and the transfer deed and other procedural
requirements under the Companies Act have been dispensed with.
24
Companies Act,. 1956: It deals with issue, allotment and transfer of securities and
various aspects relating to company management. It provides for standards of disclosure
in the public issues, particularly in the fields of company management and projects,
information about other listed companies under the same management, and management
perception of risk factors. It also regulates underwriting, the use of premium and
discounts on issues, rights and bonus issues, payment of interest and dividends, supply of
annual report and other information.
Rules, Regulations and Regulators
The responsibility for regulating the securities market is shared by the
Department of Economic Affairs (DEA), Department of Company Affairs (DCA),
Reserve Bank of India (RBI) and SEBI. The orders of SEBI under the securities laws are
appealable before the Securities Appellate Tribunal (SAT).
The SEBI Act and the Depositories Act are mostly administered by SEBI.
SEBI was given full authority and jurisdiction over the securities market under the Act,
and was given concurrent/delegated powers for various provisions under the Companies
Act and the SCRA.
DIP Guidelines
In the interest of investors, SEBI issued the Disclosure and Investor
Protection (DIP) guidelines. These guidelines contain a substantial body of requirements
for issuers/intermediaries, with a broad intention to ensure that all the concerned entities
observe high standards of integrity and fair dealing. The guidelines cast a responsibility
on the lead managers to issue a due diligence certificate, stating that the have examined
25
the prospectus and that it brings out all the facts and does not contain anything wrong or
misleading. Issuers are now required to comply with the guidelines and then access the
market. The companies can access the market only if they fulfill minimum eligibility
norms in terms of their track record of distributable profits and net worth.
Screen Based Trading: Prior to setting up of NSE, the trading on stock exchanges in
India used to take place through an open outcry system. This system did not allow imme
diate matching or recording of trades. This was time consuming, imposed limits on
trading. Inorder to provide efficiency, liquidity and transparency, NSE introduced a
nation-wide on-line fully automated screen based trading system (SBTS). In this system
a member can punch into the computer, quantities of securities and the prices at which he
desires to transact and the transaction is executed as soon as it finds a matching sale or
buy order from a counter party. It allows a large number of participants, irrespective of
their geographical locations, to trade with one another simultaneously, improving the
depth and liquidity of the market. Given the efficiency and cost effectiveness delivered
by the NSE’s trading system, it became the leading stock exchange in the country in its
very first year of operation. This forced the other stock exchanges to adopt SBTS. As a
result, open out-cry system has disappeared from India. Today, India can boast that
almost 100% trading takes place through electronic order matching.
Technology has been harnessed to carry the trading platform to the
premises of brokers. NSE carried the trading platform further to the PCs in the residence
of investors through the internet and to hand held devices through (WAP) for
convenience of mobile investors. This has made a huge difference in terms of equal
access to investors in a geographically vast country like India.
26
Trading Cycle: Initially, the trading cycle varied from 14 days for specified securities to
30 days for others and settlement took another fortnight. The exchanges, however,
continued to have different weekly trading cycles, which enabled shifting of positions
from one exchange to another. Rolling settlement on T+5 basis was introduced in respet
of specified scrips reducing the trading cycle to one day. It was made mandatory for all
exchanges to follow a uniform weekly trading cycle in respect of scrips not under rolling
settlement. All scrips moved to rolling settlement from December, 2001. The settlement
period has been reduced progressively from T+5 to T+3 days. Currently, T+2 day
settlement cycle is being followed.
Derivatives Trading: The market presently offers index futures and index options on
S&P CNX Nifty, CNX IT Index, CNX Bank Nifty Index, BSE 30 Index and stock
options and stock futures on individual stocks (in NSE 122 as of October, 2006) and
futures in interest rate products like notional 91 day T-Bills and notional 10 year bonds.
Depositories Act: The Depositories Act, 1996 was passed to provide for the
establishment of depositories in securities with the objective of ensuring free
transferability of securities with speed and accuracy. This act brought in changes by (a)
making securities of public limited companies freely transferable subject to certain
exceptions (b) dematerializing of securities in the depository mode, in order to promote
dematerialization, the regulator has been promoting settlement in demat form in a phased
manner in an ever-increasing number of securities. There are two depositories in India,
viz. NSDL and CDSL. They have been set up to provide instantaneous electronic
transfer of securities. The number of dematerialized securities increased to 201.9 billion
at the end of March 2006 from 147.7 billion at the end of March, 2005. As on the same
27
date, the value of dematerialized securities was Rs.27,.147 billion and the number of
investor accounts was 9, 421,587.
NCAER--SEBI "Survey of Indian Investors"
An NCAER--SEBI "Survey of Indian Investors" of June 2000 reported that only
7.4 per cent of Indian households invested in equity or debenture securities, either
directly or through mutual funds.
The comparable number for the UK was 23 per cent, Canada 46 per cent,
Germany 18 per cent, France 48 per cent, South Korea 8 per cent, Australia 50 per cent,
and the US about 48 per cent.
The survey also revealed that excluding investments perceived as risk-free (e.g.
NSC, LIC policies) Indian households rank the following four categories in a descending
order of risk preference: (1) bank deposits, (2) gold, (3) UTI and other mutual funds, and
(4) stocks, company deposits, debentures, and chit funds. Indian brokerages, coporates,
market analysts and others have been known to use the media to spread misinformation.
In most cases, even if wrongdoing is established, it is almost impossible to make good the
losses incurred by investors. As such, given the information asymmetries and recurring
episodes of market manipulation, it is understandable that retail investors prefer to invest
in public sector debt instruments.
This lack of investor confidence results in significant opportunity costs. For example,
stock market investment alternatives can promote savings incentives. In efficient markets,
investors are able to readily convert their equity holdings into cash without affecting
stock prices.
28
This ease of exit attracts investors (both domestic and foreign) and enhances capital
allocation efficiency (reducing the dependence on pure bank financing) and growth.
Further, well-functioning equity markets can lead to a better monitoring of management
performance and thereby improve corporate governance.
What else can SEBI do to increase equity market depth and boost investor confidence? In
most capital market regulators around the world, including the SEC in the US, more than
half the staff is engaged in surveillance and legal functions.
Comparatively, SEBI is inadequately staffed both in the number and strength of its
surveillance and legal personnel. To use a military term, SEBI does not have an adequate
'teeth to tail' ratio.
The JPC and SEBI reports on stock market, mutual fund and other "scams" of the last ten
years clearly indicate the complexity of linkages across brokerages, banks, finance
companies, and domestic, overseas corporate bodies.
Consequently, surveillance staff needs to have an adequate "market" background and
strong motivation. Further, SEBI's technical capabilities lag those of entities it is meant to
regulate, e.g. stock exchanges and brokerages. SEBI also needs to anticipate market
anomalies, promote innovation, and relentlessly pursue upgrading technology.
It is difficult for SEBI to attract the talent and doggedness required for its surveillance
and market development responsibilities. Today, it is unlikely that graduates from
prominent law or business schools would consider starting their careers in SEBI.
However, motivated and talented professionals would join if they sense that they would
acquire marketable skills by working in SEBI. Junior positions could be filled through a
competitive entrance examination to build a professional cadre much in the same way as
29
the RBI.
By definition, the part-time SEBI board members from the ministry of finance, DCA and
RBI cannot attend to SEBI's everyday responsibilities.
It is in recognition of the pressures for SEBI to act in a timely and deterrent manner that
the 2002 amendment of the SEBI Act increased the number of full-time board members,
the regulator's investigative powers, and the penalties that can be imposed.
SEBI badly needs its complement of three full-time board members who are
knowledgeable about capital markets, as prescribed in the amended Act.
It bears mentioning though that even in developed markets only a small fraction of
infringements are successfully prosecuted. In out-of-court settlements, fines are usually
paid without admission of guilt.
Hence, even with better surveillance and effective legal follow-up it would be unrealistic
to expect an immediately higher success rate in the prosecution of comparable
infringements in India.
Domestic and international private equity flows in India could be augmented by
simplifying exit value calculations. In recent years annual private equity flows have been
about 0.6 per cent of GDP for the UK and between 1 and 2 per cent for the US.
If we are able to raise additional private equity capital of about 0.5 per cent of GDP, that
would amount to approximately Rs 10,000 crore per annum.
Stock markets are poised to benefit from two factors: (a) a relatively young population;
and (b) pension reforms. Most studies indicate that returns on long-term investments in a
well-diversified stock portfolio usually exceed those on fixed-income securities.
30
Therefore, long-term investments in equity should be attractive for the increasing number
of young retail investors in middle-income groups.
SEBI needs to ensure that the risk-return trade-offs of longer-term equity investments are
well understood by younger investors. Similarly, as funded pension schemes become
more accessible, this could boost investor interest in equity.
To summarise, Indian equity markets have a considerable amount of catching up to do
with the deeper and more liquid markets.
Our efforts need to be focused on: (a) widening the base of the stock market, increasing
liquidity and reducing transaction costs for an increasing number of stocks; (b) expanding
the universe of traded instruments and upgrading technology; (c) raising retail investor
confidence by increasing the effectiveness of surveillance and increasing investor
sophistication; and (d) promoting greater self-regulation, transparency, disclosure and
competition amongst broker-dealers and stock exchanges.
NCAER SURVEY ESTIMATES
• Estimates of investor households and individual investors (direct
ownership): An estimated 12.8 million, or nearly 8 percent, of all Indian households
representing 19 million individuals had directly invested in equity shares or debentures or
both as at the end of the financial year 1998-99.
• Estimates of unit owning households and individual unit holders of
mutual funds (indirect ownership): An estimated 15 million or nearly 9 per cent of all
households have invested in units of mutual funds, many of which could be investor
households. There is likely to be at least 23 million unit holders in mutual funds.
• More households own mutual funds than equity shares and debentures:
31
• The number of households owning units of mutual funds is more than
the investor households which have investments in shares and debentures. The existence
of such large number of unit holders is a measure of the growth of mutual funds.
• The number of equity investor households and equity investors far
exceed debenture owning households and debenture holders: Of the 12.8 million investor
households, 12.1 million, or 7 per cent of all households representing approximately 18
million individual investors, owned equity shares and only 3.7 million households, or 1
percent, representing about 5 million investors owned debentures. The bulk of the
debenture owning households are also equity investor households.
• Households hardly differ in their risk perception of equity shares and
debentures: It is important for corporates to note that households have hardly differed in
the risk perception of equity shares and debentures; this runs contrary to theory and
expectations.
• Ownership of equity shares and debentures by households and
individuals on the rise: Comparison of estimates of investor households available from
the Survey of Household Financial Assets (SOFA) conducted by NCAER at an all India
level in December 1986, and the households have increased at a compounded growth rate
of 22 percent, between 1985-86 and 1998-99. Interestingly, the rural investor households
have increased at a compounded growth rate of 30 percent compared to 19 percent for
urban investor households.
• Growth of investor households have been faster between 1991-92 and
1998-99 than between 1985-86 and 1991-92: Comparison of the estimates of investor
households available from the SOFA in 1986, with those available from a survey
32
conducted by SEBI in 1991-92 and the present Survey shows a sharper rise in investor
households between the period 1991-92 and 1998-99 than between 1985-86 and 1991-92.
• More number of investor households became equity share owners after
1991 than prior to 1991: About 36 percent of the investor households became investors
in equity shares prior to 1991, while the majority of the investor households entered the
market after 1991. The growth of the investor households in the 1990’s is commensurate
with the growth of the securities market in the decade.
• The growth pattern of the investor households reflects the pattern of
expansion of the market and is consistent with the findings of the earlier Surveys: The
primary market expanded rapidly between 1991-95 and contracted thereafter. This
explains why about 47 percent of the investor households entered the market between
1991-92 and 1995-96 and a fat proportion number – 17 percent – entered the market
thereafter.
• But despite this growth only a fringe of Indian households have direct
investments in equity shares, or debentures or both: More than 156 million, or 92
percent, of all Indian households were non-investor households who did not have any
investment in these instruments.
• Some of the developed markets have a larger population of investors:
In the US for example, according to survey conducted by the Investment Company
Institute in 1999, 48.2 percent of the households own equities, directly or indirectly
through mutual funds, of which 53 percent, i.e. 25 percent of all US households directly
own equity. There is therefore a long way to go for the Indian markets. Majority of the
investor households in the US owns equities indirectly through mutual funds as is the
33
case with the Indian market.
• The percentage of households owning equity shares or debentures or
both is substantially higher in urban areas than in rural areas: Of the 48 million urban
households, an estimated 8.8 million households, or 18 per cent, representing
approximately 13 million urban investors owned equity shares or debentures or both. Of
the 121 million rural households, only about 4 million households, or 3 per cent,
representing nearly 6 million rural investors owned these instruments.
• Reforms, regulatory framework provided by SEBI and macroeconomic
changes were responsible for the growth of the market. Following the reforms which
began in June 1991, liberalization in industry, trade, taxation and financial sector had
given the impetus to the growth of capital market. The liberalization in private
investments, the structural change in the market accompanied by the regulatory
environment provided by SEBI for investor protection and development of the market
enabled increasingly large number of companies to access the capital market. The
growing investment expectations of the households arising from the above factors, the
high growth of the economy accompanied by increase in savings rate and greater investor
confidence provided by the regulatory environment attracted large number of investors
into the market.
• Non-investor households are inhibited by several factors: Low per
capita income, apprehension of loss of capital and return on capital, and economic
insecurity which are all inter-related factors, significantly influence the investment
attitude of the households. The lack of awareness about the securities market and the
absence of a dependable infrastructure and distribution network which could have
34
facilitated the households’ access to the market, coupled with their aversion to risk,
appear to have often inhibited the non-investor households from investing in the
securities market. They have instead preferred to rely on traditional institutions such as
banks and post offices with which they have had long term relationship. The automation
of the stock exchanges began from 1995 and the trading terminals spread in a big way
since 1997. The findings of the Survey shows that the benefits of these measures were
yet to be fully realized.
The Demographics
 Demographics of households influence investment preferences of
households.
 Income is the key determinant of investment decision of households.
 Median monthly income of the investor households is more than double
the median monthly income of all households in the country.
 At the same level of income, the percentage of urban investor households
is higher than the rural investor households.
 Self-employed and salaried class constitute significant majority of the
investor households.
 The Indian equity investors tend to be middle aged.
 Majority of all households including non-investor households fall in the
low income group.
 Ownership of consumer durables by the investor and non-investor
households shows difference in their attitudes towards spending and
investment.
35
The Risk Perception
 Investor households diversify their investment portfolio to balance
risks. It is the need of the investors to balance the risks in investment,
with return and liquidity that lead them to diversify their investment
portfolio depending on the level of income of the households.
 For households, safety and liquidity i.e. reliability, are the primary
considerations which determine the choice of an asset: Graded on a
four point scale of risk perception namely: very safe, reasonably safe,
somewhat safe and risky, the eight financial instruments surveyed
excluding the instruments perceived as risk free, such as contractual
savings, NSC, LIC Policy etc. could be classified into four broad
categories perception – bank fixed deposits, gold, UTI and other
mutual funds and the remaining instruments viz, company deposits,
equity shares, debentures, chit funds.
 From the point of view of safety; bank fixed deposit stands apart
from the rest of the instruments: About 65 percent of all households
and 76 percent of the investor households have graded bank fixed
deposits as being very safe and only about 14 percent of all households
and 4 percent of the investor households did not have any opinion
about the risk of bank fixed deposits. Interestingly, only 30 percent of
all households and 37 percent of the investor households have
regarded gold as very safe and 31 percent of all households and 15
36
percent of the investor households had no opinion about the risk in
investment in gold.
 Investor households are aware of risks in investing in equity
shares.
 Attractiveness of NBFCs on the decline: Among other forms of
fixed deposits, fixed deposits of NBFCs have been considered risky by
48 percent of all households and 33 percent of the investor households.
By early 1999, when the survey was being conducted, the problems
faced by the NBFCs had become well known and this would perhaps
account for the high percentage of the households considering NBFC
as being risky.
 Hierarchy of risks in certain instruments: Ranked by a ascending
order of risk perception, bank fixed deposit were considered very safe
i.e. least risky, followed by gold, Units of UTI-US64, UTI-other
schemes, Fixed deposits of Non-Government companies, Mutual
Funds-equity shares and debentures. Debentures were perceived to be
nearly as risky as equity.
 The distribution of the investments of all households into different
inancial instruments corresponds with the risk perceptions: Higher
proportion of households has invested in instruments with a lower risk
perception. For example, 76 percent of all households have invested
in Fixed deposits and about 65 percent of all households consider
Fixed deposits to be very safe investments. That such a large
37
percentage of households have some kind of investments in fixed
deposits is indeed significant.
The Investment Preferences
o Households’ preference for instruments in which they commonly invest (other
than equity shares and debentures) match the risk perception: The percentages of
households investing in any instrument, ranked by preference of all households show
that the fixed deposits as a class, has the highest preference, followed by recurring
deposits of post offices, LIC policies, small savings instruments, contractual savings,
UTI schemes, bonds of public sector undertakings, chit funds and public and private
sector mutual funds.
Distribution of Households in Instruments by Income Class
o Popularity of some instruments is secular to income class; while of others it is
income dependent: This is seen in the relative popularity of bank fixed deposits
which has an appeal across all income classes. Tax has an influence particularly
among the middle and higher income groups but has little relevance to the lower
income group. This is seen by the higher incidence of national savings certificate and
national savings schemes among the middle and higher income groups.
o There is a fairly high incidence of households in LIC policies across all income
groups: It is interesting to note that at least 29 percent of all households own LIC
policies. Its popularity to with the middle and higher income groups, could stem from
the inherent need of households for safety and protection in the event of any
contingencies. The wide distribution network of LIC agents also has an important
role to play in the growth of LIC.
38
Investment Distribution
 A very small percentage of households savings is channelised into the securities
market. Despite the expansion of the securities market and growth in the number of
investor households and in the population of investors, a very small percentage of
households savings is channelised into the securities market. This once again
highlights the untapped potential of the securities market to channelise household
savings.
 Investment pattern match the risk perceptions of households: The urban investor
households have a higher proportion of the investments in equity shares, debentures
and mutual funds compared to the rural households.
 There is a correlation between the income levels and investments of the
households in securities market related instruments: Thus not more than 5 percent of
the investments of the households in the low and middle income groups are in equity
shares, debentures and mutual funds compared to around 12 percent for the high
income groups.
 Despite their growth the mutual funds have not yet become an attractive
investment avenue for the low and middle-income groups.
Non-Investor Households’ profile
 A very large percentage of the households have not participated so far in
the securities market: Security market expansion has still not been able to
channelise significant proportions of savings into the securities market.
 Rural areas have a larger share of non-investors: The significant majority
of the non-investor households are in the rural areas. The percentage of non-
investor households in the low-income group is 85 percent for rural areas and
39
63 percent for urban areas.
 A bulk of non-investor households have little or no spare money to invest
in the securities market: This is on account of the bulk of the non-investor
households belong to the low and middle income groups
.
 Occupation-wise, the heads of most of the non-investor households are
wage earners and self employed: They constitute nearly 77 percent of the
total non-investor households. The education level is low as more than 81
percent heads of non-investor households heads are non matriculate or
matriculate.
 Reasons for not investing in the securities are several: 43 percent of the
non-investor households have cited non-availability of time or money as the
first reason for not investing in shares or debentures. Mutual funds, which
afford small investors as investment vehicle for stock market investment,
could identify this segment of non-investor households as a target for
mobilization of funds.
 The class of non-investor households who lack awareness represent
potential investor class: 43 percent of the non-investor households, equivalent
to around 60 million households, apparently lack awareness about the stock
market. Investor education could impart awareness and education about the
procedures of investing in stock markets. This highlights the need for a
program of ‘investor education and awareness’ and also the necessity for
creating infrastructure to facilitate the channelising of their savings into stock
markets.
40
Investment Intentions
⇒ Bank fixed deposits continue to appeal the most: The share of households
investing in a specific instrument is an index of their preference for that instrument,
then fixed deposits with banks, appears to be the most preferred form of investment.
But how long this appeal will endure in the face of declining interest rates remains to
be seen. Fixed deposits with NBFCs have been accorded low priority with only 3
percent of the households intending to invest in these fixed deposits.
⇒ Increased majority of existing investor households are unlikely to invest in the
securities market: It is significant that the majority of urban investor households (56
percent) and rural investor households (72 percent) are unlikely to make fresh
investments in equity shares. This is indeed a matter of concern as it would amount
to an expression of a lack of confidence by the existing investors on the equity
market.
⇒ There is an expected diversification of investment with rise in income levels:.
Classification of all households planning to invest in the next one year by monthly
income levels clearly evidences the expected diversification of investment with level
of income. For example, with increasing income levels, higher proportion of
households in at that income level invests in UTI. This is true even for equity
investments. Investment in mutual funds and equity become popular at higher
income levels, indicating an increase in the risk taking abilities at higher income
levels.
41
Equity Investor Households’ Profile
 Equity investor households have invested through primary and secondary markets
but there are more households investing through the primary market: Out of the 12.1
million equity investor households, 84 percent have invested in equity shares through
the primary market and 63 percent have bought equity shares in the secondary
market.
 The appeal of the secondary market investments seem to be less than the primary
market: Difficulties faced by households in investing through this route such as lack
of easy access to the market, inadequacy of market infrastructure, problem in locating
the right intermediary for dealing in the secondary market, lack of guidance and +
advice, are some of the factors which could have inhibited the households, from
investing in the secondary market. A comparatively small percentage of rural
investor households in the secondary market highlighted the non-availability of
infrastructure for the secondary market.
 More households have become equity investors after 1991: Around 80 percent of
the equity investor households were the “first generation investors”.
 Equity investor households with higher income have reported better performance
of equity investment, probably due to their access to professional advice. Possibly
adequate portfolio diversification at higher income levels, would also have helped in
improving portfolio performance. Lower income groups cannot afford portfolio
diversification and are therefore exposed to unsystematic risk.
42
INVESTMENT DECISIONS
People lose money in stock markets more because of their own mistakes, than any
market turmoil and other such things. For instance, it has generally been observed that
equity investments are often guided by greed and investors seldom do their homework
before putting their hard-earned money in stock markets. Besides, they often resort to
speculation and keep 'timing the market', which has not proven to be a great strategy.
Lots of investors also presume that the market will only go northwards and the
bull run will never end. But that never happens. Not in any market of the world. But that's
how it is.
Here are 10 such mistakes that equity investors generally make:
1. Guided by greed
Many investors have been losing money in stock markets owing to their inability to
control greed and fear. The lure of quick wealth is difficult to resist, particularly in a bull
market. Greed augments when investors hear stories of fabulous returns being made in
the stock market in a short period of time and, thus, lose their hard-earned money in
many cases.
2. Following herd mentality
Following herd mentality is another reason for the investors’ losses. “It has been
witnessed that the typical buyer’s decision is heavily influenced by the actions of his
acquaintances, neighbours or relatives. So, if everybody around is investing in a
particular stock, the tendency for potential investors is to do the same. But this strategy
may backfire in the long run,” says Ashish Kapur, CEO, Invest Shoppe India Ltd.
43
3. Resorting to speculation
Investors also face losses because they speculate and buy shares of unknown companies.
They should, therefore, avoid relying on random tips and go for long-term gains only.
4. Lack of research
Proper research should be undertaken before investing in stocks. But this is rarely done.
Investors generally go by the name of a company or the industry they belong to. But this
is not the right way of putting one’s money into the stock market. “Therefore, if one
doesn’t have time or temperament for studying the markets, one should always take the
help of a suitable financial advisor,” says Kapur.
5. Creating leveraged positions
Many investors suffer from creating heavy positions in the futures segment without really
understanding the risks involved. Instead of creating wealth, however, these investors
burn their fingers very badly in case the sentiment in the market reverses.
6. Panic selling
In a bear market, investors panic and sell their shares at rock bottom prices. Trading on
the bourses was suspended on May 17, 2004, May 18, 2006 and recently on January 22,
2008. Investors who had taken speculative positions lost heavily when blood was on the
street. Even investors who had the capacity to hold on to their investments, lost faith in
the markets and sold their investments in a hurry, thus incurring heavy losses.
7. Timing the market
Many investors try to time the market. But this has not proven to be a great strategy.
Historically, in fact, it has been witnessed that even great bull runs have shown bouts of
panic moments. The volatility witnessed in the markets has inevitably made investors
44
lose money despite the great bull run. Therefore, only prudent investors who put in
money systematically, in the right shares and hold on to their investments patiently, have
made outstanding returns. So it’s not ‘timing the market’, but ‘time in the market’ which
creates wealth. Hence, it is prudent to have patience and always keep a long-term broad
picture in mind.
8. Putting all eggs in one basket
Another mistake which investors generally make is non-diversification of their portfolio.
They generally put all their money in limited and favourite stocks which are in
momentum. So, investors should diversify their portfolio across industries and size of the
companies. Also, it is important to diversify across asset classes – equities, real estate,
bonds, commodities, cash etc.
9. Avoiding financial planning
Investors also do not apply financial planning practices in their investment approach.
They should follow an asset allocation model and invest only in long-term funds in the
equity markets. They should also keep rebalancing their overall portfolio from time to
time to keep their exposure to equity markets at the desired ratio of the total portfolio.
10. No monitoring of portfolio
We are living in a global village. Any important event happening in any part of the world
has an impact on our financial markets. Hence, we need to constantly monitor our
portfolio and keep affecting the desired changes in it. If one can’t review one’s portfolio
due to time-constraint or lack of knowledge, they should take the help of a financial
advisor.
45
CHAPTER 5
RESEARCH METHODOLOGY
The unit of observation and analysis of this survey is the household. The
sampling frame in the form of a list of all households is neither readily available nor can
it be easily prepared. One of the notable features of the design is that the sample has
been taken from a cross section of households in and around Mumbai with the objective
of enhancing the precision of the estimates. The urban city like Mumbai and Thana
account for nearly 60% of the total trading in the country. Hence, Mumbai and its
adjoining district Thane alongwith Pune was covered in the sampling frame.
A total of 2000 households were selected in the first stage. Information on
some basic characteristics of the households alongwith ownership of equity shares was
collected from these households. A sub sample of 100 households was then used for
detailed canvassing.
Coverage:- All parts of Mumbai City, Thana District and Pune have been covered by the
survey.
Reference Period: The field operation for the household data collection through a pre-
tested questionnaire was carried out during June-July, 2008.
Definition of Investor and Non-Investor Households: The households have been
classified into two categories – investor households and non-investor households.
Households which directly owned equity shares at the time of the survey have been
classified as investor households. Those households which did not directly own equity
shares have been treated as non-investor households.
46
Stratification and Selection of sample households: The households were also classified
into the following five income categories based on the data collected on household’s
income. The income categories were:-
 Low, with monthly income of Rs.10,000/- and below.
 Lower Middle, with monthly income between Rs.10,000-Rs.25,000/-
 Middle, with monthly income between Rs.25,000/- - Rs.50,000/-
 Upper Middle, with monthly income between Rs.50,001 to Rs.1,00,000/-
 High, with monthly income more than Rs.1,00,000/-
Households in the higher income groups could generally be expected to have
larger savings available for investment, which they invest in a variety of instruments.
These groups of households, which form a small proportion of the total households,
account for a large portion of the savings. Unless these households are adequately
represented in the sample, estimates are likely to have large sampling errors. Justification
of households by the above criteria made it possible to give these groups adequate
representation.
Sample Size and characteristics
Thus, a total of 20 sample investor/non-investor households were selected
from each sample, for canvassing the household questionnaire. In all 100 households
were selected and a detailed information was collected from these selected
households through a pre-tested questionnaire.
47
CHAPTER 6
Data Analysis and interpretation using
various charts and graphs
A total of 20 sample investor/non-investor households were selected from
each sample, for canvassing the household questionnaire. In all 100 households were
selected and a detailed information was collected from these selected households through
a pre-tested questionnaire. The distribution of sample of households by investor and non-
investor households and by income class is presented in Table 1.1. Out of the total 100
sample households, 35 were investors and 65 were non-investor households. The middle,
upper and high income groups constituted 27 % of the total sample in Mumbai City and
6 % of the total sample households outside Mumbai.
Distribution of Sample Households
Monthly Income Group Mumbai City Outside Mumbai
Upto Rs.10,000 12 02
Rs.10,001- Rs.25000 38 15
Rs.25001- Rs.50000 14 06
Rs.50001- Rs.100000 09 -
Rs.100001 and above 04
-
It can be seen from the above, that the data collected for sample
households having a monthly income of Rs.10001 to Rs.25000 was the maximum. Data
collected from 38 investors/non-investors from Mumbai City and 15 investors/non-
48
investors from outside Mumbai.
Distribution of Investor Households
Monthly Income Group Mumbai City Outside Mumbai
Upto Rs.10,000 07 -
Rs.10,001- Rs.25000 08 04
Rs.25001- Rs.50000 06
01
Rs.50001- Rs.100000 07
-
Rs.100001 and above 02 -
It can be seen from the above that 21% of sample households in the
monthly income group of Rs,.10001- Rs.25000/- in Mumbai City are investors and 26%
of sample households in the monthly income group of Rs.10001-Rs.25000 outside
Mumbai are non-investors. It can also be seen that 77% of upper middle income group
in Mumbai are investors and 50% of high income group are investors.
49
Distribution of sample households
0 10 20 30 40
Mumbai City
Outside Mumbai
Rs.100000 and
above
Rs.50001-
Rs.100000
Rs.25001- Rs.50000
Rs.10,001-
Rs.25000
Upto Rs.10,000
Distribution of Non-Investor Households
Monthly Income Group Mumbai City Outside Mumbai
Upto Rs.10,000 05 02
Rs.10,001- Rs.25000 30 11
Rs.25001- Rs.50000 08 05
Rs.50001- Rs.100000 02 -
Above Rs.100000 02 -
The non-investor households include those who are investing their funds
in Mutual funds (indirect investment in equities) and Government securities. 47 sample
households in Mumbai City are non-investors and 18 sample households outside Mumbai
are non-investors.
Distribution of Sample Households by Income and by zones/areas
Areas Below
10000
10001-
25000
25001-
50000
50001-
100000
Above
100000
South Mumbai - 1 1 1 -
South-Central
Mumbai
3 5 - - -
Cemtral Mumbai 1 5 3 1 -
North-West
Mumbai
8 20 9 5 4
North-East
Mumbai
1 6 1 2 -
Thana (Central) 1 3 2 - -
Thana (Western) 1 8 2 - -
Navi Mumbai - 2 2 - -
Pune - 1 - - -
50
It can be seen that maximum data was collected from North-West Mumbai
(i.e. from Bandra to Dahisar) which accounted for around 46 sample households and the
income group representing Rs.10,000/- -Rs.25000/- for 20 sample households. Thana,
Navi Mumbai and Pune accounted for 22 sample households. Mumbai, excluding
suburbs accounted for 21 sample households.
Investors are only equity holders and non-investors include not only those
not investing in market but also who invest in mutual funds. Table 2.1 shows the
distribution of investor and non-investor households in Mumbai & outside Mumbai.
Distribution of Investors(Equity), (Equity & Mutual funds) (Only Mutual Funds and
Non-Investors in Mumbai and outside Mumbai
Direct
investment in
Equities
Direct &
Indirect
investment in
Equities and
Mutual funds
Non Investors
Investment in
Mutual funds
only
No investment
in securities
market
Mumbai City 11 19 9 37
Outside
Mumbai
3 3 6 12
It can be seen that mutual funds market has gained importance & 19% of
sample investor households invest in equities and mutual funds & 9% invest only in
mutual funds in Mumbai City and 6% of sample households outside Mumbai invest in
Mutual funds only. 39 sample households in Mumbai and 12 sample households outside
Mumbai invest in securities market (either directly or indirectly).
51
Income Profile of all households
As per estimates, nearly 76% of all households (129 million) fall in the low monthly
income group of Rs.10000/- and below.
Distribution of Households by Monthly Income Group
Monthly Income
Group
All Households Investor Households
Mumbai City Outside
Mum
bai
Mumbai City Outside
Mumb
ai
Upto Rs.10,000 14 1 7 -
Rs.10,001- Rs.25000 38 14 7 6
Rs.25001- Rs.50000 14 6 5 2
Rs.50001-
Rs.100000
9 - 7 -
Above Rs.100000 4 - 2 -
It can be seen from the above that 28 sample households in Mumbai are
investors and 8 sample households outside Mumbai are investors. The investors outside
Mumbai are in the income group between Rs.10001 to Rs.50000. In Mumbai, the
maximum number of investors are in the income range of Rs.50,000/- - Rs.1,00,000
(77%). In the income group above Rs.1,00,000/-, the investors sample is 50% of the
total sample households and similarly in the income range below Rs.10,000/-, the number
of investors are 50% of the total sample households. In the income group of Rs.25,000-
Rs.50,000/- the number of investor households are 35.71%. Similarly, in the income
group of Rs.10,000/- - Rs.25,000/-, the number of investors to the total sample
households are 18.42%.
52
Distribution by Type and Occupation of Household
Occupation Mumbai Outside Mumbai
Equity Non-
Investors
Total Equity Non-
Investors
Total
Salaried 19 43 62 4 13 17
Professional 3 1 4 - -
-
Businessmen 5 5 10 3 2 5
Retired 2 - 2 - - -
It can be seen/observed that around 79% of data collected are from
salaried individuals in Mumbai and outside Mumbai. Out of which, only 30.64% in
Mumbai and 23.52% outside Mumbai are investors. Among the professionals, 7.5% are
investors. The businessmen in Mumbai account for 50% of investors and 60% outside
Mumbai are investors. The retired individuals show 100% investment in securities
market.
Distribution by number of dependent family members, average monthly savings and their
average monthly investment in equities
Less than 2 More than 3 Less
than 4
More than 5
Av.monthly
Savings
Av.Invt.
in Equity
Av.monthly
Savings
Av.Invt.
in Equity
Av.monthly
Savings
Av.Invt.
in Equity
Upto Rs.10,000 1667 267 2000 150 2167 317
Rs.10,001-
Rs.25000
9250 1300 6333 2033 6000 4800
Rs.25001-
Rs.50000
15000 3750 15000 3500 16333 7633
Rs.50001-
Rs.100000
-- - 40,000 22,750 36000 13,200
Above Rs.100000 80000 19250 - - - -
It has been observed from the above Table that individuals/households having
53
income ranging above Rs.1,00,000/- invest around 24-25% of their savings in equities.
Similarly, it can be seen that individuals having dependents from 2-4 have an average
monthly savings of Rs.40,000/- and 56.87% is invested in equities whereas individuals
having dependents from 5 and more have an average monthly savings of Rs.36,000/- and
invest around 36% in equities.
Individuals in the monthly income range of Rs.25,000-Rs.50000/- having
dependents less than 4 has a monthly savings of Rs.15,000/- and invest nearly 25%
(approx.) in equities. It can be observed that individuals in the income range below
Rs.10,000/- invest very scarcely in equities and are risk averse. They generally prefer
fixed income securities or risk-free investments. Their percentage of investment in
equities is 16% for dependents less than 2, 7.5% for dependents less than 4 and 14% for
dependents more than 5. Similarly, the average savings lies between 1500-2500/-
Risk Perception of all households and Investor households
The selection of an instrument for investment is determined by its three
attributes viz., yield of the investment, liquidity and risk perception. The mix of these
attributes governs the characteristic of an instrument. When an investment choice is
made in risky instruments, there is a trade-off between safety, higher returns and
liquidity. It is this need of the investors to balance the risks in investment, with return
and liquidity that lead them to diversify their investment portfolio depending on the level
of income of the households.
The yield of the instrument viz. the returns have a major role to play in
attracting investments in securities. The opinion on returns provided by investment in
securities market was sought for and the distribution are as under:-
54
Table 4.1
Distribution of opinion on returns provided by households in securities
Nature of Returns Sample Households
Low Returns 08
Normal Returns 47
High Returns 29
Very High Returns -
Indifferent 16
It has been observed that 47% of the sample households believe that
investment in securities market bring in normal returns. They consider risk factors
involved, the volatility of securities market, the ups and downs in securities trading. So,
there is a possibility of converting these households into investors in equity similar to
their investment in debt market.
Out of the total sample households, 29% believe that securities market
provide high returns. There is a trade-off between risk and returns and liquidity factor is
also considered. Higher the risk, higher the returns and vice-versa. Aggressive
households are the ones who invest in the securities market. These households are aware
of the stock market movements and prefer to invest in them.
Out of the total sample households, 16% do not know the nature of
returns. They are either less educated or are unaware of the stock movements. These are
the households who needs to be educated and trained and make them aware of the pros
and cons of securities market. These are the households who have limited participation
and invest either in risk-free instruments or not invest at all.
55
8% of the households consider securities market as providing low returns.
They are conservatives and totally rely on risk free investment. They are the households
who consider investment in securities as highly volatile and view negatively towards the
securities market.
Distribution of households opinion on primary and secondary market
Investment Option Primary Market Secondary Market
Avoid 14 20
Invest 36 32
Definitely Invest 06 03
Analyze 35 33
Indifferent 09 12
It can be observed that only 6% and 3% definitely invest in securities
market which is considered as bare minimum. They are the ones who have complete
knowledge of stock exchange, trading, risk factors, returns available.
About 36% of households would invest in the primary securities market if
provided an option and 32% of households would like to invest in secondary market. So,
these are the households who are required to be given proper guidance, training for
enabling them to invest in securities market.
About 35% opts for analysis of the company, industry and the scrip before
going for investment in primary securities market and about 33% opts for analysis of the
shares traded, the growth of the company, factors relating to the industry, scrip and
returns provided. They are the ones who do not follow the advice given by brokers,
56
market rumours but study the factors such as risk, returns, safety and liquidity available
from the securities market..
About 14% and 20% do not wish to go for investment in primary and
secondary market respectively. They are either non-investors or may be investing in risk-
free instruments. These are the ones who has to be trained, guided and make them aware
of the returns available in the securities market. The brokers may be in a better position
to provide free advice to such households/individuals.
About 9% are indifferent and do not have any knowledge of the primary
market. Similarly, 12% of households are not having any knowledge of secondary
market. Awareness programmes such as time to time advice/guidance on equity and
derivatives instruments and updation of the same to be provided. Illiterate/less educated
individuals may be trained in the stock exchange and shown the gains available on
different alternative instruments in the short-term and long-term.
Experience with Brokers
20% of sample households have not contacted any broker. Either they are
non-investors or they carry on trading through the internet.
7% of sample households have claimed that their experience with brokers
are excellent, 10% of sample households have claimed to be very good, 24% of sample
households have claimed to be good, 28% of sample households have claimed to be on
average and 7% of sample households have claimed to be bad.
7% of sample households who faced bad experience with brokers either
changed their broker or did trading independently through internet and some avoided
investing in securities market.
57
54% of sample investor households did not change their broker due to
good services provided by them, trust, updated information provided to them and 23%
changed their broker either due to bad experience or due to change of residence.
Opinion on how difficult it was to close an account and open a fresh
account with new broker/sub broker was sought for. 2% of sample investor households
found it extremely difficult to open a new broker account. 9% found it very difficult and
19% found it somewhat difficult to open a new broker account. 9% of sample investor
households consider it as seamless transition.
Response of households on the improvement of Service rendered by
Brokers
1. 17% of households felt that brokers should give daily up-dates on the
new/existing scrip’s traded in the stock market.
2. 5% of households felt that the brokers should give proper explanation and educate
the common person and give proper guidance on the stock market activities.
3. 4% believed that the brokers should be given proper training in giving service to
clients.
4. 2% of households believe that inorder to improve the service, brokers should
possess perfect knowledge of shares & proper updates given from time to time.
5. 2% of households believe that brokers should give maximum benefit/returns to
clients.
6. 2% of households say that brokers should have good co-ordination and
understanding.
7. Brokers should not be money-minded and should be helpful and give proper
guidance.
58
8. High returns to brokers and investors should be the approach.
9. Brokers should possess sound knowledge of their work and approach should be
good.
10. Always good dealing with customers about investment plans.
11. 100% feedback to be given from time to time to the customers.
12. Sub-brokers should be abolished, securities transaction tax to be reduced.
13. Brokers should be courteous, think of life and not always ‘Money’.
14. There should be improvement in technology.
15. Advice given by brokers should be based on facts and rumours not to be relied
upon.
16. Honest management in shares business.
17. Brokers should provide personalized service, though at a cost.
18. Brokers should be more professional in approach.
19. Rules and regulations supported by legal guarantee to ensure safety of investors
investments.
20. Right information to be provided by brokers so that clients don’t get carried away.
21. More security to be given to investors and Govt. should monitor to avoid
fraud/fraudulent deals by brokers.
22. Should try and give proper attention to their clients and try not to be over
burdened and not take excess clients.
23. Quick response to the investor and how to make more money is very important.
24. Give correct tips about stocks everyday.
59
25. Knowledge, transparency and mutual benefit.
Ranking of Factors which induce the households to invest in
securities market
The respondents were surveyed on which factors influence the households
to invest in securities market. The various factors which were to be ranked by the
households according to their importance.
a. Macro-economic situation.
b. Advise from friends, relatives etc.
c. Advise from broker/sub-broker
d. Analysis of the industry you are investing in
e. Analysis of the company you are investing in
f. Market information (rumours)
g. Everybody is making money.
The respondents had ranked the respective factors according to the
importance placed by the households.
FACTORS INFLUENCING THE INVESTMENT DECISION
RANKINGS Macro-
Economic
Advise
From
Friend
s
Advise
From
Brokers
Analysis
Of
Industry
Analysis
Of
Company
Market
Info.
(Rumour)
Everybody
Is making
Money
1 17 33 16 08 14 02 12
2 13 17 13 35 15 07 02
3 11 06 18 25 30 03 07
4 18 15 14 18 21 12 03
5 17 18 23 09 12 18 05
60
6 12 06 10 04 07 36 25
7 14 06 07 02 02 23 47
It has been observed that the respondents have given mixed response to
the questions asked on the importance given by them to factors which influence the
securities market.
The respondents placed maximum importance which guides their
investment needs to friends/relatives etc. which is ranked 1st
. So, 33% of the household
would go in for the advise given by friends/relatives and change their investment pattern.
Most of the household gave 2nd
ranking to analysis of the industry in which the shares are
traded before investment in shares which is 35%. Most of the household gave 3rd
ranking
to analysis of the company in which the shares are traded before investment in shares
which is 30%. 18 households gave 4th
ranking to macro-economic situation. 2%
households gave 5th
ranking to advise from brokers/sub-brokers. 36 households gave 6th
ranking to market information (rumours) and 47 households gave 7th
ranking to
‘Everybody is making money’.
OPINION ON MEASURES TO INCREASE THE CONFIDENCE OF INVESTORS IN
THE SECURITIES MARKET
1. 8% of sample households stated that updated & timely information of market and
securities increase the confidence of investors in the securities market.
2. 6% gave importance to education on stock market and securities trading.
3. 6% gave importance to publicity and advertisement.
61
4. 5% of sample households state that awareness among society is necessary for
gaining the confidence of investors.
5. 4% gave importance to stability of returns – timely dividend and capital
appreciation.
6. 4% gave importance to economic growth and stable low inflation.
7. 4% of sample households state that measures should be employed to provide
guaranteed returns – Money invested to be paid back with profits. Retail
investors’ funds to be protected.
8. 3% stated that better information dissemination and disclosures by
companies/market through reliable channels.
9. 3% stated that regular up-dates must be provided on new channel/media.
10. 3% stated that necessary training should be provided to investors.
11. 2% stated that clients rely on the trust and faith of brokers and on the company in
which the money is invested.
12. 2% stated that detailed history of the company & its future growth plans should be
made available.
13. 2% stressed on improvement of macro-economic situation.
14. 2% went for good service by brokers.
15. 2% stressed on good study of every stock.
16. One should avoid speculation and try to invest in strong & fundamentally strong
company having a good track record. There should be honest relation between
the broker and investor.
17. Stable Government.
62
18. Transparency between investor and company, less sub-broker.
19. Make it simple and safe.
20. Effective way of dealing with complaints of retail investors.
21. Generally people are risk-averse. So, inorder to safeguard their returns, education
should be provided.
22. Framing of rules to avoid scams.
23. Counselling of friends/relatives of non-investors.
24. To reduce the factors leading to risk in securities market.
25. Removing securities transaction tax.
26. Stable broker firm.
27. More monetary returns from market.
63
CHAPTER 7
FINDINGS
OBSERVATIONS
 Urban population has the maximum number of investors/potential investors
compared to rural population.
 The households having an monthly income of more than Rs.50,000/- and above
have a tendency to save and invest in securities market depending upon their
liquidity and return on investment. Households Monthly Income less than
Rs.50,000/- marginally invest in the market, their volumes being low and rely
on safety, return on investment and risk factors. In Mumbai, the maximum
number of investors are in the income range of Rs.50,000/- - Rs.1,00,000 (77%).
the income range between Rs.10,000-Rs.25,000/- are not investing in the market
and are risk-averse and investing in government securities/fixed income
securities. However, the situation is different with sample investors outside
Mumbai where 42% are investors out of the total sample households. There is
maximum investors awareness in the income range of Rs.50,000-Rs.1,00,000/-.
This is because, they have availed other sources of fixed income securities and
investing the excess funds in the capital market.
 Around 49% among the sample non-investors households do not invest in market
related securities despite the growth in the market securities (either directly or
64
indirectly). Low per capita income, apprehension of loss of capital and return on
capital, and economic insecurity which are all inter-related factors, significantly
influence the investment attitude of the households. The lack of awareness about
the securities market and the absence of a dependable infrastructure and
distribution network which could have facilitated the households’ access to the
market, coupled with their aversion to risk, appear to have often inhibited the non-
investor households from investing in the securities market. They have instead
preferred to rely on traditional institutions such as banks and post offices with
which they have had long term relationship.
 It has been observed that 47% of the sample households believe that investment in
securities market bring in normal returns. They consider risk factors involved, the
volatility of securities market, the ups and downs in securities trading. So, there
is a possibility of converting these households into investors in equity similar to
their investment in debt market.
 Out of the total sample households, 16% do not know the nature of returns. They
are either less educated or are unaware of the stock movements. These are the
households who needs to be educated and trained and make them aware of the
pros and cons of securities market. These are the households who have limited
participation and invest either in risk-free instruments or not invest at all.
 About 36% of households would invest in the primary securities market if
provided an option and 32% of households would like to invest in secondary
market. So, these are the households who are required to be given proper
guidance, training for enabling them to invest in securities market.
65
 About 35% opts for analysis of the company, industry and the scrip before going
for investment in primary securities market and about 33% opts for analysis of the
shares traded, the growth of the company, factors relating to the industry, scrip
and returns provided. They are the ones who do not follow the advice given by
brokers, market rumours but study the factors such as risk, returns, safety and
liquidity available from the securities market..
 About 14% and 20% do not wish to go for investment in primary and secondary
market respectively. They are either non-investors or may be investing in risk-
free instruments.
 About 9% are indifferent and do not have any knowledge of the primary market.
Similarly, 12% of households are not having any knowledge of secondary market.
 54% of sample investor households did not change their broker due to good
services provided by them, trust, updated information provided to them and 23%
changed their broker either due to bad experience or due to change of residence.
 It has been observed that the respondents have given mixed response to the
questions asked on the importance given by them to factors which influence the
securities market.
 33% of the household would go in for the advise given by friends/relatives and
change their investment pattern. Most of the household gave 2nd
ranking to
analysis of the industry in which the shares are traded before investment in shares
which is 35%. Most of the household gave 3rd
ranking to analysis of the company
in which the shares are traded before investment in shares which is 30%.
After going through the security market set-up, the extent of participation
of the household in the securities market, the behaviour, interests, attitudes, investor
66
preferences, the analysis of data collected, the findings, the opinion of the households
about the services of brokers and the measures to improve the securities market, the
following recommendations are made :-
1. A part of savings of the non-investor households of the middle and high income groups
could be channelised into the market through appropriate policy initiatives: The non-
investor households who have surplus funds but are unwilling to invest, represent a pool
of potential investors. Their confidence in the market needs to be enhanced and sustained
if this pool of investors are to be induced to invest in the securities market. Special
efforts would have to be made for creating greater investor awareness through investor
education and developing the infrastructure which allows for easy access to the market.
Possibly, the wider spread of trading terminals of the stock exchanges across the country,
internet trading and availability of electronic fund transfer facility in metropolitan towns
and cities would help encourage this process. Given that investor and non-investor
households do invest in fixed income securities which provide them a certainty of return,
there is a scope for tapping the savings of this class through appropriate type of
debentures with features which will cater to the needs of this class and meet their
preference for safety. This would be of special relevance for funding the development of
infrastructure services, which primarily requires long term debt capital.
2. Appropriate policy initiatives such as development of active retail secondary market in
debt, could also help in attracting the attract savings in bonds and debentures.
3. Like LIC, agents may be appointed for marketing of securities. Publicity and
advertisement starting from door to door marketing to television media via exclusive
news channels for creating awareness among the society which could reach the common
67
man. Better information dissemination and disclosures by companies/market through
reliable channels.
4. Brokers should provide updated & timely information of market and securities which
increase the confidence of investors in the securities market. Detailed history of the
company & its future growth plans should be made available. One should avoid
speculation and try to invest in strong & fundamentally strong company having a good
track record. There should be honest relation between the broker and investor. Broker’s
firm should be stable.
5. Since it was observed that non-investors generally obtain advise from their
friends/relatives, counselling of friends/relatives of non-investors may be done.
6. The investors/non-investors should be thoroughly educated by conducting training
seminars, lectures and making them aware of the stock exchange and securities trading
system.
7. Encouraging retail investors with free entry and exit options. The scope of internet
trading should be widened so that rural investors could easily tap the market with less
efforts.
8. The settlement mechanism should be further reduced to transaction settlement done
immediately.
9. There should be stability in securities market and the factors which influence the
securities market should be properly analysed and controlled, volatility should be reduced
and risk factors should be taken care of. This would result in stability of returns, timely
dividend and capital appreciation.
68
10. Steps to be taken to enhance economic growth and to bring down the level of
inflation and control the factors leading to inflation.
11.The regulating authority should keep a check on the market mechanism and bring
about a stable guaranteed returns to the retail investors. The investment should be
protected. Investors, then would shift their focus from fixed income securities to capital
market securities.
12. The overall macro-economic situation should be studied and measures taken for less
influence of such factors on the securities market.
13. Simple and effective way of dealing with complaints of retail investors.
14. Securities transaction cost to be further reduced.
69
stock exchange and retail participation of clients in securities market

Mais conteúdo relacionado

Mais procurados

A STUDY ON EQUITY & EQUITY DERIVATIVE - INDIAN SECURITIES MARKET
A STUDY ON EQUITY & EQUITY DERIVATIVE - INDIAN SECURITIES MARKETA STUDY ON EQUITY & EQUITY DERIVATIVE - INDIAN SECURITIES MARKET
A STUDY ON EQUITY & EQUITY DERIVATIVE - INDIAN SECURITIES MARKETYashmin Revawala
 
History of capital markets
History of capital marketsHistory of capital markets
History of capital marketsSilu Sayami
 
Study of volatility_and_its_factors_on_indian_stock_market
Study of volatility_and_its_factors_on_indian_stock_marketStudy of volatility_and_its_factors_on_indian_stock_market
Study of volatility_and_its_factors_on_indian_stock_marketKarthik Juturu
 
Stock market efficiency of pakistan stock exchange a review of literature fro...
Stock market efficiency of pakistan stock exchange a review of literature fro...Stock market efficiency of pakistan stock exchange a review of literature fro...
Stock market efficiency of pakistan stock exchange a review of literature fro...Fiaz Ahmad
 
Capital market history in india
Capital market history in indiaCapital market history in india
Capital market history in indiaextratough
 
A study on investment pattern of investors on different products conducted at...
A study on investment pattern of investors on different products conducted at...A study on investment pattern of investors on different products conducted at...
A study on investment pattern of investors on different products conducted at...Projects Kart
 
Stock return and volatility evidence from indian stock market
Stock return and volatility evidence from indian stock marketStock return and volatility evidence from indian stock market
Stock return and volatility evidence from indian stock marketROHITH U J
 
Presentation on stock market and growth
Presentation on stock market and growthPresentation on stock market and growth
Presentation on stock market and growthSolara Kadouf
 
Recent trends and development in Securities Market
Recent trends and development in Securities MarketRecent trends and development in Securities Market
Recent trends and development in Securities MarketJyotsna Gupta
 
How stock market impact on economy
How stock market impact on economyHow stock market impact on economy
How stock market impact on economyAbrar Abi
 
FUNCTIONS OF FINANCIAL MARKETS
FUNCTIONS OF FINANCIAL MARKETSFUNCTIONS OF FINANCIAL MARKETS
FUNCTIONS OF FINANCIAL MARKETSKhyatiTongia
 
An empirical study on performance of mutual fund in india
An empirical study on performance of mutual fund in indiaAn empirical study on performance of mutual fund in india
An empirical study on performance of mutual fund in indiaAmarjeet Singh Minhas
 
Study on future of derivatives(summer training project)
Study on future of derivatives(summer training project)Study on future of derivatives(summer training project)
Study on future of derivatives(summer training project)jsmtkr1
 
Recent trends in indian security market
Recent trends in indian security marketRecent trends in indian security market
Recent trends in indian security marketGagan Varshney
 
Capital market in india
Capital market in indiaCapital market in india
Capital market in indiar2s2r2s
 
Presentation on securities market
Presentation on securities marketPresentation on securities market
Presentation on securities marketpoojaagrawal153
 

Mais procurados (20)

A STUDY ON EQUITY & EQUITY DERIVATIVE - INDIAN SECURITIES MARKET
A STUDY ON EQUITY & EQUITY DERIVATIVE - INDIAN SECURITIES MARKETA STUDY ON EQUITY & EQUITY DERIVATIVE - INDIAN SECURITIES MARKET
A STUDY ON EQUITY & EQUITY DERIVATIVE - INDIAN SECURITIES MARKET
 
History of capital markets
History of capital marketsHistory of capital markets
History of capital markets
 
Study of volatility_and_its_factors_on_indian_stock_market
Study of volatility_and_its_factors_on_indian_stock_marketStudy of volatility_and_its_factors_on_indian_stock_market
Study of volatility_and_its_factors_on_indian_stock_market
 
Stock market efficiency of pakistan stock exchange a review of literature fro...
Stock market efficiency of pakistan stock exchange a review of literature fro...Stock market efficiency of pakistan stock exchange a review of literature fro...
Stock market efficiency of pakistan stock exchange a review of literature fro...
 
Capital market history in india
Capital market history in indiaCapital market history in india
Capital market history in india
 
A study on investment pattern of investors on different products conducted at...
A study on investment pattern of investors on different products conducted at...A study on investment pattern of investors on different products conducted at...
A study on investment pattern of investors on different products conducted at...
 
Stock return and volatility evidence from indian stock market
Stock return and volatility evidence from indian stock marketStock return and volatility evidence from indian stock market
Stock return and volatility evidence from indian stock market
 
Presentation on stock market and growth
Presentation on stock market and growthPresentation on stock market and growth
Presentation on stock market and growth
 
Recent trends and development in Securities Market
Recent trends and development in Securities MarketRecent trends and development in Securities Market
Recent trends and development in Securities Market
 
How stock market impact on economy
How stock market impact on economyHow stock market impact on economy
How stock market impact on economy
 
Presentation(trinobest)
Presentation(trinobest)Presentation(trinobest)
Presentation(trinobest)
 
FUNCTIONS OF FINANCIAL MARKETS
FUNCTIONS OF FINANCIAL MARKETSFUNCTIONS OF FINANCIAL MARKETS
FUNCTIONS OF FINANCIAL MARKETS
 
129447337 beam
129447337 beam129447337 beam
129447337 beam
 
Karvay stock market
Karvay stock marketKarvay stock market
Karvay stock market
 
An empirical study on performance of mutual fund in india
An empirical study on performance of mutual fund in indiaAn empirical study on performance of mutual fund in india
An empirical study on performance of mutual fund in india
 
Study on future of derivatives(summer training project)
Study on future of derivatives(summer training project)Study on future of derivatives(summer training project)
Study on future of derivatives(summer training project)
 
Capital Market Reforms In India
Capital Market Reforms In India Capital Market Reforms In India
Capital Market Reforms In India
 
Recent trends in indian security market
Recent trends in indian security marketRecent trends in indian security market
Recent trends in indian security market
 
Capital market in india
Capital market in indiaCapital market in india
Capital market in india
 
Presentation on securities market
Presentation on securities marketPresentation on securities market
Presentation on securities market
 

Destaque

47729917 religare-mutual-fund-project
47729917 religare-mutual-fund-project47729917 religare-mutual-fund-project
47729917 religare-mutual-fund-projectM_BARANIKUMAR
 
Project report of axis mutual fund by kamal
Project report of axis mutual fund by kamalProject report of axis mutual fund by kamal
Project report of axis mutual fund by kamalKamal Sharma
 
THE STUDY OF STOCK MARKET
THE STUDY OF STOCK MARKETTHE STUDY OF STOCK MARKET
THE STUDY OF STOCK MARKETShweta Acharya
 
project of foreign exchange market
 project of foreign exchange market project of foreign exchange market
project of foreign exchange marketDhwani Patel
 
Project Report On Mutual fund
Project Report On Mutual fund Project Report On Mutual fund
Project Report On Mutual fund Amit Dazz
 
Working capital management project report mba
Working capital management project report mbaWorking capital management project report mba
Working capital management project report mbaBabasab Patil
 
A project report on comparative study of mutual funds in india
A project report on comparative study of mutual funds in indiaA project report on comparative study of mutual funds in india
A project report on comparative study of mutual funds in indiaProjects Kart
 
A PERFORMANCE EVALUATION OF MUTUAL FUND
A PERFORMANCE EVALUATION OF MUTUAL FUND A PERFORMANCE EVALUATION OF MUTUAL FUND
A PERFORMANCE EVALUATION OF MUTUAL FUND Nirav Thanki
 

Destaque (8)

47729917 religare-mutual-fund-project
47729917 religare-mutual-fund-project47729917 religare-mutual-fund-project
47729917 religare-mutual-fund-project
 
Project report of axis mutual fund by kamal
Project report of axis mutual fund by kamalProject report of axis mutual fund by kamal
Project report of axis mutual fund by kamal
 
THE STUDY OF STOCK MARKET
THE STUDY OF STOCK MARKETTHE STUDY OF STOCK MARKET
THE STUDY OF STOCK MARKET
 
project of foreign exchange market
 project of foreign exchange market project of foreign exchange market
project of foreign exchange market
 
Project Report On Mutual fund
Project Report On Mutual fund Project Report On Mutual fund
Project Report On Mutual fund
 
Working capital management project report mba
Working capital management project report mbaWorking capital management project report mba
Working capital management project report mba
 
A project report on comparative study of mutual funds in india
A project report on comparative study of mutual funds in indiaA project report on comparative study of mutual funds in india
A project report on comparative study of mutual funds in india
 
A PERFORMANCE EVALUATION OF MUTUAL FUND
A PERFORMANCE EVALUATION OF MUTUAL FUND A PERFORMANCE EVALUATION OF MUTUAL FUND
A PERFORMANCE EVALUATION OF MUTUAL FUND
 

Semelhante a stock exchange and retail participation of clients in securities market

Project_on_Future_of_Derivatives_in_Indi (1).doc
Project_on_Future_of_Derivatives_in_Indi (1).docProject_on_Future_of_Derivatives_in_Indi (1).doc
Project_on_Future_of_Derivatives_in_Indi (1).docMuskan13129
 
Share khan project origin
Share khan project originShare khan project origin
Share khan project originPawan Raj
 
SMALL INVESTORS' GRIEVANCES AND REDRESSAL MECHANISM IN INDIAN CAPITAL MARKET,...
SMALL INVESTORS' GRIEVANCES AND REDRESSAL MECHANISM IN INDIAN CAPITAL MARKET,...SMALL INVESTORS' GRIEVANCES AND REDRESSAL MECHANISM IN INDIAN CAPITAL MARKET,...
SMALL INVESTORS' GRIEVANCES AND REDRESSAL MECHANISM IN INDIAN CAPITAL MARKET,...Venu Gopal
 
project report on Capital market
 project report on Capital market project report on Capital market
project report on Capital marketPrateek Kumawat
 
A PhD THESIS ON Quot ROLE OF FOREIGN INSTITUTIONAL INVESTORS IN INDIAN STOCK...
A PhD THESIS ON  Quot ROLE OF FOREIGN INSTITUTIONAL INVESTORS IN INDIAN STOCK...A PhD THESIS ON  Quot ROLE OF FOREIGN INSTITUTIONAL INVESTORS IN INDIAN STOCK...
A PhD THESIS ON Quot ROLE OF FOREIGN INSTITUTIONAL INVESTORS IN INDIAN STOCK...Becky Gilbert
 
Intro indian capital market
Intro indian capital marketIntro indian capital market
Intro indian capital marketRahul Khapra
 
Capital Market of Bangladesh: An Overview
Capital Market of Bangladesh: An OverviewCapital Market of Bangladesh: An Overview
Capital Market of Bangladesh: An Overviewitsmuaz743
 
Capital Market and Economic Growth in Nigeria 1981 - 2010
Capital Market and Economic Growth in Nigeria 1981 - 2010 Capital Market and Economic Growth in Nigeria 1981 - 2010
Capital Market and Economic Growth in Nigeria 1981 - 2010 Samuel Udeji
 
10.1.1.194.4505
10.1.1.194.450510.1.1.194.4505
10.1.1.194.4505bubberjung
 
Study of Derivative Market In India
Study of Derivative Market In IndiaStudy of Derivative Market In India
Study of Derivative Market In IndiaGRV1993
 
Determinants of Emerging Capital Markets Development: A Case of Dar Es Salaam...
Determinants of Emerging Capital Markets Development: A Case of Dar Es Salaam...Determinants of Emerging Capital Markets Development: A Case of Dar Es Salaam...
Determinants of Emerging Capital Markets Development: A Case of Dar Es Salaam...AI Publications
 
Capital Market.ppt
Capital Market.pptCapital Market.ppt
Capital Market.pptbizhasan
 
A project on derivatives market in india
A project on derivatives market in indiaA project on derivatives market in india
A project on derivatives market in indiaProjects Kart
 
Introduction to global financial markets
Introduction to global financial marketsIntroduction to global financial markets
Introduction to global financial marketsCPTECUniversity
 
Astudyonfinancialderivativesfuturesoptions 140404093552-phpapp01
Astudyonfinancialderivativesfuturesoptions 140404093552-phpapp01Astudyonfinancialderivativesfuturesoptions 140404093552-phpapp01
Astudyonfinancialderivativesfuturesoptions 140404093552-phpapp01Amar Ghosh Knight Rider
 
online trading sharekhan
 online trading   sharekhan online trading   sharekhan
online trading sharekhanbalaraju39
 
Finance project report on a study on financial derivatives ...
Finance project report on a study on  financial derivatives                  ...Finance project report on a study on  financial derivatives                  ...
Finance project report on a study on financial derivatives ...Mba projects free
 

Semelhante a stock exchange and retail participation of clients in securities market (20)

Project_on_Future_of_Derivatives_in_Indi (1).doc
Project_on_Future_of_Derivatives_in_Indi (1).docProject_on_Future_of_Derivatives_in_Indi (1).doc
Project_on_Future_of_Derivatives_in_Indi (1).doc
 
Share khan project origin
Share khan project originShare khan project origin
Share khan project origin
 
SMALL INVESTORS' GRIEVANCES AND REDRESSAL MECHANISM IN INDIAN CAPITAL MARKET,...
SMALL INVESTORS' GRIEVANCES AND REDRESSAL MECHANISM IN INDIAN CAPITAL MARKET,...SMALL INVESTORS' GRIEVANCES AND REDRESSAL MECHANISM IN INDIAN CAPITAL MARKET,...
SMALL INVESTORS' GRIEVANCES AND REDRESSAL MECHANISM IN INDIAN CAPITAL MARKET,...
 
project report on Capital market
 project report on Capital market project report on Capital market
project report on Capital market
 
Chapter
ChapterChapter
Chapter
 
Final project on Capital Market
Final project on Capital MarketFinal project on Capital Market
Final project on Capital Market
 
A PhD THESIS ON Quot ROLE OF FOREIGN INSTITUTIONAL INVESTORS IN INDIAN STOCK...
A PhD THESIS ON  Quot ROLE OF FOREIGN INSTITUTIONAL INVESTORS IN INDIAN STOCK...A PhD THESIS ON  Quot ROLE OF FOREIGN INSTITUTIONAL INVESTORS IN INDIAN STOCK...
A PhD THESIS ON Quot ROLE OF FOREIGN INSTITUTIONAL INVESTORS IN INDIAN STOCK...
 
Intro indian capital market
Intro indian capital marketIntro indian capital market
Intro indian capital market
 
Capital Market of Bangladesh: An Overview
Capital Market of Bangladesh: An OverviewCapital Market of Bangladesh: An Overview
Capital Market of Bangladesh: An Overview
 
Capital Market and Economic Growth in Nigeria 1981 - 2010
Capital Market and Economic Growth in Nigeria 1981 - 2010 Capital Market and Economic Growth in Nigeria 1981 - 2010
Capital Market and Economic Growth in Nigeria 1981 - 2010
 
10.1.1.194.4505
10.1.1.194.450510.1.1.194.4505
10.1.1.194.4505
 
Study of Derivative Market In India
Study of Derivative Market In IndiaStudy of Derivative Market In India
Study of Derivative Market In India
 
Determinants of Emerging Capital Markets Development: A Case of Dar Es Salaam...
Determinants of Emerging Capital Markets Development: A Case of Dar Es Salaam...Determinants of Emerging Capital Markets Development: A Case of Dar Es Salaam...
Determinants of Emerging Capital Markets Development: A Case of Dar Es Salaam...
 
Capital Market.ppt
Capital Market.pptCapital Market.ppt
Capital Market.ppt
 
A project on derivatives market in india
A project on derivatives market in indiaA project on derivatives market in india
A project on derivatives market in india
 
Introduction to global financial markets
Introduction to global financial marketsIntroduction to global financial markets
Introduction to global financial markets
 
Astudyonfinancialderivativesfuturesoptions 140404093552-phpapp01
Astudyonfinancialderivativesfuturesoptions 140404093552-phpapp01Astudyonfinancialderivativesfuturesoptions 140404093552-phpapp01
Astudyonfinancialderivativesfuturesoptions 140404093552-phpapp01
 
online trading sharekhan
 online trading   sharekhan online trading   sharekhan
online trading sharekhan
 
Finance project report on a study on financial derivatives ...
Finance project report on a study on  financial derivatives                  ...Finance project report on a study on  financial derivatives                  ...
Finance project report on a study on financial derivatives ...
 
Security market
Security marketSecurity market
Security market
 

Mais de umesh yadav

Banking and other financial services
Banking and other financial servicesBanking and other financial services
Banking and other financial servicesumesh yadav
 
Amity business school
Amity business schoolAmity business school
Amity business schoolumesh yadav
 
financial concurrence-ntpc
financial concurrence-ntpcfinancial concurrence-ntpc
financial concurrence-ntpcumesh yadav
 
identifying distribution gap and planning for route effi
identifying distribution gap and planning for route effiidentifying distribution gap and planning for route effi
identifying distribution gap and planning for route effiumesh yadav
 
retailing in pepsi
retailing in pepsiretailing in pepsi
retailing in pepsiumesh yadav
 
comparative market analysis through each dealer survey a
comparative market analysis through each dealer survey acomparative market analysis through each dealer survey a
comparative market analysis through each dealer survey aumesh yadav
 
coca cola marketing strategies
coca cola marketing strategiescoca cola marketing strategies
coca cola marketing strategiesumesh yadav
 
working capital management
working capital managementworking capital management
working capital managementumesh yadav
 
working capitalmgmnt. in air port authority
working capitalmgmnt. in air port authorityworking capitalmgmnt. in air port authority
working capitalmgmnt. in air port authorityumesh yadav
 
two wheeler industry
two wheeler industrytwo wheeler industry
two wheeler industryumesh yadav
 
the professional practice of placement
the professional practice of placementthe professional practice of placement
the professional practice of placementumesh yadav
 
the glassceiling effect
the glassceiling effectthe glassceiling effect
the glassceiling effectumesh yadav
 
37 supply chain management at glaxo
37 supply chain management at glaxo37 supply chain management at glaxo
37 supply chain management at glaxoumesh yadav
 

Mais de umesh yadav (20)

Banking and other financial services
Banking and other financial servicesBanking and other financial services
Banking and other financial services
 
Amity business school
Amity business schoolAmity business school
Amity business school
 
Acknowledgement
AcknowledgementAcknowledgement
Acknowledgement
 
nokia report
nokia reportnokia report
nokia report
 
financial concurrence-ntpc
financial concurrence-ntpcfinancial concurrence-ntpc
financial concurrence-ntpc
 
identifying distribution gap and planning for route effi
identifying distribution gap and planning for route effiidentifying distribution gap and planning for route effi
identifying distribution gap and planning for route effi
 
retailing in pepsi
retailing in pepsiretailing in pepsi
retailing in pepsi
 
comparative market analysis through each dealer survey a
comparative market analysis through each dealer survey acomparative market analysis through each dealer survey a
comparative market analysis through each dealer survey a
 
pepsi
pepsipepsi
pepsi
 
coca cola marketing strategies
coca cola marketing strategiescoca cola marketing strategies
coca cola marketing strategies
 
cadbury
cadburycadbury
cadbury
 
casual wear
casual wearcasual wear
casual wear
 
beer
beerbeer
beer
 
working capital management
working capital managementworking capital management
working capital management
 
working capitalmgmnt. in air port authority
working capitalmgmnt. in air port authorityworking capitalmgmnt. in air port authority
working capitalmgmnt. in air port authority
 
two wheeler industry
two wheeler industrytwo wheeler industry
two wheeler industry
 
time management
time managementtime management
time management
 
the professional practice of placement
the professional practice of placementthe professional practice of placement
the professional practice of placement
 
the glassceiling effect
the glassceiling effectthe glassceiling effect
the glassceiling effect
 
37 supply chain management at glaxo
37 supply chain management at glaxo37 supply chain management at glaxo
37 supply chain management at glaxo
 

Último

Call Girls Navi Mumbai Just Call 9907093804 Top Class Call Girl Service Avail...
Call Girls Navi Mumbai Just Call 9907093804 Top Class Call Girl Service Avail...Call Girls Navi Mumbai Just Call 9907093804 Top Class Call Girl Service Avail...
Call Girls Navi Mumbai Just Call 9907093804 Top Class Call Girl Service Avail...Dipal Arora
 
Mysore Call Girls 8617370543 WhatsApp Number 24x7 Best Services
Mysore Call Girls 8617370543 WhatsApp Number 24x7 Best ServicesMysore Call Girls 8617370543 WhatsApp Number 24x7 Best Services
Mysore Call Girls 8617370543 WhatsApp Number 24x7 Best ServicesDipal Arora
 
Russian Faridabad Call Girls(Badarpur) : ☎ 8168257667, @4999
Russian Faridabad Call Girls(Badarpur) : ☎ 8168257667, @4999Russian Faridabad Call Girls(Badarpur) : ☎ 8168257667, @4999
Russian Faridabad Call Girls(Badarpur) : ☎ 8168257667, @4999Tina Ji
 
VIP Call Girls In Saharaganj ( Lucknow ) 🔝 8923113531 🔝 Cash Payment (COD) 👒
VIP Call Girls In Saharaganj ( Lucknow  ) 🔝 8923113531 🔝  Cash Payment (COD) 👒VIP Call Girls In Saharaganj ( Lucknow  ) 🔝 8923113531 🔝  Cash Payment (COD) 👒
VIP Call Girls In Saharaganj ( Lucknow ) 🔝 8923113531 🔝 Cash Payment (COD) 👒anilsa9823
 
Cash Payment 9602870969 Escort Service in Udaipur Call Girls
Cash Payment 9602870969 Escort Service in Udaipur Call GirlsCash Payment 9602870969 Escort Service in Udaipur Call Girls
Cash Payment 9602870969 Escort Service in Udaipur Call GirlsApsara Of India
 
Call Girls In Panjim North Goa 9971646499 Genuine Service
Call Girls In Panjim North Goa 9971646499 Genuine ServiceCall Girls In Panjim North Goa 9971646499 Genuine Service
Call Girls In Panjim North Goa 9971646499 Genuine Serviceritikaroy0888
 
7.pdf This presentation captures many uses and the significance of the number...
7.pdf This presentation captures many uses and the significance of the number...7.pdf This presentation captures many uses and the significance of the number...
7.pdf This presentation captures many uses and the significance of the number...Paul Menig
 
Tech Startup Growth Hacking 101 - Basics on Growth Marketing
Tech Startup Growth Hacking 101  - Basics on Growth MarketingTech Startup Growth Hacking 101  - Basics on Growth Marketing
Tech Startup Growth Hacking 101 - Basics on Growth MarketingShawn Pang
 
Monthly Social Media Update April 2024 pptx.pptx
Monthly Social Media Update April 2024 pptx.pptxMonthly Social Media Update April 2024 pptx.pptx
Monthly Social Media Update April 2024 pptx.pptxAndy Lambert
 
Yaroslav Rozhankivskyy: Три складові і три передумови максимальної продуктивн...
Yaroslav Rozhankivskyy: Три складові і три передумови максимальної продуктивн...Yaroslav Rozhankivskyy: Три складові і три передумови максимальної продуктивн...
Yaroslav Rozhankivskyy: Три складові і три передумови максимальної продуктивн...Lviv Startup Club
 
Call Girls in Gomti Nagar - 7388211116 - With room Service
Call Girls in Gomti Nagar - 7388211116  - With room ServiceCall Girls in Gomti Nagar - 7388211116  - With room Service
Call Girls in Gomti Nagar - 7388211116 - With room Servicediscovermytutordmt
 
The Coffee Bean & Tea Leaf(CBTL), Business strategy case study
The Coffee Bean & Tea Leaf(CBTL), Business strategy case studyThe Coffee Bean & Tea Leaf(CBTL), Business strategy case study
The Coffee Bean & Tea Leaf(CBTL), Business strategy case studyEthan lee
 
Understanding the Pakistan Budgeting Process: Basics and Key Insights
Understanding the Pakistan Budgeting Process: Basics and Key InsightsUnderstanding the Pakistan Budgeting Process: Basics and Key Insights
Understanding the Pakistan Budgeting Process: Basics and Key Insightsseri bangash
 
Call Girls In DLf Gurgaon ➥99902@11544 ( Best price)100% Genuine Escort In 24...
Call Girls In DLf Gurgaon ➥99902@11544 ( Best price)100% Genuine Escort In 24...Call Girls In DLf Gurgaon ➥99902@11544 ( Best price)100% Genuine Escort In 24...
Call Girls In DLf Gurgaon ➥99902@11544 ( Best price)100% Genuine Escort In 24...lizamodels9
 
Creating Low-Code Loan Applications using the Trisotech Mortgage Feature Set
Creating Low-Code Loan Applications using the Trisotech Mortgage Feature SetCreating Low-Code Loan Applications using the Trisotech Mortgage Feature Set
Creating Low-Code Loan Applications using the Trisotech Mortgage Feature SetDenis Gagné
 
Monte Carlo simulation : Simulation using MCSM
Monte Carlo simulation : Simulation using MCSMMonte Carlo simulation : Simulation using MCSM
Monte Carlo simulation : Simulation using MCSMRavindra Nath Shukla
 
Best Basmati Rice Manufacturers in India
Best Basmati Rice Manufacturers in IndiaBest Basmati Rice Manufacturers in India
Best Basmati Rice Manufacturers in IndiaShree Krishna Exports
 
A DAY IN THE LIFE OF A SALESMAN / WOMAN
A DAY IN THE LIFE OF A  SALESMAN / WOMANA DAY IN THE LIFE OF A  SALESMAN / WOMAN
A DAY IN THE LIFE OF A SALESMAN / WOMANIlamathiKannappan
 

Último (20)

Call Girls Navi Mumbai Just Call 9907093804 Top Class Call Girl Service Avail...
Call Girls Navi Mumbai Just Call 9907093804 Top Class Call Girl Service Avail...Call Girls Navi Mumbai Just Call 9907093804 Top Class Call Girl Service Avail...
Call Girls Navi Mumbai Just Call 9907093804 Top Class Call Girl Service Avail...
 
Mysore Call Girls 8617370543 WhatsApp Number 24x7 Best Services
Mysore Call Girls 8617370543 WhatsApp Number 24x7 Best ServicesMysore Call Girls 8617370543 WhatsApp Number 24x7 Best Services
Mysore Call Girls 8617370543 WhatsApp Number 24x7 Best Services
 
Russian Faridabad Call Girls(Badarpur) : ☎ 8168257667, @4999
Russian Faridabad Call Girls(Badarpur) : ☎ 8168257667, @4999Russian Faridabad Call Girls(Badarpur) : ☎ 8168257667, @4999
Russian Faridabad Call Girls(Badarpur) : ☎ 8168257667, @4999
 
VIP Call Girls In Saharaganj ( Lucknow ) 🔝 8923113531 🔝 Cash Payment (COD) 👒
VIP Call Girls In Saharaganj ( Lucknow  ) 🔝 8923113531 🔝  Cash Payment (COD) 👒VIP Call Girls In Saharaganj ( Lucknow  ) 🔝 8923113531 🔝  Cash Payment (COD) 👒
VIP Call Girls In Saharaganj ( Lucknow ) 🔝 8923113531 🔝 Cash Payment (COD) 👒
 
Cash Payment 9602870969 Escort Service in Udaipur Call Girls
Cash Payment 9602870969 Escort Service in Udaipur Call GirlsCash Payment 9602870969 Escort Service in Udaipur Call Girls
Cash Payment 9602870969 Escort Service in Udaipur Call Girls
 
Call Girls In Panjim North Goa 9971646499 Genuine Service
Call Girls In Panjim North Goa 9971646499 Genuine ServiceCall Girls In Panjim North Goa 9971646499 Genuine Service
Call Girls In Panjim North Goa 9971646499 Genuine Service
 
7.pdf This presentation captures many uses and the significance of the number...
7.pdf This presentation captures many uses and the significance of the number...7.pdf This presentation captures many uses and the significance of the number...
7.pdf This presentation captures many uses and the significance of the number...
 
Tech Startup Growth Hacking 101 - Basics on Growth Marketing
Tech Startup Growth Hacking 101  - Basics on Growth MarketingTech Startup Growth Hacking 101  - Basics on Growth Marketing
Tech Startup Growth Hacking 101 - Basics on Growth Marketing
 
Monthly Social Media Update April 2024 pptx.pptx
Monthly Social Media Update April 2024 pptx.pptxMonthly Social Media Update April 2024 pptx.pptx
Monthly Social Media Update April 2024 pptx.pptx
 
Yaroslav Rozhankivskyy: Три складові і три передумови максимальної продуктивн...
Yaroslav Rozhankivskyy: Три складові і три передумови максимальної продуктивн...Yaroslav Rozhankivskyy: Три складові і три передумови максимальної продуктивн...
Yaroslav Rozhankivskyy: Три складові і три передумови максимальної продуктивн...
 
Call Girls in Gomti Nagar - 7388211116 - With room Service
Call Girls in Gomti Nagar - 7388211116  - With room ServiceCall Girls in Gomti Nagar - 7388211116  - With room Service
Call Girls in Gomti Nagar - 7388211116 - With room Service
 
The Coffee Bean & Tea Leaf(CBTL), Business strategy case study
The Coffee Bean & Tea Leaf(CBTL), Business strategy case studyThe Coffee Bean & Tea Leaf(CBTL), Business strategy case study
The Coffee Bean & Tea Leaf(CBTL), Business strategy case study
 
Nepali Escort Girl Kakori \ 9548273370 Indian Call Girls Service Lucknow ₹,9517
Nepali Escort Girl Kakori \ 9548273370 Indian Call Girls Service Lucknow ₹,9517Nepali Escort Girl Kakori \ 9548273370 Indian Call Girls Service Lucknow ₹,9517
Nepali Escort Girl Kakori \ 9548273370 Indian Call Girls Service Lucknow ₹,9517
 
Understanding the Pakistan Budgeting Process: Basics and Key Insights
Understanding the Pakistan Budgeting Process: Basics and Key InsightsUnderstanding the Pakistan Budgeting Process: Basics and Key Insights
Understanding the Pakistan Budgeting Process: Basics and Key Insights
 
Call Girls In DLf Gurgaon ➥99902@11544 ( Best price)100% Genuine Escort In 24...
Call Girls In DLf Gurgaon ➥99902@11544 ( Best price)100% Genuine Escort In 24...Call Girls In DLf Gurgaon ➥99902@11544 ( Best price)100% Genuine Escort In 24...
Call Girls In DLf Gurgaon ➥99902@11544 ( Best price)100% Genuine Escort In 24...
 
Creating Low-Code Loan Applications using the Trisotech Mortgage Feature Set
Creating Low-Code Loan Applications using the Trisotech Mortgage Feature SetCreating Low-Code Loan Applications using the Trisotech Mortgage Feature Set
Creating Low-Code Loan Applications using the Trisotech Mortgage Feature Set
 
Forklift Operations: Safety through Cartoons
Forklift Operations: Safety through CartoonsForklift Operations: Safety through Cartoons
Forklift Operations: Safety through Cartoons
 
Monte Carlo simulation : Simulation using MCSM
Monte Carlo simulation : Simulation using MCSMMonte Carlo simulation : Simulation using MCSM
Monte Carlo simulation : Simulation using MCSM
 
Best Basmati Rice Manufacturers in India
Best Basmati Rice Manufacturers in IndiaBest Basmati Rice Manufacturers in India
Best Basmati Rice Manufacturers in India
 
A DAY IN THE LIFE OF A SALESMAN / WOMAN
A DAY IN THE LIFE OF A  SALESMAN / WOMANA DAY IN THE LIFE OF A  SALESMAN / WOMAN
A DAY IN THE LIFE OF A SALESMAN / WOMAN
 

stock exchange and retail participation of clients in securities market

  • 1. PROJECT REPORT ON “STOCK EXCHANGE AND RETAIL PARTICIPATION OF CLIENTS IN SECURITIES MARKET” INDEX OF CONTENTS CHAPTER PAGE NOS. 1. Rationale for the Study 2. Objective of the Study • Title of the project • Objective of the study • Scope of the study 3. Profile of the securities market 4. Theoretical Perspective 5. Research Methodology • Research Design • Data collection methods/sources • Sampling plan 6. Data Analysis and interpretation using various charts and graphs 7. Findings. 1
  • 2. 8. Limitation if any 9. Expected contribution from the study APPENDIX • Copies of questionnaire • Bibligraphy CHAPTER 1 RATIONALE OF THE STUDY Reforms of the Indian economy during the 1990’s have helped to bring the Indian securities market into the main stream of the Indian financial system. As a result, the growth in investment by individual investors has become quite significant. This made it pertinent to have a first hand in depth view of the extent of public participation directly in the securities market or through mutual funds. The terms of reference of the study were to estimate the number of household and the population of individual investors, their economic and demographic profile, portfolio size, investment preferences for equity as well as other saving instruments. The study was also designed to elicit information from households on their risk perceptions, experiences in investing in security market, return on investment and the like. Other areas to be covered included awareness of investor rights, experiences with grievance redressal mechanisms; indications of investors’ future plans of investment and their expectations from the securities market were also obtained. The study also provided estimates of non-investor households and population, their economic and demographic 2
  • 3. profile, their pattern of investment in various instruments and reasons of non-investment in the equity market. An important feature of the securities market is the depth and breadth of public participation in the market. Millions of households and individual investors provide a pool of capital and a diversity of decision-making that creates liquidity in the market and makes it dynamic. Thus, the number of households and individual stock holders are the two most commonly cited summary statistics denoting the breadth of stock ownership in the population. These two statistics are useful tools for understanding the changes that take place in the equity market and for policy formulation. It is therefore important to estimate these statistics to assess retail participation in securities market. The securities market in India has grown dramatically in the 1990s; this has led to the expansion of direct equity ownership in the country. A large number of households have also indirectly owned equity shares and debentures through their participation in mutual funds. To help guage the impact of the growth of the securities market on the households to conduct a comprehensive survey of Indian Investor households. The markets were transformed in the 1990s The 1990s was the decade of reforms of the Indian economy; it was the period of transformation of the Indian securities market; it was the age of the emergence of the securities market from the backwaters into the mainstream of the Indian financial system. The mutual funds as an investment vehicle helped spread of the equity cult 3
  • 4. among the households and individual investors. Embracing of new technology redefined the stock exchanges in the country, as elsewhere, and made the geographical location of a stock exchange irrelevant. Automation of trading in the stock exchanges brought in train several changes. It helped improve the level of transparency, reduced spreads, and lowered transaction costs. It also allowed for the expansion of the stock exchanges, through the spread of trading terminals in cities and towns in the country and brought the stock exchanges closer to the investors. These changes were the outcome mainly of the economic reforms, macro- economic changes, and the regulations for the securities market. The flagship of government’s reforms, SEBI, had an important role to play in inducing the change in the market place. Established in 1992 as the apex, statutory regulatory body for the securities market, with the express mandate of investor protection, development and market regulation, it was able to put in place in a very short period of time, a credible regulatory structure for the securities market for the first time. SEBI thus became the prime catalyst for market development bringing about far reaching changes in market practices, introducing international best practices and procedures and modernizing the market infrastructure taking advantage of technology and enforcing regulations. When the market was in a bearish trend, the interest rates were high, and the confidence of the investors on the securities market had waned considerably, the in vestors opted for fixed income investments, which were providing higher returns owing to the high interest rates prevailing during the period. The study relates to estimating the number of households and the 4
  • 5. population of individual investors who have invested in the equity market directly or indirectly through mutual funds. Drawing a profile of the households and investors, and describe their demographic, economic, financial and equity ownership characteristics; understand their investment preferences for equity as well as other savings instruments available in the market, their perceptions about market risks, their expectations from the market, the nature of their grievances and difficulties; and estimating the number of households which have refrained from investing in the equity market, describe their demographic characteristics, and analyse the reasons for their reluctance to invest in equity. The study also relates to improvement in the service given by brokers/sub-brokers, boosting the investors’ confidence in the securities market, to enable Non-investors who do not invest in securities market either directly or indirectly to invest in equities and understanding the needs of the investor/non-investor households and preparing tailor-made plans to suit those needs. 5
  • 6. CHAPTER 2 Objective of the Study Title of the project The project is titled as ‘STOCK MARKET AND RETAIL PARTICIPATION OF CLIENTS IN SECURITIES MARKET’ Objective of the study  Estimate the number of households and the population of individual investors who have invested in the equity market directly or indirectly through mutual funds.  Draw a profile of the households and investors, and describe their demographic, economic, financial and equity ownership characteristics;  Understand their investment preferences for equity as well as other savings instruments available in the market, their perceptions about market risks, their expectations from the market, the nature of their grievances and difficulties;  Estimate the number of households which have refrained from investing in the equity market, describe their demographic characteristics, and analyse the reasons for their reluctance to invest in equity.  Improvement in the service given by brokers/sub-brokers.  Boosting the investors’ confidence in the securities market.  To enable Non-investors who do not invest in securities market either directly or indirectly to invest in equities.  Understanding the needs of the investor/non-investor households and preparing 6
  • 7. tailor-made plans to suit those needs. Scope of the study • Reforms of the Indian economy during the 1990’s have helped to bring the Indian securities market into the main stream of the Indian financial system. As a result, the growth in investment by individual investors has become quite significant. This made it pertinent to have a first hand in depth view of the extent of public participation directly in the securities market or through mutual funds. • The Evolution of Stock Exchanges in India – Origin of Bombay Stock Exchange in 1875 and 23 other Stock Exchanges throughout India. The securities traded were equity, debt, derivatives such as options, futures, index. • The securities market has essentially three categories of participants, viz., the issuer of securities, the investors in the securities and the intermediaries. The securities has two interdependent and inseparable segments, the new issues (primary) and the stock (secondary) market. The primary market provides the channel for creation and sale of new securities, while the secondary market deals in securities previously issued. The secondary market operated through two mediums, namely, the over-the-counter (OTC) market and the exchange-traded market. All the trades taking place over a trading cycle (day=T) are settled together after a certain time (T+2 day). The trades executed on the National Stock Exchange (NSE) are cleared and settled by a clearing corporation. The clearing corporation acts as a counter party and guarantees settlement. • Exchanges in the country, which offer screen based trading system. The trading 7
  • 8. system is connected using the VSAT technology from over 281 cities. There are 9,335 trading members registered with SEBI as at end March 2006. Inorder to provide efficiency, liquidity and transparency, NSE introduced a nation-wide on- line fully automated screen based trading system (SBTS). • Presently only two exchanges viz., NSE and Stock Exchange, Mumbai (BSE) provides trading in the derivatives of securities. • Despite having a large number of companies listed on its exchanges, India accounted for a meager 0.94% in total world turnover in 2005. • Market capitalization as percent for GDP in India stood at 56.1% as at end-2004. There are two depositories in India, viz. NSDL and CDSL. They have been set up to provide instantaneous electronic transfer of securities. The number of dematerialized securities increased to 201.9 billion at the end of March 2006 from 147.7 billion at the end of March, 2005 • According to the RBI data, household sector accounted for 85.4% of gross domestic savings during 2004-05. However, this has decreased to 83.9% in 2005- 06. In the last fiscal 2005-06, they have invested 47.4% of financial savings in deposits, 24.2% in insurance/provident funds, 12.3% on small savings, and 7.2% in securities. Thus the fixed income bearing instruments are the most preferred assets of the household sector. • It appears that more and more people prefer mutual funds (MFs) as their investment vehicle. This change in investor behaviour is induced by the evolution of a regulatory framework for MFs, tax concessions offered by government and 8
  • 9. preference of investors for passive investing. Starting with an asset base of Rs.250 million in 1964, the total assets under management at the end of March 2006 has risen to Rs.2,318,620 million. During the last one decade, the resources mobilized by the MFs are increased from Rs.112, 440 million in 1993-94 to Rs.527,800 million in 2005-06. • The total exchange traded derivatives witnessed a value of Rs.48,242,592 million during 2005-06 as against Rs.25,641,269 million during the preceding year. NSE proved itself as the market leader contributing 99.9% of the total turnover in 2005-06 in India. • In the interest of investors, SEBI issued the Disclosure and Investor Protection (DIP) guidelines. These guidelines contain a substantial body of requirements for issuers/intermediaries, with a broad intention to ensure that all the concerned entities observe high standards of integrity and fair dealing. • DEA, DCA, the SEBI and the stock exchanges have set up investor grievance cells for redressal of investor grievance. The exchanges maintain investor protection funds to take care of investor claims. • Government Securities Market: Non-competitive bids are accepted from retail investors inorder to widen investor base. Further, to facilitate retail investors to invest in government securities, RBI permitted select entities to provide custody (Constituent SGL) accounts. Other measures include abolition of TDS on government securities and stamp duty on transfer of demat debt securities. • The terms of reference of the study were to estimate the number of household and the population of individual investors, their economic and demographic profile, 9
  • 10. portfolio size, investment preferences for equity as well as other saving instruments. The study was also designed to elicit information from households on their risk perceptions, experiences in investing in security market, return on investment and the like. Other areas to be covered included awareness of investor rights, experiences with grievance redressal mechanisms; indications of investors’ future plans of investment and their expectations from the securities market were also obtained. The study also provided estimates of non-investor households and population, their economic and demographic profile, their pattern of investment in various instruments and reasons of non-investment in the equity market. • To help guage the impact of the growth of the securities market on the households to conduct a comprehensive survey of Indian Investor households. • The project also covers to study the basic investor/potential investor/non- investment preferences, intentions, attitudes, perception, interests, likes and dislikes towards investment in securities market. • It also focuses its attention towards the brokers’ services, the extent of attracting investors, the opportunities and their ability to face the challenges in the global competitive environment. • Lastly, on the basis of the study, to determine the measures to be adopted to improve the level of confidence of investors in the securities market. 10
  • 11. CHAPTER 3 PROFILE OF THE SECURITIES MARKET Evolution of Stock Exchanges in India The origin of the stock market relates back to the year 1494, when the Amsterdam Stock Exchange was set up. In India it dates back to the 18th Century, an era when the East India Company was a dominant institution in India. “The Bombay Stock Exchange”(BSE) was founded in the year 1875. “The Ahmedabad Shares and Stock Association” was formed in the year 1894. The Calcutta Stock Exchange Association was formed by about 150 brokers on 15th June 1908. In the year 1920, one stock exchange was established in Northern India and one in Madras called “The Madras Stock Exchange”. “The Madras Stock Exchange Association Pvt. Ltd” was established in the year 1941. On 29th April, 1959, it was reorganized as a company limited by guarantee under the name and style of “Madras Stock Exchange”(MSE). The Lahore Stock Exchange was formed in the year 1934. However, in the year 1936 after the Punjab Stock Exchange Ltd. Came into existence, the Lahore Stock Exchange merged with it. In Calcutta, a second Stock Exchange by name “The Bengal Share & Stock Exchange Ltd” was established in the year 1937 and likewise once again in the year 1938, Bombay also witnessed a rival Stock Exchange formed in the name of “Indian Stock Exchange Ltd.” The U.P.Stock Exchange was formed in Kanpur and the Nagpur Stock Exchange Ltd. In Nagpur in the year 1940. The Hyderabad Stock Exchange Ltd. Was incorporated in the year 1944. Two stock exchanges which came into being in Delhi by the name “The Delhi Stock & Share Brokers Association Ltd.” 11
  • 12. And “The Delhi Stocks & Shares Exchange Association Ltd.” Were amalgamated into “The Delhi Stock Exchange Association Ltd.” In the year 1947. Subsequently, the Bangalore Stock Exchange was registered in the year 1957 and recognized in the year 1963. The Third Stock Exchange in the state of Gujarat the “Vadodara Stock Exchange Ltd.” Was incorporated in 1990. The Over the Counter Exchange of India (OTCEI) broadly based on the lines of NASDAQ (National Association of Securities Dealers Automated Quotation) of the USA was promoted and approved on August 1989. The National Stock Exchange of India Ltd. Was incorporated in November, 1992. Today, there are 23 Stock Exchanges in India, including the 3 Stock Exchanges in Mumbai- Bombay Stock Exchange (BSE), National Stock Exchange (NSE) and Over the Counter Exchange of India (OTCEI). The Bombay Stock Exchange is the oldest Stock Exchange in Asia located in Dalal Street, Mumbai in India. The Bombay Stock Exchange was established in 1875 as the “Native Share and Stock Brokers Association” earned a formal status under the Securities and Exchange Board of India (SEBI) in 1956. Market Capitalisation of BSE was about Rs.33.4 trillion as on 2006, October. The Bombay Stock Exchange uses the Bombay Stock Exchange as the market index in Asia and India. The Bombay Stock Exchange deals with trading in derivatives, equity and other debt instruments. Derivatives Market The Bombay Stock Exchange introduces the first Exchange Traded Index Derivative Contract in 2000, the Index Option be traded from 2001 whereas the single stock futures 12
  • 13. were traded from 2002. The weekly options were introduced. Index Futures: Index futures are basically futures whose underlying asset is the BSE index itself. Index options: The index options like any other option gives the holder, the right but not the obligation to buy or sell the underlying asset at a specified date and price. Then underlying asset in the case of the index option is again the BSE index itself. Stock Futures and Options Stock Futures and the stock options have the normal characteristics as any other stock future or option traded by them where the underlying asset is some stock. Equity Futures and Options: The Bombay Stock Exchange also introduced the Equity Futures and Options. Leaving aside the BSE Sensex there are many other indices that are used by the Bombay Stock Exchange and they are as follows: • BSE 500 • BSE 100 • BSE 200 • BSE PSU • BSE MIDCAP • BSE SMLCAP • BSE BANKEX • BSE Tech • BSE Auto • BSE Pharma 13
  • 14. The securities market has essentially three categories of participants, viz., the issuer of securities, the investors in the securities and the intermediaries. The issuers are the borrowers or deficit savers, who issue securities to raise funds. The investors, who are surplus savers, deploy their saving by subscribing to these securities. The intermediaries’ are the agents who match the needs of users and suppliers of funds for a commission. 14
  • 15. These intermediaries perform functions to help both the issuers and investors to achieve their respective goals. This process of mobilizations of resources is carried out under the supervision and overview of the regulators. The regulators develop fair market practices and regulate the conduct issuers of securities and the intermediaries. They are also in charge of protecting the interests of the investors. Market Segments The securities has two interdependent and inseparable segments, the new issues (primary) and the stock (secondary) market. The primary market provides the channel for creation and sale of new securities, while the secondary market deals in securities previously issued. The securities issued in the primary market are issued by public limited companies or by government agencies. The resources in this kind of market are mobilized either through the public issue or through private placement route. It is a public issue if anybody and everybody can subscribe for it, whereas if the issue is made available to a selected group of persons it is termed as private placement. There are two major types of issuers of securities, the corporate entities who issue mainly debt and equity instruments and the government (central as well as state) who issue debt securities (dated securities and treasury bills). The secondary market enables participants who hold securities to adjust their holdings in response to changes in their assessment of risks and returns. Once the new securities are issued in the primary market they are traded in the stock (secondary) market. The secondary market operated through two mediums, namely, the over-the- counter (OTC) market and the exchange-traded market. OTC markets are informal markets where trades are negotiated. Most of the trades in the government securities are 15
  • 16. in the OTC market. All the spot trades where securities are traded for immediate delivery and payment take place in the OTC market. All the spot trades where securities are traded for immediate delivery and payment take place in the OTC market. All the spot trades where securities are traded for immediate delivery and payment take place in the OTC market. The other option is to trade using the infrastructure provided by the stock exchanges. There are 23 exchanges in India and all of them follow a systematic settlement period. All the trades taking place over a trading cycle (day=T) are settled together after a certain time (T+2 day). The trades executed on the National Stock Exchange (NSE) are cleared and settled by a clearing corporation. The clearing corporation acts as a counterparty and guarantees settlement. Nearly 100% of the trades in capital market segment are settled through demat delivery. NSE also provides a formal trading platform for trading of a wide range of debt securities, including government securities. A variant of the secondary market is the forward market, where securities are traded for future delivery and payment. A variant of the forward market is Futures and Options market. Presently only two exchanges viz., NSE and Stock Exchange, Mumbai (BSE) provides trading in the derivatives of securities. International Scenario Following the implementation of reforms in the securities industry during the last decade, Indian stock markets. As may be seen out in the world ranking as well as in the developed and emerging markets. India has a turnover ratio of 94.2%, which is quite comparable to the other developed market like the US and UK which has turnover ratios of 129.1% and 141.9% respectively. As per Standard and Poor’s Fact book India ranked 17th in terms of market capitalization (18th in 2004) and 18th in terms of total value traded 16
  • 17. in stock exchanges and 20th terms of turnover ratio as on December 2005. During the year 2007-08, NSE reported a turnover of Rs.3,551,038 crores in the equities segment. 199 companies have used the on-line IPO system of NSE by the end of March 2007. A comparative study of concentration of market indices and indices stocks in different world markets is presented in the table below. It is seen that the index stocks’ share of total market capitalization in India is 77.9% whereas US index accounted for 92.7%.The ten largest index stocks of total market capitalization is 33.9% in India and 13.9% in case of US. Market Concentration in the World Index as on End 2005. Market Index Stocks Share of Total Market Capitalization 10 largest Index Stocks’ Share of total Market Capitalization Japan 98.5 18.0 Singapore 91.9 49.3 France 95.1 42.9 Germany 92.3 46.0 Italy 98.1 55.0 United Kingdom 86.8 36.4 United States 92.7 13.9 India 77.9 33.9 Source: S&P Emerging Stock Market Factbook, 2006. Data is for the S&P CNX 500 Index. 17
  • 18. The stock markets worldwide have grown in size as well as depth over the last one decade. As can be observed from Table 1-3, the turnover on all markets taken together though have grown from US $ 29.70 trillion in 2003 to $47.32 trillion in 2005. It is significant to note that US alone accounted for about 45.46% of worldwide turnover in 2005. Despite having a large number of companies listed on its exchanges, India accounted for a meager 0.94% in total world turnover in 2005.The market capitalization of all listed companies taken together on all markets stood at US $ 43.64 trillion in 2005 ($38.90 trillion in 2004). The share of US in worldwide market capitalization decreased from 41.96% as at end-2004 to 38.95% in end-2005, while Indian listed companies accounted for 1.27% of total market capitalization in 2005. There has also been an increase in market capitalization as per cent of GDP in some of the major country groups as is evident from Table 1-4. The increase, however, has not been uniform across countries. The market capitalization as percent of GDP was the highest at 108.9% for the high income countries as at end-2004 and lowest for middle income countries at 43.7%. Market capitalization as percent for GDP in India stood at 56.1% as at end-2004. The turnover ratio, which is a measure of liquidity, however was approximately same for both the high-income countries and low-income countries 14% and 107.6% respectively. The total number of listed companies stood at 28,001 for high- income countries, 14,117 for middle income countries as at end-2005. 18
  • 19. CHAPTER 4 THEORETICAL PERSPECTIVE OVERVIEW OF SECURITIES MARKET Share holding pattern In the interest of transparency, the issuers are required to disclose share holding pattern on a quarterly basis. Table 1.5 presents the sector wise shareholding pattern of 1069 companies listed on NSE at end march 06. Though the non-promoters holding is about 48%, the public held only 15.26% and the institutional holdings by (FIIs, MFs, FIs) accounted for 20.675. There is not much significant difference in the shareholding pattern of companies in different sectors. About 80% of shares in companies in Infrastructure sector are held by Indian Promoters. Households. According to the RBI data, household sector accounted for 85.4% of gross domestic savings during 2004-05. However, this has decreased to 83.9% in 2005-06. In the last fiscal 2005-06, they have invested 47.4% of financial savings in deposits, 24.2% in insurance/provident funds, 12.3% on small savings, and 7.2% in securities (out of which the investment in Gilts has been 2.4%), including government securities and units of mutual funds (Table 1-6). Thus the fixed income bearing instruments are the most preferred assets of the household sector. 19
  • 20. Savings of Household Sector in Financial Assets Financial Assets Currency Fixed income investments Deposits Insurance/Provident/Pension Funds Small Savings Securities Market Mutual Funds Government Securities Other Securities 2002-03(P) 8.9 86.9 4.09 31.1 14.9 4.2 1.3 2.5 0.4 2003-04(P) 11.2 81.6 38.8 27.3 15.5 7.5 1.2 7.5 -1.2 2004-05 # 8.5 85.4 37 28.9 19.5 6.0 0.4 4.9 0.7 2005-06 # 8.8 83.9 47.4 24.2 12.3 7.2 3.6 2.4 1.2 Total 100.0 100.0 100.0 100.0 Source: RBI Corporate Securities It appears that more and more people prefer mutual funds (MFs) as their investment vehicle. This change in investor behaviour is induced by the evolution of a regulatory framework for MFs, tax concessions offered by government and preference of investors for passive investing. Starting with an asset base of Rs.250 million in 1964, the total assets under management at the end of March 2006 has risen to Rs.2,318,620 million. During the last one decade, the resources mobilized by the MFs are increased from Rs.112, 440 million in 1993-94 to Rs.527,800 million in 2005-06. 20
  • 21. Table Resoure Mobilisation from the Primary Market Issues 2001-02 2002-03 2003-04 2004-05 2005-06 Corporate Securities 744032 752411 748500 1092970 1346660 a)Domestic Issues 720612 718147 717520 1059440 1233080 Non-Govt. Public Cos. 56920 18777 36750 134820 211540 PSU Bonds - - - - - Govt. Cos. 3500 - 1000 26840 3730 Banks & FIs 10700 29890 40760 57260 54130 Pvt.Placement 649500 669480 639010 840520 963680 b)Euro Issues 23420 34264 30980 33530 113580 Govt. securities 1525080 1819790 1981570 1456020 1817470 Central Govt. 1338010 1511260 1476360 1065010 1600180 State Govts. 187070 308530 505210 391010 217290 Total 2269112 2562201 2730070 2548990 3164130 Alongwith growth of the market, the investor base has also widened. In addition to banks and insurance companies, corporates and individual investors are also investing in government securities. The weighted average cost of borrowing has increased to 7.34% in 2005-06. The maturity structure of government debt is also changing. About 74% of primary issues were raised through securities with maturities above 5 years and upto 10 years. As a result the weighted average maturity of dated securities increased to 16.9 years in 2005-06. 21
  • 22. Secondary Market Corporate Securities Exchanges in the country, which offer screen based trading system. The trading system is connected using the VSAT technology from over 281 cities. There are 9,335 trading members registered with SEBI as at end March 2006. The relative importance of various stock exchanges in the market has undergone dramatic change during this decade. The increase in turnover took place mostly at the big exchanges. The NSE yet again registered as the market leader with more than 89% of total turnover (volumes on all segment) in 2005-06. Top 2 stock exchanges accounted for 99.9% of turnover, while the rest 21 exchange had negligible volumes during 2005-06. Derivatives Market The number of instruments available in derivatives has been expanded. To begin with, SEBI only approved trading in index future contracts based on S&P CNX Nifty Index and BSE-30 (Sensex) Index. This was followed by approval for trading in options based on these indices and options on individual securities and also futures on interest rates derivative instruments (91 day Notional T-Bills and 10 year Notional 6% coupon bearing as well as zero coupon bonds. Now, there are futures and options based on benchmark index S&P CNX Nifty, CNX IT Index and Bank Nifty Index as well as options and futures on single stocks (122 stocks). Futures and options contracts were introduced on CNX Nifty Junior and CNX 100 indices for trading in F&O segment on June 1, 2007. The turnover in the derivatives segment has witnessed considerable 22
  • 23. growth since inception. In the global market, NSE ranks first (1st) in the world in terms of number of contracts traded in the Single Stock Futures, second (2nd) in Asia in terms of number of contracts traded in equity derivatives instrument. Since inception, NSE established itself as the sole market leader in this segment in the country with more than 98 % market share. As on March 30 2007, 68 members on the F&O segment provided internet based trading facility to the investors. About 167 lakh trades amounting to Rs. 922,887.03 crore ( US $211, 719.90 million) constituting about 12.55 % of the total trading volume in this segment were routed and executed through the internet. At NSE, the F&O segment reported a total trading value (notional) of Rs.7,356,271 crore (US $1,687,605 million) during 2006-07 as against Rs. 4,824,250 crore (US $ 1,687,605 million), a rise of more than 52.49 % in the past one year. Regulatory Framework The four main legislations governing the securities market are (a) the SEBI Act, 1992 (b) the Companies Act, 1956 (c) the Securities Contract (Regulation) Act, 1956 and (d) the Depositories Act, 1996. SEBI Act, 1992: The SEBI Act, 1992 was enacted to empower SEBI with statutory powers for (a) protecting the interests of investors in securities (b) promoting the development of the securities market, and (c) regulating the securities market. Its regulatory jurisdiction extends over corporates in the issuing capital and all intermediaries and persons associated with securities market. It can conduct enquiries, audits and inspection of all concerned participants and adjudicate offences under this Act. It has powers to register and regulate all the market intermediaries. Further it can also 23
  • 24. penalize them in case of violations of the provisions of the Act, Rules and Regulations made there under. SEBI has full autonomy and authority to regulate and develop an orderly securities market. Securities Contract (Regulation) Act, 1956: It provides for direct and indirect control of virtually all aspects of the securities trading including the running of stock exchanges with a aims to prevent undesirable transactions in securities. It gives the Central Government regulatory jurisdiction over (a) stock exchanges through a process of recognition and continued supervision, (b) contracts in securities, and (c) listing of securities on stock exchanges. As a condition of recognition, a stock exchange complies with the requirements prescribed by the Central Government. The stock exchanges frame their own listing regulations in consonance with the minimum listing criteria set out in the Rules. Depositories Act, 1996: The Depositories Act, 1996 provides for the establishment of depositories for securities to ensure transferability of securities with speed, accuracy and security. Provisions have been made for (a) dematerializing the securities in the depository mode, and (b) making securities of public limited companies freely transferable subject to certain exceptions (c) providing for maintenance of ownership records in a book entry form. In order to streamline the settlement process, the Act envisages transfer of ownership of securities electronically by book entry without moving the securities from persons to persons. The Act has made the securities of all public limited companies freely transferable, restricting the company’s right to use discretion in effecting the transfer of securities, and the transfer deed and other procedural requirements under the Companies Act have been dispensed with. 24
  • 25. Companies Act,. 1956: It deals with issue, allotment and transfer of securities and various aspects relating to company management. It provides for standards of disclosure in the public issues, particularly in the fields of company management and projects, information about other listed companies under the same management, and management perception of risk factors. It also regulates underwriting, the use of premium and discounts on issues, rights and bonus issues, payment of interest and dividends, supply of annual report and other information. Rules, Regulations and Regulators The responsibility for regulating the securities market is shared by the Department of Economic Affairs (DEA), Department of Company Affairs (DCA), Reserve Bank of India (RBI) and SEBI. The orders of SEBI under the securities laws are appealable before the Securities Appellate Tribunal (SAT). The SEBI Act and the Depositories Act are mostly administered by SEBI. SEBI was given full authority and jurisdiction over the securities market under the Act, and was given concurrent/delegated powers for various provisions under the Companies Act and the SCRA. DIP Guidelines In the interest of investors, SEBI issued the Disclosure and Investor Protection (DIP) guidelines. These guidelines contain a substantial body of requirements for issuers/intermediaries, with a broad intention to ensure that all the concerned entities observe high standards of integrity and fair dealing. The guidelines cast a responsibility on the lead managers to issue a due diligence certificate, stating that the have examined 25
  • 26. the prospectus and that it brings out all the facts and does not contain anything wrong or misleading. Issuers are now required to comply with the guidelines and then access the market. The companies can access the market only if they fulfill minimum eligibility norms in terms of their track record of distributable profits and net worth. Screen Based Trading: Prior to setting up of NSE, the trading on stock exchanges in India used to take place through an open outcry system. This system did not allow imme diate matching or recording of trades. This was time consuming, imposed limits on trading. Inorder to provide efficiency, liquidity and transparency, NSE introduced a nation-wide on-line fully automated screen based trading system (SBTS). In this system a member can punch into the computer, quantities of securities and the prices at which he desires to transact and the transaction is executed as soon as it finds a matching sale or buy order from a counter party. It allows a large number of participants, irrespective of their geographical locations, to trade with one another simultaneously, improving the depth and liquidity of the market. Given the efficiency and cost effectiveness delivered by the NSE’s trading system, it became the leading stock exchange in the country in its very first year of operation. This forced the other stock exchanges to adopt SBTS. As a result, open out-cry system has disappeared from India. Today, India can boast that almost 100% trading takes place through electronic order matching. Technology has been harnessed to carry the trading platform to the premises of brokers. NSE carried the trading platform further to the PCs in the residence of investors through the internet and to hand held devices through (WAP) for convenience of mobile investors. This has made a huge difference in terms of equal access to investors in a geographically vast country like India. 26
  • 27. Trading Cycle: Initially, the trading cycle varied from 14 days for specified securities to 30 days for others and settlement took another fortnight. The exchanges, however, continued to have different weekly trading cycles, which enabled shifting of positions from one exchange to another. Rolling settlement on T+5 basis was introduced in respet of specified scrips reducing the trading cycle to one day. It was made mandatory for all exchanges to follow a uniform weekly trading cycle in respect of scrips not under rolling settlement. All scrips moved to rolling settlement from December, 2001. The settlement period has been reduced progressively from T+5 to T+3 days. Currently, T+2 day settlement cycle is being followed. Derivatives Trading: The market presently offers index futures and index options on S&P CNX Nifty, CNX IT Index, CNX Bank Nifty Index, BSE 30 Index and stock options and stock futures on individual stocks (in NSE 122 as of October, 2006) and futures in interest rate products like notional 91 day T-Bills and notional 10 year bonds. Depositories Act: The Depositories Act, 1996 was passed to provide for the establishment of depositories in securities with the objective of ensuring free transferability of securities with speed and accuracy. This act brought in changes by (a) making securities of public limited companies freely transferable subject to certain exceptions (b) dematerializing of securities in the depository mode, in order to promote dematerialization, the regulator has been promoting settlement in demat form in a phased manner in an ever-increasing number of securities. There are two depositories in India, viz. NSDL and CDSL. They have been set up to provide instantaneous electronic transfer of securities. The number of dematerialized securities increased to 201.9 billion at the end of March 2006 from 147.7 billion at the end of March, 2005. As on the same 27
  • 28. date, the value of dematerialized securities was Rs.27,.147 billion and the number of investor accounts was 9, 421,587. NCAER--SEBI "Survey of Indian Investors" An NCAER--SEBI "Survey of Indian Investors" of June 2000 reported that only 7.4 per cent of Indian households invested in equity or debenture securities, either directly or through mutual funds. The comparable number for the UK was 23 per cent, Canada 46 per cent, Germany 18 per cent, France 48 per cent, South Korea 8 per cent, Australia 50 per cent, and the US about 48 per cent. The survey also revealed that excluding investments perceived as risk-free (e.g. NSC, LIC policies) Indian households rank the following four categories in a descending order of risk preference: (1) bank deposits, (2) gold, (3) UTI and other mutual funds, and (4) stocks, company deposits, debentures, and chit funds. Indian brokerages, coporates, market analysts and others have been known to use the media to spread misinformation. In most cases, even if wrongdoing is established, it is almost impossible to make good the losses incurred by investors. As such, given the information asymmetries and recurring episodes of market manipulation, it is understandable that retail investors prefer to invest in public sector debt instruments. This lack of investor confidence results in significant opportunity costs. For example, stock market investment alternatives can promote savings incentives. In efficient markets, investors are able to readily convert their equity holdings into cash without affecting stock prices. 28
  • 29. This ease of exit attracts investors (both domestic and foreign) and enhances capital allocation efficiency (reducing the dependence on pure bank financing) and growth. Further, well-functioning equity markets can lead to a better monitoring of management performance and thereby improve corporate governance. What else can SEBI do to increase equity market depth and boost investor confidence? In most capital market regulators around the world, including the SEC in the US, more than half the staff is engaged in surveillance and legal functions. Comparatively, SEBI is inadequately staffed both in the number and strength of its surveillance and legal personnel. To use a military term, SEBI does not have an adequate 'teeth to tail' ratio. The JPC and SEBI reports on stock market, mutual fund and other "scams" of the last ten years clearly indicate the complexity of linkages across brokerages, banks, finance companies, and domestic, overseas corporate bodies. Consequently, surveillance staff needs to have an adequate "market" background and strong motivation. Further, SEBI's technical capabilities lag those of entities it is meant to regulate, e.g. stock exchanges and brokerages. SEBI also needs to anticipate market anomalies, promote innovation, and relentlessly pursue upgrading technology. It is difficult for SEBI to attract the talent and doggedness required for its surveillance and market development responsibilities. Today, it is unlikely that graduates from prominent law or business schools would consider starting their careers in SEBI. However, motivated and talented professionals would join if they sense that they would acquire marketable skills by working in SEBI. Junior positions could be filled through a competitive entrance examination to build a professional cadre much in the same way as 29
  • 30. the RBI. By definition, the part-time SEBI board members from the ministry of finance, DCA and RBI cannot attend to SEBI's everyday responsibilities. It is in recognition of the pressures for SEBI to act in a timely and deterrent manner that the 2002 amendment of the SEBI Act increased the number of full-time board members, the regulator's investigative powers, and the penalties that can be imposed. SEBI badly needs its complement of three full-time board members who are knowledgeable about capital markets, as prescribed in the amended Act. It bears mentioning though that even in developed markets only a small fraction of infringements are successfully prosecuted. In out-of-court settlements, fines are usually paid without admission of guilt. Hence, even with better surveillance and effective legal follow-up it would be unrealistic to expect an immediately higher success rate in the prosecution of comparable infringements in India. Domestic and international private equity flows in India could be augmented by simplifying exit value calculations. In recent years annual private equity flows have been about 0.6 per cent of GDP for the UK and between 1 and 2 per cent for the US. If we are able to raise additional private equity capital of about 0.5 per cent of GDP, that would amount to approximately Rs 10,000 crore per annum. Stock markets are poised to benefit from two factors: (a) a relatively young population; and (b) pension reforms. Most studies indicate that returns on long-term investments in a well-diversified stock portfolio usually exceed those on fixed-income securities. 30
  • 31. Therefore, long-term investments in equity should be attractive for the increasing number of young retail investors in middle-income groups. SEBI needs to ensure that the risk-return trade-offs of longer-term equity investments are well understood by younger investors. Similarly, as funded pension schemes become more accessible, this could boost investor interest in equity. To summarise, Indian equity markets have a considerable amount of catching up to do with the deeper and more liquid markets. Our efforts need to be focused on: (a) widening the base of the stock market, increasing liquidity and reducing transaction costs for an increasing number of stocks; (b) expanding the universe of traded instruments and upgrading technology; (c) raising retail investor confidence by increasing the effectiveness of surveillance and increasing investor sophistication; and (d) promoting greater self-regulation, transparency, disclosure and competition amongst broker-dealers and stock exchanges. NCAER SURVEY ESTIMATES • Estimates of investor households and individual investors (direct ownership): An estimated 12.8 million, or nearly 8 percent, of all Indian households representing 19 million individuals had directly invested in equity shares or debentures or both as at the end of the financial year 1998-99. • Estimates of unit owning households and individual unit holders of mutual funds (indirect ownership): An estimated 15 million or nearly 9 per cent of all households have invested in units of mutual funds, many of which could be investor households. There is likely to be at least 23 million unit holders in mutual funds. • More households own mutual funds than equity shares and debentures: 31
  • 32. • The number of households owning units of mutual funds is more than the investor households which have investments in shares and debentures. The existence of such large number of unit holders is a measure of the growth of mutual funds. • The number of equity investor households and equity investors far exceed debenture owning households and debenture holders: Of the 12.8 million investor households, 12.1 million, or 7 per cent of all households representing approximately 18 million individual investors, owned equity shares and only 3.7 million households, or 1 percent, representing about 5 million investors owned debentures. The bulk of the debenture owning households are also equity investor households. • Households hardly differ in their risk perception of equity shares and debentures: It is important for corporates to note that households have hardly differed in the risk perception of equity shares and debentures; this runs contrary to theory and expectations. • Ownership of equity shares and debentures by households and individuals on the rise: Comparison of estimates of investor households available from the Survey of Household Financial Assets (SOFA) conducted by NCAER at an all India level in December 1986, and the households have increased at a compounded growth rate of 22 percent, between 1985-86 and 1998-99. Interestingly, the rural investor households have increased at a compounded growth rate of 30 percent compared to 19 percent for urban investor households. • Growth of investor households have been faster between 1991-92 and 1998-99 than between 1985-86 and 1991-92: Comparison of the estimates of investor households available from the SOFA in 1986, with those available from a survey 32
  • 33. conducted by SEBI in 1991-92 and the present Survey shows a sharper rise in investor households between the period 1991-92 and 1998-99 than between 1985-86 and 1991-92. • More number of investor households became equity share owners after 1991 than prior to 1991: About 36 percent of the investor households became investors in equity shares prior to 1991, while the majority of the investor households entered the market after 1991. The growth of the investor households in the 1990’s is commensurate with the growth of the securities market in the decade. • The growth pattern of the investor households reflects the pattern of expansion of the market and is consistent with the findings of the earlier Surveys: The primary market expanded rapidly between 1991-95 and contracted thereafter. This explains why about 47 percent of the investor households entered the market between 1991-92 and 1995-96 and a fat proportion number – 17 percent – entered the market thereafter. • But despite this growth only a fringe of Indian households have direct investments in equity shares, or debentures or both: More than 156 million, or 92 percent, of all Indian households were non-investor households who did not have any investment in these instruments. • Some of the developed markets have a larger population of investors: In the US for example, according to survey conducted by the Investment Company Institute in 1999, 48.2 percent of the households own equities, directly or indirectly through mutual funds, of which 53 percent, i.e. 25 percent of all US households directly own equity. There is therefore a long way to go for the Indian markets. Majority of the investor households in the US owns equities indirectly through mutual funds as is the 33
  • 34. case with the Indian market. • The percentage of households owning equity shares or debentures or both is substantially higher in urban areas than in rural areas: Of the 48 million urban households, an estimated 8.8 million households, or 18 per cent, representing approximately 13 million urban investors owned equity shares or debentures or both. Of the 121 million rural households, only about 4 million households, or 3 per cent, representing nearly 6 million rural investors owned these instruments. • Reforms, regulatory framework provided by SEBI and macroeconomic changes were responsible for the growth of the market. Following the reforms which began in June 1991, liberalization in industry, trade, taxation and financial sector had given the impetus to the growth of capital market. The liberalization in private investments, the structural change in the market accompanied by the regulatory environment provided by SEBI for investor protection and development of the market enabled increasingly large number of companies to access the capital market. The growing investment expectations of the households arising from the above factors, the high growth of the economy accompanied by increase in savings rate and greater investor confidence provided by the regulatory environment attracted large number of investors into the market. • Non-investor households are inhibited by several factors: Low per capita income, apprehension of loss of capital and return on capital, and economic insecurity which are all inter-related factors, significantly influence the investment attitude of the households. The lack of awareness about the securities market and the absence of a dependable infrastructure and distribution network which could have 34
  • 35. facilitated the households’ access to the market, coupled with their aversion to risk, appear to have often inhibited the non-investor households from investing in the securities market. They have instead preferred to rely on traditional institutions such as banks and post offices with which they have had long term relationship. The automation of the stock exchanges began from 1995 and the trading terminals spread in a big way since 1997. The findings of the Survey shows that the benefits of these measures were yet to be fully realized. The Demographics  Demographics of households influence investment preferences of households.  Income is the key determinant of investment decision of households.  Median monthly income of the investor households is more than double the median monthly income of all households in the country.  At the same level of income, the percentage of urban investor households is higher than the rural investor households.  Self-employed and salaried class constitute significant majority of the investor households.  The Indian equity investors tend to be middle aged.  Majority of all households including non-investor households fall in the low income group.  Ownership of consumer durables by the investor and non-investor households shows difference in their attitudes towards spending and investment. 35
  • 36. The Risk Perception  Investor households diversify their investment portfolio to balance risks. It is the need of the investors to balance the risks in investment, with return and liquidity that lead them to diversify their investment portfolio depending on the level of income of the households.  For households, safety and liquidity i.e. reliability, are the primary considerations which determine the choice of an asset: Graded on a four point scale of risk perception namely: very safe, reasonably safe, somewhat safe and risky, the eight financial instruments surveyed excluding the instruments perceived as risk free, such as contractual savings, NSC, LIC Policy etc. could be classified into four broad categories perception – bank fixed deposits, gold, UTI and other mutual funds and the remaining instruments viz, company deposits, equity shares, debentures, chit funds.  From the point of view of safety; bank fixed deposit stands apart from the rest of the instruments: About 65 percent of all households and 76 percent of the investor households have graded bank fixed deposits as being very safe and only about 14 percent of all households and 4 percent of the investor households did not have any opinion about the risk of bank fixed deposits. Interestingly, only 30 percent of all households and 37 percent of the investor households have regarded gold as very safe and 31 percent of all households and 15 36
  • 37. percent of the investor households had no opinion about the risk in investment in gold.  Investor households are aware of risks in investing in equity shares.  Attractiveness of NBFCs on the decline: Among other forms of fixed deposits, fixed deposits of NBFCs have been considered risky by 48 percent of all households and 33 percent of the investor households. By early 1999, when the survey was being conducted, the problems faced by the NBFCs had become well known and this would perhaps account for the high percentage of the households considering NBFC as being risky.  Hierarchy of risks in certain instruments: Ranked by a ascending order of risk perception, bank fixed deposit were considered very safe i.e. least risky, followed by gold, Units of UTI-US64, UTI-other schemes, Fixed deposits of Non-Government companies, Mutual Funds-equity shares and debentures. Debentures were perceived to be nearly as risky as equity.  The distribution of the investments of all households into different inancial instruments corresponds with the risk perceptions: Higher proportion of households has invested in instruments with a lower risk perception. For example, 76 percent of all households have invested in Fixed deposits and about 65 percent of all households consider Fixed deposits to be very safe investments. That such a large 37
  • 38. percentage of households have some kind of investments in fixed deposits is indeed significant. The Investment Preferences o Households’ preference for instruments in which they commonly invest (other than equity shares and debentures) match the risk perception: The percentages of households investing in any instrument, ranked by preference of all households show that the fixed deposits as a class, has the highest preference, followed by recurring deposits of post offices, LIC policies, small savings instruments, contractual savings, UTI schemes, bonds of public sector undertakings, chit funds and public and private sector mutual funds. Distribution of Households in Instruments by Income Class o Popularity of some instruments is secular to income class; while of others it is income dependent: This is seen in the relative popularity of bank fixed deposits which has an appeal across all income classes. Tax has an influence particularly among the middle and higher income groups but has little relevance to the lower income group. This is seen by the higher incidence of national savings certificate and national savings schemes among the middle and higher income groups. o There is a fairly high incidence of households in LIC policies across all income groups: It is interesting to note that at least 29 percent of all households own LIC policies. Its popularity to with the middle and higher income groups, could stem from the inherent need of households for safety and protection in the event of any contingencies. The wide distribution network of LIC agents also has an important role to play in the growth of LIC. 38
  • 39. Investment Distribution  A very small percentage of households savings is channelised into the securities market. Despite the expansion of the securities market and growth in the number of investor households and in the population of investors, a very small percentage of households savings is channelised into the securities market. This once again highlights the untapped potential of the securities market to channelise household savings.  Investment pattern match the risk perceptions of households: The urban investor households have a higher proportion of the investments in equity shares, debentures and mutual funds compared to the rural households.  There is a correlation between the income levels and investments of the households in securities market related instruments: Thus not more than 5 percent of the investments of the households in the low and middle income groups are in equity shares, debentures and mutual funds compared to around 12 percent for the high income groups.  Despite their growth the mutual funds have not yet become an attractive investment avenue for the low and middle-income groups. Non-Investor Households’ profile  A very large percentage of the households have not participated so far in the securities market: Security market expansion has still not been able to channelise significant proportions of savings into the securities market.  Rural areas have a larger share of non-investors: The significant majority of the non-investor households are in the rural areas. The percentage of non- investor households in the low-income group is 85 percent for rural areas and 39
  • 40. 63 percent for urban areas.  A bulk of non-investor households have little or no spare money to invest in the securities market: This is on account of the bulk of the non-investor households belong to the low and middle income groups .  Occupation-wise, the heads of most of the non-investor households are wage earners and self employed: They constitute nearly 77 percent of the total non-investor households. The education level is low as more than 81 percent heads of non-investor households heads are non matriculate or matriculate.  Reasons for not investing in the securities are several: 43 percent of the non-investor households have cited non-availability of time or money as the first reason for not investing in shares or debentures. Mutual funds, which afford small investors as investment vehicle for stock market investment, could identify this segment of non-investor households as a target for mobilization of funds.  The class of non-investor households who lack awareness represent potential investor class: 43 percent of the non-investor households, equivalent to around 60 million households, apparently lack awareness about the stock market. Investor education could impart awareness and education about the procedures of investing in stock markets. This highlights the need for a program of ‘investor education and awareness’ and also the necessity for creating infrastructure to facilitate the channelising of their savings into stock markets. 40
  • 41. Investment Intentions ⇒ Bank fixed deposits continue to appeal the most: The share of households investing in a specific instrument is an index of their preference for that instrument, then fixed deposits with banks, appears to be the most preferred form of investment. But how long this appeal will endure in the face of declining interest rates remains to be seen. Fixed deposits with NBFCs have been accorded low priority with only 3 percent of the households intending to invest in these fixed deposits. ⇒ Increased majority of existing investor households are unlikely to invest in the securities market: It is significant that the majority of urban investor households (56 percent) and rural investor households (72 percent) are unlikely to make fresh investments in equity shares. This is indeed a matter of concern as it would amount to an expression of a lack of confidence by the existing investors on the equity market. ⇒ There is an expected diversification of investment with rise in income levels:. Classification of all households planning to invest in the next one year by monthly income levels clearly evidences the expected diversification of investment with level of income. For example, with increasing income levels, higher proportion of households in at that income level invests in UTI. This is true even for equity investments. Investment in mutual funds and equity become popular at higher income levels, indicating an increase in the risk taking abilities at higher income levels. 41
  • 42. Equity Investor Households’ Profile  Equity investor households have invested through primary and secondary markets but there are more households investing through the primary market: Out of the 12.1 million equity investor households, 84 percent have invested in equity shares through the primary market and 63 percent have bought equity shares in the secondary market.  The appeal of the secondary market investments seem to be less than the primary market: Difficulties faced by households in investing through this route such as lack of easy access to the market, inadequacy of market infrastructure, problem in locating the right intermediary for dealing in the secondary market, lack of guidance and + advice, are some of the factors which could have inhibited the households, from investing in the secondary market. A comparatively small percentage of rural investor households in the secondary market highlighted the non-availability of infrastructure for the secondary market.  More households have become equity investors after 1991: Around 80 percent of the equity investor households were the “first generation investors”.  Equity investor households with higher income have reported better performance of equity investment, probably due to their access to professional advice. Possibly adequate portfolio diversification at higher income levels, would also have helped in improving portfolio performance. Lower income groups cannot afford portfolio diversification and are therefore exposed to unsystematic risk. 42
  • 43. INVESTMENT DECISIONS People lose money in stock markets more because of their own mistakes, than any market turmoil and other such things. For instance, it has generally been observed that equity investments are often guided by greed and investors seldom do their homework before putting their hard-earned money in stock markets. Besides, they often resort to speculation and keep 'timing the market', which has not proven to be a great strategy. Lots of investors also presume that the market will only go northwards and the bull run will never end. But that never happens. Not in any market of the world. But that's how it is. Here are 10 such mistakes that equity investors generally make: 1. Guided by greed Many investors have been losing money in stock markets owing to their inability to control greed and fear. The lure of quick wealth is difficult to resist, particularly in a bull market. Greed augments when investors hear stories of fabulous returns being made in the stock market in a short period of time and, thus, lose their hard-earned money in many cases. 2. Following herd mentality Following herd mentality is another reason for the investors’ losses. “It has been witnessed that the typical buyer’s decision is heavily influenced by the actions of his acquaintances, neighbours or relatives. So, if everybody around is investing in a particular stock, the tendency for potential investors is to do the same. But this strategy may backfire in the long run,” says Ashish Kapur, CEO, Invest Shoppe India Ltd. 43
  • 44. 3. Resorting to speculation Investors also face losses because they speculate and buy shares of unknown companies. They should, therefore, avoid relying on random tips and go for long-term gains only. 4. Lack of research Proper research should be undertaken before investing in stocks. But this is rarely done. Investors generally go by the name of a company or the industry they belong to. But this is not the right way of putting one’s money into the stock market. “Therefore, if one doesn’t have time or temperament for studying the markets, one should always take the help of a suitable financial advisor,” says Kapur. 5. Creating leveraged positions Many investors suffer from creating heavy positions in the futures segment without really understanding the risks involved. Instead of creating wealth, however, these investors burn their fingers very badly in case the sentiment in the market reverses. 6. Panic selling In a bear market, investors panic and sell their shares at rock bottom prices. Trading on the bourses was suspended on May 17, 2004, May 18, 2006 and recently on January 22, 2008. Investors who had taken speculative positions lost heavily when blood was on the street. Even investors who had the capacity to hold on to their investments, lost faith in the markets and sold their investments in a hurry, thus incurring heavy losses. 7. Timing the market Many investors try to time the market. But this has not proven to be a great strategy. Historically, in fact, it has been witnessed that even great bull runs have shown bouts of panic moments. The volatility witnessed in the markets has inevitably made investors 44
  • 45. lose money despite the great bull run. Therefore, only prudent investors who put in money systematically, in the right shares and hold on to their investments patiently, have made outstanding returns. So it’s not ‘timing the market’, but ‘time in the market’ which creates wealth. Hence, it is prudent to have patience and always keep a long-term broad picture in mind. 8. Putting all eggs in one basket Another mistake which investors generally make is non-diversification of their portfolio. They generally put all their money in limited and favourite stocks which are in momentum. So, investors should diversify their portfolio across industries and size of the companies. Also, it is important to diversify across asset classes – equities, real estate, bonds, commodities, cash etc. 9. Avoiding financial planning Investors also do not apply financial planning practices in their investment approach. They should follow an asset allocation model and invest only in long-term funds in the equity markets. They should also keep rebalancing their overall portfolio from time to time to keep their exposure to equity markets at the desired ratio of the total portfolio. 10. No monitoring of portfolio We are living in a global village. Any important event happening in any part of the world has an impact on our financial markets. Hence, we need to constantly monitor our portfolio and keep affecting the desired changes in it. If one can’t review one’s portfolio due to time-constraint or lack of knowledge, they should take the help of a financial advisor. 45
  • 46. CHAPTER 5 RESEARCH METHODOLOGY The unit of observation and analysis of this survey is the household. The sampling frame in the form of a list of all households is neither readily available nor can it be easily prepared. One of the notable features of the design is that the sample has been taken from a cross section of households in and around Mumbai with the objective of enhancing the precision of the estimates. The urban city like Mumbai and Thana account for nearly 60% of the total trading in the country. Hence, Mumbai and its adjoining district Thane alongwith Pune was covered in the sampling frame. A total of 2000 households were selected in the first stage. Information on some basic characteristics of the households alongwith ownership of equity shares was collected from these households. A sub sample of 100 households was then used for detailed canvassing. Coverage:- All parts of Mumbai City, Thana District and Pune have been covered by the survey. Reference Period: The field operation for the household data collection through a pre- tested questionnaire was carried out during June-July, 2008. Definition of Investor and Non-Investor Households: The households have been classified into two categories – investor households and non-investor households. Households which directly owned equity shares at the time of the survey have been classified as investor households. Those households which did not directly own equity shares have been treated as non-investor households. 46
  • 47. Stratification and Selection of sample households: The households were also classified into the following five income categories based on the data collected on household’s income. The income categories were:-  Low, with monthly income of Rs.10,000/- and below.  Lower Middle, with monthly income between Rs.10,000-Rs.25,000/-  Middle, with monthly income between Rs.25,000/- - Rs.50,000/-  Upper Middle, with monthly income between Rs.50,001 to Rs.1,00,000/-  High, with monthly income more than Rs.1,00,000/- Households in the higher income groups could generally be expected to have larger savings available for investment, which they invest in a variety of instruments. These groups of households, which form a small proportion of the total households, account for a large portion of the savings. Unless these households are adequately represented in the sample, estimates are likely to have large sampling errors. Justification of households by the above criteria made it possible to give these groups adequate representation. Sample Size and characteristics Thus, a total of 20 sample investor/non-investor households were selected from each sample, for canvassing the household questionnaire. In all 100 households were selected and a detailed information was collected from these selected households through a pre-tested questionnaire. 47
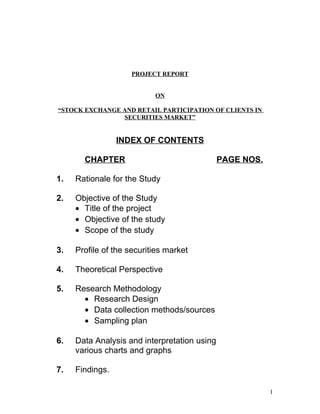
  • 48. CHAPTER 6 Data Analysis and interpretation using various charts and graphs A total of 20 sample investor/non-investor households were selected from each sample, for canvassing the household questionnaire. In all 100 households were selected and a detailed information was collected from these selected households through a pre-tested questionnaire. The distribution of sample of households by investor and non- investor households and by income class is presented in Table 1.1. Out of the total 100 sample households, 35 were investors and 65 were non-investor households. The middle, upper and high income groups constituted 27 % of the total sample in Mumbai City and 6 % of the total sample households outside Mumbai. Distribution of Sample Households Monthly Income Group Mumbai City Outside Mumbai Upto Rs.10,000 12 02 Rs.10,001- Rs.25000 38 15 Rs.25001- Rs.50000 14 06 Rs.50001- Rs.100000 09 - Rs.100001 and above 04 - It can be seen from the above, that the data collected for sample households having a monthly income of Rs.10001 to Rs.25000 was the maximum. Data collected from 38 investors/non-investors from Mumbai City and 15 investors/non- 48
  • 49. investors from outside Mumbai. Distribution of Investor Households Monthly Income Group Mumbai City Outside Mumbai Upto Rs.10,000 07 - Rs.10,001- Rs.25000 08 04 Rs.25001- Rs.50000 06 01 Rs.50001- Rs.100000 07 - Rs.100001 and above 02 - It can be seen from the above that 21% of sample households in the monthly income group of Rs,.10001- Rs.25000/- in Mumbai City are investors and 26% of sample households in the monthly income group of Rs.10001-Rs.25000 outside Mumbai are non-investors. It can also be seen that 77% of upper middle income group in Mumbai are investors and 50% of high income group are investors. 49 Distribution of sample households 0 10 20 30 40 Mumbai City Outside Mumbai Rs.100000 and above Rs.50001- Rs.100000 Rs.25001- Rs.50000 Rs.10,001- Rs.25000 Upto Rs.10,000
  • 50. Distribution of Non-Investor Households Monthly Income Group Mumbai City Outside Mumbai Upto Rs.10,000 05 02 Rs.10,001- Rs.25000 30 11 Rs.25001- Rs.50000 08 05 Rs.50001- Rs.100000 02 - Above Rs.100000 02 - The non-investor households include those who are investing their funds in Mutual funds (indirect investment in equities) and Government securities. 47 sample households in Mumbai City are non-investors and 18 sample households outside Mumbai are non-investors. Distribution of Sample Households by Income and by zones/areas Areas Below 10000 10001- 25000 25001- 50000 50001- 100000 Above 100000 South Mumbai - 1 1 1 - South-Central Mumbai 3 5 - - - Cemtral Mumbai 1 5 3 1 - North-West Mumbai 8 20 9 5 4 North-East Mumbai 1 6 1 2 - Thana (Central) 1 3 2 - - Thana (Western) 1 8 2 - - Navi Mumbai - 2 2 - - Pune - 1 - - - 50
  • 51. It can be seen that maximum data was collected from North-West Mumbai (i.e. from Bandra to Dahisar) which accounted for around 46 sample households and the income group representing Rs.10,000/- -Rs.25000/- for 20 sample households. Thana, Navi Mumbai and Pune accounted for 22 sample households. Mumbai, excluding suburbs accounted for 21 sample households. Investors are only equity holders and non-investors include not only those not investing in market but also who invest in mutual funds. Table 2.1 shows the distribution of investor and non-investor households in Mumbai & outside Mumbai. Distribution of Investors(Equity), (Equity & Mutual funds) (Only Mutual Funds and Non-Investors in Mumbai and outside Mumbai Direct investment in Equities Direct & Indirect investment in Equities and Mutual funds Non Investors Investment in Mutual funds only No investment in securities market Mumbai City 11 19 9 37 Outside Mumbai 3 3 6 12 It can be seen that mutual funds market has gained importance & 19% of sample investor households invest in equities and mutual funds & 9% invest only in mutual funds in Mumbai City and 6% of sample households outside Mumbai invest in Mutual funds only. 39 sample households in Mumbai and 12 sample households outside Mumbai invest in securities market (either directly or indirectly). 51
  • 52. Income Profile of all households As per estimates, nearly 76% of all households (129 million) fall in the low monthly income group of Rs.10000/- and below. Distribution of Households by Monthly Income Group Monthly Income Group All Households Investor Households Mumbai City Outside Mum bai Mumbai City Outside Mumb ai Upto Rs.10,000 14 1 7 - Rs.10,001- Rs.25000 38 14 7 6 Rs.25001- Rs.50000 14 6 5 2 Rs.50001- Rs.100000 9 - 7 - Above Rs.100000 4 - 2 - It can be seen from the above that 28 sample households in Mumbai are investors and 8 sample households outside Mumbai are investors. The investors outside Mumbai are in the income group between Rs.10001 to Rs.50000. In Mumbai, the maximum number of investors are in the income range of Rs.50,000/- - Rs.1,00,000 (77%). In the income group above Rs.1,00,000/-, the investors sample is 50% of the total sample households and similarly in the income range below Rs.10,000/-, the number of investors are 50% of the total sample households. In the income group of Rs.25,000- Rs.50,000/- the number of investor households are 35.71%. Similarly, in the income group of Rs.10,000/- - Rs.25,000/-, the number of investors to the total sample households are 18.42%. 52
  • 53. Distribution by Type and Occupation of Household Occupation Mumbai Outside Mumbai Equity Non- Investors Total Equity Non- Investors Total Salaried 19 43 62 4 13 17 Professional 3 1 4 - - - Businessmen 5 5 10 3 2 5 Retired 2 - 2 - - - It can be seen/observed that around 79% of data collected are from salaried individuals in Mumbai and outside Mumbai. Out of which, only 30.64% in Mumbai and 23.52% outside Mumbai are investors. Among the professionals, 7.5% are investors. The businessmen in Mumbai account for 50% of investors and 60% outside Mumbai are investors. The retired individuals show 100% investment in securities market. Distribution by number of dependent family members, average monthly savings and their average monthly investment in equities Less than 2 More than 3 Less than 4 More than 5 Av.monthly Savings Av.Invt. in Equity Av.monthly Savings Av.Invt. in Equity Av.monthly Savings Av.Invt. in Equity Upto Rs.10,000 1667 267 2000 150 2167 317 Rs.10,001- Rs.25000 9250 1300 6333 2033 6000 4800 Rs.25001- Rs.50000 15000 3750 15000 3500 16333 7633 Rs.50001- Rs.100000 -- - 40,000 22,750 36000 13,200 Above Rs.100000 80000 19250 - - - - It has been observed from the above Table that individuals/households having 53
  • 54. income ranging above Rs.1,00,000/- invest around 24-25% of their savings in equities. Similarly, it can be seen that individuals having dependents from 2-4 have an average monthly savings of Rs.40,000/- and 56.87% is invested in equities whereas individuals having dependents from 5 and more have an average monthly savings of Rs.36,000/- and invest around 36% in equities. Individuals in the monthly income range of Rs.25,000-Rs.50000/- having dependents less than 4 has a monthly savings of Rs.15,000/- and invest nearly 25% (approx.) in equities. It can be observed that individuals in the income range below Rs.10,000/- invest very scarcely in equities and are risk averse. They generally prefer fixed income securities or risk-free investments. Their percentage of investment in equities is 16% for dependents less than 2, 7.5% for dependents less than 4 and 14% for dependents more than 5. Similarly, the average savings lies between 1500-2500/- Risk Perception of all households and Investor households The selection of an instrument for investment is determined by its three attributes viz., yield of the investment, liquidity and risk perception. The mix of these attributes governs the characteristic of an instrument. When an investment choice is made in risky instruments, there is a trade-off between safety, higher returns and liquidity. It is this need of the investors to balance the risks in investment, with return and liquidity that lead them to diversify their investment portfolio depending on the level of income of the households. The yield of the instrument viz. the returns have a major role to play in attracting investments in securities. The opinion on returns provided by investment in securities market was sought for and the distribution are as under:- 54
  • 55. Table 4.1 Distribution of opinion on returns provided by households in securities Nature of Returns Sample Households Low Returns 08 Normal Returns 47 High Returns 29 Very High Returns - Indifferent 16 It has been observed that 47% of the sample households believe that investment in securities market bring in normal returns. They consider risk factors involved, the volatility of securities market, the ups and downs in securities trading. So, there is a possibility of converting these households into investors in equity similar to their investment in debt market. Out of the total sample households, 29% believe that securities market provide high returns. There is a trade-off between risk and returns and liquidity factor is also considered. Higher the risk, higher the returns and vice-versa. Aggressive households are the ones who invest in the securities market. These households are aware of the stock market movements and prefer to invest in them. Out of the total sample households, 16% do not know the nature of returns. They are either less educated or are unaware of the stock movements. These are the households who needs to be educated and trained and make them aware of the pros and cons of securities market. These are the households who have limited participation and invest either in risk-free instruments or not invest at all. 55
  • 56. 8% of the households consider securities market as providing low returns. They are conservatives and totally rely on risk free investment. They are the households who consider investment in securities as highly volatile and view negatively towards the securities market. Distribution of households opinion on primary and secondary market Investment Option Primary Market Secondary Market Avoid 14 20 Invest 36 32 Definitely Invest 06 03 Analyze 35 33 Indifferent 09 12 It can be observed that only 6% and 3% definitely invest in securities market which is considered as bare minimum. They are the ones who have complete knowledge of stock exchange, trading, risk factors, returns available. About 36% of households would invest in the primary securities market if provided an option and 32% of households would like to invest in secondary market. So, these are the households who are required to be given proper guidance, training for enabling them to invest in securities market. About 35% opts for analysis of the company, industry and the scrip before going for investment in primary securities market and about 33% opts for analysis of the shares traded, the growth of the company, factors relating to the industry, scrip and returns provided. They are the ones who do not follow the advice given by brokers, 56
  • 57. market rumours but study the factors such as risk, returns, safety and liquidity available from the securities market.. About 14% and 20% do not wish to go for investment in primary and secondary market respectively. They are either non-investors or may be investing in risk- free instruments. These are the ones who has to be trained, guided and make them aware of the returns available in the securities market. The brokers may be in a better position to provide free advice to such households/individuals. About 9% are indifferent and do not have any knowledge of the primary market. Similarly, 12% of households are not having any knowledge of secondary market. Awareness programmes such as time to time advice/guidance on equity and derivatives instruments and updation of the same to be provided. Illiterate/less educated individuals may be trained in the stock exchange and shown the gains available on different alternative instruments in the short-term and long-term. Experience with Brokers 20% of sample households have not contacted any broker. Either they are non-investors or they carry on trading through the internet. 7% of sample households have claimed that their experience with brokers are excellent, 10% of sample households have claimed to be very good, 24% of sample households have claimed to be good, 28% of sample households have claimed to be on average and 7% of sample households have claimed to be bad. 7% of sample households who faced bad experience with brokers either changed their broker or did trading independently through internet and some avoided investing in securities market. 57
  • 58. 54% of sample investor households did not change their broker due to good services provided by them, trust, updated information provided to them and 23% changed their broker either due to bad experience or due to change of residence. Opinion on how difficult it was to close an account and open a fresh account with new broker/sub broker was sought for. 2% of sample investor households found it extremely difficult to open a new broker account. 9% found it very difficult and 19% found it somewhat difficult to open a new broker account. 9% of sample investor households consider it as seamless transition. Response of households on the improvement of Service rendered by Brokers 1. 17% of households felt that brokers should give daily up-dates on the new/existing scrip’s traded in the stock market. 2. 5% of households felt that the brokers should give proper explanation and educate the common person and give proper guidance on the stock market activities. 3. 4% believed that the brokers should be given proper training in giving service to clients. 4. 2% of households believe that inorder to improve the service, brokers should possess perfect knowledge of shares & proper updates given from time to time. 5. 2% of households believe that brokers should give maximum benefit/returns to clients. 6. 2% of households say that brokers should have good co-ordination and understanding. 7. Brokers should not be money-minded and should be helpful and give proper guidance. 58
  • 59. 8. High returns to brokers and investors should be the approach. 9. Brokers should possess sound knowledge of their work and approach should be good. 10. Always good dealing with customers about investment plans. 11. 100% feedback to be given from time to time to the customers. 12. Sub-brokers should be abolished, securities transaction tax to be reduced. 13. Brokers should be courteous, think of life and not always ‘Money’. 14. There should be improvement in technology. 15. Advice given by brokers should be based on facts and rumours not to be relied upon. 16. Honest management in shares business. 17. Brokers should provide personalized service, though at a cost. 18. Brokers should be more professional in approach. 19. Rules and regulations supported by legal guarantee to ensure safety of investors investments. 20. Right information to be provided by brokers so that clients don’t get carried away. 21. More security to be given to investors and Govt. should monitor to avoid fraud/fraudulent deals by brokers. 22. Should try and give proper attention to their clients and try not to be over burdened and not take excess clients. 23. Quick response to the investor and how to make more money is very important. 24. Give correct tips about stocks everyday. 59
  • 60. 25. Knowledge, transparency and mutual benefit. Ranking of Factors which induce the households to invest in securities market The respondents were surveyed on which factors influence the households to invest in securities market. The various factors which were to be ranked by the households according to their importance. a. Macro-economic situation. b. Advise from friends, relatives etc. c. Advise from broker/sub-broker d. Analysis of the industry you are investing in e. Analysis of the company you are investing in f. Market information (rumours) g. Everybody is making money. The respondents had ranked the respective factors according to the importance placed by the households. FACTORS INFLUENCING THE INVESTMENT DECISION RANKINGS Macro- Economic Advise From Friend s Advise From Brokers Analysis Of Industry Analysis Of Company Market Info. (Rumour) Everybody Is making Money 1 17 33 16 08 14 02 12 2 13 17 13 35 15 07 02 3 11 06 18 25 30 03 07 4 18 15 14 18 21 12 03 5 17 18 23 09 12 18 05 60
  • 61. 6 12 06 10 04 07 36 25 7 14 06 07 02 02 23 47 It has been observed that the respondents have given mixed response to the questions asked on the importance given by them to factors which influence the securities market. The respondents placed maximum importance which guides their investment needs to friends/relatives etc. which is ranked 1st . So, 33% of the household would go in for the advise given by friends/relatives and change their investment pattern. Most of the household gave 2nd ranking to analysis of the industry in which the shares are traded before investment in shares which is 35%. Most of the household gave 3rd ranking to analysis of the company in which the shares are traded before investment in shares which is 30%. 18 households gave 4th ranking to macro-economic situation. 2% households gave 5th ranking to advise from brokers/sub-brokers. 36 households gave 6th ranking to market information (rumours) and 47 households gave 7th ranking to ‘Everybody is making money’. OPINION ON MEASURES TO INCREASE THE CONFIDENCE OF INVESTORS IN THE SECURITIES MARKET 1. 8% of sample households stated that updated & timely information of market and securities increase the confidence of investors in the securities market. 2. 6% gave importance to education on stock market and securities trading. 3. 6% gave importance to publicity and advertisement. 61
  • 62. 4. 5% of sample households state that awareness among society is necessary for gaining the confidence of investors. 5. 4% gave importance to stability of returns – timely dividend and capital appreciation. 6. 4% gave importance to economic growth and stable low inflation. 7. 4% of sample households state that measures should be employed to provide guaranteed returns – Money invested to be paid back with profits. Retail investors’ funds to be protected. 8. 3% stated that better information dissemination and disclosures by companies/market through reliable channels. 9. 3% stated that regular up-dates must be provided on new channel/media. 10. 3% stated that necessary training should be provided to investors. 11. 2% stated that clients rely on the trust and faith of brokers and on the company in which the money is invested. 12. 2% stated that detailed history of the company & its future growth plans should be made available. 13. 2% stressed on improvement of macro-economic situation. 14. 2% went for good service by brokers. 15. 2% stressed on good study of every stock. 16. One should avoid speculation and try to invest in strong & fundamentally strong company having a good track record. There should be honest relation between the broker and investor. 17. Stable Government. 62
  • 63. 18. Transparency between investor and company, less sub-broker. 19. Make it simple and safe. 20. Effective way of dealing with complaints of retail investors. 21. Generally people are risk-averse. So, inorder to safeguard their returns, education should be provided. 22. Framing of rules to avoid scams. 23. Counselling of friends/relatives of non-investors. 24. To reduce the factors leading to risk in securities market. 25. Removing securities transaction tax. 26. Stable broker firm. 27. More monetary returns from market. 63
  • 64. CHAPTER 7 FINDINGS OBSERVATIONS  Urban population has the maximum number of investors/potential investors compared to rural population.  The households having an monthly income of more than Rs.50,000/- and above have a tendency to save and invest in securities market depending upon their liquidity and return on investment. Households Monthly Income less than Rs.50,000/- marginally invest in the market, their volumes being low and rely on safety, return on investment and risk factors. In Mumbai, the maximum number of investors are in the income range of Rs.50,000/- - Rs.1,00,000 (77%). the income range between Rs.10,000-Rs.25,000/- are not investing in the market and are risk-averse and investing in government securities/fixed income securities. However, the situation is different with sample investors outside Mumbai where 42% are investors out of the total sample households. There is maximum investors awareness in the income range of Rs.50,000-Rs.1,00,000/-. This is because, they have availed other sources of fixed income securities and investing the excess funds in the capital market.  Around 49% among the sample non-investors households do not invest in market related securities despite the growth in the market securities (either directly or 64
  • 65. indirectly). Low per capita income, apprehension of loss of capital and return on capital, and economic insecurity which are all inter-related factors, significantly influence the investment attitude of the households. The lack of awareness about the securities market and the absence of a dependable infrastructure and distribution network which could have facilitated the households’ access to the market, coupled with their aversion to risk, appear to have often inhibited the non- investor households from investing in the securities market. They have instead preferred to rely on traditional institutions such as banks and post offices with which they have had long term relationship.  It has been observed that 47% of the sample households believe that investment in securities market bring in normal returns. They consider risk factors involved, the volatility of securities market, the ups and downs in securities trading. So, there is a possibility of converting these households into investors in equity similar to their investment in debt market.  Out of the total sample households, 16% do not know the nature of returns. They are either less educated or are unaware of the stock movements. These are the households who needs to be educated and trained and make them aware of the pros and cons of securities market. These are the households who have limited participation and invest either in risk-free instruments or not invest at all.  About 36% of households would invest in the primary securities market if provided an option and 32% of households would like to invest in secondary market. So, these are the households who are required to be given proper guidance, training for enabling them to invest in securities market. 65
  • 66.  About 35% opts for analysis of the company, industry and the scrip before going for investment in primary securities market and about 33% opts for analysis of the shares traded, the growth of the company, factors relating to the industry, scrip and returns provided. They are the ones who do not follow the advice given by brokers, market rumours but study the factors such as risk, returns, safety and liquidity available from the securities market..  About 14% and 20% do not wish to go for investment in primary and secondary market respectively. They are either non-investors or may be investing in risk- free instruments.  About 9% are indifferent and do not have any knowledge of the primary market. Similarly, 12% of households are not having any knowledge of secondary market.  54% of sample investor households did not change their broker due to good services provided by them, trust, updated information provided to them and 23% changed their broker either due to bad experience or due to change of residence.  It has been observed that the respondents have given mixed response to the questions asked on the importance given by them to factors which influence the securities market.  33% of the household would go in for the advise given by friends/relatives and change their investment pattern. Most of the household gave 2nd ranking to analysis of the industry in which the shares are traded before investment in shares which is 35%. Most of the household gave 3rd ranking to analysis of the company in which the shares are traded before investment in shares which is 30%. After going through the security market set-up, the extent of participation of the household in the securities market, the behaviour, interests, attitudes, investor 66
  • 67. preferences, the analysis of data collected, the findings, the opinion of the households about the services of brokers and the measures to improve the securities market, the following recommendations are made :- 1. A part of savings of the non-investor households of the middle and high income groups could be channelised into the market through appropriate policy initiatives: The non- investor households who have surplus funds but are unwilling to invest, represent a pool of potential investors. Their confidence in the market needs to be enhanced and sustained if this pool of investors are to be induced to invest in the securities market. Special efforts would have to be made for creating greater investor awareness through investor education and developing the infrastructure which allows for easy access to the market. Possibly, the wider spread of trading terminals of the stock exchanges across the country, internet trading and availability of electronic fund transfer facility in metropolitan towns and cities would help encourage this process. Given that investor and non-investor households do invest in fixed income securities which provide them a certainty of return, there is a scope for tapping the savings of this class through appropriate type of debentures with features which will cater to the needs of this class and meet their preference for safety. This would be of special relevance for funding the development of infrastructure services, which primarily requires long term debt capital. 2. Appropriate policy initiatives such as development of active retail secondary market in debt, could also help in attracting the attract savings in bonds and debentures. 3. Like LIC, agents may be appointed for marketing of securities. Publicity and advertisement starting from door to door marketing to television media via exclusive news channels for creating awareness among the society which could reach the common 67
  • 68. man. Better information dissemination and disclosures by companies/market through reliable channels. 4. Brokers should provide updated & timely information of market and securities which increase the confidence of investors in the securities market. Detailed history of the company & its future growth plans should be made available. One should avoid speculation and try to invest in strong & fundamentally strong company having a good track record. There should be honest relation between the broker and investor. Broker’s firm should be stable. 5. Since it was observed that non-investors generally obtain advise from their friends/relatives, counselling of friends/relatives of non-investors may be done. 6. The investors/non-investors should be thoroughly educated by conducting training seminars, lectures and making them aware of the stock exchange and securities trading system. 7. Encouraging retail investors with free entry and exit options. The scope of internet trading should be widened so that rural investors could easily tap the market with less efforts. 8. The settlement mechanism should be further reduced to transaction settlement done immediately. 9. There should be stability in securities market and the factors which influence the securities market should be properly analysed and controlled, volatility should be reduced and risk factors should be taken care of. This would result in stability of returns, timely dividend and capital appreciation. 68
  • 69. 10. Steps to be taken to enhance economic growth and to bring down the level of inflation and control the factors leading to inflation. 11.The regulating authority should keep a check on the market mechanism and bring about a stable guaranteed returns to the retail investors. The investment should be protected. Investors, then would shift their focus from fixed income securities to capital market securities. 12. The overall macro-economic situation should be studied and measures taken for less influence of such factors on the securities market. 13. Simple and effective way of dealing with complaints of retail investors. 14. Securities transaction cost to be further reduced. 69