SlideShare uma empresa Scribd logo
1 de 6
Sarasota MLSSM Statistics - November 2012
                                                                                                                                         Single Family
                                                                                           Unit Sales
                                                                                                                                         Condo
       700
       600
       500
       400
       300
       200
       100
         0
                  Nov‐11         Dec‐11         Jan‐12     Feb‐12       Mar‐12      Apr‐12      May‐12     Jun‐12        Jul‐12     Aug‐12       Sep‐12     Oct‐12       Nov‐12


                                                                                                                          Single Family
                                                                          Median Sale Price
                                                                                                                          Condo
      $250,000

      $200,000

      $150,000

      $100,000

       $50,000

                 $0
                      Nov‐11           Dec‐11      Jan‐12        Feb‐12   Mar‐12       Apr‐12    May‐12      Jun‐12        Jul‐12     Aug‐12      Sep‐12     Oct‐12      Nov‐12


                                                                                  Single Family 
                                                             Average         Median         Median Last       Months         Pending                          # New        # Off 
                      #Active          #Sold      %Sold                                                                                      %Pending 
                                                              DOM           Sale Prices     12 Months        Inventory       Reported                        Listings     Market 
         This 
        Month 
                      2,266            556        24.5           158      $174,450           $172,500             4.1             653            28.8          727         126 
         This 
        Month         3,013            435        14.3           190      $162,000           $156,074             6.9             552            18.2          765         175 
       Last Year 
         Last 
        Month 
                      2,277            516        22.7           158      $176,000           $171,000             4.4             714            31.4          826         114 
         YTD                ‐          5,951        ‐            166      $174,000               ‐                 ‐              7,972            ‐          7,351          ‐ 
                                    
                                                         Single Family – Sale Price Vs. List Price % Rates
                           Jan           Feb             Mar        Apr          May          Jun           Jul          Aug         Sept         Oct         Nov          Dec 
        2011               94.5          94.1            94.7       94.1         94.2         94.3         94.1          94.5        95.2         95.1        95.3         94.8 
        2012               95.4          94.2            94.6       94.7         95.1         95.2         94.2          95.3        95.2         95.4        95.6          ‐ 
                       
      Statistics were compiled on properties listed in the MLS by members of the Sarasota Association of Realtors® as of Dec. 10th, 2012,
      including some listings in Manatee, Englewood, Venice, and other areas. Single-family statistics are tabulated using property styles of
      single-family and villa. Condo statistics include condo, co-op, and townhouse.

                                                                                                                        Source: Sarasota Association of Realtors®
16	                       JANUARY 2013	                                             Sarasota Realtor® Magazine	                                           www.sarasotarealtors.com
Sarasota MLSSM Statistics - November 2012
                                                                                                                    Single Family
                                                                            Inventory                               Condo
3,500
3,000
2,500
2,000
1,500
1,000
  500
       0
            Nov‐11 Dec‐11              Jan‐12       Feb‐12 Mar‐12 Apr‐12 May‐12 Jun‐12                          Jul‐12     Aug‐12    Sep‐12     Oct‐12     Nov‐12


                                                                                                                     Single Family
                                                                         Pending Sales                               Condo
900
800
700
600
500
400
300
200
100
   0
           Nov‐11         Dec‐11     Jan‐12        Feb‐12   Mar‐12       Apr‐12    May‐12     Jun‐12        Jul‐12        Aug‐12     Sep‐12     Oct‐12    Nov‐12


                                                                                   Condo 
                                                       Average      Median Sale    Median Last      Months of            Pending                     # New       # Off 
                  #Active     #Sold        %Sold                                                                                      %Pending 
                                                        DOM           Prices       12 Months        Inventory            Reported                   Listings    Market 
   This 
  Month 
                  1,277        208         16.3         188         $160,000        $174,700              6.1              252          19.7         326         117 
   This 
  Month           1,641        167         10.2         181         $127,000        $158,000              9.8              230          14.0         325         241 
 Last Year 
   Last 
  Month 
                  1,240        193         15.6         191         $160,000        $170,000              6.4              240          19.4         294         107 
   YTD               ‐        2,370           ‐         192         $175,000             ‐                 ‐              2,990          ‐          2,993           ‐ 
                      
                                                     Condo – Sale Price Vs. List Price % Rates
                   Jan             Feb         Mar          Apr         May         Jun         Jul             Aug          Sept       Oct        Nov          Dec 
   2011            93.4            91.2        92.2         93.4        94.5        94.2       92.5             93.1         92.8       93.2       93.6         92.7 
   2012            93.1            93.5        94.2         94.3        93.8        93.8       94.6             94.1         94.2       94.4       95.4          ‐ 
               
Median sales price is the middle value, where half of the homes sold for more, and half sold for less. Listings sold were closed
transactions during the month. Pending sales are sales where an offer has been accepted during the month, but the sale has not yet
closed. Even though some pending sales never close, pending sales are an indicator of current buyer activity. DOM indicates the average
number of days that sold properties were on the market before a contract was executed.
                                                                                                                 Sarasota Association of Realtors® MLS
www.sarasotarealtors.com	                                                   Sarasota Realtor® Magazine	                                       JANUARY 2013	               17
The Xtra Pages - Digital Version Only
                                                                                                       Single Family
                                               Months of Inventory                                     Condo
12

10

 8

 6

 4

 2

 0
      Nov‐11    Dec‐11    Jan‐12    Feb‐12    Mar‐12    Apr‐12 May‐12       Jun‐12    Jul‐12     Aug‐12 Sep‐12         Oct‐12     Nov‐12
                                                                                               Single Family
                                                       Days on Market
                                                                                               Condo
250

200

150

100

50

 0
       Nov‐11    Dec‐11    Jan‐12    Feb‐12    Mar‐12    Apr‐12    May‐12    Jun‐12     Jul‐12     Aug‐12     Sep‐12     Oct‐12     Nov‐12
                                                                                                           Single Family
                                                         Sales Volume                                      Condo
$200,000,000
$180,000,000
$160,000,000
$140,000,000
$120,000,000
$100,000,000
 $80,000,000
 $60,000,000
 $40,000,000
 $20,000,000
          $0
                 Nov‐11 Dec‐11 Jan‐12 Feb‐12 Mar‐12 Apr‐12 May‐12 Jun‐12                       Jul‐12 Aug‐12 Sep‐12 Oct‐12 Nov‐12

                                                       New Listings                     Single Family
                                                                                        Condo
900
800
700
600
500
400
300                                                                                   Sarasota Association of Realtors® MLS
200
100
  0
      Nov‐11    Dec‐11    Jan‐12    Feb‐12    Mar‐12    Apr‐12    May‐12    Jun‐12    Jul‐12     Aug‐12     Sep‐12     Oct‐12     Nov‐12
Third Quarter 2012 Report
                                      Single Family Sales ‐ By Quarter                                          REO         Short         Market
1400
1200
1000
 800
 600
 400
 200
   0
            2010‐Q1    2010‐Q2*      2010‐Q3      2010‐Q4      2011‐Q1      2011‐Q2     2011‐Q3     2011‐Q4      2012‐Q1      2012‐Q2       2012‐Q3
                 * Homebuyer Tax Credit In Effect

                                      Condo Sales ‐ By Quarter                                                  REO          Short         Market
700
600
500
400
300
200
100
  0
        2010‐Q1       2010‐Q2*       2010‐Q3      2010‐Q4      2011‐Q1      2011‐Q2     2011‐Q3     2011‐Q4      2012‐Q1      2012‐Q2       2012‐Q3
                      * Homebuyer Tax Credit In Effect

                         Single Family Median Sale Price                                             REO         Short          Market
 $300,000

 $250,000

 $200,000

 $150,000

 $100,000

  $50,000

       $0
               2010‐Q1     2010‐Q2      2010‐Q3      2010‐Q4      2011‐Q1     2011‐Q2     2011‐Q3     2011‐Q4     2012‐Q1       2012‐Q2      2012‐Q3


                                  Condo Median Sale Price                                            REO         Short         Market
 $300,000

 $250,000

 $200,000                                                                                   Source: Sarasota Association of Realtors®

 $150,000

 $100,000

  $50,000

       $0
               2010‐Q1     2010‐Q2      2010‐Q3      2010‐Q4     2011‐Q1      2011‐Q2    2011‐Q3     2011‐Q4      2012‐Q1      2012‐Q2      2012‐Q3
Single Family
                                      REO Sales ‐ By Quarter                              Condo

600

500

400

300

200

100

  0
          2010‐Q1    2010‐Q2*    2010‐Q3    2010‐Q4    2011‐Q1    2011‐Q2    2011‐Q3    2011‐Q4    2012‐Q1    2012‐Q2    2012‐Q3

             * Homebuyer Tax Credit In Effect

                                                                                          Single Family
                                  Short Sales ‐ By Quarter
                                                                                          Condo
400
350
300
250
200
150
100
 50
  0
          2010‐Q1 2010‐Q2* 2010‐Q3          2010‐Q4    2011‐Q1    2011‐Q2    2011‐Q3    2011‐Q4    2012‐Q1    2012‐Q2    2012‐Q3
                    * Homebuyer Tax Credit In Effect
                                                                                           Single Family
                                Market Sales ‐ By Quarter                                  Condo

1400
1200
1000
 800
 600
 400
 200
      0
           2010‐Q1 2010‐Q2* 2010‐Q3          2010‐Q4    2011‐Q1    2011‐Q2    2011‐Q3    2011‐Q4    2012‐Q1    2012‐Q2    2012‐Q3
                * Homebuyer Tax Credit In Effect


                                                                                  Source: Sarasota Association of Realtors®
Annual Sales ‐ 2000 to 2011
                                                                                             Single Family
                                                                                             Single Family             Condo              Total
                                                          11267
                                                                      10562
                                              9697


                               8167                                                                                                                 8224
                                                           7,596                                                                         7603
                  7036                                                 6,841
     6533                                                                                                                   6739
                                              6,504
                                              6 504                                    6358
                                                                                                    6042       5820                                 5,938
                               5,603                                                                                                    5,466
                                                                                                                            5,183
                  4,940
                                                                                                               4,626
     4,349                                                                            4,353
                                                                       3,721
                                                                       3 721                      3,922
                                                                                                   ,
                                                           3 671
                                                           3,671
                                              3,193
                               2,564
     2,184        2,096                                                                           2,120                                 2,137       2,286
                                                                                      2,005
                                                                                                                            1,556
                                                                                                               1,194


     2000         2001         2002           2003         2004        2005            2006         2007       2008         2009         2010       2011


Annual Median Sale Price ‐ 2000 to 2011 
             Single Family           Condo                                 $351,000
                                                                                        $342,000 $336,250
                                                                                                                $320,000

                                                           $272,500
                                                                                         $301,225
                                                                             $305,000
                                                $226,000
                                                                $225,000                            $303,000
                                 $191,000                                                                                    $210,000
                   $172,500
                                                    $191,000                                                   $230,000                     $163,000
$142,000                                                                                                                                           $156,800
                                $173,000
                   $145,000                                                                                               $160,000
      $132,300                                                                                                                          $163,000   $155,925


   2000         2001          2002           2003        2004         2005            2006        2007         2008         2009        2010        2011

Mais conteúdo relacionado

Mais procurados

Sales climb in February 2012; pending sales rise to 11-month high
Sales climb in February 2012; pending sales rise to 11-month highSales climb in February 2012; pending sales rise to 11-month high
Sales climb in February 2012; pending sales rise to 11-month highSarasota Real Estate
 
Market Watch October 2012
Market Watch October 2012Market Watch October 2012
Market Watch October 2012Gary Smith
 
Naea 12-12 (2)
Naea 12-12 (2)Naea 12-12 (2)
Naea 12-12 (2)Cate8364
 
House price monitor.12.2011
House price monitor.12.2011House price monitor.12.2011
House price monitor.12.2011REALTORS
 
Austin Real Estate Update January '08
Austin Real Estate Update January '08Austin Real Estate Update January '08
Austin Real Estate Update January '08Dee Patience
 
Austin Market Update January 2008
Austin Market Update January 2008Austin Market Update January 2008
Austin Market Update January 2008Dee Patience
 
Maricopa County AZ Market Data Report - 2013 January - Coldwell Banker Reside...
Maricopa County AZ Market Data Report - 2013 January - Coldwell Banker Reside...Maricopa County AZ Market Data Report - 2013 January - Coldwell Banker Reside...
Maricopa County AZ Market Data Report - 2013 January - Coldwell Banker Reside...Marc Krebs
 
Boulder County December 2012 statistics
Boulder County December 2012 statisticsBoulder County December 2012 statistics
Boulder County December 2012 statisticsNeil Kearney
 
Boulder County Real Estate Statistics October 2012
Boulder County Real Estate Statistics October 2012Boulder County Real Estate Statistics October 2012
Boulder County Real Estate Statistics October 2012Neil Kearney
 
Risk Management Association\'s CRE Panel
Risk Management Association\'s CRE PanelRisk Management Association\'s CRE Panel
Risk Management Association\'s CRE Panelcesimpsoniii
 
Phoenix Market report 1112
Phoenix Market report 1112Phoenix Market report 1112
Phoenix Market report 1112Len Nevin
 
Nfib ny minimum wage study - 2012
Nfib ny minimum wage study - 2012Nfib ny minimum wage study - 2012
Nfib ny minimum wage study - 2012Unshackle Upstate
 
Woodlands June/July 2012 Market Reports
Woodlands June/July 2012 Market ReportsWoodlands June/July 2012 Market Reports
Woodlands June/July 2012 Market ReportsKatie Emery-Cooper
 
Home Sales Real Estate Report for The Woodlands TX / June-July 2012 / Better ...
Home Sales Real Estate Report for The Woodlands TX / June-July 2012 / Better ...Home Sales Real Estate Report for The Woodlands TX / June-July 2012 / Better ...
Home Sales Real Estate Report for The Woodlands TX / June-July 2012 / Better ...Ken Brand
 

Mais procurados (19)

Sales climb in February 2012; pending sales rise to 11-month high
Sales climb in February 2012; pending sales rise to 11-month highSales climb in February 2012; pending sales rise to 11-month high
Sales climb in February 2012; pending sales rise to 11-month high
 
Sarasota Market Stats Feb 2011
Sarasota Market Stats Feb 2011Sarasota Market Stats Feb 2011
Sarasota Market Stats Feb 2011
 
May2011 stats
May2011 statsMay2011 stats
May2011 stats
 
July2010 stats
July2010 statsJuly2010 stats
July2010 stats
 
Market Watch October 2012
Market Watch October 2012Market Watch October 2012
Market Watch October 2012
 
Naea 12-12 (2)
Naea 12-12 (2)Naea 12-12 (2)
Naea 12-12 (2)
 
Lake Elsinore EWDC 2-21-13
Lake Elsinore EWDC 2-21-13Lake Elsinore EWDC 2-21-13
Lake Elsinore EWDC 2-21-13
 
House price monitor.12.2011
House price monitor.12.2011House price monitor.12.2011
House price monitor.12.2011
 
Austin Real Estate Update January '08
Austin Real Estate Update January '08Austin Real Estate Update January '08
Austin Real Estate Update January '08
 
Austin Market Update January 2008
Austin Market Update January 2008Austin Market Update January 2008
Austin Market Update January 2008
 
Maricopa County AZ Market Data Report - 2013 January - Coldwell Banker Reside...
Maricopa County AZ Market Data Report - 2013 January - Coldwell Banker Reside...Maricopa County AZ Market Data Report - 2013 January - Coldwell Banker Reside...
Maricopa County AZ Market Data Report - 2013 January - Coldwell Banker Reside...
 
Boulder County December 2012 statistics
Boulder County December 2012 statisticsBoulder County December 2012 statistics
Boulder County December 2012 statistics
 
Boulder County Real Estate Statistics October 2012
Boulder County Real Estate Statistics October 2012Boulder County Real Estate Statistics October 2012
Boulder County Real Estate Statistics October 2012
 
Risk Management Association\'s CRE Panel
Risk Management Association\'s CRE PanelRisk Management Association\'s CRE Panel
Risk Management Association\'s CRE Panel
 
Phoenix Market report 1112
Phoenix Market report 1112Phoenix Market report 1112
Phoenix Market report 1112
 
8 realtor report
8 realtor report8 realtor report
8 realtor report
 
Nfib ny minimum wage study - 2012
Nfib ny minimum wage study - 2012Nfib ny minimum wage study - 2012
Nfib ny minimum wage study - 2012
 
Woodlands June/July 2012 Market Reports
Woodlands June/July 2012 Market ReportsWoodlands June/July 2012 Market Reports
Woodlands June/July 2012 Market Reports
 
Home Sales Real Estate Report for The Woodlands TX / June-July 2012 / Better ...
Home Sales Real Estate Report for The Woodlands TX / June-July 2012 / Better ...Home Sales Real Estate Report for The Woodlands TX / June-July 2012 / Better ...
Home Sales Real Estate Report for The Woodlands TX / June-July 2012 / Better ...
 

Destaque (10)

SAR Monthly Statistics Released for June 2011
SAR Monthly Statistics Released for June 2011SAR Monthly Statistics Released for June 2011
SAR Monthly Statistics Released for June 2011
 
Srmag june2011 stats
Srmag june2011 statsSrmag june2011 stats
Srmag june2011 stats
 
Srmag june2011 stats
Srmag june2011 statsSrmag june2011 stats
Srmag june2011 stats
 
May2011 stats 3 to8
May2011 stats 3 to8May2011 stats 3 to8
May2011 stats 3 to8
 
Corporate presentation
Corporate presentationCorporate presentation
Corporate presentation
 
Sarasota Market Statistics July 2013
Sarasota Market Statistics July 2013Sarasota Market Statistics July 2013
Sarasota Market Statistics July 2013
 
e2e Projects
e2e Projectse2e Projects
e2e Projects
 
e2e Projects
e2e Projectse2e Projects
e2e Projects
 
SARStats-July2011
SARStats-July2011SARStats-July2011
SARStats-July2011
 
Buying a home in sarasota florida
Buying a home in sarasota floridaBuying a home in sarasota florida
Buying a home in sarasota florida
 

Semelhante a Sarasota Market Stats December

Northeast Georgia September 2012 Market Trend RE/port
Northeast Georgia September 2012 Market Trend RE/portNortheast Georgia September 2012 Market Trend RE/port
Northeast Georgia September 2012 Market Trend RE/portRE/MAX Regional Services
 
Chattanooga September 2012 Market Trend RE/port
Chattanooga September 2012 Market Trend RE/portChattanooga September 2012 Market Trend RE/port
Chattanooga September 2012 Market Trend RE/portRE/MAX Regional Services
 
Metro Atlanta September 2012 Market Trend RE/port
Metro Atlanta September 2012 Market Trend RE/portMetro Atlanta September 2012 Market Trend RE/port
Metro Atlanta September 2012 Market Trend RE/portRE/MAX Regional Services
 
Northern KY September 2012 Market Trend RE/port
Northern KY September 2012 Market Trend RE/portNorthern KY September 2012 Market Trend RE/port
Northern KY September 2012 Market Trend RE/portRE/MAX Regional Services
 
Augusta September 2012 Market Trend RE/port
Augusta September 2012 Market Trend RE/portAugusta September 2012 Market Trend RE/port
Augusta September 2012 Market Trend RE/portRE/MAX Regional Services
 
Lexington September 2012 Market Trend RE/port
Lexington September 2012 Market Trend RE/portLexington September 2012 Market Trend RE/port
Lexington September 2012 Market Trend RE/portRE/MAX Regional Services
 
Savannah September 2012 Market Trend RE/port
Savannah September 2012 Market Trend RE/portSavannah September 2012 Market Trend RE/port
Savannah September 2012 Market Trend RE/portRE/MAX Regional Services
 
Louisville September 2012 Market Trend RE/port
Louisville September 2012 Market Trend RE/portLouisville September 2012 Market Trend RE/port
Louisville September 2012 Market Trend RE/portRE/MAX Regional Services
 
Detroit September 2012 Market Trend RE/port
Detroit September 2012 Market Trend RE/portDetroit September 2012 Market Trend RE/port
Detroit September 2012 Market Trend RE/portRE/MAX Regional Services
 
Cincinnati October 2012 Market Trend RE/port
Cincinnati October 2012 Market Trend RE/portCincinnati October 2012 Market Trend RE/port
Cincinnati October 2012 Market Trend RE/portRE/MAX Regional Services
 

Semelhante a Sarasota Market Stats December (20)

Sarasota Market stats for March
Sarasota Market stats for MarchSarasota Market stats for March
Sarasota Market stats for March
 
Sr march2012 stats12041822817_2_3
Sr march2012 stats12041822817_2_3Sr march2012 stats12041822817_2_3
Sr march2012 stats12041822817_2_3
 
Sar stats july2011
Sar stats july2011Sar stats july2011
Sar stats july2011
 
Dec2010stats
Dec2010statsDec2010stats
Dec2010stats
 
Northeast Georgia September 2012 Market Trend RE/port
Northeast Georgia September 2012 Market Trend RE/portNortheast Georgia September 2012 Market Trend RE/port
Northeast Georgia September 2012 Market Trend RE/port
 
Chattanooga September 2012 Market Trend RE/port
Chattanooga September 2012 Market Trend RE/portChattanooga September 2012 Market Trend RE/port
Chattanooga September 2012 Market Trend RE/port
 
Metro Atlanta September 2012 Market Trend RE/port
Metro Atlanta September 2012 Market Trend RE/portMetro Atlanta September 2012 Market Trend RE/port
Metro Atlanta September 2012 Market Trend RE/port
 
Northern KY September 2012 Market Trend RE/port
Northern KY September 2012 Market Trend RE/portNorthern KY September 2012 Market Trend RE/port
Northern KY September 2012 Market Trend RE/port
 
Augusta September 2012 Market Trend RE/port
Augusta September 2012 Market Trend RE/portAugusta September 2012 Market Trend RE/port
Augusta September 2012 Market Trend RE/port
 
Memphis October 2012 Market Trend RE/port
Memphis October 2012 Market Trend RE/portMemphis October 2012 Market Trend RE/port
Memphis October 2012 Market Trend RE/port
 
Lexington September 2012 Market Trend RE/port
Lexington September 2012 Market Trend RE/portLexington September 2012 Market Trend RE/port
Lexington September 2012 Market Trend RE/port
 
August2010 stats
August2010 statsAugust2010 stats
August2010 stats
 
Savannah September 2012 Market Trend RE/port
Savannah September 2012 Market Trend RE/portSavannah September 2012 Market Trend RE/port
Savannah September 2012 Market Trend RE/port
 
Louisville September 2012 Market Trend RE/port
Louisville September 2012 Market Trend RE/portLouisville September 2012 Market Trend RE/port
Louisville September 2012 Market Trend RE/port
 
Sarasota Market Stats May
Sarasota Market Stats MaySarasota Market Stats May
Sarasota Market Stats May
 
Columbus Market Trends January 2013
Columbus Market Trends January 2013Columbus Market Trends January 2013
Columbus Market Trends January 2013
 
Sar statsemail13052285100.2 7
Sar statsemail13052285100.2 7Sar statsemail13052285100.2 7
Sar statsemail13052285100.2 7
 
Detroit September 2012 Market Trend RE/port
Detroit September 2012 Market Trend RE/portDetroit September 2012 Market Trend RE/port
Detroit September 2012 Market Trend RE/port
 
Sr mag june2013stats.3-8
Sr mag june2013stats.3-8Sr mag june2013stats.3-8
Sr mag june2013stats.3-8
 
Cincinnati October 2012 Market Trend RE/port
Cincinnati October 2012 Market Trend RE/portCincinnati October 2012 Market Trend RE/port
Cincinnati October 2012 Market Trend RE/port
 

Último

Vanam At Purva Soukhyam Guduvanchery.pdf.pdf
Vanam At Purva Soukhyam Guduvanchery.pdf.pdfVanam At Purva Soukhyam Guduvanchery.pdf.pdf
Vanam At Purva Soukhyam Guduvanchery.pdf.pdfkratirudram
 
Shapoorji Pallonji Joyville Vista Pune | Spend Your Family Time Together
Shapoorji Pallonji Joyville Vista Pune | Spend Your Family Time TogetherShapoorji Pallonji Joyville Vista Pune | Spend Your Family Time Together
Shapoorji Pallonji Joyville Vista Pune | Spend Your Family Time Togetheraidasheikh47
 
Call Girls In Seelampur Delhi ↬8447779280}Seelampur Escorts Service In Delhi...
Call Girls In Seelampur  Delhi ↬8447779280}Seelampur Escorts Service In Delhi...Call Girls In Seelampur  Delhi ↬8447779280}Seelampur Escorts Service In Delhi...
Call Girls In Seelampur Delhi ↬8447779280}Seelampur Escorts Service In Delhi...asmaqueen5
 
MEQ Mainstreet Equity Corp Q2 2024 Investor Presentation
MEQ Mainstreet Equity Corp Q2 2024 Investor PresentationMEQ Mainstreet Equity Corp Q2 2024 Investor Presentation
MEQ Mainstreet Equity Corp Q2 2024 Investor PresentationMEQ - Mainstreet Equity Corp.
 
BDSM⚡Call Girls in Sector 57 Noida Escorts >༒8448380779 Escort Service
BDSM⚡Call Girls in Sector 57 Noida Escorts >༒8448380779 Escort ServiceBDSM⚡Call Girls in Sector 57 Noida Escorts >༒8448380779 Escort Service
BDSM⚡Call Girls in Sector 57 Noida Escorts >༒8448380779 Escort ServiceDelhi Call girls
 
Purva Soukhyam in Guduvancheri Chennai.pdf
Purva Soukhyam in Guduvancheri Chennai.pdfPurva Soukhyam in Guduvancheri Chennai.pdf
Purva Soukhyam in Guduvancheri Chennai.pdfpritika141199
 
9990771857 Call Girls in Dwarka Sector 1 Delhi (Call Girls) Delhi
9990771857 Call Girls in Dwarka Sector 1 Delhi (Call Girls) Delhi9990771857 Call Girls in Dwarka Sector 1 Delhi (Call Girls) Delhi
9990771857 Call Girls in Dwarka Sector 1 Delhi (Call Girls) Delhidelhimodel235
 
Mahindra Happinest Tathawade Pune Brochure.pdf
Mahindra Happinest Tathawade Pune Brochure.pdfMahindra Happinest Tathawade Pune Brochure.pdf
Mahindra Happinest Tathawade Pune Brochure.pdfBabyrudram
 
Cheap Rate ✨➥9711108085▻✨Call Girls In Chandni Chowk (Delhi)
Cheap Rate ✨➥9711108085▻✨Call Girls In Chandni Chowk (Delhi)Cheap Rate ✨➥9711108085▻✨Call Girls In Chandni Chowk (Delhi)
Cheap Rate ✨➥9711108085▻✨Call Girls In Chandni Chowk (Delhi)delhi24hrs1
 
9990771857 Call Girls in Dwarka Sector 2 Delhi (Call Girls) Delhi
9990771857 Call Girls in Dwarka Sector 2 Delhi (Call Girls) Delhi9990771857 Call Girls in Dwarka Sector 2 Delhi (Call Girls) Delhi
9990771857 Call Girls in Dwarka Sector 2 Delhi (Call Girls) Delhidelhimodel235
 
Enjoy Night ≽ 8448380779 ≼ Call Girls In Huda City Centre (Gurgaon)
Enjoy Night ≽ 8448380779 ≼ Call Girls In Huda City Centre (Gurgaon)Enjoy Night ≽ 8448380779 ≼ Call Girls In Huda City Centre (Gurgaon)
Enjoy Night ≽ 8448380779 ≼ Call Girls In Huda City Centre (Gurgaon)Delhi Call girls
 
9990771857 Call Girls in Dwarka Sector 10 Delhi (Call Girls) Delhi
9990771857 Call Girls in Dwarka Sector 10 Delhi (Call Girls) Delhi9990771857 Call Girls in Dwarka Sector 10 Delhi (Call Girls) Delhi
9990771857 Call Girls in Dwarka Sector 10 Delhi (Call Girls) Delhidelhimodel235
 
Greater Vancouver Realtors Statistics Package April 2024
Greater Vancouver Realtors Statistics Package April 2024Greater Vancouver Realtors Statistics Package April 2024
Greater Vancouver Realtors Statistics Package April 2024VickyAulakh1
 
Sector 62, Noida Call girls :8448380779 Noida Escorts | 100% verified
Sector 62, Noida Call girls :8448380779 Noida Escorts | 100% verifiedSector 62, Noida Call girls :8448380779 Noida Escorts | 100% verified
Sector 62, Noida Call girls :8448380779 Noida Escorts | 100% verifiedDelhi Call girls
 
Mapusa Beach ( Call Girls ) Goa ✔ 8617370543 ✅ By Goa Call Girls For Pick Up ...
Mapusa Beach ( Call Girls ) Goa ✔ 8617370543 ✅ By Goa Call Girls For Pick Up ...Mapusa Beach ( Call Girls ) Goa ✔ 8617370543 ✅ By Goa Call Girls For Pick Up ...
Mapusa Beach ( Call Girls ) Goa ✔ 8617370543 ✅ By Goa Call Girls For Pick Up ...Nitya salvi
 
Call Girls in Anand Vihar Delhi +91 8447779280}Call Girls In Delhi Best in D...
Call Girls in Anand Vihar Delhi +91 8447779280}Call Girls In Delhi Best  in D...Call Girls in Anand Vihar Delhi +91 8447779280}Call Girls In Delhi Best  in D...
Call Girls in Anand Vihar Delhi +91 8447779280}Call Girls In Delhi Best in D...asmaqueen5
 
Premium Villa Projects in Sarjapur Road Bengaluru
Premium Villa Projects in Sarjapur Road BengaluruPremium Villa Projects in Sarjapur Road Bengaluru
Premium Villa Projects in Sarjapur Road BengaluruShivaSeo3
 
Rohan Harita Tathawade Pune Brochure.pdf
Rohan Harita Tathawade Pune Brochure.pdfRohan Harita Tathawade Pune Brochure.pdf
Rohan Harita Tathawade Pune Brochure.pdfabbu831446
 
9990771857 Call Girls in Dwarka Sector 6 Delhi (Call Girls) Delhi
9990771857 Call Girls in Dwarka Sector 6 Delhi (Call Girls) Delhi9990771857 Call Girls in Dwarka Sector 6 Delhi (Call Girls) Delhi
9990771857 Call Girls in Dwarka Sector 6 Delhi (Call Girls) Delhidelhimodel235
 
Acibadem Konaklari Uskudar - Listin Turkey
Acibadem Konaklari Uskudar - Listin TurkeyAcibadem Konaklari Uskudar - Listin Turkey
Acibadem Konaklari Uskudar - Listin TurkeyListing Turkey
 

Último (20)

Vanam At Purva Soukhyam Guduvanchery.pdf.pdf
Vanam At Purva Soukhyam Guduvanchery.pdf.pdfVanam At Purva Soukhyam Guduvanchery.pdf.pdf
Vanam At Purva Soukhyam Guduvanchery.pdf.pdf
 
Shapoorji Pallonji Joyville Vista Pune | Spend Your Family Time Together
Shapoorji Pallonji Joyville Vista Pune | Spend Your Family Time TogetherShapoorji Pallonji Joyville Vista Pune | Spend Your Family Time Together
Shapoorji Pallonji Joyville Vista Pune | Spend Your Family Time Together
 
Call Girls In Seelampur Delhi ↬8447779280}Seelampur Escorts Service In Delhi...
Call Girls In Seelampur  Delhi ↬8447779280}Seelampur Escorts Service In Delhi...Call Girls In Seelampur  Delhi ↬8447779280}Seelampur Escorts Service In Delhi...
Call Girls In Seelampur Delhi ↬8447779280}Seelampur Escorts Service In Delhi...
 
MEQ Mainstreet Equity Corp Q2 2024 Investor Presentation
MEQ Mainstreet Equity Corp Q2 2024 Investor PresentationMEQ Mainstreet Equity Corp Q2 2024 Investor Presentation
MEQ Mainstreet Equity Corp Q2 2024 Investor Presentation
 
BDSM⚡Call Girls in Sector 57 Noida Escorts >༒8448380779 Escort Service
BDSM⚡Call Girls in Sector 57 Noida Escorts >༒8448380779 Escort ServiceBDSM⚡Call Girls in Sector 57 Noida Escorts >༒8448380779 Escort Service
BDSM⚡Call Girls in Sector 57 Noida Escorts >༒8448380779 Escort Service
 
Purva Soukhyam in Guduvancheri Chennai.pdf
Purva Soukhyam in Guduvancheri Chennai.pdfPurva Soukhyam in Guduvancheri Chennai.pdf
Purva Soukhyam in Guduvancheri Chennai.pdf
 
9990771857 Call Girls in Dwarka Sector 1 Delhi (Call Girls) Delhi
9990771857 Call Girls in Dwarka Sector 1 Delhi (Call Girls) Delhi9990771857 Call Girls in Dwarka Sector 1 Delhi (Call Girls) Delhi
9990771857 Call Girls in Dwarka Sector 1 Delhi (Call Girls) Delhi
 
Mahindra Happinest Tathawade Pune Brochure.pdf
Mahindra Happinest Tathawade Pune Brochure.pdfMahindra Happinest Tathawade Pune Brochure.pdf
Mahindra Happinest Tathawade Pune Brochure.pdf
 
Cheap Rate ✨➥9711108085▻✨Call Girls In Chandni Chowk (Delhi)
Cheap Rate ✨➥9711108085▻✨Call Girls In Chandni Chowk (Delhi)Cheap Rate ✨➥9711108085▻✨Call Girls In Chandni Chowk (Delhi)
Cheap Rate ✨➥9711108085▻✨Call Girls In Chandni Chowk (Delhi)
 
9990771857 Call Girls in Dwarka Sector 2 Delhi (Call Girls) Delhi
9990771857 Call Girls in Dwarka Sector 2 Delhi (Call Girls) Delhi9990771857 Call Girls in Dwarka Sector 2 Delhi (Call Girls) Delhi
9990771857 Call Girls in Dwarka Sector 2 Delhi (Call Girls) Delhi
 
Enjoy Night ≽ 8448380779 ≼ Call Girls In Huda City Centre (Gurgaon)
Enjoy Night ≽ 8448380779 ≼ Call Girls In Huda City Centre (Gurgaon)Enjoy Night ≽ 8448380779 ≼ Call Girls In Huda City Centre (Gurgaon)
Enjoy Night ≽ 8448380779 ≼ Call Girls In Huda City Centre (Gurgaon)
 
9990771857 Call Girls in Dwarka Sector 10 Delhi (Call Girls) Delhi
9990771857 Call Girls in Dwarka Sector 10 Delhi (Call Girls) Delhi9990771857 Call Girls in Dwarka Sector 10 Delhi (Call Girls) Delhi
9990771857 Call Girls in Dwarka Sector 10 Delhi (Call Girls) Delhi
 
Greater Vancouver Realtors Statistics Package April 2024
Greater Vancouver Realtors Statistics Package April 2024Greater Vancouver Realtors Statistics Package April 2024
Greater Vancouver Realtors Statistics Package April 2024
 
Sector 62, Noida Call girls :8448380779 Noida Escorts | 100% verified
Sector 62, Noida Call girls :8448380779 Noida Escorts | 100% verifiedSector 62, Noida Call girls :8448380779 Noida Escorts | 100% verified
Sector 62, Noida Call girls :8448380779 Noida Escorts | 100% verified
 
Mapusa Beach ( Call Girls ) Goa ✔ 8617370543 ✅ By Goa Call Girls For Pick Up ...
Mapusa Beach ( Call Girls ) Goa ✔ 8617370543 ✅ By Goa Call Girls For Pick Up ...Mapusa Beach ( Call Girls ) Goa ✔ 8617370543 ✅ By Goa Call Girls For Pick Up ...
Mapusa Beach ( Call Girls ) Goa ✔ 8617370543 ✅ By Goa Call Girls For Pick Up ...
 
Call Girls in Anand Vihar Delhi +91 8447779280}Call Girls In Delhi Best in D...
Call Girls in Anand Vihar Delhi +91 8447779280}Call Girls In Delhi Best  in D...Call Girls in Anand Vihar Delhi +91 8447779280}Call Girls In Delhi Best  in D...
Call Girls in Anand Vihar Delhi +91 8447779280}Call Girls In Delhi Best in D...
 
Premium Villa Projects in Sarjapur Road Bengaluru
Premium Villa Projects in Sarjapur Road BengaluruPremium Villa Projects in Sarjapur Road Bengaluru
Premium Villa Projects in Sarjapur Road Bengaluru
 
Rohan Harita Tathawade Pune Brochure.pdf
Rohan Harita Tathawade Pune Brochure.pdfRohan Harita Tathawade Pune Brochure.pdf
Rohan Harita Tathawade Pune Brochure.pdf
 
9990771857 Call Girls in Dwarka Sector 6 Delhi (Call Girls) Delhi
9990771857 Call Girls in Dwarka Sector 6 Delhi (Call Girls) Delhi9990771857 Call Girls in Dwarka Sector 6 Delhi (Call Girls) Delhi
9990771857 Call Girls in Dwarka Sector 6 Delhi (Call Girls) Delhi
 
Acibadem Konaklari Uskudar - Listin Turkey
Acibadem Konaklari Uskudar - Listin TurkeyAcibadem Konaklari Uskudar - Listin Turkey
Acibadem Konaklari Uskudar - Listin Turkey
 

Sarasota Market Stats December

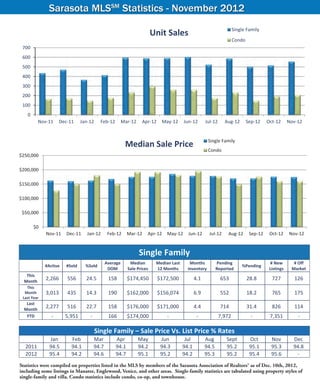
  • 1. Sarasota MLSSM Statistics - November 2012 Single Family Unit Sales Condo 700 600 500 400 300 200 100 0 Nov‐11 Dec‐11 Jan‐12 Feb‐12 Mar‐12 Apr‐12 May‐12 Jun‐12 Jul‐12 Aug‐12 Sep‐12 Oct‐12 Nov‐12 Single Family Median Sale Price Condo $250,000 $200,000 $150,000 $100,000 $50,000 $0 Nov‐11 Dec‐11 Jan‐12 Feb‐12 Mar‐12 Apr‐12 May‐12 Jun‐12 Jul‐12 Aug‐12 Sep‐12 Oct‐12 Nov‐12 Single Family    Average Median  Median Last  Months  Pending  # New  # Off  #Active  #Sold  %Sold  %Pending  DOM  Sale Prices  12 Months  Inventory  Reported  Listings  Market  This  Month  2,266  556  24.5  158  $174,450  $172,500  4.1  653  28.8  727  126  This  Month  3,013  435  14.3  190  $162,000  $156,074  6.9  552  18.2  765  175  Last Year  Last  Month  2,277  516  22.7  158  $176,000  $171,000  4.4  714  31.4  826  114  YTD  ‐  5,951 ‐  166  $174,000  ‐  ‐  7,972  ‐  7,351  ‐      Single Family – Sale Price Vs. List Price % Rates   Jan  Feb  Mar  Apr  May  Jun  Jul  Aug  Sept  Oct  Nov  Dec  2011  94.5  94.1  94.7  94.1  94.2  94.3  94.1  94.5  95.2  95.1  95.3  94.8  2012  95.4  94.2  94.6  94.7  95.1  95.2  94.2  95.3  95.2  95.4  95.6  ‐    Statistics were compiled on properties listed in the MLS by members of the Sarasota Association of Realtors® as of Dec. 10th, 2012, including some listings in Manatee, Englewood, Venice, and other areas. Single-family statistics are tabulated using property styles of single-family and villa. Condo statistics include condo, co-op, and townhouse. Source: Sarasota Association of Realtors® 16 JANUARY 2013 Sarasota Realtor® Magazine www.sarasotarealtors.com
  • 2. Sarasota MLSSM Statistics - November 2012 Single Family Inventory Condo 3,500 3,000 2,500 2,000 1,500 1,000 500 0 Nov‐11 Dec‐11 Jan‐12 Feb‐12 Mar‐12 Apr‐12 May‐12 Jun‐12 Jul‐12 Aug‐12 Sep‐12 Oct‐12 Nov‐12 Single Family Pending Sales Condo 900 800 700 600 500 400 300 200 100 0 Nov‐11 Dec‐11 Jan‐12 Feb‐12 Mar‐12 Apr‐12 May‐12 Jun‐12 Jul‐12 Aug‐12 Sep‐12 Oct‐12 Nov‐12 Condo    Average  Median Sale  Median Last  Months of Pending  # New  # Off  #Active  #Sold  %Sold  %Pending  DOM  Prices  12 Months  Inventory  Reported  Listings  Market  This  Month  1,277  208  16.3  188  $160,000  $174,700  6.1  252  19.7  326  117  This  Month  1,641  167  10.2  181  $127,000  $158,000  9.8  230  14.0  325  241  Last Year  Last  Month  1,240  193  15.6  191  $160,000  $170,000  6.4  240  19.4  294  107  YTD  ‐  2,370  ‐  192  $175,000  ‐  ‐  2,990  ‐  2,993  ‐    Condo – Sale Price Vs. List Price % Rates   Jan  Feb  Mar  Apr  May  Jun  Jul  Aug  Sept  Oct  Nov  Dec  2011  93.4  91.2  92.2  93.4  94.5  94.2  92.5  93.1  92.8  93.2  93.6  92.7  2012  93.1  93.5  94.2  94.3  93.8  93.8  94.6  94.1  94.2  94.4  95.4  ‐    Median sales price is the middle value, where half of the homes sold for more, and half sold for less. Listings sold were closed transactions during the month. Pending sales are sales where an offer has been accepted during the month, but the sale has not yet closed. Even though some pending sales never close, pending sales are an indicator of current buyer activity. DOM indicates the average number of days that sold properties were on the market before a contract was executed. Sarasota Association of Realtors® MLS www.sarasotarealtors.com Sarasota Realtor® Magazine JANUARY 2013 17
  • 3. The Xtra Pages - Digital Version Only Single Family Months of Inventory Condo 12 10 8 6 4 2 0 Nov‐11 Dec‐11 Jan‐12 Feb‐12 Mar‐12 Apr‐12 May‐12 Jun‐12 Jul‐12 Aug‐12 Sep‐12 Oct‐12 Nov‐12 Single Family Days on Market Condo 250 200 150 100 50 0 Nov‐11 Dec‐11 Jan‐12 Feb‐12 Mar‐12 Apr‐12 May‐12 Jun‐12 Jul‐12 Aug‐12 Sep‐12 Oct‐12 Nov‐12 Single Family Sales Volume Condo $200,000,000 $180,000,000 $160,000,000 $140,000,000 $120,000,000 $100,000,000 $80,000,000 $60,000,000 $40,000,000 $20,000,000 $0 Nov‐11 Dec‐11 Jan‐12 Feb‐12 Mar‐12 Apr‐12 May‐12 Jun‐12 Jul‐12 Aug‐12 Sep‐12 Oct‐12 Nov‐12 New Listings Single Family Condo 900 800 700 600 500 400 300 Sarasota Association of Realtors® MLS 200 100 0 Nov‐11 Dec‐11 Jan‐12 Feb‐12 Mar‐12 Apr‐12 May‐12 Jun‐12 Jul‐12 Aug‐12 Sep‐12 Oct‐12 Nov‐12
  • 4. Third Quarter 2012 Report Single Family Sales ‐ By Quarter REO Short Market 1400 1200 1000 800 600 400 200 0 2010‐Q1 2010‐Q2* 2010‐Q3 2010‐Q4 2011‐Q1 2011‐Q2 2011‐Q3 2011‐Q4 2012‐Q1 2012‐Q2 2012‐Q3 * Homebuyer Tax Credit In Effect Condo Sales ‐ By Quarter REO Short Market 700 600 500 400 300 200 100 0 2010‐Q1 2010‐Q2* 2010‐Q3 2010‐Q4 2011‐Q1 2011‐Q2 2011‐Q3 2011‐Q4 2012‐Q1 2012‐Q2 2012‐Q3 * Homebuyer Tax Credit In Effect Single Family Median Sale Price REO Short Market $300,000 $250,000 $200,000 $150,000 $100,000 $50,000 $0 2010‐Q1 2010‐Q2 2010‐Q3 2010‐Q4 2011‐Q1 2011‐Q2 2011‐Q3 2011‐Q4 2012‐Q1 2012‐Q2 2012‐Q3 Condo Median Sale Price REO Short Market $300,000 $250,000 $200,000 Source: Sarasota Association of Realtors® $150,000 $100,000 $50,000 $0 2010‐Q1 2010‐Q2 2010‐Q3 2010‐Q4 2011‐Q1 2011‐Q2 2011‐Q3 2011‐Q4 2012‐Q1 2012‐Q2 2012‐Q3
  • 5. Single Family REO Sales ‐ By Quarter Condo 600 500 400 300 200 100 0 2010‐Q1 2010‐Q2* 2010‐Q3 2010‐Q4 2011‐Q1 2011‐Q2 2011‐Q3 2011‐Q4 2012‐Q1 2012‐Q2 2012‐Q3 * Homebuyer Tax Credit In Effect Single Family Short Sales ‐ By Quarter Condo 400 350 300 250 200 150 100 50 0 2010‐Q1 2010‐Q2* 2010‐Q3 2010‐Q4 2011‐Q1 2011‐Q2 2011‐Q3 2011‐Q4 2012‐Q1 2012‐Q2 2012‐Q3 * Homebuyer Tax Credit In Effect Single Family Market Sales ‐ By Quarter Condo 1400 1200 1000 800 600 400 200 0 2010‐Q1 2010‐Q2* 2010‐Q3 2010‐Q4 2011‐Q1 2011‐Q2 2011‐Q3 2011‐Q4 2012‐Q1 2012‐Q2 2012‐Q3 * Homebuyer Tax Credit In Effect Source: Sarasota Association of Realtors®
  • 6. Annual Sales ‐ 2000 to 2011 Single Family Single Family Condo Total 11267 10562 9697 8167 8224 7,596 7603 7036 6,841 6533 6739 6,504 6 504 6358 6042 5820 5,938 5,603 5,466 5,183 4,940 4,626 4,349 4,353 3,721 3 721 3,922 , 3 671 3,671 3,193 2,564 2,184 2,096 2,120 2,137 2,286 2,005 1,556 1,194 2000 2001 2002 2003 2004 2005 2006 2007 2008 2009 2010 2011 Annual Median Sale Price ‐ 2000 to 2011  Single Family Condo $351,000 $342,000 $336,250 $320,000 $272,500 $301,225 $305,000 $226,000 $225,000 $303,000 $191,000 $210,000 $172,500 $191,000 $230,000 $163,000 $142,000 $156,800 $173,000 $145,000 $160,000 $132,300 $163,000 $155,925 2000 2001 2002 2003 2004 2005 2006 2007 2008 2009 2010 2011