SlideShare a Scribd company logo
1 of 6
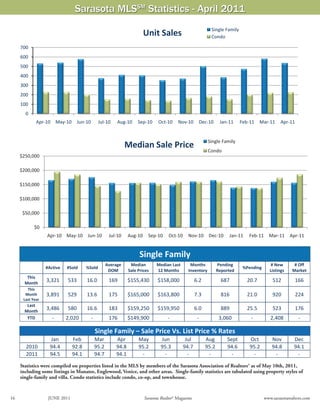
Sarasota MLSSM Statistics - April 2011
                                                                                                                         Single Family
                                                                                   Unit Sales                            Condo

     700
     600
     500
     400
     300
     200
     100
       0
               Apr‐10 May‐10              Jun‐10         Jul‐10     Aug‐10      Sep‐10    Oct‐10     Nov‐10       Dec‐10       Jan‐11     Feb‐11     Mar‐11     Apr‐11


                                                                                                                        Single Family
                                                                         Median Sale Price
                                                                                                                        Condo
     $250,000

     $200,000

     $150,000

     $100,000

      $50,000

               $0
                        Apr‐10 May‐10          Jun‐10           Jul‐10   Aug‐10       Sep‐10    Oct‐10     Nov‐10 Dec‐10           Jan‐11    Feb‐11      Mar‐11       Apr‐11


                                                                                 Single Family 
                                                            Average         Median        Median Last       Months         Pending                         # New        # Off 
                    #Active          #Sold     %Sold                                                                                       %Pending 
                                                             DOM           Sale Prices    12 Months        Inventory       Reported                       Listings     Market 
        This 
       Month 
                    3,321            533       16.0             169      $155,430         $158,000              6.2            687           20.7          512           166 
        This 
       Month        3,891            529       13.6             175      $165,000         $163,800              7.3            816           21.0          920           224 
      Last Year 
        Last 
       Month 
                    3,486            580       16.6             183      $159,250         $159,950              6.0            889           25.5          523           176 
        YTD              ‐           2,020         ‐            176      $149,900              ‐                 ‐             3,060          ‐           2,408           ‐ 
                                  
                                                        Single Family – Sale Price Vs. List Price % Rates
                         Jan           Feb              Mar        Apr          May         Jun           Jul          Aug        Sept        Oct          Nov         Dec 
       2010              94.4          92.8             95.2       94.8         95.2        95.3         94.7          95.2       94.6        95.2         94.8        94.1 
       2011              94.5          94.1             94.7       94.1          ‐           ‐             ‐            ‐           ‐          ‐            ‐           ‐ 
                     
     Statistics were compiled on properties listed in the MLS by members of the Sarasota Association of Realtors® as of May 10th, 2011,
     including some listings in Manatee, Englewood, Venice, and other areas. Single-family statistics are tabulated using property styles of
     single-family and villa. Condo statistics include condo, co-op, and townhouse.

                                                                                                                 Source: Sarasota Association of Realtors®
16                      JUNE 2011                                                  Sarasota Realtor® Magazine                                          www.sarasotarealtors.com
Sarasota MLSSM Statistics - April 2011
                                                                                                             Single Family
                                                                       Inventory                             Condo
5,000

4,000

3,000

2,000

1,000

     0
           Apr‐10 May‐10 Jun‐10                Jul‐10     Aug‐10 Sep‐10        Oct‐10 Nov‐10 Dec‐10                 Jan‐11      Feb‐11 Mar‐11 Apr‐11


                                                                                                              Single Family
                                                                    Pending Sales                             Condo
1000
 900
 800
 700
 600
 500
 400
 300
 200
 100
   0
           Apr‐10 May‐10            Jun‐10     Jul‐10     Aug‐10      Sep‐10    Oct‐10     Nov‐10          Dec‐10     Jan‐11     Feb‐11     Mar‐11      Apr‐11


                                                                               Condo 
                                                  Average       Median Sale    Median Last     Months of            Pending                     # New       # Off 
                  #Active    #Sold    %Sold                                                                                      %Pending 
                                                   DOM            Prices       12 Months       Inventory            Reported                   Listings    Market 
   This 
  Month 
                  1,937      226       11.7        230          $185,500        $160,000             8.6              272          14.0         224         197 
   This 
  Month           2,269      228       10.0        203          $193,175        $192,000             9.9              344          15.2         354         212 
 Last Year 
   Last 
  Month 
                  2,015      220       10.9        195          $173,000        $160,000             9.2              319          15.8         280         212 
   YTD               ‐       821         ‐         211          $165,000            ‐                 ‐              1,043           ‐         1,150             ‐ 
                      
                                                Condo – Sale Price Vs. List Price % Rates
                   Jan        Feb         Mar           Apr          May        Jun          Jul            Aug         Sept        Oct         Nov         Dec 
   2010            92.5       92.4        92.5          93.2         94.2       93.7        94.2            93.5        93.2        94.3        94.5        92.9 
   2011            93.4       91.2        92.2          93.4          ‐          ‐            ‐              ‐            ‐          ‐           ‐           ‐ 
               
Median sales price is the middle value, where half of the homes sold for more, and half sold for less. Listings sold were closed transac-
tions during the month. Pending sales are sales where an offer has been accepted during the month, but the sale has not yet closed. Even
though some pending sales never close, pending sales are an indicator of current buyer activity. DOM indicates the average number of
days that sold properties were on the market before a contract was executed.
                                                                                                            Sarasota Association of Realtors® MLS
www.sarasotarealtors.com                                                Sarasota Realtor® Magazine                                          JUNE 2011                 17
Single Family
                                                Days on Market


                                                                                                                                          The Xtra Pages - Digital Version Only
                                                                                        Condo
250

200

150

100

 50

  0
        Apr‐10 May‐10   Jun‐10   Jul‐10     Aug‐10   Sep‐10     Oct‐10    Nov‐10   Dec‐10   Jan‐11       Feb‐11   Mar‐11     Apr‐11

                                                                                                             Single Family
                                                     New Listings                                            Condo
1,000
  900
  800
  700
  600
  500
  400
  300
  200
  100
    0
        Apr‐10 May‐10 Jun‐10       Jul‐10     Aug‐10    Sep‐10    Oct‐10    Nov‐10    Dec‐10     Jan‐11     Feb‐11 Mar‐11        Apr‐11
                                                                                                     Single Family
                                              Months of Inventory                                    Condo
 18
 16
 14
 12
 10
  8
  6
  4
  2
  0
        Apr‐10 May‐10 Jun‐10     Jul‐10     Aug‐10     Sep‐10    Oct‐10    Nov‐10 Dec‐10        Jan‐11     Feb‐11 Mar‐11 Apr‐11

                                                                                                         Single Family
                                                       Sales Volume                                      Condo
  $200,000,000 
  $180,000,000 
  $160,000,000 
  $140,000,000 
  $120,000,000 
  $100,000,000                                                                       Sarasota Association of Realtors® MLS
   $80,000,000 
   $60,000,000 
   $40,000,000 
   $20,000,000 
            $0 
                  Apr‐10 May‐10 Jun‐10       Jul‐10 Aug‐10 Sep‐10 Oct‐10 Nov‐10 Dec‐10 Jan‐11 Feb‐11 Mar‐11 Apr‐11
First Quarter 2011 Report
                                Single Family Sales ‐ By Quarter                                          REO           Short      Arm's Length
1000

800

600

400

200

   0
         2008‐Q3     2008‐Q4     2009‐Q1     2009‐Q2     2009‐Q3         2009‐Q4       2010‐Q1     2010‐Q2       2010‐Q3        2010‐Q4     2011‐Q1
                                                                                                   * Homebuyer Tax
                                                                                                   Credit In Effect

                                 Condo Sales ‐ By Quarter                                                    REO        Short      Arm's Length
500

400

300

200

100

  0
        2008‐Q3     2008‐Q4     2009‐Q1     2009‐Q2     2009‐Q3      2009‐Q4       2010‐Q1         2010‐Q2      2010‐Q3         2010‐Q4     2011‐Q1
                                                                                                 * Homebuyer Tax
                                                                                                 Credit In Effect

                     Single Family Median Sale Price                                                REO         Short       Arm's Length
$300,000 

$250,000 

$200,000 

$150,000 

$100,000 

 $50,000 

       $0 
             2008‐3rdQ   2008‐4thQ   2009‐1stQ   2009‐2ndQ   2009‐3rdQ     2009‐4thQ     2010‐Q1      2010‐Q2      2010‐Q3        2010‐Q4     2011‐Q1


                               Condo Median Sale Price                                              REO         Short        Arm's Length
$350,000 

$300,000 

$250,000 

$200,000 

$150,000 

$100,000                                                                                  Source: Sarasota Association of Realtors®

 $50,000 

       $0 
             2008‐3rdQ   2008‐4thQ   2009‐1stQ   2009‐2ndQ   2009‐3rdQ     2009‐4thQ     2010‐Q1      2010‐Q2      2010‐Q3        2010‐Q4     2011‐Q1
Single Family
                                   REO Sales ‐ By Quarter                                 Condo
600
500
400
300
200
100
 0
          2008‐Q1 2008‐Q2 2008‐Q3 2008‐Q4 2009‐Q1 2009‐Q2 2009‐Q3 2009‐Q4 2010‐Q1 2010‐Q2 2010‐Q3 2010‐Q4 2011‐Q1
                                                                                 * Homebuyer Tax
                                                                                 Credit In Effect
                                                                                         Single Family
                                Short Sales ‐ By Quarter                                 Condo
400
350
300
250
200
150
100
 50
  0
          2008‐Q3    2008‐Q4    2009‐Q1    2009‐Q2    2009‐Q3    2009‐Q4    2010‐Q1    2010‐Q2    2010‐Q3    2010‐Q4    2011‐Q1
                                                                                      * Homebuyer Tax
                                                                                      Credit In Effect
                                                                                          Single Family
                               Arm's Length Sales ‐ By Quarter                            Condo
1000

 800

 600

 400

 200

      0
           2008‐Q3    2008‐Q4    2009‐Q1    2009‐Q2    2009‐Q3    2009‐Q4    2010‐Q1    2010‐Q2    2010‐Q3    2010‐Q4    2011‐Q1
                                                                                        * Homebuyer Tax
                                                                                        Credit In Effect


                                                                                  Source: Sarasota Association of Realtors®
Annual Sales ‐ 2000 to 2010
                                                                                      Single Family              Condo                Total
                                                          11267
                                                                        10562
                                              9697


                               8167
                                                          7,596                                                                              7603
                   7036                                                  6,841
    6533                                                                                                                    6739
                                              6,504                                   6358
                                                                                                  6042          5820
                               5,603                                                                                                         5,466
                                                                                                                            5,183
                 4,940
                                                                                                                4,626
    4,349                                                                             4,353
                                                                         3,721                    3,922
                                                          3,671
                                              3,193
                               2,564
    2,184        2,096                                                                2,005       2,120                                      2,137
                                                                                                                            1,556
                                                                                                                1,194


    2000           2001        2002           2003        2004           2005         2006        2007          2008        2009             2010


Annual Median Sale Price ‐ 2000 to 2010 
           Condo          Single Family                                        $351,000
                                                                                             $342,000     $336,250
                                                                                                                       $320,000

                                                              $272,500
                                                                                              $301,225
                                                                                  $305,000
                                                  $226,000
                                                                    $225,000                              $303,000
                                    $191,000                                                                                         $210,000
                    $172,500
                                                      $191,000                                                       $230,000                        $163,000
$142,000
                                   $173,000
                    $145,000                                                                                                      $160,000           $163,000
      $132,300


   2000          2001          2002            2003          2004          2005           2006           2007        2008           2009            2010

More Related Content

More from Sarasota Real Estate

Sarasota Market Statistics July 2013
Sarasota Market Statistics July 2013Sarasota Market Statistics July 2013
Sarasota Market Statistics July 2013Sarasota Real Estate
 
Sr mag mar2013stats13022194344.2-6
Sr mag mar2013stats13022194344.2-6Sr mag mar2013stats13022194344.2-6
Sr mag mar2013stats13022194344.2-6Sarasota Real Estate
 
Sarasota Market Statistics May 2012
Sarasota Market Statistics May 2012Sarasota Market Statistics May 2012
Sarasota Market Statistics May 2012Sarasota Real Estate
 
Sales climb in February 2012; pending sales rise to 11-month high
Sales climb in February 2012; pending sales rise to 11-month highSales climb in February 2012; pending sales rise to 11-month high
Sales climb in February 2012; pending sales rise to 11-month highSarasota Real Estate
 
SAR Monthly Statistics Released for June 2011
SAR Monthly Statistics Released for June 2011SAR Monthly Statistics Released for June 2011
SAR Monthly Statistics Released for June 2011Sarasota Real Estate
 

More from Sarasota Real Estate (20)

Sarasota Market Statistics July 2013
Sarasota Market Statistics July 2013Sarasota Market Statistics July 2013
Sarasota Market Statistics July 2013
 
Sarasota Market Stats May
Sarasota Market Stats MaySarasota Market Stats May
Sarasota Market Stats May
 
March2013 stats.3 6
March2013 stats.3 6March2013 stats.3 6
March2013 stats.3 6
 
Feb2013 stats.3 8
Feb2013 stats.3 8Feb2013 stats.3 8
Feb2013 stats.3 8
 
Sr mag mar2013stats13022194344.2-6
Sr mag mar2013stats13022194344.2-6Sr mag mar2013stats13022194344.2-6
Sr mag mar2013stats13022194344.2-6
 
Sarasota Market Stats December
Sarasota Market Stats DecemberSarasota Market Stats December
Sarasota Market Stats December
 
Aug2012 stats 3_8
Aug2012 stats 3_8Aug2012 stats 3_8
Aug2012 stats 3_8
 
Sarasota Market Statistics May 2012
Sarasota Market Statistics May 2012Sarasota Market Statistics May 2012
Sarasota Market Statistics May 2012
 
Sarasota Market stats for March
Sarasota Market stats for MarchSarasota Market stats for March
Sarasota Market stats for March
 
Sr march2012 stats12041822817_2_3
Sr march2012 stats12041822817_2_3Sr march2012 stats12041822817_2_3
Sr march2012 stats12041822817_2_3
 
Sarasota Market Stats feb2012
Sarasota Market Stats feb2012Sarasota Market Stats feb2012
Sarasota Market Stats feb2012
 
Sales climb in February 2012; pending sales rise to 11-month high
Sales climb in February 2012; pending sales rise to 11-month highSales climb in February 2012; pending sales rise to 11-month high
Sales climb in February 2012; pending sales rise to 11-month high
 
SARStats-July2011
SARStats-July2011SARStats-July2011
SARStats-July2011
 
Srmag june2011 stats
Srmag june2011 statsSrmag june2011 stats
Srmag june2011 stats
 
Srmag june2011 stats
Srmag june2011 statsSrmag june2011 stats
Srmag june2011 stats
 
SAR Monthly Statistics Released for June 2011
SAR Monthly Statistics Released for June 2011SAR Monthly Statistics Released for June 2011
SAR Monthly Statistics Released for June 2011
 
Buying a home in sarasota florida
Buying a home in sarasota floridaBuying a home in sarasota florida
Buying a home in sarasota florida
 
May2011 stats 3 to8
May2011 stats 3 to8May2011 stats 3 to8
May2011 stats 3 to8
 
May2011 stats
May2011 statsMay2011 stats
May2011 stats
 
Dec2010stats
Dec2010statsDec2010stats
Dec2010stats
 

Recently uploaded

LCAR Unit 20 - Appraising Real Estate - 14th Edition Revised
LCAR Unit 20 - Appraising Real Estate - 14th Edition RevisedLCAR Unit 20 - Appraising Real Estate - 14th Edition Revised
LCAR Unit 20 - Appraising Real Estate - 14th Edition RevisedTom Blefko
 
Mana Dale Kodathi, Sarjapur Road, Bangalore E-Brochure.pdf
Mana Dale Kodathi, Sarjapur Road, Bangalore E-Brochure.pdfMana Dale Kodathi, Sarjapur Road, Bangalore E-Brochure.pdf
Mana Dale Kodathi, Sarjapur Road, Bangalore E-Brochure.pdffaheemali990101
 
LCAR Unit 21 - Closing the Real Estate Transaction - 14th Edition Revised
LCAR Unit 21 - Closing the Real Estate Transaction - 14th Edition RevisedLCAR Unit 21 - Closing the Real Estate Transaction - 14th Edition Revised
LCAR Unit 21 - Closing the Real Estate Transaction - 14th Edition RevisedTom Blefko
 
LCAR Unit 19 - Financing the Real Estate Transaction - 14th Edition Revised
LCAR Unit 19 - Financing the Real Estate Transaction - 14th Edition RevisedLCAR Unit 19 - Financing the Real Estate Transaction - 14th Edition Revised
LCAR Unit 19 - Financing the Real Estate Transaction - 14th Edition RevisedTom Blefko
 
Maha Mauka Squarefeet Brochure |Maha Mauka Squarefeet PDF Brochure|
Maha Mauka Squarefeet Brochure |Maha Mauka Squarefeet PDF Brochure|Maha Mauka Squarefeet Brochure |Maha Mauka Squarefeet PDF Brochure|
Maha Mauka Squarefeet Brochure |Maha Mauka Squarefeet PDF Brochure|AkshayJoshi575980
 
Listing Turkey - Viva Perla Maltepe Catalog
Listing Turkey - Viva Perla Maltepe CatalogListing Turkey - Viva Perla Maltepe Catalog
Listing Turkey - Viva Perla Maltepe CatalogListing Turkey
 
Prestige Somerville Whitefield Bangalore E- Brochure.pdf
Prestige Somerville Whitefield Bangalore E- Brochure.pdfPrestige Somerville Whitefield Bangalore E- Brochure.pdf
Prestige Somerville Whitefield Bangalore E- Brochure.pdffaheemali990101
 
Shriram Hebbal One Kempapura Bangalore E- Brochure.pdf
Shriram Hebbal One Kempapura Bangalore E- Brochure.pdfShriram Hebbal One Kempapura Bangalore E- Brochure.pdf
Shriram Hebbal One Kempapura Bangalore E- Brochure.pdffaheemali990101
 
Brigade Neopolis Kokapet, Hyderabad E- Brochure
Brigade Neopolis Kokapet, Hyderabad E- BrochureBrigade Neopolis Kokapet, Hyderabad E- Brochure
Brigade Neopolis Kokapet, Hyderabad E- Brochurefaheemali990101
 
Prestige Sector 94 at Noida E Brochure.pdf
Prestige Sector 94 at Noida E Brochure.pdfPrestige Sector 94 at Noida E Brochure.pdf
Prestige Sector 94 at Noida E Brochure.pdfsarak0han45400
 
Listing Turkey Green life Istanbul Eyup Catalog
Listing Turkey Green life Istanbul Eyup CatalogListing Turkey Green life Istanbul Eyup Catalog
Listing Turkey Green life Istanbul Eyup CatalogListing Turkey
 
Pride Wonderland Dhanori Pune Brochure.pdf
Pride Wonderland Dhanori Pune Brochure.pdfPride Wonderland Dhanori Pune Brochure.pdf
Pride Wonderland Dhanori Pune Brochure.pdfabbu831446
 
The Role of Mortgage Brokers in Retirement Housing: Key Considerations
The Role of Mortgage Brokers in Retirement Housing: Key ConsiderationsThe Role of Mortgage Brokers in Retirement Housing: Key Considerations
The Role of Mortgage Brokers in Retirement Housing: Key Considerationssunlite Mortgage
 
Sobha Oakshire Devanhalli Bangalore.pdf.pdf
Sobha Oakshire Devanhalli Bangalore.pdf.pdfSobha Oakshire Devanhalli Bangalore.pdf.pdf
Sobha Oakshire Devanhalli Bangalore.pdf.pdfkratirudram
 
Provident Ecopolitan Aerospace Park, Bangalore E- Brochure.pdf
Provident Ecopolitan Aerospace Park, Bangalore E- Brochure.pdfProvident Ecopolitan Aerospace Park, Bangalore E- Brochure.pdf
Provident Ecopolitan Aerospace Park, Bangalore E- Brochure.pdffaheemali990101
 
Ganga Fusion 85 Gurugram - PDF Download.pdf
Ganga Fusion 85 Gurugram - PDF Download.pdfGanga Fusion 85 Gurugram - PDF Download.pdf
Ganga Fusion 85 Gurugram - PDF Download.pdfanjalisaini334541
 
Anandtara Iris Residences Mundhwa Pune Brochure.pdf
Anandtara Iris Residences Mundhwa Pune Brochure.pdfAnandtara Iris Residences Mundhwa Pune Brochure.pdf
Anandtara Iris Residences Mundhwa Pune Brochure.pdfabbu831446
 
LCAR Unit 22 - Leasing and Property Management - 14th Edition Revised.pptx
LCAR Unit 22 - Leasing and Property Management - 14th Edition Revised.pptxLCAR Unit 22 - Leasing and Property Management - 14th Edition Revised.pptx
LCAR Unit 22 - Leasing and Property Management - 14th Edition Revised.pptxTom Blefko
 
Prestige Sanctuary Nandi Hills Bangalore.pdf
Prestige Sanctuary Nandi Hills Bangalore.pdfPrestige Sanctuary Nandi Hills Bangalore.pdf
Prestige Sanctuary Nandi Hills Bangalore.pdfashiyadav24
 
What is Affordable Housing? Bristol Civic Society April 2024
What is Affordable Housing? Bristol Civic Society April 2024What is Affordable Housing? Bristol Civic Society April 2024
What is Affordable Housing? Bristol Civic Society April 2024Paul Smith
 

Recently uploaded (20)

LCAR Unit 20 - Appraising Real Estate - 14th Edition Revised
LCAR Unit 20 - Appraising Real Estate - 14th Edition RevisedLCAR Unit 20 - Appraising Real Estate - 14th Edition Revised
LCAR Unit 20 - Appraising Real Estate - 14th Edition Revised
 
Mana Dale Kodathi, Sarjapur Road, Bangalore E-Brochure.pdf
Mana Dale Kodathi, Sarjapur Road, Bangalore E-Brochure.pdfMana Dale Kodathi, Sarjapur Road, Bangalore E-Brochure.pdf
Mana Dale Kodathi, Sarjapur Road, Bangalore E-Brochure.pdf
 
LCAR Unit 21 - Closing the Real Estate Transaction - 14th Edition Revised
LCAR Unit 21 - Closing the Real Estate Transaction - 14th Edition RevisedLCAR Unit 21 - Closing the Real Estate Transaction - 14th Edition Revised
LCAR Unit 21 - Closing the Real Estate Transaction - 14th Edition Revised
 
LCAR Unit 19 - Financing the Real Estate Transaction - 14th Edition Revised
LCAR Unit 19 - Financing the Real Estate Transaction - 14th Edition RevisedLCAR Unit 19 - Financing the Real Estate Transaction - 14th Edition Revised
LCAR Unit 19 - Financing the Real Estate Transaction - 14th Edition Revised
 
Maha Mauka Squarefeet Brochure |Maha Mauka Squarefeet PDF Brochure|
Maha Mauka Squarefeet Brochure |Maha Mauka Squarefeet PDF Brochure|Maha Mauka Squarefeet Brochure |Maha Mauka Squarefeet PDF Brochure|
Maha Mauka Squarefeet Brochure |Maha Mauka Squarefeet PDF Brochure|
 
Listing Turkey - Viva Perla Maltepe Catalog
Listing Turkey - Viva Perla Maltepe CatalogListing Turkey - Viva Perla Maltepe Catalog
Listing Turkey - Viva Perla Maltepe Catalog
 
Prestige Somerville Whitefield Bangalore E- Brochure.pdf
Prestige Somerville Whitefield Bangalore E- Brochure.pdfPrestige Somerville Whitefield Bangalore E- Brochure.pdf
Prestige Somerville Whitefield Bangalore E- Brochure.pdf
 
Shriram Hebbal One Kempapura Bangalore E- Brochure.pdf
Shriram Hebbal One Kempapura Bangalore E- Brochure.pdfShriram Hebbal One Kempapura Bangalore E- Brochure.pdf
Shriram Hebbal One Kempapura Bangalore E- Brochure.pdf
 
Brigade Neopolis Kokapet, Hyderabad E- Brochure
Brigade Neopolis Kokapet, Hyderabad E- BrochureBrigade Neopolis Kokapet, Hyderabad E- Brochure
Brigade Neopolis Kokapet, Hyderabad E- Brochure
 
Prestige Sector 94 at Noida E Brochure.pdf
Prestige Sector 94 at Noida E Brochure.pdfPrestige Sector 94 at Noida E Brochure.pdf
Prestige Sector 94 at Noida E Brochure.pdf
 
Listing Turkey Green life Istanbul Eyup Catalog
Listing Turkey Green life Istanbul Eyup CatalogListing Turkey Green life Istanbul Eyup Catalog
Listing Turkey Green life Istanbul Eyup Catalog
 
Pride Wonderland Dhanori Pune Brochure.pdf
Pride Wonderland Dhanori Pune Brochure.pdfPride Wonderland Dhanori Pune Brochure.pdf
Pride Wonderland Dhanori Pune Brochure.pdf
 
The Role of Mortgage Brokers in Retirement Housing: Key Considerations
The Role of Mortgage Brokers in Retirement Housing: Key ConsiderationsThe Role of Mortgage Brokers in Retirement Housing: Key Considerations
The Role of Mortgage Brokers in Retirement Housing: Key Considerations
 
Sobha Oakshire Devanhalli Bangalore.pdf.pdf
Sobha Oakshire Devanhalli Bangalore.pdf.pdfSobha Oakshire Devanhalli Bangalore.pdf.pdf
Sobha Oakshire Devanhalli Bangalore.pdf.pdf
 
Provident Ecopolitan Aerospace Park, Bangalore E- Brochure.pdf
Provident Ecopolitan Aerospace Park, Bangalore E- Brochure.pdfProvident Ecopolitan Aerospace Park, Bangalore E- Brochure.pdf
Provident Ecopolitan Aerospace Park, Bangalore E- Brochure.pdf
 
Ganga Fusion 85 Gurugram - PDF Download.pdf
Ganga Fusion 85 Gurugram - PDF Download.pdfGanga Fusion 85 Gurugram - PDF Download.pdf
Ganga Fusion 85 Gurugram - PDF Download.pdf
 
Anandtara Iris Residences Mundhwa Pune Brochure.pdf
Anandtara Iris Residences Mundhwa Pune Brochure.pdfAnandtara Iris Residences Mundhwa Pune Brochure.pdf
Anandtara Iris Residences Mundhwa Pune Brochure.pdf
 
LCAR Unit 22 - Leasing and Property Management - 14th Edition Revised.pptx
LCAR Unit 22 - Leasing and Property Management - 14th Edition Revised.pptxLCAR Unit 22 - Leasing and Property Management - 14th Edition Revised.pptx
LCAR Unit 22 - Leasing and Property Management - 14th Edition Revised.pptx
 
Prestige Sanctuary Nandi Hills Bangalore.pdf
Prestige Sanctuary Nandi Hills Bangalore.pdfPrestige Sanctuary Nandi Hills Bangalore.pdf
Prestige Sanctuary Nandi Hills Bangalore.pdf
 
What is Affordable Housing? Bristol Civic Society April 2024
What is Affordable Housing? Bristol Civic Society April 2024What is Affordable Housing? Bristol Civic Society April 2024
What is Affordable Housing? Bristol Civic Society April 2024
 

Local real estate market continues strong spring surge

  • 1. Sarasota MLSSM Statistics - April 2011 Single Family Unit Sales Condo 700 600 500 400 300 200 100 0 Apr‐10 May‐10 Jun‐10 Jul‐10 Aug‐10 Sep‐10 Oct‐10 Nov‐10 Dec‐10 Jan‐11 Feb‐11 Mar‐11 Apr‐11 Single Family Median Sale Price Condo $250,000 $200,000 $150,000 $100,000 $50,000 $0 Apr‐10 May‐10 Jun‐10 Jul‐10 Aug‐10 Sep‐10 Oct‐10 Nov‐10 Dec‐10 Jan‐11 Feb‐11 Mar‐11 Apr‐11 Single Family    Average  Median  Median Last  Months  Pending  # New  # Off  #Active  #Sold  %Sold  %Pending  DOM  Sale Prices  12 Months  Inventory  Reported  Listings  Market  This  Month  3,321  533  16.0  169  $155,430  $158,000  6.2  687  20.7  512  166  This  Month  3,891  529  13.6  175  $165,000  $163,800  7.3  816  21.0  920  224  Last Year  Last  Month  3,486  580  16.6  183  $159,250  $159,950  6.0  889  25.5  523  176  YTD  ‐  2,020  ‐  176  $149,900  ‐  ‐  3,060  ‐  2,408  ‐      Single Family – Sale Price Vs. List Price % Rates   Jan  Feb  Mar  Apr  May  Jun  Jul  Aug  Sept  Oct  Nov  Dec  2010  94.4  92.8  95.2  94.8  95.2  95.3  94.7  95.2  94.6  95.2  94.8  94.1  2011  94.5  94.1  94.7  94.1  ‐  ‐  ‐  ‐  ‐  ‐  ‐  ‐    Statistics were compiled on properties listed in the MLS by members of the Sarasota Association of Realtors® as of May 10th, 2011, including some listings in Manatee, Englewood, Venice, and other areas. Single-family statistics are tabulated using property styles of single-family and villa. Condo statistics include condo, co-op, and townhouse. Source: Sarasota Association of Realtors® 16 JUNE 2011 Sarasota Realtor® Magazine www.sarasotarealtors.com
  • 2. Sarasota MLSSM Statistics - April 2011 Single Family Inventory Condo 5,000 4,000 3,000 2,000 1,000 0 Apr‐10 May‐10 Jun‐10 Jul‐10 Aug‐10 Sep‐10 Oct‐10 Nov‐10 Dec‐10 Jan‐11 Feb‐11 Mar‐11 Apr‐11 Single Family Pending Sales Condo 1000 900 800 700 600 500 400 300 200 100 0 Apr‐10 May‐10 Jun‐10 Jul‐10 Aug‐10 Sep‐10 Oct‐10 Nov‐10 Dec‐10 Jan‐11 Feb‐11 Mar‐11 Apr‐11 Condo    Average  Median Sale  Median Last  Months of Pending  # New  # Off  #Active  #Sold  %Sold  %Pending  DOM  Prices  12 Months  Inventory  Reported  Listings  Market  This  Month  1,937  226  11.7  230  $185,500  $160,000  8.6  272  14.0  224  197  This  Month  2,269  228  10.0  203  $193,175  $192,000  9.9  344  15.2  354  212  Last Year  Last  Month  2,015  220  10.9  195  $173,000  $160,000  9.2  319  15.8  280  212  YTD  ‐  821  ‐  211  $165,000  ‐  ‐  1,043  ‐  1,150  ‐    Condo – Sale Price Vs. List Price % Rates   Jan  Feb  Mar  Apr  May  Jun  Jul  Aug  Sept  Oct  Nov  Dec  2010  92.5  92.4  92.5  93.2  94.2  93.7  94.2  93.5  93.2  94.3  94.5  92.9  2011  93.4  91.2  92.2  93.4  ‐  ‐  ‐  ‐  ‐  ‐  ‐  ‐    Median sales price is the middle value, where half of the homes sold for more, and half sold for less. Listings sold were closed transac- tions during the month. Pending sales are sales where an offer has been accepted during the month, but the sale has not yet closed. Even though some pending sales never close, pending sales are an indicator of current buyer activity. DOM indicates the average number of days that sold properties were on the market before a contract was executed. Sarasota Association of Realtors® MLS www.sarasotarealtors.com Sarasota Realtor® Magazine JUNE 2011 17
  • 3. Single Family Days on Market The Xtra Pages - Digital Version Only Condo 250 200 150 100 50 0 Apr‐10 May‐10 Jun‐10 Jul‐10 Aug‐10 Sep‐10 Oct‐10 Nov‐10 Dec‐10 Jan‐11 Feb‐11 Mar‐11 Apr‐11 Single Family New Listings Condo 1,000 900 800 700 600 500 400 300 200 100 0 Apr‐10 May‐10 Jun‐10 Jul‐10 Aug‐10 Sep‐10 Oct‐10 Nov‐10 Dec‐10 Jan‐11 Feb‐11 Mar‐11 Apr‐11 Single Family Months of Inventory Condo 18 16 14 12 10 8 6 4 2 0 Apr‐10 May‐10 Jun‐10 Jul‐10 Aug‐10 Sep‐10 Oct‐10 Nov‐10 Dec‐10 Jan‐11 Feb‐11 Mar‐11 Apr‐11 Single Family Sales Volume Condo $200,000,000  $180,000,000  $160,000,000  $140,000,000  $120,000,000  $100,000,000  Sarasota Association of Realtors® MLS $80,000,000  $60,000,000  $40,000,000  $20,000,000  $0  Apr‐10 May‐10 Jun‐10 Jul‐10 Aug‐10 Sep‐10 Oct‐10 Nov‐10 Dec‐10 Jan‐11 Feb‐11 Mar‐11 Apr‐11
  • 4. First Quarter 2011 Report Single Family Sales ‐ By Quarter REO Short Arm's Length 1000 800 600 400 200 0 2008‐Q3 2008‐Q4 2009‐Q1 2009‐Q2 2009‐Q3 2009‐Q4 2010‐Q1 2010‐Q2 2010‐Q3 2010‐Q4 2011‐Q1 * Homebuyer Tax Credit In Effect Condo Sales ‐ By Quarter REO Short Arm's Length 500 400 300 200 100 0 2008‐Q3 2008‐Q4 2009‐Q1 2009‐Q2 2009‐Q3 2009‐Q4 2010‐Q1 2010‐Q2 2010‐Q3 2010‐Q4 2011‐Q1 * Homebuyer Tax Credit In Effect Single Family Median Sale Price REO Short Arm's Length $300,000  $250,000  $200,000  $150,000  $100,000  $50,000  $0  2008‐3rdQ 2008‐4thQ 2009‐1stQ 2009‐2ndQ 2009‐3rdQ 2009‐4thQ 2010‐Q1 2010‐Q2 2010‐Q3 2010‐Q4 2011‐Q1 Condo Median Sale Price REO Short Arm's Length $350,000  $300,000  $250,000  $200,000  $150,000  $100,000  Source: Sarasota Association of Realtors® $50,000  $0  2008‐3rdQ 2008‐4thQ 2009‐1stQ 2009‐2ndQ 2009‐3rdQ 2009‐4thQ 2010‐Q1 2010‐Q2 2010‐Q3 2010‐Q4 2011‐Q1
  • 5. Single Family REO Sales ‐ By Quarter Condo 600 500 400 300 200 100 0 2008‐Q1 2008‐Q2 2008‐Q3 2008‐Q4 2009‐Q1 2009‐Q2 2009‐Q3 2009‐Q4 2010‐Q1 2010‐Q2 2010‐Q3 2010‐Q4 2011‐Q1 * Homebuyer Tax Credit In Effect Single Family Short Sales ‐ By Quarter Condo 400 350 300 250 200 150 100 50 0 2008‐Q3 2008‐Q4 2009‐Q1 2009‐Q2 2009‐Q3 2009‐Q4 2010‐Q1 2010‐Q2 2010‐Q3 2010‐Q4 2011‐Q1 * Homebuyer Tax Credit In Effect Single Family Arm's Length Sales ‐ By Quarter Condo 1000 800 600 400 200 0 2008‐Q3 2008‐Q4 2009‐Q1 2009‐Q2 2009‐Q3 2009‐Q4 2010‐Q1 2010‐Q2 2010‐Q3 2010‐Q4 2011‐Q1 * Homebuyer Tax Credit In Effect Source: Sarasota Association of Realtors®
  • 6. Annual Sales ‐ 2000 to 2010 Single Family Condo Total 11267 10562 9697 8167 7,596 7603 7036 6,841 6533 6739 6,504 6358 6042 5820 5,603 5,466 5,183 4,940 4,626 4,349 4,353 3,721 3,922 3,671 3,193 2,564 2,184 2,096 2,005 2,120 2,137 1,556 1,194 2000 2001 2002 2003 2004 2005 2006 2007 2008 2009 2010 Annual Median Sale Price ‐ 2000 to 2010  Condo Single Family $351,000 $342,000 $336,250 $320,000 $272,500 $301,225 $305,000 $226,000 $225,000 $303,000 $191,000 $210,000 $172,500 $191,000 $230,000 $163,000 $142,000 $173,000 $145,000 $160,000 $163,000 $132,300 2000 2001 2002 2003 2004 2005 2006 2007 2008 2009 2010