1. Sarasota MLSSM Statistics - June 2012
Single Family
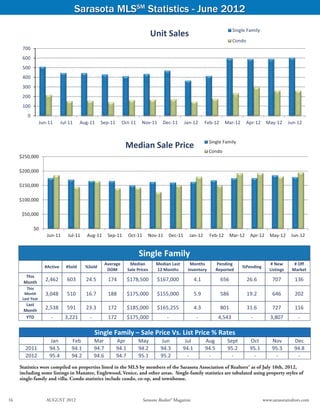
Unit Sales
Condo
700
600
500
400
300
200
100
0
Jun‐11 Jul‐11 Aug‐11 Sep‐11 Oct‐11 Nov‐11 Dec‐11 Jan‐12 Feb‐12 Mar‐12 Apr‐12 May‐12 Jun‐12
Single Family
Median Sale Price
Condo
$250,000
$200,000
$150,000
$100,000
$50,000
$0
Jun‐11 Jul‐11 Aug‐11 Sep‐11 Oct‐11 Nov‐11 Dec‐11 Jan‐12 Feb‐12 Mar‐12 Apr‐12 May‐12 Jun‐12
Single Family
Average Median Median Last Months Pending # New # Off
#Active #Sold %Sold %Pending
DOM Sale Prices 12 Months Inventory Reported Listings Market
This
Month
2,462 603 24.5 174 $178,500 $167,000 4.1 656 26.6 707 136
This
Month 3,048 510 16.7 188 $175,000 $155,000 5.9 586 19.2 646 202
Last Year
Last
Month
2,538 591 23.3 172 $185,000 $165,255 4.3 801 31.6 727 116
YTD ‐ 3,221 ‐ 172 $175,000 ‐ ‐ 4,543 ‐ 3,807 ‐
Single Family – Sale Price Vs. List Price % Rates
Jan Feb Mar Apr May Jun Jul Aug Sept Oct Nov Dec
2011 94.5 94.1 94.7 94.1 94.2 94.3 94.1 94.5 95.2 95.1 95.3 94.8
2012 95.4 94.2 94.6 94.7 95.1 95.2 ‐ ‐ ‐ ‐ ‐ ‐
Statistics were compiled on properties listed in the MLS by members of the Sarasota Association of Realtors® as of July 10th, 2012,
including some listings in Manatee, Englewood, Venice, and other areas. Single-family statistics are tabulated using property styles of
single-family and villa. Condo statistics include condo, co-op, and townhouse.
Source: Sarasota Association of Realtors®
16 AUGUST 2012 Sarasota Realtor® Magazine www.sarasotarealtors.com
2. Sarasota MLSSM Statistics - June 2012
Single Family
Inventory Condo
3,500
3,000
2,500
2,000
1,500
1,000
500
0
Jun‐11 Jul‐11 Aug‐11 Sep‐11 Oct‐11 Nov‐11 Dec‐11 Jan‐12 Feb‐12 Mar‐12 Apr‐12 May‐12 Jun‐12
Single Family
Pending Sales Condo
900
800
700
600
500
400
300
200
100
0
Jun‐11 Jul‐11 Aug‐11 Sep‐11 Oct‐11 Nov‐11 Dec‐11 Jan‐12 Feb‐12 Mar‐12 Apr‐12 May‐12 Jun‐12
Condo
Average Median Sale Median Last Months of Pending # New # Off
#Active #Sold %Sold %Pending
DOM Prices 12 Months Inventory Reported Listings Market
This
Month
1,354 261 19.3 221 $195,000 $165,000 5.2 204 15.0 258 162
This
Month 1,782 218 12.2 231 $185,000 $162,000 8.2 168 9.4 248 231
Last Year
Last
Month
1,379 263 19.1 180 $180,750 $160,000 5.2 274 19.9 248 155
YTD ‐ 1,397 ‐ 199 $184,000 ‐ ‐ 1,744 ‐ 1,868 ‐
Condo – Sale Price Vs. List Price % Rates
Jan Feb Mar Apr May Jun Jul Aug Sept Oct Nov Dec
2011 93.4 91.2 92.2 93.4 94.5 94.2 92.5 93.1 92.8 93.2 93.6 92.7
2012 93.1 93.5 94.2 94.3 93.8 93.8 ‐ ‐ ‐ ‐ ‐ ‐
Median sales price is the middle value, where half of the homes sold for more, and half sold for less. Listings sold were closed
transactions during the month. Pending sales are sales where an offer has been accepted during the month, but the sale has not yet
closed. Even though some pending sales never close, pending sales are an indicator of current buyer activity. DOM indicates the average
number of days that sold properties were on the market before a contract was executed.
Sarasota Association of Realtors® MLS
www.sarasotarealtors.com Sarasota Realtor® Magazine AUGUST 2012 17
3. The Xtra Pages - Digital Version Only
Single Family
Months of Inventory Condo
12.0
10.0
8.0
6.0
4.0
2.0
0.0
Jun‐11 Jul‐11 Aug‐11 Sep‐11 Oct‐11 Nov‐11 Dec‐11 Jan‐12 Feb‐12 Mar‐12 Apr‐12 May‐12 Jun‐12
Single Family
Days on Market
Condo
300
250
200
150
100
50
0
Jun‐11 Jul‐11 Aug‐11 Sep‐11 Oct‐11 Nov‐11 Dec‐11 Jan‐12 Feb‐12 Mar‐12 Apr‐12 May‐12 Jun‐12
Single Family
Sales Volume Condo
$200,000,000
$180,000,000
$160,000,000
$140,000,000
$120,000,000
$100,000,000
$80,000,000
$60,000,000
$40,000,000
$20,000,000
$0
Jun‐11 Jul‐11 Aug‐11 Sep‐11 Oct‐11 Nov‐11 Dec‐11 Jan‐12 Feb‐12 Mar‐12 Apr‐12 May‐12 Jun‐12
New Listings Single Family
Condo
900
800
700
600
500
400
Sarasota Association of Realtors® MLS
300
200
100
0
Jun‐11 Jul‐11 Aug‐11 Sep‐11 Oct‐11 Nov‐11 Dec‐11 Jan‐12 Feb‐12 Mar‐12 Apr‐12 May‐12 Jun‐12
4. Second Quarter 2012 Report
Single Family Sales ‐ By Quarter REO Short Market
1400
1200
1000
800
600
400
200
0
2009‐Q4 2010‐Q1 2010‐Q2* 2010‐Q3 2010‐Q4 2011‐Q1 2011‐Q2 2011‐Q3 2011‐Q4 2012‐Q1 2012‐Q2
* Homebuyer Tax Credit In Effect
Condo Sales ‐ By Quarter REO Short Market
700
600
500
400
300
200
100
0
2009‐Q4 2010‐Q1 2010‐Q2* 2010‐Q3 2010‐Q4 2011‐Q1 2011‐Q2 2011‐Q3 2011‐Q4 2012‐Q1 2012‐Q2
* Homebuyer Tax Credit In Effect
Single Family Median Sale Price REO Short Market
$300,000
$250,000
$200,000
$150,000
$100,000
$50,000
$0
2009‐Q4 2010‐Q1 2010‐Q2 2010‐Q3 2010‐Q4 2011‐Q1 2011‐Q2 2011‐Q3 2011‐Q4 2012‐Q1 2012‐Q2
Condo Median Sale Price REO Short Market
$300,000
$250,000
$200,000 Source: Sarasota Association of Realtors®
$150,000
$100,000
$50,000
$0
2009‐Q4 2010‐Q1 2010‐Q2 2010‐Q3 2010‐Q4 2011‐Q1 2011‐Q2 2011‐Q3 2011‐Q4 2012‐Q1 2012‐Q2
5. Single Family
REO Sales ‐ By Quarter Condo
600
500
400
300
200
100
0
2009‐Q4 2010‐Q1 2010‐Q2* 2010‐Q3 2010‐Q4 2011‐Q1 2011‐Q2 2011‐Q3 2011‐Q4 2012‐Q1 2012‐Q2
* Homebuyer Tax Credit In Effect
Single Family
Short Sales ‐ By Quarter
Condo
400
350
300
250
200
150
100
50
0
2009‐Q4 2010‐Q1 2010‐Q2* 2010‐Q3 2010‐Q4 2011‐Q1 2011‐Q2 2011‐Q3 2011‐Q4 2012‐Q1 2012‐Q2
* Homebuyer Tax Credit In Effect
Single Family
Market Sales ‐ By Quarter Condo
1400
1200
1000
800
600
400
200
0
2009‐Q4 2010‐Q1 2010‐Q2* 2010‐Q3 2010‐Q4 2011‐Q1 2011‐Q2 2011‐Q3 2011‐Q4 2012‐Q1 2012‐Q2
* Homebuyer Tax Credit In Effect
Source: Sarasota Association of Realtors®