Enviar pesquisa
Carregar
Loading analysis tool pak on your computer
•
0 gostou
•
330 visualizações
S
Sandra Nicks
Seguir
Tecnologia
Denunciar
Compartilhar
Denunciar
Compartilhar
1 de 2
Baixar agora
Baixar para ler offline
Recomendados
Lesson 14 Using Templates
guevarra_2000
The possibility of losing files to a computer crash can be unnerving, but worry no more. Excel 2016 offers a document recovery feature that can help you avoid the headache of losing documents in the event of a computer crash.
Excel Document Recovery to the Rescue
Wiley
Excel basics sofia pau y monyu
ssofiamartinez
Lesson 1 setting up excel environment
guevarra_2000
Learn With Me!
Productivity tool microsoftexcel
NatashaSilorio
Home Economics
Multiply-and-divide-in-excel
Ria Lopez (Reservist)(ms.Education)
Windows XP
Windows xp stack
Windows xp stack
Lisa Stack
Windows xp
Windows xp
sumatipuri
Chapters 2 & 4
Chapters 2 & 4
Sandra Nicks
Chapter excerpt explaining the null hypothesis
Null hypothesis
Null hypothesis
Sandra Nicks
Chapter 2 PowerPoint (revised)
Aron chpt 2
Aron chpt 2
Sandra Nicks
Descriptive statistics
Sandra Nicks
Calculating binomial probabilities using excel
Sandra Nicks
Aron chpt 6 ed revised
Sandra Nicks
Aron chpt 8 ed
Aron chpt 8 ed
Sandra Nicks
Newletter v 2.1
Newletter v 2.1
Sandra Nicks
Chapters 2 4
Chapters 2 4
Sandra Nicks
Histograms
Histograms
Sandra Nicks
Ncicu 2010 presentation
Sandra Nicks
Aron chpt 9 ed f2011
Sandra Nicks
Using excel to for descriptive statistics
Sandra Nicks
Aron chpt 5 ed revised
Sandra Nicks
Loading analysis tool pak on your computer
Sandra Nicks
Chap004
Chap004
Sandra Nicks
Chap006
Chap006
Sandra Nicks
Aron chpt 1 ed
Aron chpt 1 ed
Sandra Nicks
Chap003
Chap003
Sandra Nicks
Chap005
Chap005
Sandra Nicks
WelcomeWelcome!Please read this page (in particular) very carefully.InstructionsYou need to understand how to send your assignments (deliverables)to your instructor. The tabs (bottom of each sheet) in thisdocument contain all of the deliverables expected of you.If you need help along the way, look for these special cells that have a red indicatorin the corner. It looks like the "Read me" box to the right:Read meSimply slide your cursor over the red-cornered cell and you will get more information.The format for all of the deliverables is the same:The 'objective' is in black font. It describes what you are doing the particular deliverable.The next segment is in green font. These are your instructions.The blue font is the data (where applicable) that you will need to complete the deliverable.SoftwareWe are using Excel software for the projects. You may use other softwareto complete your projects, but please 'report' your answers in the Excel formatdescribed below.You may complete your assignments with any version of Excel software.All assignments can easily be completed with a basic copy of Excel.There is also an Add-In feature which is available for Excel that can be helpful,although it is not required. The Add-In feature comes free with each Excel package,although it may not be currently loaded into your copy of Excel.Following are the simple instruction for loading the Excel Add-ins for both Excel 2003and Excel 2007. (Slide your cursor over the red-cornered cells to read)Excel 2003Excel 2007Excel Novice - Please readProject TimelineDeliverables include:Project charter (target week 3 or sooner)SIPOC (week 4 or sooner)Baseline sigma (week 5 or sooner)Pareto chart (week 6 or sooner)Process analysis (week 7 or sooner)Stem & leaf (week 9 or sooner)DOE (week 12 or sooner)Scatter diagram (week 13 or sooner)Control chart (XmR) ( week 14 or sooner)Pp Ppk (week 15 or sooner)How to submit an AssignmentIn response to customers like you, we have added a peach-colored boxfor each deliverable. We have done this to make it clear (and consistent) theareas of the project that will be reviewed to your instructor.Project:Healthcare ProjectDeliverable:Improve phase - gen. sol.Student last name:JohnsonWhat is the control chart telling you?There is a point out of control at subgroup #15. I would try to figure out why that happened. We would also recalculate the control limits because there is evidence the process has changed.What is the average of subgroup 1?22What is the average of subgroup 2?34What is the average of subgroup 3?23What is the average of subgroup 4?22What is the average of subgroup 5?25What is the average of subgroup 6?23What is the average of subgroup 7?29What is the average of subgroup 8?27Read this!To send each assignment to your instructor:Click-and-hold the LEFT mouse button at the TOP-LEFT corner of thepeach-colored box, then while holding down on that button, drag tothe LOWER-RIGHT corner of the box. This will highlight the entir.
WelcomeWelcome!Please read this page (in particular) very carefull.docx
alanfhall8953
Steps for installation analysis too
Steps for installation analysis tool
IIUM
Mais conteúdo relacionado
Destaque
Chapters 2 & 4
Chapters 2 & 4
Sandra Nicks
Chapter excerpt explaining the null hypothesis
Null hypothesis
Null hypothesis
Sandra Nicks
Chapter 2 PowerPoint (revised)
Aron chpt 2
Aron chpt 2
Sandra Nicks
Descriptive statistics
Sandra Nicks
Calculating binomial probabilities using excel
Sandra Nicks
Aron chpt 6 ed revised
Sandra Nicks
Aron chpt 8 ed
Aron chpt 8 ed
Sandra Nicks
Newletter v 2.1
Newletter v 2.1
Sandra Nicks
Chapters 2 4
Chapters 2 4
Sandra Nicks
Histograms
Histograms
Sandra Nicks
Ncicu 2010 presentation
Sandra Nicks
Aron chpt 9 ed f2011
Sandra Nicks
Using excel to for descriptive statistics
Sandra Nicks
Aron chpt 5 ed revised
Sandra Nicks
Loading analysis tool pak on your computer
Sandra Nicks
Chap004
Chap004
Sandra Nicks
Chap006
Chap006
Sandra Nicks
Aron chpt 1 ed
Aron chpt 1 ed
Sandra Nicks
Chap003
Chap003
Sandra Nicks
Chap005
Chap005
Sandra Nicks
Destaque
(20)
Chapters 2 & 4
Chapters 2 & 4
Null hypothesis
Null hypothesis
Aron chpt 2
Aron chpt 2
Descriptive statistics
Calculating binomial probabilities using excel
Aron chpt 6 ed revised
Aron chpt 8 ed
Aron chpt 8 ed
Newletter v 2.1
Newletter v 2.1
Chapters 2 4
Chapters 2 4
Histograms
Histograms
Ncicu 2010 presentation
Aron chpt 9 ed f2011
Using excel to for descriptive statistics
Aron chpt 5 ed revised
Loading analysis tool pak on your computer
Chap004
Chap004
Chap006
Chap006
Aron chpt 1 ed
Aron chpt 1 ed
Chap003
Chap003
Chap005
Chap005
Semelhante a Loading analysis tool pak on your computer
WelcomeWelcome!Please read this page (in particular) very carefully.InstructionsYou need to understand how to send your assignments (deliverables)to your instructor. The tabs (bottom of each sheet) in thisdocument contain all of the deliverables expected of you.If you need help along the way, look for these special cells that have a red indicatorin the corner. It looks like the "Read me" box to the right:Read meSimply slide your cursor over the red-cornered cell and you will get more information.The format for all of the deliverables is the same:The 'objective' is in black font. It describes what you are doing the particular deliverable.The next segment is in green font. These are your instructions.The blue font is the data (where applicable) that you will need to complete the deliverable.SoftwareWe are using Excel software for the projects. You may use other softwareto complete your projects, but please 'report' your answers in the Excel formatdescribed below.You may complete your assignments with any version of Excel software.All assignments can easily be completed with a basic copy of Excel.There is also an Add-In feature which is available for Excel that can be helpful,although it is not required. The Add-In feature comes free with each Excel package,although it may not be currently loaded into your copy of Excel.Following are the simple instruction for loading the Excel Add-ins for both Excel 2003and Excel 2007. (Slide your cursor over the red-cornered cells to read)Excel 2003Excel 2007Excel Novice - Please readProject TimelineDeliverables include:Project charter (target week 3 or sooner)SIPOC (week 4 or sooner)Baseline sigma (week 5 or sooner)Pareto chart (week 6 or sooner)Process analysis (week 7 or sooner)Stem & leaf (week 9 or sooner)DOE (week 12 or sooner)Scatter diagram (week 13 or sooner)Control chart (XmR) ( week 14 or sooner)Pp Ppk (week 15 or sooner)How to submit an AssignmentIn response to customers like you, we have added a peach-colored boxfor each deliverable. We have done this to make it clear (and consistent) theareas of the project that will be reviewed to your instructor.Project:Healthcare ProjectDeliverable:Improve phase - gen. sol.Student last name:JohnsonWhat is the control chart telling you?There is a point out of control at subgroup #15. I would try to figure out why that happened. We would also recalculate the control limits because there is evidence the process has changed.What is the average of subgroup 1?22What is the average of subgroup 2?34What is the average of subgroup 3?23What is the average of subgroup 4?22What is the average of subgroup 5?25What is the average of subgroup 6?23What is the average of subgroup 7?29What is the average of subgroup 8?27Read this!To send each assignment to your instructor:Click-and-hold the LEFT mouse button at the TOP-LEFT corner of thepeach-colored box, then while holding down on that button, drag tothe LOWER-RIGHT corner of the box. This will highlight the entir.
WelcomeWelcome!Please read this page (in particular) very carefull.docx
alanfhall8953
Steps for installation analysis too
Steps for installation analysis tool
IIUM
Loading addinsinexcel2007 2010
5632010023
VBA
VBA
Raghu nath
The projectAboveWay Sandwich - ProjectYou are a Master Black Belt working with AboveWay Sandwich, Inc. to improve the franchises' customer satisfaction. The process is simple.Your assignment is to improve customer satisfaction by working with variousGreen Belts and Black Belts. To successfully pass the course, you must complete all of the deliverables (tabs below) to the satisfaction of your instructor. Select Bread Assemble Wrap and Pay Excel examplesHow you can use Excel This spreadsheet tab provides illustrations of adding the DATA ANALYSIS capability to your Excel software.If you see Data Analysis already listed under the Tools tab, you are set. If you do not see Data Analysisfollow the instructions in the Green tab.Excel 2003 instructions Diane Johnson: Instructor Excel 2003: Click on the TOOLS tab in the top bar of Excel. If your computer already has the “Data Analysis” option listed, you are ready to go. Your Data Analysis tools have already been added. Under the Data Analysis Function you will find some of the more advanced functions that we will be discussing such as ANOVAs, and t tests. If you do not see Data Analysis listed under the TOOLS tab, I encourage you to go to the Help function in Excel for specific instructions on how to load “the Data Analysis Toolpak” in your version of Excel. Here are the easy standard instructions for Excel 2003 if you need to load the Add-Ins. 1) On the Tools menu, click Add-Ins. 2) In the Add-Ins available box, select the check box next to Analysis Toolpak, and then click OK. 3) When you load the Analysis Toolpak, the DATA ANALYSIS command is automatically added to the TOOLS menu. If your version if slightly different than the above, refer to your HELP function for details on loading Tookpak. Remember that the Data Analysis function is NOT necessary for the course, but it is helpful. If you would like to print this tip, right click on the cell and select EDIT COMMENT. Then just highlight and copy the text, and paste in a document for printing.Excel 2003 or earlier versions of Excel exampleThis spreadsheet tab provides illustrations of adding the DATA ANALYSIS capability to your 2007 Excel software.If you see Data Analysis already listed under the DATA tab, you are set. If you do not see Data Analysisfollow the instructions in the Green tab.Excel 2007 instructions Diane Johnson: Instructor Excel 2007: The Analysis ToolPak is a Microsoft Office Excel add-in program that is available when you install Microsoft Office or Excel. To use it in Excel, however, you need to load it first. 1. Click the Microsoft Office Button , and then click Excel Options at the bottom. 2. Click Add-Ins, and then in the Manage box, select Excel Add-ins. 3. Click Go. 4. In the Add-Ins available box, select the Analysis ToolPak check box, and then click OK. If you get prompted that the Analysis ToolPak is not currently installed on your computer, click Yes to install it. 5. After you load t ...
The projectAboveWay Sandwich - ProjectYou are a Master Black Belt .docx
ssusera34210
This site provides illustrative experience in the use of Excel for data summary, presentation, and for other basic statistical analysis. I believe the popular use of Excel is on the areas where Excel really can excel. This includes organizing data, i.e. basic data management, tabulation and graphics. For real statistical analysis on must learn using the professional commercial statistical packages such as SAS, and SPSS. Microsoft Excel 2000 (version 9) provides a set of data analysis tools called the Analysis ToolPak which you can use to save steps when you develop complex statistical analyses. You provide the data and parameters for each analysis; the tool uses the appropriate statistical macro functions and then displays the results in an output table. Some tools generate charts in addition to output tables. If the Data Analysis command is selectable on the Tools menu, then the Analysis ToolPak is installed on your system. However, if the Data Analysis command is not on the Tools menu, you need to install the Analysis ToolPak by doing the following: Step 1: On the Tools menu, click Add-Ins.... If Analysis ToolPak is not listed in the Add-Ins dialog box, click Browse and locate the drive, folder name, and file name for the Analysis ToolPak Add-in — Analys32.xll — usually located in the Program Files\\Microsoft Office\\Office\\Library\\Analysis folder. Once you find the file, select it and click OK. Step 2: If you don\'t find the Analys32.xll file, then you must install it. Insert your Microsoft Office 2000 Disk 1 into the CD ROM drive. Select Run from the Windows Start menu. Browse and select the drive for your CD. Select Setup.exe, click Open, and click OK. Click the Add or Remove Features button. Click the + next to Microsoft Excel for Windows. Click the + next to Add-ins. Click the down arrow next to Analysis ToolPak. Select Run from My Computer. Select the Update Now button. Excel will now update your system to include Analysis ToolPak. Launch Excel. On the Tools menu, click Add-Ins... - and select the Analysis ToolPak check box. Step 3: The Analysis ToolPak Add-In is now installed and Data Analysis... will now be selectable on the Tools menu. Microsoft Excel is a powerful spreadsheet package available for Microsoft Windows and the Apple Macintosh. Spreadsheet software is used to store information in columns and rows which can then be organized and/or processed. Spreadsheets are designed to work well with numbers but often include text. Excel organizes your work into workbooks; each workbook can contain many worksheets; worksheets are used to list and analyze data . Excel is available on all public-access PCs (i.e., those, e.g., in the Library and PC Labs). It can be opened either by selecting Start - Programs - Microsoft Excel or by clicking on the Excel Short Cut which is either on your desktop, or on any PC, or on the Office Tool bar. Opening a Document: Click on File-Open (Ctrl+O) to open/retrieve an existing workbook; change the d.
This site provides illustrative experience in the use of Excel for d.pdf
anitasahani11
The VB6 IDE (Integrated Development Environment) is a very simple and fully featured IDE. If you start out programming in VB6 you may end up being too spoiled to ever appreciate a more complicated and less functional IDE like most C++ IDEs. One feature which sets VB6 apart from various IDEs is the simplicity of its approach to GUI (Graphical User Interface) design. As a general rule: Play with it. You're very unlikely to break anything that matters, so just explore and experiment with the IDE, and you'll learn more.
INTRODUCTION TO VISUAL BASICS
Prof Ansari
Adobe Illustrator CS5 is used to create graphics and type in vector format. Vector graphics are made up of points, lines, and curves that are defined by mathematical equations. Vector graphics are resolution independent, which means that they can be resized to any size without losing quality. This handout provides an overview of the Illustrator CS5 user interface and vector graphics, and covers how to create different shapes using the Pen tool. If you would like to see more videos on Adobe Illustrator, please visit http://www.youtube.com/mycsula for more online training. There you can find FREE tutorials on Illustrator, Photoshop, Microsoft Office, HTML5, and many more!
Adobe Illustrator CS5 Part 1 : Introduction to Illustrator
csula its training
Get the best Microsoft Teams Employee Onboarding Guide for your business. Read the guide to know how microsoft teams add ins can help in improving employee onboarding
Microsoft teams employee onboarding
Parag Rege
Basic Tutorial Data Analysis Software for Flow Cytometry
Lesson 1 Basic Tutorial Data Analysis Software for Flow Cytometry
Uttam Belbase
Adding AutoAssign to Excel
kdjbfksdjbf2
hi
En dassault-systems generative-assembly_structural_analysis
do anh
Remove maps galaxy toolbar – uninstall tutorial
webpub
Semelhante a Loading analysis tool pak on your computer
(13)
WelcomeWelcome!Please read this page (in particular) very carefull.docx
Steps for installation analysis tool
Loading addinsinexcel2007 2010
VBA
VBA
The projectAboveWay Sandwich - ProjectYou are a Master Black Belt .docx
This site provides illustrative experience in the use of Excel for d.pdf
INTRODUCTION TO VISUAL BASICS
Adobe Illustrator CS5 Part 1 : Introduction to Illustrator
Microsoft teams employee onboarding
Lesson 1 Basic Tutorial Data Analysis Software for Flow Cytometry
Adding AutoAssign to Excel
En dassault-systems generative-assembly_structural_analysis
Remove maps galaxy toolbar – uninstall tutorial
Mais de Sandra Nicks
Newletter v 2.1
Newletter v 2.1
Sandra Nicks
Night owl
Night owl
Sandra Nicks
Simple random sample using excel
Sandra Nicks
Chap015
Chap015
Sandra Nicks
Chap010
Chap010
Sandra Nicks
Chap009
Chap009
Sandra Nicks
Chap007
Chap007
Sandra Nicks
Finding areas for z using excel
Sandra Nicks
Chap008
Chap008
Sandra Nicks
Chap004
Chap004
Sandra Nicks
Creating frequency distribution table, histograms and polygons using excel an...
Sandra Nicks
Creating frequency distribution tables and histograms using excel analysis to...
Sandra Nicks
Chap002
Chap002
Sandra Nicks
Aron chpt 1 ed (1)
Aron chpt 1 ed (1)
Sandra Nicks
Aronchpt3correlation
Sandra Nicks
Calculating a correlation coefficient and scatter plot using excel
Sandra Nicks
Using excel to convert raw score to z score
Sandra Nicks
Chapters 2 & 4
Chapters 2 & 4
Sandra Nicks
Chap001
Chap001
Sandra Nicks
Ncair summer drive in creating a google site
Sandra Nicks
Mais de Sandra Nicks
(20)
Newletter v 2.1
Newletter v 2.1
Night owl
Night owl
Simple random sample using excel
Chap015
Chap015
Chap010
Chap010
Chap009
Chap009
Chap007
Chap007
Finding areas for z using excel
Chap008
Chap008
Chap004
Chap004
Creating frequency distribution table, histograms and polygons using excel an...
Creating frequency distribution tables and histograms using excel analysis to...
Chap002
Chap002
Aron chpt 1 ed (1)
Aron chpt 1 ed (1)
Aronchpt3correlation
Calculating a correlation coefficient and scatter plot using excel
Using excel to convert raw score to z score
Chapters 2 & 4
Chapters 2 & 4
Chap001
Chap001
Ncair summer drive in creating a google site
Último
AXA XL - Insurer Innovation Award 2024
AXA XL - Insurer Innovation Award Americas 2024
The Digital Insurer
Terragrunt, Terraspace, Terramate, terra... whatever. What is wrong with Terraform so people keep on creating wrappers and solutions around it? How OpenTofu will affect this dynamic? In this presentation, we will look into the fundamental driving forces behind a zoo of wrappers. Moreover, we are going to put together a wrapper ourselves so you can make an educated decision if you need one.
AWS Community Day CPH - Three problems of Terraform
Andrey Devyatkin
DBX 1Q24 Investor Presentation
DBX First Quarter 2024 Investor Presentation
Dropbox
As privacy and data protection regulations evolve rapidly, organizations operating in multiple jurisdictions face mounting challenges to ensure compliance and safeguard customer data. With state-specific privacy laws coming up in multiple states this year, it is essential to understand what their unique data protection regulations will require clearly. How will data privacy evolve in the US in 2024? How to stay compliant? Our panellists will guide you through the intricacies of these states' specific data privacy laws, clarifying complex legal frameworks and compliance requirements. This webinar will review: - The essential aspects of each state's privacy landscape and the latest updates - Common compliance challenges faced by organizations operating in multiple states and best practices to achieve regulatory adherence - Valuable insights into potential changes to existing regulations and prepare your organization for the evolving landscape
TrustArc Webinar - Stay Ahead of US State Data Privacy Law Developments
TrustArc
This reviewer is for the second quarter of Empowerment Technology / ICT in Grade 11
EMPOWERMENT TECHNOLOGY GRADE 11 QUARTER 2 REVIEWER
MadyBayot
Manulife - Insurer Transformation Award 2024
The Digital Insurer
Scalable LLM APIs for AI and Generative AI Application Development Ettikan Karuppiah, Director/Technologist - NVIDIA Apidays Singapore 2024: Connecting Customers, Business and Technology (April 17 & 18, 2024) ------ Check out our conferences at https://www.apidays.global/ Do you want to sponsor or talk at one of our conferences? https://apidays.typeform.com/to/ILJeAaV8 Learn more on APIscene, the global media made by the community for the community: https://www.apiscene.io Explore the API ecosystem with the API Landscape: https://apilandscape.apiscene.io/
Apidays Singapore 2024 - Scalable LLM APIs for AI and Generative AI Applicati...
apidays
Sidekick Solutions uses Bonterra Impact Management (fka Social Solutions Apricot) and automation solutions to integrate data for business workflows. We believe integration and automation are essential to user experience and the promise of efficient work through technology. Automation is the critical ingredient to realizing that full vision. We develop integration products and services for Bonterra Case Management software to support the deployment of automations for a variety of use cases. This video focuses on the deployment of external web forms using Jotform for Bonterra Impact Management. This solution can be customized to your organization’s needs and deployed to support the common use cases below: - Intake and consent - Assessments - Surveys - Applications - Program registration Interested in deploying web form automations for Bonterra Impact Management? Contact us at sales@sidekicksolutionsllc.com to discuss next steps.
Web Form Automation for Bonterra Impact Management (fka Social Solutions Apri...
Jeffrey Haguewood
Copy of the slides presented by Matt Robison to the SFWelly Salesforce user group community on May 2 2024. The audience was truly international with attendees from at least 4 different countries joining online. Matt is an expert in data cloud and this was a brilliant session.
Data Cloud, More than a CDP by Matt Robison
Anna Loughnan Colquhoun
Uncertainty, Acting under uncertainty, Basic probability notation, Bayes’ Rule,
Artificial Intelligence Chap.5 : Uncertainty
Khushali Kathiriya
We present an architecture of embedding models, vector databases, LLMs, and narrow ML for tracking global news narratives across a variety of countries/languages/news sources. As an example, we explore the real-time application of this architecture for tracking the news narrative surrounding the death of Russian opposition leader Alexei Navalny coming from Russian, French, and English sources.
Emergent Methods: Multi-lingual narrative tracking in the news - real-time ex...
Zilliz
Presented by Mike Hicks
How to Troubleshoot Apps for the Modern Connected Worker
ThousandEyes
Three things you will take away from the session: • How to run an effective tenant-to-tenant migration • Best practices for before, during, and after migration • Tips for using migration as a springboard to prepare for Copilot in Microsoft 365 Main ideas: Migration Overview: The presentation covers the current reality of cross-tenant migrations, the triggers, phases, best practices, and benefits of a successful tenant migration Considerations: When considering a migration, it is important to consider the migration scope, performance, customization, flexibility, user-friendly interface, automation, monitoring, support, training, scalability, data integrity, data security, cost, and licensing structure Next Wave: The next wave of change includes the launch of Copilot, which requires businesses to be prepared for upcoming changes related to Copilot and the cloud, and to consolidate data and tighten governance ShareGate: ShareGate can help with pre-migration analysis, configurable migration tool, and automated, end-user driven collaborative governance
Strategize a Smooth Tenant-to-tenant Migration and Copilot Takeoff
sammart93
Stay safe, grab a drink and join us virtually for our upcoming "GenAI Risks & Security" Meetup to hear about how to uncover critical GenAI risks and vulnerabilities, AI security considerations in every company, and how a CISO should navigate through GenAI Risks.
GenAI Risks & Security Meetup 01052024.pdf
lior mazor
The Good, the Bad and the Governed - Why is governance a dirty word? David O'Neill, Chief Operating Officer - APIContext Apidays New York 2024: The API Economy in the AI Era (April 30 & May 1, 2024) ------ Check out our conferences at https://www.apidays.global/ Do you want to sponsor or talk at one of our conferences? https://apidays.typeform.com/to/ILJeAaV8 Learn more on APIscene, the global media made by the community for the community: https://www.apiscene.io Explore the API ecosystem with the API Landscape: https://apilandscape.apiscene.io/
Apidays New York 2024 - The Good, the Bad and the Governed by David O'Neill, ...
apidays
MINDCTI Revenue Release Quarter 1 2024
MINDCTI Revenue Release Quarter One 2024
MIND CTI
This presentations targets students or working professionals. You may know Google for search, YouTube, Android, Chrome, and Gmail, but did you know Google has many developer tools, platforms & APIs? This comprehensive yet still high-level overview outlines the most impactful tools for where to run your code, store & analyze your data. It will also inspire you as to what's possible. This talk is 50 minutes in length.
Powerful Google developer tools for immediate impact! (2023-24 C)
wesley chun
45-60 minute session deck from introducing Google Apps Script to developers, IT leadership, and other technical professionals.
Automating Google Workspace (GWS) & more with Apps Script
wesley chun
MySQL Webinar, presented on the 25th of April, 2024. Summary: MySQL solutions enable the deployment of diverse Database Architectures tailored to specific needs, including High Availability, Disaster Recovery, and Read Scale-Out. With MySQL Shell's AdminAPI, administrators can seamlessly set up, manage, and monitor these solutions, ensuring efficiency and ease of use in their administration. MySQL Router, on the other hand, provides transparent routing from the application traffic to the backend servers in the architectures, requiring minimal configuration. Completely built in-house and supported by Oracle, these solutions have been adopted by enterprises of all sizes for their business-critical applications. In this presentation, we'll delve into various database architecture solutions to help you choose the right one based on your business requirements. Focusing on technical details and the latest features to maximize the potential of these solutions.
Mastering MySQL Database Architecture: Deep Dive into MySQL Shell and MySQL R...
Miguel Araújo
ICT role in 21 century education. How to ICT help in education
presentation ICT roal in 21st century education
jfdjdjcjdnsjd
Último
(20)
AXA XL - Insurer Innovation Award Americas 2024
AWS Community Day CPH - Three problems of Terraform
DBX First Quarter 2024 Investor Presentation
TrustArc Webinar - Stay Ahead of US State Data Privacy Law Developments
EMPOWERMENT TECHNOLOGY GRADE 11 QUARTER 2 REVIEWER
Manulife - Insurer Transformation Award 2024
Apidays Singapore 2024 - Scalable LLM APIs for AI and Generative AI Applicati...
Web Form Automation for Bonterra Impact Management (fka Social Solutions Apri...
Data Cloud, More than a CDP by Matt Robison
Artificial Intelligence Chap.5 : Uncertainty
Emergent Methods: Multi-lingual narrative tracking in the news - real-time ex...
How to Troubleshoot Apps for the Modern Connected Worker
Strategize a Smooth Tenant-to-tenant Migration and Copilot Takeoff
GenAI Risks & Security Meetup 01052024.pdf
Apidays New York 2024 - The Good, the Bad and the Governed by David O'Neill, ...
MINDCTI Revenue Release Quarter One 2024
Powerful Google developer tools for immediate impact! (2023-24 C)
Automating Google Workspace (GWS) & more with Apps Script
Mastering MySQL Database Architecture: Deep Dive into MySQL Shell and MySQL R...
presentation ICT roal in 21st century education
Loading analysis tool pak on your computer
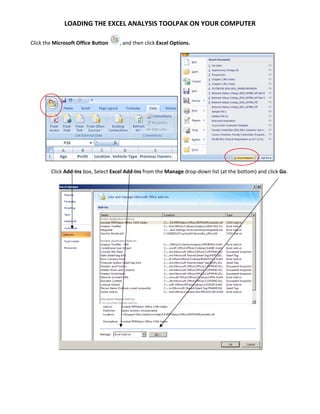
1.
LOADING THE EXCEL ANALYSIS TOOLPAK ON YOUR COMPUTER
Click the Microsoft Office Button , and then click Excel Options. Click Add‐Ins box, Select Excel Add‐Ins from the Manage drop‐down list (at the bottom) and click Go.
2.
Select the Analysis ToolPak check box in the Add‐Ins dialog box and then click the OK button.
If an alert dialog box asking you if you want to install the add‐in appears, click Yes. You will find the Analysis ToolPak under the Data tab on the tool bar.
Baixar agora