SlideShare uma empresa Scribd logo
1 de 5
Baixar para ler offline
 
 
                                                    HISTOGRAMS 
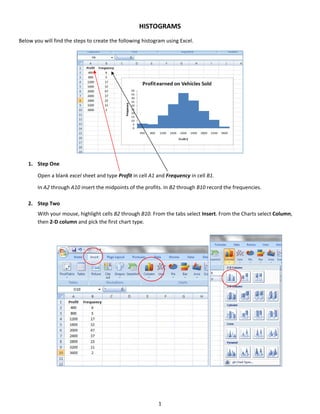
Below you will find the steps to create the following histogram using Excel. 


    1. Step One 
         

        Open a blank excel sheet and type Profit in cell A1 and Frequency in cell B1. 
         

       In A2 through A10 insert the midpoints of the profits. In B2 through B10 record the frequencies. 
        
    2. Step Two 


        With your mouse, highlight cells B2 through B10. From the tabs select Insert. From the Charts select Column, 
        then 2‐D column and pick the first chart type.  


                                                             1 


        A graph will appear. 


    3. Step Three 
        
       To edit the table the graph, double click on one of the columns in the graph. The Chart Tools tab will appear. 
       Choose the Layout tab and click Format Selection. 


        A dialog box will appear. Under Series Option, change the Gap Width to 0% by moving the arrow all the way to 
        the left and then click the Close button.   


                                                            2 


    To add the midpoint data to the horizontal axis click on an area on the graph. The Chart Tools tab will appear. 
    Select the Design tab, and then select Data. Under Horizontal (Category) Axis Labels, click Edit, then use the 
    mouse to highlight cells A2 through A10 and click OK. 


    To add titles to the graph click the Layout tab under the Chart Tools tab and click Chart Title and Above Chart. 


    Type Profit earned on Vehicles Sold in the Chart Title box. 


                                   Profit Earned on Vehicles Sold
                              50
                              40
                              30
                              20                                                     Series1
                              10
                               0
                                   400 800 1200 1600 2000 2400 2800 3200 3600


                                                        3 


    Next we will add the axis titles. Still under the Layout tab click Axis Titles and Primary Horizontal Axis Title. Click 
    Title Below Axis. 


    Type Profit $ for the horizontal axis title.   
     
    Now add the vertical axis title. Still under the Layout tab click Axis Titles and Primary Vertical Axis Title. Click 
    Rotated Title. Type in Frequency for the vertical axis title. 


                                                           4 


    We will remove the legend from the graph since none is needed. Click Legend under the Layout tab. Click None. 


    Your histogram is now complete. 
     

                                        Profit Earned on Vehicles Sold
                                  50
                                  45
                                  40
                                  35
                      Frequency


                                  30
                                  25
                                  20
                                  15
                                  10
                                   5
                                   0
                                       400   800   1200   1600        2000      2400   2800   3200   3600
                                                                     Profit $


                                                          5 
 

Mais conteúdo relacionado

Destaque

Aron chpt 6 ed revised
Aron chpt 6 ed revisedAron chpt 6 ed revised
Aron chpt 6 ed revisedSandra Nicks
 
Descriptive statistics
Descriptive statisticsDescriptive statistics
Descriptive statisticsSandra Nicks
 
Calculating binomial probabilities using excel
Calculating binomial probabilities using excelCalculating binomial probabilities using excel
Calculating binomial probabilities using excelSandra Nicks
 
Ncicu 2010 presentation
Ncicu 2010 presentationNcicu 2010 presentation
Ncicu 2010 presentationSandra Nicks
 
Aron chpt 9 ed f2011
Aron chpt 9 ed f2011Aron chpt 9 ed f2011
Aron chpt 9 ed f2011Sandra Nicks
 
Loading analysis tool pak on your computer
Loading analysis tool pak on your computerLoading analysis tool pak on your computer
Loading analysis tool pak on your computerSandra Nicks
 
Aron chpt 1 ed (1)
Aron chpt 1 ed (1)Aron chpt 1 ed (1)
Aron chpt 1 ed (1)Sandra Nicks
 
Aron chpt 3 correlation compatability version f2011
Aron chpt 3 correlation compatability version f2011Aron chpt 3 correlation compatability version f2011
Aron chpt 3 correlation compatability version f2011Sandra Nicks
 

Destaque (20)

Chapters 2 4
Chapters 2  4Chapters 2  4
Chapters 2 4
 
Newletter v 2.1
Newletter v 2.1Newletter v 2.1
Newletter v 2.1
 
Aron chpt 6 ed revised
Aron chpt 6 ed revisedAron chpt 6 ed revised
Aron chpt 6 ed revised
 
Descriptive statistics
Descriptive statisticsDescriptive statistics
Descriptive statistics
 
Calculating binomial probabilities using excel
Calculating binomial probabilities using excelCalculating binomial probabilities using excel
Calculating binomial probabilities using excel
 
Ncicu 2010 presentation
Ncicu 2010 presentationNcicu 2010 presentation
Ncicu 2010 presentation
 
Null hypothesis
Null hypothesisNull hypothesis
Null hypothesis
 
Aron chpt 2
Aron chpt 2Aron chpt 2
Aron chpt 2
 
Aron chpt 9 ed f2011
Aron chpt 9 ed f2011Aron chpt 9 ed f2011
Aron chpt 9 ed f2011
 
Aron chpt 8 ed
Aron chpt 8 edAron chpt 8 ed
Aron chpt 8 ed
 
Chap004
Chap004Chap004
Chap004
 
Loading analysis tool pak on your computer
Loading analysis tool pak on your computerLoading analysis tool pak on your computer
Loading analysis tool pak on your computer
 
Chap005
Chap005Chap005
Chap005
 
Chap003
Chap003Chap003
Chap003
 
Aron chpt 1 ed
Aron chpt 1 edAron chpt 1 ed
Aron chpt 1 ed
 
Chap006
Chap006Chap006
Chap006
 
Chap015
Chap015Chap015
Chap015
 
Aron chpt 1 ed (1)
Aron chpt 1 ed (1)Aron chpt 1 ed (1)
Aron chpt 1 ed (1)
 
Aron chpt 3 correlation compatability version f2011
Aron chpt 3 correlation compatability version f2011Aron chpt 3 correlation compatability version f2011
Aron chpt 3 correlation compatability version f2011
 
Newletter v 2.1
Newletter v 2.1Newletter v 2.1
Newletter v 2.1
 

Semelhante a Histograms

A Skills Approach Excel 2016 Chapter 8 Exploring Advanced D.docx
A Skills Approach Excel 2016  Chapter 8 Exploring Advanced D.docxA Skills Approach Excel 2016  Chapter 8 Exploring Advanced D.docx
A Skills Approach Excel 2016 Chapter 8 Exploring Advanced D.docxdaniahendric
 
This image appears when a project instruction has changed to accommo.docx
This image appears when a project instruction has changed to accommo.docxThis image appears when a project instruction has changed to accommo.docx
This image appears when a project instruction has changed to accommo.docxjuan1826
 
Spreadsheets Introduction using RM Number Magic
Spreadsheets Introduction using RM Number MagicSpreadsheets Introduction using RM Number Magic
Spreadsheets Introduction using RM Number MagicMalcolm Wilson
 
Revenue by DepartmentBlue Lake SportsFirst Quarter Sales by CityDe.docx
Revenue by DepartmentBlue Lake SportsFirst Quarter Sales by CityDe.docxRevenue by DepartmentBlue Lake SportsFirst Quarter Sales by CityDe.docx
Revenue by DepartmentBlue Lake SportsFirst Quarter Sales by CityDe.docxronak56
 
Molds design in solid works
Molds design in solid worksMolds design in solid works
Molds design in solid worksLong Nguyen
 
Gl13 m6-c4-presentation
Gl13 m6-c4-presentationGl13 m6-c4-presentation
Gl13 m6-c4-presentationTracie King
 
Open Office Calc : Level 1
Open Office Calc : Level 1Open Office Calc : Level 1
Open Office Calc : Level 1thinkict
 
Easy Pivot Tutorial June 2020
Easy Pivot Tutorial June 2020Easy Pivot Tutorial June 2020
Easy Pivot Tutorial June 2020Adhi Wikantyoso
 
Alv report-tutorial-www.sapexpert.co .uk-
Alv report-tutorial-www.sapexpert.co .uk-Alv report-tutorial-www.sapexpert.co .uk-
Alv report-tutorial-www.sapexpert.co .uk-Faina Fridman
 
Creating Chart
Creating ChartCreating Chart
Creating Charttieny8085
 
Adobe Illustrator CS5 Part 2 : Vector Graphic Effects
Adobe Illustrator CS5 Part 2 : Vector Graphic EffectsAdobe Illustrator CS5 Part 2 : Vector Graphic Effects
Adobe Illustrator CS5 Part 2 : Vector Graphic Effectscsula its training
 
A Skills Approach Excel 2016 Chapter 7 Exploring Advanced C.docx
A Skills Approach Excel 2016  Chapter 7 Exploring Advanced C.docxA Skills Approach Excel 2016  Chapter 7 Exploring Advanced C.docx
A Skills Approach Excel 2016 Chapter 7 Exploring Advanced C.docxdaniahendric
 
Lecture 10: introduction to computer
Lecture 10: introduction to computerLecture 10: introduction to computer
Lecture 10: introduction to computerSultan Omar Shige
 
Creating charts and graphics
Creating charts and graphicsCreating charts and graphics
Creating charts and graphicsum5ashm
 
Workshop10 creep-jop
Workshop10 creep-jopWorkshop10 creep-jop
Workshop10 creep-jopmmd110
 
Digitization arc gis
Digitization arc gisDigitization arc gis
Digitization arc gisAshok Peddi
 

Semelhante a Histograms (20)

A Skills Approach Excel 2016 Chapter 8 Exploring Advanced D.docx
A Skills Approach Excel 2016  Chapter 8 Exploring Advanced D.docxA Skills Approach Excel 2016  Chapter 8 Exploring Advanced D.docx
A Skills Approach Excel 2016 Chapter 8 Exploring Advanced D.docx
 
This image appears when a project instruction has changed to accommo.docx
This image appears when a project instruction has changed to accommo.docxThis image appears when a project instruction has changed to accommo.docx
This image appears when a project instruction has changed to accommo.docx
 
Spreadsheets Introduction using RM Number Magic
Spreadsheets Introduction using RM Number MagicSpreadsheets Introduction using RM Number Magic
Spreadsheets Introduction using RM Number Magic
 
Microsoft excel part 2
Microsoft excel part 2Microsoft excel part 2
Microsoft excel part 2
 
Revenue by DepartmentBlue Lake SportsFirst Quarter Sales by CityDe.docx
Revenue by DepartmentBlue Lake SportsFirst Quarter Sales by CityDe.docxRevenue by DepartmentBlue Lake SportsFirst Quarter Sales by CityDe.docx
Revenue by DepartmentBlue Lake SportsFirst Quarter Sales by CityDe.docx
 
Molds design in solid works
Molds design in solid worksMolds design in solid works
Molds design in solid works
 
Gl13 m6-c4-presentation
Gl13 m6-c4-presentationGl13 m6-c4-presentation
Gl13 m6-c4-presentation
 
Open Office Calc : Level 1
Open Office Calc : Level 1Open Office Calc : Level 1
Open Office Calc : Level 1
 
Easy Pivot Tutorial June 2020
Easy Pivot Tutorial June 2020Easy Pivot Tutorial June 2020
Easy Pivot Tutorial June 2020
 
Alv report-tutorial-www.sapexpert.co .uk-
Alv report-tutorial-www.sapexpert.co .uk-Alv report-tutorial-www.sapexpert.co .uk-
Alv report-tutorial-www.sapexpert.co .uk-
 
Creating Chart
Creating ChartCreating Chart
Creating Chart
 
Adobe Illustrator CS5 Part 2 : Vector Graphic Effects
Adobe Illustrator CS5 Part 2 : Vector Graphic EffectsAdobe Illustrator CS5 Part 2 : Vector Graphic Effects
Adobe Illustrator CS5 Part 2 : Vector Graphic Effects
 
A Skills Approach Excel 2016 Chapter 7 Exploring Advanced C.docx
A Skills Approach Excel 2016  Chapter 7 Exploring Advanced C.docxA Skills Approach Excel 2016  Chapter 7 Exploring Advanced C.docx
A Skills Approach Excel 2016 Chapter 7 Exploring Advanced C.docx
 
Noise Mapping
Noise MappingNoise Mapping
Noise Mapping
 
Lecture 10: introduction to computer
Lecture 10: introduction to computerLecture 10: introduction to computer
Lecture 10: introduction to computer
 
Creating charts and graphics
Creating charts and graphicsCreating charts and graphics
Creating charts and graphics
 
Workshop10 creep-jop
Workshop10 creep-jopWorkshop10 creep-jop
Workshop10 creep-jop
 
Digitization arc gis
Digitization arc gisDigitization arc gis
Digitization arc gis
 
Using this template
Using this templateUsing this template
Using this template
 
A bell curve
A bell curveA bell curve
A bell curve
 

Mais de Sandra Nicks

Simple random sample using excel
Simple random sample using excelSimple random sample using excel
Simple random sample using excelSandra Nicks
 
Finding areas for z using excel
Finding areas for z using excelFinding areas for z using excel
Finding areas for z using excelSandra Nicks
 
Creating frequency distribution table, histograms and polygons using excel an...
Creating frequency distribution table, histograms and polygons using excel an...Creating frequency distribution table, histograms and polygons using excel an...
Creating frequency distribution table, histograms and polygons using excel an...Sandra Nicks
 
Creating frequency distribution tables and histograms using excel analysis to...
Creating frequency distribution tables and histograms using excel analysis to...Creating frequency distribution tables and histograms using excel analysis to...
Creating frequency distribution tables and histograms using excel analysis to...Sandra Nicks
 
Aronchpt3correlation
Aronchpt3correlationAronchpt3correlation
Aronchpt3correlationSandra Nicks
 
Calculating a correlation coefficient and scatter plot using excel
Calculating a correlation coefficient and scatter plot using excelCalculating a correlation coefficient and scatter plot using excel
Calculating a correlation coefficient and scatter plot using excelSandra Nicks
 
Using excel to convert raw score to z score
Using excel to convert raw score to z scoreUsing excel to convert raw score to z score
Using excel to convert raw score to z scoreSandra Nicks
 
Ncair summer drive in creating a google site
Ncair summer drive in creating a google siteNcair summer drive in creating a google site
Ncair summer drive in creating a google siteSandra Nicks
 
Documenting sacs compliance with microsoft excel
Documenting sacs compliance with microsoft excelDocumenting sacs compliance with microsoft excel
Documenting sacs compliance with microsoft excelSandra Nicks
 

Mais de Sandra Nicks (18)

Night owl
Night owlNight owl
Night owl
 
Simple random sample using excel
Simple random sample using excelSimple random sample using excel
Simple random sample using excel
 
Chap010
Chap010Chap010
Chap010
 
Chap009
Chap009Chap009
Chap009
 
Chap007
Chap007Chap007
Chap007
 
Finding areas for z using excel
Finding areas for z using excelFinding areas for z using excel
Finding areas for z using excel
 
Chap008
Chap008Chap008
Chap008
 
Chap004
Chap004Chap004
Chap004
 
Creating frequency distribution table, histograms and polygons using excel an...
Creating frequency distribution table, histograms and polygons using excel an...Creating frequency distribution table, histograms and polygons using excel an...
Creating frequency distribution table, histograms and polygons using excel an...
 
Creating frequency distribution tables and histograms using excel analysis to...
Creating frequency distribution tables and histograms using excel analysis to...Creating frequency distribution tables and histograms using excel analysis to...
Creating frequency distribution tables and histograms using excel analysis to...
 
Chap002
Chap002Chap002
Chap002
 
Aronchpt3correlation
Aronchpt3correlationAronchpt3correlation
Aronchpt3correlation
 
Calculating a correlation coefficient and scatter plot using excel
Calculating a correlation coefficient and scatter plot using excelCalculating a correlation coefficient and scatter plot using excel
Calculating a correlation coefficient and scatter plot using excel
 
Using excel to convert raw score to z score
Using excel to convert raw score to z scoreUsing excel to convert raw score to z score
Using excel to convert raw score to z score
 
Chapters 2 & 4
Chapters 2 & 4Chapters 2 & 4
Chapters 2 & 4
 
Chap001
Chap001Chap001
Chap001
 
Ncair summer drive in creating a google site
Ncair summer drive in creating a google siteNcair summer drive in creating a google site
Ncair summer drive in creating a google site
 
Documenting sacs compliance with microsoft excel
Documenting sacs compliance with microsoft excelDocumenting sacs compliance with microsoft excel
Documenting sacs compliance with microsoft excel
 

Último

Top 10 Most Downloaded Games on Play Store in 2024
Top 10 Most Downloaded Games on Play Store in 2024Top 10 Most Downloaded Games on Play Store in 2024
Top 10 Most Downloaded Games on Play Store in 2024SynarionITSolutions
 
Artificial Intelligence Chap.5 : Uncertainty
Artificial Intelligence Chap.5 : UncertaintyArtificial Intelligence Chap.5 : Uncertainty
Artificial Intelligence Chap.5 : UncertaintyKhushali Kathiriya
 
Polkadot JAM Slides - Token2049 - By Dr. Gavin Wood
Polkadot JAM Slides - Token2049 - By Dr. Gavin WoodPolkadot JAM Slides - Token2049 - By Dr. Gavin Wood
Polkadot JAM Slides - Token2049 - By Dr. Gavin WoodJuan lago vázquez
 
Automating Google Workspace (GWS) & more with Apps Script
Automating Google Workspace (GWS) & more with Apps ScriptAutomating Google Workspace (GWS) & more with Apps Script
Automating Google Workspace (GWS) & more with Apps Scriptwesley chun
 
A Year of the Servo Reboot: Where Are We Now?
A Year of the Servo Reboot: Where Are We Now?A Year of the Servo Reboot: Where Are We Now?
A Year of the Servo Reboot: Where Are We Now?Igalia
 
Tata AIG General Insurance Company - Insurer Innovation Award 2024
Tata AIG General Insurance Company - Insurer Innovation Award 2024Tata AIG General Insurance Company - Insurer Innovation Award 2024
Tata AIG General Insurance Company - Insurer Innovation Award 2024The Digital Insurer
 
Strategies for Unlocking Knowledge Management in Microsoft 365 in the Copilot...
Strategies for Unlocking Knowledge Management in Microsoft 365 in the Copilot...Strategies for Unlocking Knowledge Management in Microsoft 365 in the Copilot...
Strategies for Unlocking Knowledge Management in Microsoft 365 in the Copilot...Drew Madelung
 
Understanding Discord NSFW Servers A Guide for Responsible Users.pdf
Understanding Discord NSFW Servers A Guide for Responsible Users.pdfUnderstanding Discord NSFW Servers A Guide for Responsible Users.pdf
Understanding Discord NSFW Servers A Guide for Responsible Users.pdfUK Journal
 
TrustArc Webinar - Unlock the Power of AI-Driven Data Discovery
TrustArc Webinar - Unlock the Power of AI-Driven Data DiscoveryTrustArc Webinar - Unlock the Power of AI-Driven Data Discovery
TrustArc Webinar - Unlock the Power of AI-Driven Data DiscoveryTrustArc
 
Artificial Intelligence: Facts and Myths
Artificial Intelligence: Facts and MythsArtificial Intelligence: Facts and Myths
Artificial Intelligence: Facts and MythsJoaquim Jorge
 
How to Troubleshoot Apps for the Modern Connected Worker
How to Troubleshoot Apps for the Modern Connected WorkerHow to Troubleshoot Apps for the Modern Connected Worker
How to Troubleshoot Apps for the Modern Connected WorkerThousandEyes
 
A Domino Admins Adventures (Engage 2024)
A Domino Admins Adventures (Engage 2024)A Domino Admins Adventures (Engage 2024)
A Domino Admins Adventures (Engage 2024)Gabriella Davis
 
Mastering MySQL Database Architecture: Deep Dive into MySQL Shell and MySQL R...
Mastering MySQL Database Architecture: Deep Dive into MySQL Shell and MySQL R...Mastering MySQL Database Architecture: Deep Dive into MySQL Shell and MySQL R...
Mastering MySQL Database Architecture: Deep Dive into MySQL Shell and MySQL R...Miguel Araújo
 
Workshop - Best of Both Worlds_ Combine KG and Vector search for enhanced R...
Workshop - Best of Both Worlds_ Combine  KG and Vector search for  enhanced R...Workshop - Best of Both Worlds_ Combine  KG and Vector search for  enhanced R...
Workshop - Best of Both Worlds_ Combine KG and Vector search for enhanced R...Neo4j
 
Apidays New York 2024 - The Good, the Bad and the Governed by David O'Neill, ...
Apidays New York 2024 - The Good, the Bad and the Governed by David O'Neill, ...Apidays New York 2024 - The Good, the Bad and the Governed by David O'Neill, ...
Apidays New York 2024 - The Good, the Bad and the Governed by David O'Neill, ...apidays
 
Apidays Singapore 2024 - Building Digital Trust in a Digital Economy by Veron...
Apidays Singapore 2024 - Building Digital Trust in a Digital Economy by Veron...Apidays Singapore 2024 - Building Digital Trust in a Digital Economy by Veron...
Apidays Singapore 2024 - Building Digital Trust in a Digital Economy by Veron...apidays
 
Axa Assurance Maroc - Insurer Innovation Award 2024
Axa Assurance Maroc - Insurer Innovation Award 2024Axa Assurance Maroc - Insurer Innovation Award 2024
Axa Assurance Maroc - Insurer Innovation Award 2024The Digital Insurer
 
HTML Injection Attacks: Impact and Mitigation Strategies
HTML Injection Attacks: Impact and Mitigation StrategiesHTML Injection Attacks: Impact and Mitigation Strategies
HTML Injection Attacks: Impact and Mitigation StrategiesBoston Institute of Analytics
 
🐬 The future of MySQL is Postgres 🐘
🐬  The future of MySQL is Postgres   🐘🐬  The future of MySQL is Postgres   🐘
🐬 The future of MySQL is Postgres 🐘RTylerCroy
 

Último (20)

Top 10 Most Downloaded Games on Play Store in 2024
Top 10 Most Downloaded Games on Play Store in 2024Top 10 Most Downloaded Games on Play Store in 2024
Top 10 Most Downloaded Games on Play Store in 2024
 
Artificial Intelligence Chap.5 : Uncertainty
Artificial Intelligence Chap.5 : UncertaintyArtificial Intelligence Chap.5 : Uncertainty
Artificial Intelligence Chap.5 : Uncertainty
 
Polkadot JAM Slides - Token2049 - By Dr. Gavin Wood
Polkadot JAM Slides - Token2049 - By Dr. Gavin WoodPolkadot JAM Slides - Token2049 - By Dr. Gavin Wood
Polkadot JAM Slides - Token2049 - By Dr. Gavin Wood
 
Automating Google Workspace (GWS) & more with Apps Script
Automating Google Workspace (GWS) & more with Apps ScriptAutomating Google Workspace (GWS) & more with Apps Script
Automating Google Workspace (GWS) & more with Apps Script
 
A Year of the Servo Reboot: Where Are We Now?
A Year of the Servo Reboot: Where Are We Now?A Year of the Servo Reboot: Where Are We Now?
A Year of the Servo Reboot: Where Are We Now?
 
Tata AIG General Insurance Company - Insurer Innovation Award 2024
Tata AIG General Insurance Company - Insurer Innovation Award 2024Tata AIG General Insurance Company - Insurer Innovation Award 2024
Tata AIG General Insurance Company - Insurer Innovation Award 2024
 
Strategies for Unlocking Knowledge Management in Microsoft 365 in the Copilot...
Strategies for Unlocking Knowledge Management in Microsoft 365 in the Copilot...Strategies for Unlocking Knowledge Management in Microsoft 365 in the Copilot...
Strategies for Unlocking Knowledge Management in Microsoft 365 in the Copilot...
 
Understanding Discord NSFW Servers A Guide for Responsible Users.pdf
Understanding Discord NSFW Servers A Guide for Responsible Users.pdfUnderstanding Discord NSFW Servers A Guide for Responsible Users.pdf
Understanding Discord NSFW Servers A Guide for Responsible Users.pdf
 
TrustArc Webinar - Unlock the Power of AI-Driven Data Discovery
TrustArc Webinar - Unlock the Power of AI-Driven Data DiscoveryTrustArc Webinar - Unlock the Power of AI-Driven Data Discovery
TrustArc Webinar - Unlock the Power of AI-Driven Data Discovery
 
+971581248768>> SAFE AND ORIGINAL ABORTION PILLS FOR SALE IN DUBAI AND ABUDHA...
+971581248768>> SAFE AND ORIGINAL ABORTION PILLS FOR SALE IN DUBAI AND ABUDHA...+971581248768>> SAFE AND ORIGINAL ABORTION PILLS FOR SALE IN DUBAI AND ABUDHA...
+971581248768>> SAFE AND ORIGINAL ABORTION PILLS FOR SALE IN DUBAI AND ABUDHA...
 
Artificial Intelligence: Facts and Myths
Artificial Intelligence: Facts and MythsArtificial Intelligence: Facts and Myths
Artificial Intelligence: Facts and Myths
 
How to Troubleshoot Apps for the Modern Connected Worker
How to Troubleshoot Apps for the Modern Connected WorkerHow to Troubleshoot Apps for the Modern Connected Worker
How to Troubleshoot Apps for the Modern Connected Worker
 
A Domino Admins Adventures (Engage 2024)
A Domino Admins Adventures (Engage 2024)A Domino Admins Adventures (Engage 2024)
A Domino Admins Adventures (Engage 2024)
 
Mastering MySQL Database Architecture: Deep Dive into MySQL Shell and MySQL R...
Mastering MySQL Database Architecture: Deep Dive into MySQL Shell and MySQL R...Mastering MySQL Database Architecture: Deep Dive into MySQL Shell and MySQL R...
Mastering MySQL Database Architecture: Deep Dive into MySQL Shell and MySQL R...
 
Workshop - Best of Both Worlds_ Combine KG and Vector search for enhanced R...
Workshop - Best of Both Worlds_ Combine  KG and Vector search for  enhanced R...Workshop - Best of Both Worlds_ Combine  KG and Vector search for  enhanced R...
Workshop - Best of Both Worlds_ Combine KG and Vector search for enhanced R...
 
Apidays New York 2024 - The Good, the Bad and the Governed by David O'Neill, ...
Apidays New York 2024 - The Good, the Bad and the Governed by David O'Neill, ...Apidays New York 2024 - The Good, the Bad and the Governed by David O'Neill, ...
Apidays New York 2024 - The Good, the Bad and the Governed by David O'Neill, ...
 
Apidays Singapore 2024 - Building Digital Trust in a Digital Economy by Veron...
Apidays Singapore 2024 - Building Digital Trust in a Digital Economy by Veron...Apidays Singapore 2024 - Building Digital Trust in a Digital Economy by Veron...
Apidays Singapore 2024 - Building Digital Trust in a Digital Economy by Veron...
 
Axa Assurance Maroc - Insurer Innovation Award 2024
Axa Assurance Maroc - Insurer Innovation Award 2024Axa Assurance Maroc - Insurer Innovation Award 2024
Axa Assurance Maroc - Insurer Innovation Award 2024
 
HTML Injection Attacks: Impact and Mitigation Strategies
HTML Injection Attacks: Impact and Mitigation StrategiesHTML Injection Attacks: Impact and Mitigation Strategies
HTML Injection Attacks: Impact and Mitigation Strategies
 
🐬 The future of MySQL is Postgres 🐘
🐬  The future of MySQL is Postgres   🐘🐬  The future of MySQL is Postgres   🐘
🐬 The future of MySQL is Postgres 🐘
 

Histograms

  • 1.     HISTOGRAMS  Below you will find the steps to create the following histogram using Excel.    1. Step One    Open a blank excel sheet and type Profit in cell A1 and Frequency in cell B1.    In A2 through A10 insert the midpoints of the profits. In B2 through B10 record the frequencies.    2. Step Two    With your mouse, highlight cells B2 through B10. From the tabs select Insert. From the Charts select Column,  then 2‐D column and pick the first chart type.             1   
  • 2.     A graph will appear.    3. Step Three    To edit the table the graph, double click on one of the columns in the graph. The Chart Tools tab will appear.  Choose the Layout tab and click Format Selection.        A dialog box will appear. Under Series Option, change the Gap Width to 0% by moving the arrow all the way to  the left and then click the Close button.        2   
  • 3.     To add the midpoint data to the horizontal axis click on an area on the graph. The Chart Tools tab will appear.  Select the Design tab, and then select Data. Under Horizontal (Category) Axis Labels, click Edit, then use the  mouse to highlight cells A2 through A10 and click OK.        To add titles to the graph click the Layout tab under the Chart Tools tab and click Chart Title and Above Chart.        Type Profit earned on Vehicles Sold in the Chart Title box.    Profit Earned on Vehicles Sold 50 40 30 20 Series1 10 0 400 800 1200 1600 2000 2400 2800 3200 3600       3   
  • 4.       Next we will add the axis titles. Still under the Layout tab click Axis Titles and Primary Horizontal Axis Title. Click  Title Below Axis.      Type Profit $ for the horizontal axis title.      Now add the vertical axis title. Still under the Layout tab click Axis Titles and Primary Vertical Axis Title. Click  Rotated Title. Type in Frequency for the vertical axis title.            4   
  • 5.       We will remove the legend from the graph since none is needed. Click Legend under the Layout tab. Click None.        Your histogram is now complete.    Profit Earned on Vehicles Sold 50 45 40 35 Frequency 30 25 20 15 10 5 0 400 800 1200 1600 2000 2400 2800 3200 3600 Profit $     5