1. FINDING AREAS FOR Z AND USING Z IN FINDING X GIVEN AREA USING EXCEL
FINDING AREAS FOR Z
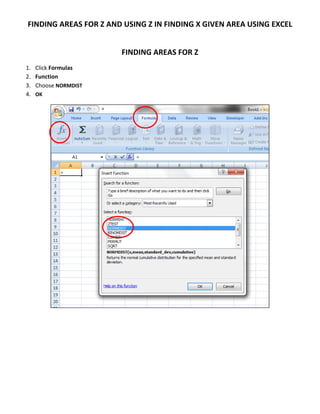
1. Click Formulas
2. Function
3. Choose NORMDIST
4. OK
2. 5. Type the value of x in the X box
6. Type the value of the mean in the Mean box
7. Type the value of the standard deviation in the Standard_dev box
8. In the Cumulative box type true
9. Notice the results are for the area from the far left of the distribution up to X. If you are interested in
the area between the mean and X, you will need to subtract .500 from the cumulative area.
3. USING Z IN FINDING X GIVEN AREA USING EXCEL
1. Click Formulas
2. Function
3. Choose NORMINV
4. OK
4. 5. Type the probability value in the Probability box
6. Type the mean value into the Mean box
7. Type the standard deviation into the Standard_dev box
8. Notice the results are for the area from the far left of the distribution up to X. If you are interested in
the area between the mean and X, you will need to subtract the cumulative area from .500.