Oil has highly inelastic demand and supply curves in the short run. This means that any shifts in demand or supply will result in large price changes, as quantities demanded and supplied do not respond much to price changes in the short run. The article uses supply and demand graphs to illustrate how oil price increases in the 1970s resulted from OPEC restricting supply, as demand was inelastic. While high prices cause short term pain, in the long run they encourage fuel efficiency, alternative energy sources, and increased exploration and supply. The article argues for letting market forces, not price controls, determine oil prices over time.
Value Proposition canvas- Customer needs and pains
Demand and supply applied
1. Demand and Supply Applied:
Oil Prices
My elderly friend loves to reminisce about the good old days. He tells
the same stories over and over again. He tells of watching Sammy
Snead1 hitting towering drives while playing exhibitions at his local golf
course; he tells of betting $20 on Seabiscuit in his 1938 match race with
War Admiral2; and he tells of buying six gallons of petrol for a dollar.
Six gallons for a dollar? During the summer of 2008 I paid $4.36 a
gallon while vacationing in Montana. How could this happen? Some
want to blame profiteering oil companies, but economists prefer
explanations based on demand and supply.
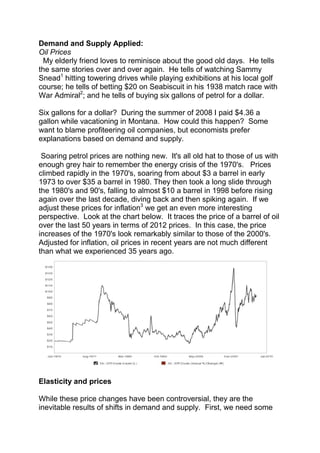
Soaring petrol prices are nothing new. It's all old hat to those of us with
enough grey hair to remember the energy crisis of the 1970's. Prices
climbed rapidly in the 1970's, soaring from about $3 a barrel in early
1973 to over $35 a barrel in 1980. They then took a long slide through
the 1980's and 90's, falling to almost $10 a barrel in 1998 before rising
again over the last decade, diving back and then spiking again. If we
adjust these prices for inflation3 we get an even more interesting
perspective. Look at the chart below. It traces the price of a barrel of oil
over the last 50 years in terms of 2012 prices. In this case, the price
increases of the 1970's look remarkably similar to those of the 2000's.
Adjusted for inflation, oil prices in recent years are not much different
than what we experienced 35 years ago.
Elasticity and prices
While these price changes have been controversial, they are the
inevitable results of shifts in demand and supply. First, we need some
2. background information. Both the demand and supply of oil are
relativelyinelastic in the short run: changes in price have little impact on
either the quantity demanded or the quantity supplied.
When oil prices rise we spend considerable time and energy
complaining but, at least in the short run, spend almost no effort in trying
to adjust our habits to consume less. Similarly changes in price do little
to spur new supplies in the short run. Exploring for, drilling, and bringing
new sources on-line can take many years. Since the quantities
demanded and supplied change very little as prices rise and fall, both
curves are relatively vertical as shown below:
Because quantities are relatively fixed in the short run, any shifts in
demand or supply will cause large changes in prices. For example,
suppose that supply falls. The decreased supply creates a temporary
shortage that will begin to drive up price. If demand is elastic, only a
small increase in price will be needed to get consumers to cut purchases
enough to meet the new reduced output. However, if demand is
inelastic, it will take a much larger price increase to generate the needed
cut in quantity demanded. You want more graphs, don't you?
The graph on the left below illustrates the elastic demand case. The
demand curve is relatively flat and the drop in supply (from S to S')
causes only a small increase in price (from P0 to P1). However, if the
demand curve is less elastic or more vertical (as in the graph on the
right), the same cut in supply causes a much larger increase in price.
3. Do you have the concept? When curves are elastic, shifts in demand
and supply cause only small changes in price, but when curves are
inelastic, those same shifts cause much larger price changes.
Apply this to oil markets. For many years members of the
Organization of Petroleum Exporting Countries (OPEC) have controlled
most of the world's oil market.4 In the early 1970's, partly reacting to
political turmoil in the Mideast, OPEC oil ministers voted to deliberately
cut production. As illustrated above, this shifted the supply curve for oil
to the left and drove up prices. Because demand was inelastic, the price
increase was significant. The higher prices OPEC countries received
more than offset the lower sales and their oil revenues rose rapidly. In
1979 a bitter war between long-time enemies Iran and Iraq shut down
more oil fields and caused additional price increases.
Wait?
Much weeping and gnashing of teeth in non-OPEC countries ensued
and, in the wake of the media hysteria that followed, economists were
thrust into the national limelight. How could this energy disaster be
fixed? What should be done? Never very good at giving answers that
people or politicians want to hear, most economists replied: "Don't do
anything; just wait."
The answer was both unpopular and correct. Demand and supply are
far more elastic in the long run than in the short run. After oil prices
rose, firms began shifting to less energy-intensive ways of
manufacturing goods and services. Similarly, consumers started to
4. conserve as well. They insulated homes heated by oil furnaces and
shifted to alternative energy sources. More importantly, they began
buying different types of cars. They gradually ditched the gas guzzlers
they purchased in 1971 when fuel prices were not an issue and bought
smaller, more fuel efficient vehicles. As we shifted from cars getting 12
miles per gallon to ones getting 28 miles per gallon, the demand for
petrol (and its price) began to fall.
Supplies adjusted as well. The increased prices of the 1970's
unleashed a frenzy of successful new exploration and drilling. New oil
fields came on line all over the world in places such as Mexico, Russia
and the North Sea. Fields that were not profitable to develop when oil
was $4 per barrel proved to be veritable bonanzas at $35 per barrel.
The combination of conservation and new supplies gradually drove
prices down until, in inflation-adjusted terms, they returned to 1972
levels.5
Regrettably it did not last. Prices began to inch up again after
the turn of the century and recently have climbed well above historic
levels. Why? What happened? Is it still demand and supply?
It is. First, demands rose rapidly over the last decade.
Consumers, lulled by low prices, abandoned their fuel-efficient Hondas
and Toyotas for behemoth trucks, vans, and SUVs. Perhaps more
importantly, strong economic growth in countries such as China and
India created more factories and more cars that need more oil to run
them. Supplies also have suffered. During the U.S. invasion many Iraqi
oil fields were destroyed and production there remains well below prewar levels. Production in other countries also has been disrupted, most
recently when militant attacks in early 2008 closed major oil fields in
Nigeria. Rising tensions in the Mideast added to the problems. Fearing
that current pressures might rekindle armed conflict between Iran and
Iraq and cause further cuts in supply, many oil brokers increased
purchases in an attempt to lock in supplies at current prices. Not
5. surprisingly, this speculative buying increased demand and drove up
prices still more.
Do you see it? Increased demand from U.S. motorists, from other
countries, and from speculators worried about even higher prices in the
future, coupled with supply cuts in Iraq and Nigeria caused oil prices to
increase. However, by late 2008 problems in U.S. mortgage lending set
off a crisis in global financial markets that led to a global economic
slowdown. The slowdown, in turn, caused a drop in demand for oil and
began pushing the price of oil back down. [Can you picture how a shift in
the demand curve can do this?] Once prices began to fall, speculators
who had purchased large volumes of oil expecting to be able to resell at
a higher future prices, began to lose money rapidly. To cut their losses
they dumped their supplies on the market hoping to unload them quickly
before prices fell further. Of course, this increased market supply and
drove down prices even more rapidly. Oil prices that peaked above
$140 per barrel in July 2008 had fallen to a mere $40 by December.
Waiting worked.
Rats. It didn't last. Unrest in the Middle East, accentuated by
popular uprisings in Tunisia, Egypt, Libya, Yemen, Bahrain and Syria
refueled speculative fears. Will lengthy civil wars break out across the
region? Will oil fields be destroyed? Will pipelines and transportation
corridors be shut off? As firms rushed to lock in supplies, demand
surged and prices soared back above $100 per barrel. By May 2011
domestic petrol prices once again approached $4.00 per gallon.
What now? Most expect the Mideast crises to stabilize and for oil
prices to bump back down. But, given the political instability in the many
major oil-exporting nations, coupled with inelastic demands and supplies
in the short run, the roller coaster price rides of recent decades are likely
to continue.
Lower prices?
Some argue that the government should step in and mandate lower
prices. Such schemes pander to populist preconceptions, but make little
economic sense. Are you ready for one last graph? Suppose the
government decides to lower petrol prices by decree and forbids
firms from charging any price higher than P1 in the graph below. In
economic jargon, P1 becomes a ceiling price. Consumers
immediately react to the lower price by increasing their quantity
demanded from Q0 to Q2. However firms react in the opposite way.
6. Stuck with a lower price they reduce their quantity supplied from
Q0 to Q1 and a shortage results. The quantity demanded (Q2) now
exceeds the quantity supplied (Q1).
Some consumers do get petrol for a lower price, but others get no petrol
at all. Since output has been cut from Q0 to Q1 there is less petrol to go
around. It simply is not profitable to produce as much at the lower price.
Who gets the petrol and who does not? In a free market consumers
would compete for the scarce petrol by offering higher prices; those
willing to pay the most would get the petrol. However, with a price
ceiling in effect, paying higher prices is illegal. Firms and consumers
must find a different way to decide who gets the gas and who does not.
The traditional alternative is first-come-first-served. Those who get to
the station first get the limited supplies; those at the end of the line do
not. The gas is gone by the time they get to the pump. But think about
this. If the product goes to those in line first, what will you do? That's
right. You'll try to be first in line. Unfortunately, everyone else will be
doing the same thing. The result will be long lines (and short tempers)
at the pump. Those who "win" and get to the pumps first will get their
gas at a lower price, but they must pay a higher price in terms of time
and energy spent waiting in line. Those at the end of the line lose twice.
They lose by having to wait in line and lose again by seeing the gas run
out before they get to the pump.
Could this actually happen? Readers who remember the 1970's know
that it could and that it did. To "protect" consumers, we did slap price
ceilings on oil and gas products, only to be slapped back with the long
lines and shortages described above. It was ugly.
Most economists offer the same advice they gave thirty years ago: wait.
High prices are painful, but they serve a very real economic purpose;
7. they discourage consumers from using a scarce resource and
encourage suppliers to produce more. In the long run higher prices will
cause consumers to shift back to more fuel-efficient cars and adopt
other measures of conservation. In the long run higher prices will cause
firms to increase exploration and drilling to bring more supplies to the
market. And, more importantly, in the long run higher oil prices will
create incentives to develop cleaner and more renewable energy
sources. OPEC oil ministers understand this quite well. Saudi officials
often have pushed for moderation in oil prices precisely because they
fear prices that rise too much too quickly will drive consuming nations to
get serious about conservation and alternative energy programs. They
understand that this could destroy the long-run market for oil and, in
turn, damage their future economic growth.
Despite their bad rap, rocketing petrol prices actually can have very
beneficial side effects. Evidence suggests that the low gas prices of the
past caused an increase in driving which, in turn, led to more pollution,
more traffic-related deaths and more obesity.6 As the pinch of higher
pump prices causes us to cut back our highway mileage, the likely result
could be a cleaner, safer and cleaner America. Calls for patience may
not win elections, but may be sensible policy nonetheless.
Testing Yourself
To test your understanding of the concepts in this reading, try answering
the following:
1.
2.
3.
Explain and illustrate why shifts in demand and supply cause
larger price changes when the curves are relatively inelastic than
when they are relatively elastic.
Explain why oil prices rose in the 1970's but then fell through
most of the 1980's and 1990's.
Explain what demand and supply shifts might have caused oil
prices to change in recent years.
8. 4.
5.
6.
Explain how speculation might be impacting oil prices.
Use demand and supply curves to illustrate the effect of a price
ceiling. Explain in words what happens and why economists tend
to oppose such ceilings.
Explain why "waiting" might be a good way to deal with high oil
prices.
7.
Explain the beneficial effects high oil prices might create
Elastic Oil
9. All products have some type of Elasticity. Under the category of elasticity
there are 4 types of elasticity; Price, Income, Cross Price Elasticity of
Demand, and Price Elasticity. Price Elasticity of Demand
(PED)measures the proportional responsiveness of the quantity
demanded to a change in price, with a scale from 0 to negative infinity,
with zero indicating perfectly inelastic and negative infinity as highly
elastic. PED’s are usually indicated in a negative number. Income
elasticity of demand
(YED)measures the proportional responsiveness change in quantity
demanded to a change in income. This scales from negative infinity to
positive infinity, with zero as a “changing point”. When the elasticity is
negative, the good is seen as an inferior good, a good whose demand
rises as income or real GDP falls. An example of inferior goods is
delivery pizzas. Positive elasticity usually does not do over 3 and
indicates normal goods. When it does go over 3 it is considered a luxury
good, such as Ferraris. Cross Price Elasticity of Demand
(XED)measures ness of the proportional responsive quantity demanded
of good X fallowing a change of price in good Y. XED uses the same
scale as of the YED. However, in this case, when the good is in the
negative zone, it is shows that when good X’s price rose and demand
fell, the demand for good Y also fell as well. This good is called a
complementary good, for example bike and bike helmets. On the other
hand if the good is in the positive zone, it means that the demand for
good X raises the demand for good Y drops. It would be said that good x
is a substitute of good Y. An example of substitute goods is butter
and margarine. Within the all of the elasticity of demand, there are
reasons why a good is elastic or inelastic. Brand Loyalty, Lack of
Substitutes, the good being a necessity or if a good can cause an
addiction are the reasons that a good can be inelastic. Price Elasticity of
Supply (PES) measures the proportional responsiveness of a change in
quantity supplied to a change in price. The scale is the same as Price
Elasticity of Demand.
10. The Article talks about the elasticity of oil and how it has become more
inelastic than ever. Oil has always been textbook example of an inelastic
good. This is mainly due to the fact that there are not many effective
substitutes, and it has become a modern necessity. It looks at price
elasticity from the supply point view and demand point of view. For
demand, many consumers are willing to pay more for the same amount
of oil. This is due to the fact that many of us enjoy a luxurious life with
somewhat superfluous amount of comfort. This means that the demand
for oil is not very sensitive to price change. On a graph, the demand
curve would look more vertical. This would mean that if the supply were
to change, causing the price to change, Demand wouldn’t change much
either.
From the supply side view, it explains that the countries that are the
world’s main exporters of oil (Saudi Arabia, Kuwait, etc. ) are doing its
best at trying to get oil, yet the fact of getting oil and keeping their
economy in check costs a lot of money. Even if we potentially have
plenty of oil, we do not have enough at hand. On a graph, the supply
graph would also look vertical, making the final graph to look like this.
11. In my opinion I think this is a good graphical interpretation of the
elasticity of oil. There is not much of it for consumption, and that causes
the high prices. Yet we are willing to pay the price for our desires.
12. Indirect taxation
Author: Geoff Riley Last updated: Sunday 23 September, 2012
Introduction
An indirect tax is imposed on producers (suppliers) by the government. Examples include duties on
cigarettes, alcohol and fuel and also VAT
VAT is a tax placed on the expenditure / a tax set as a percentage of the price of a good)
A tax increases the costs of production causing an inward shift in the supply curve
The vertical distance between the pre-tax and the post-tax supply curve shows the tax per unit
With an indirect tax, the supplier may be able to pass on some or all of this tax onto the consumer
through a higher price
This is known as shifting the burden of the tax and the ability of businesses to do this depends on
the price elasticity of demand and supply
In the left hand diagram, demand is elastic so the producer must absorb most of
the tax and accept a lower profit margin on each unit. When demand is elastic,
the effect of a tax is to raise the price – but we see a bigger fall in quantity.
Output has fallen from Q to Q1.
In the right hand diagram demand for the product is inelastic and therefore the
producer is able to pass on most of the tax to the consumer by raising price
without losing much in the way of sales.
13. The table below shows the demand and supply schedules for a good:
Price (£)
Quantity Demanded
Quantity Supplied
Quantity supplied
(Pre-tax)
(Post-tax)
10
1280
600
9
60
1000
400
8
150
850
150
7
260
600
50
6
400
400
5
600
150
4
1
20
900
50
What is the initial equilibrium price and quantity?
Price = £6
Quantity = 400
2
The government imposes a tax of £3 per unit. The new supply schedule is shown in
the right hand column of the table – less is now supplied at each and every market
price
3
Find the new equilibrium price after the tax has been
New price =£8
imposed
4
Calculate the total tax revenue going to the government
5
Tax revenue = £450
How have consumers been affected by this tax?
There has been a fall in quantity traded and a rise in the price paid by consumers –
this leads to a fall in economic welfare as measured by consumer surplus
14. Who pays the tax? The burden of taxation
The Government would rather place indirect taxes on commodities where demand is
inelastic because the tax causes only a small fall in the quantity consumed and as a
result the total revenue from taxes will be greater. An example of this is the high level
of duty on cigarettes and petrol.
Specific taxes: A specific tax is where the tax per unit is a fixed amount – for
example the duty on a pint of beer or the tax per packet of twenty cigarettes.
Another example is air passenger duty
Ad valorem taxes: Where the tax is a percentage of the cost of supply –
e.g. value added taxcurrently levied at the standard rate of 15%. In the diagram
below, an ad valorem tax has been imposed on producers. The equilibrium price
rises from P1 to P2 whilst quantity falls from Q1 to Q2.
15. Note that the effect of an ad valorem tax is to cause a pivotal shift in the supply curve
This is because the tax is a percentage of the unit cost of supplying the product. So a
good that could be supplied for a cost of £50 will now cost £58.75 when VAT of 17.5%
is applied whereas a different good that costs £400 to supply will now cost £470 when
the same rate of VAT is applied
The absolute amount of the tax will go up as the market price increases
Tobacco is an example of a product on which both specific and ad valorem taxes are
applied.