XMM-Newton view of the central Milky Way

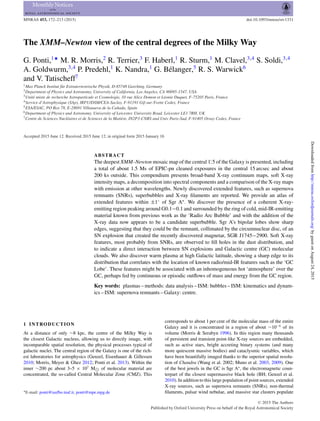
Novas imagens do Observatório de Raios-X XMM-Newton da ESA revelaram alguns dos processos mais intensos que acontecem no coração da nossa Via Láctea. As fontes brilhantes e pontuais que se destacam por toda imagem indicam os sistemas estelares binários onde uma das estrelas atingiu o final de sua vida, desenvolvendo para um objeto compacto e denso – uma estrela de nêutrons ou um buraco negro. A região central da Via Láctea também contém jovens estrelas e aglomerados estelares e algumas dessas fontes são visíveis como pontos brancos e vermelhos brilhando na imagem, que se espalha por 1000 anos-luz. A maior parte da ação ocorre no centro, onde nuvens difusas de gás estão sendo cavadas por ventos poderosos soprados por estrelas jovens, bem como por supernovas.

Recomendados
Recomendados
Mais conteúdo relacionado
Mais procurados
Mais procurados (20)
Destaque
Destaque (20)
Semelhante a XMM-Newton view of the central Milky Way
Semelhante a XMM-Newton view of the central Milky Way (20)
Mais de Sérgio Sacani
Mais de Sérgio Sacani (20)
Último
Último (20)
XMM-Newton view of the central Milky Way
- 1. MNRAS 453, 172–213 (2015) doi:10.1093/mnras/stv1331 The XMM–Newton view of the central degrees of the Milky Way G. Ponti,1‹ M. R. Morris,2 R. Terrier,3 F. Haberl,1 R. Sturm,1 M. Clavel,3,4 S. Soldi,3,4 A. Goldwurm,3,4 P. Predehl,1 K. Nandra,1 G. B´elanger,5 R. S. Warwick6 and V. Tatischeff7 1Max Planck Institut f¨ur Extraterrestrische Physik, D-85748 Garching, Germany 2Department of Physics and Astronomy, University of California, Los Angeles, CA 90095-1547, USA 3Unit´e mixte de recherche Astroparticule et Cosmologie, 10 rue Alice Domon et L´eonie Duquet, F-75205 Paris, France 4Service d’Astrophysique (SAp), IRFU/DSM/CEA-Saclay, F-91191 Gif-sur-Yvette Cedex, France 5ESA/ESAC, PO Box 78, E-28691 Villanueva de la Ca˜nada, Spain 6Department of Physics and Astronomy, University of Leicester, University Road, Leicester LE1 7RH, UK 7Centre de Sciences Nucl´eaires et de Sciences de la Mati`ere, IN2P3-CNRS and Univ Paris-Sud, F-91405 Orsay Cedex, France Accepted 2015 June 12. Received 2015 June 12; in original form 2015 January 16 ABSTRACT The deepest XMM–Newton mosaic map of the central 1.◦ 5 of the Galaxy is presented, including a total of about 1.5 Ms of EPIC-pn cleaned exposures in the central 15 arcsec and about 200 ks outside. This compendium presents broad-band X-ray continuum maps, soft X-ray intensity maps, a decomposition into spectral components and a comparison of the X-ray maps with emission at other wavelengths. Newly discovered extended features, such as supernova remnants (SNRs), superbubbles and X-ray filaments are reported. We provide an atlas of extended features within ±1◦ of Sgr A . We discover the presence of a coherent X-ray- emitting region peaking around G0.1−0.1 and surrounded by the ring of cold, mid-IR-emitting material known from previous work as the ‘Radio Arc Bubble’ and with the addition of the X-ray data now appears to be a candidate superbubble. Sgr A’s bipolar lobes show sharp edges, suggesting that they could be the remnant, collimated by the circumnuclear disc, of an SN explosion that created the recently discovered magnetar, SGR J1745−2900. Soft X-ray features, most probably from SNRs, are observed to fill holes in the dust distribution, and to indicate a direct interaction between SN explosions and Galactic centre (GC) molecular clouds. We also discover warm plasma at high Galactic latitude, showing a sharp edge to its distribution that correlates with the location of known radio/mid-IR features such as the ‘GC Lobe’. These features might be associated with an inhomogeneous hot ‘atmosphere’ over the GC, perhaps fed by continuous or episodic outflows of mass and energy from the GC region. Key words: plasmas – methods: data analysis – ISM: bubbles – ISM: kinematics and dynam- ics – ISM: supernova remnants – Galaxy: centre. 1 INTRODUCTION At a distance of only ∼8 kpc, the centre of the Milky Way is the closest Galactic nucleus, allowing us to directly image, with incomparable spatial resolution, the physical processes typical of galactic nuclei. The central region of the Galaxy is one of the rich- est laboratories for astrophysics (Genzel, Eisenhauer & Gillessen 2010; Morris, Meyer & Ghez 2012; Ponti et al. 2013). Within the inner ∼200 pc about 3–5 × 10⁷ M of molecular material are concentrated, the so-called Central Molecular Zone (CMZ). This E-mail: ponti@iasfbo.inaf.it, ponti@mpe.mpg.de corresponds to about 1 per cent of the molecular mass of the entire Galaxy and it is concentrated in a region of about ∼10−6 of its volume (Morris & Serabyn 1996). In this region many thousands of persistent and transient point-like X-ray sources are embedded, such as active stars, bright accreting binary systems (and many more quiescent massive bodies) and cataclysmic variables, which have been beautifully imaged thanks to the superior spatial resolu- tion of Chandra (Wang et al. 2002; Muno et al. 2003, 2009). One of the best jewels in the GC is Sgr A , the electromagnetic coun- terpart of the closest supermassive black hole (BH; Genzel et al. 2010). In addition to this large population of point sources, extended X-ray sources, such as supernova remnants (SNRs), non-thermal filaments, pulsar wind nebulae, and massive star clusters populate C 2015 The Authors Published by Oxford University Press on behalf of the Royal Astronomical Society byguestonAugust24,2015http://mnras.oxfordjournals.org/Downloadedfrom
- 2. XMM–Newton view of the Milky Way centre 173 the GC (Wang et al. 2002). The GC is considered a mini-starburst environment, giving us the possibility of studying the interaction between SNRs and molecular clouds and the impact of massive- and-young star clusters on their surroundings. It allows us to image, in superb detail, the creation and evolution of bubbles and super- bubbles and the generation of Galactic outflows, powered by past starbursts and/or accretion events on to Sgr A , and their impact on the GC environment. Warm (kT ∼ 1 keV) and hot (kT ∼ 6.5 keV) thermal plasma emis- sion plus non-thermal hard X-ray emission associated with X-ray reflection nebulae (see Ponti et al. 2013 for a review) pervade the central region, producing a high background of soft and hard X-ray radiation. About 90 per cent (Ebisawa et al. 2001; Wang et al. 2002) of the soft X-ray emission appears to be due to a diffuse, patchy and thermal component (Bamba et al. 2002) with a temperature kT ∼ 1 keV, most probably associated with SNRs. The origin of the hot component is, instead, still highly debated. At ∼1.◦ 5 from the GC, ∼80 per cent of this emission has been resolved into point sources (e.g. accreting white dwarfs and coronally active stars) by a deep Chandra observation (Revnivtsev et al. 2009). Although the in- tensity of the hot-plasma emission increases rapidly towards the GC, point sources continue to make a substantial contribution to the ob- served hard emission (Muno et al. 2004; Heard & Warwick 2013a). Additionally, some of the emission may arise due to scattering of the radiation from bright X-ray binaries by the dense interstellar medium (Sunyaev, Markevitch & Pavlinsky 1993; Molaro, Khatri & Sunyaev 2014). Nevertheless, it is not excluded that a truly dif- fuse hot-plasma component is also present in the GC (Koyama et al. 2009; Uchiyama et al. 2013). Such hot plasma would be unbound to the Galaxy and it would require a huge energy (E ∼ 1055 erg) and energy loss rate of the mass outflow of ∼1043 erg s−1 , correspond- ing to a rate of 1 supernova/yr, to continuously replenish it (Tanaka 2002). However, it has recently been proposed that such hot plasma might be trapped by the GC magnetic field (Nishiyama et al. 2013). Indeed, the magnetic field is thought to be an important ingredient of the GC environment. The first high-resolution radio images of the Milky Way centre (see the bottom panel of Fig. 6), revealed the presence of many straight, long (up to ∼20–30 pc) and thin (with width 0.1 pc), linearly polarized vertical filaments with spectral index consistent with synchrotron radiation (Yusef-Zadeh, Morris & Chance 1984; Yusef-Zadeh et al. 1987a,b; Anantharamaiah et al. 1991; Lang, Morris & Echevarria 1999; LaRosa et al. 2000). These filaments are hypothesized to be magnetic flux tubes trapping en- ergetic electrons and therefore tracing the diffuse interstellar GC poloidal magnetic field (Morris & Yusef-Zadeh 1985; Lang et al. 1999). A staggeringly powerful poloidal magnetic field pervading the GC, with a field strength of B 50 µG, and very possibly B ∼ 1 mG, has been inferred (Morris 1990; Crocker et al. 2010; Ferri`ere et al. 2011). The details of the physical process creating the filaments and energising the magnetic field are still debated; however, it appears clear that the magnetic filaments are interacting with the ionized surfaces of massive molecular clouds. Recent far-infrared/sub-millimetre polarization studies of ther- mal dust emission made it possible to probe the direction of the interstellar magnetic field inside dense molecular clouds. The mag- netic field threading GC molecular clouds is measured to be par- allel to the Galactic plane (Chuss et al. 2003; Novak et al. 2003; Nishiyama et al. 2009). Therefore, it appears that the large-scale GC magnetic field is poloidal in the diffuse interstellar medium and toroidal in dense regions in the plane. If the strength of the diffuse magnetic field is on the high side (B ∼ 1 mG) a huge amount of mag- netic energy, E ∼ 1055 erg, would be stored in the central ∼300 pc. This is comparable to the kinetic energy associated with the rotation of the gas in the CMZ. Therefore, it is thought to be a key player for the GC physics and phenomenology. A large-scale structure with a possible magnetic origin and ap- pearing to be interacting with massive clouds of the CMZ (similar to the non-thermal filaments) is the Galactic centre lobe (GCL). The GCL has a limb-brightened shell structure in the 10.5 GHz map, defined primarily by two spurs (see figs 1 and 2 of Law et al. 2009). The eastern one arises from the location of the GC Radio Arc,1 while the second starts from the Sgr C thread. It was proposed that the GCL is produced by channelling of plasma from the Galactic plane, induced by energetic GC activity (e.g. episode of AGN ac- tivity, or a large mass outflow due to the high star formation rate, etc.; see Law, Brentjens & Novak 2011) or from twisting of poloidal magnetic field lines by Galactic rotation (Sofue et al. 1984, 1985; Uchida 1985, 1990; Shibata 1989). Located at the western limb of the GCL is an interesting feature, AFGL 5376 (Uchida et al. 1994), an unusually warm, shock heated and extended IR source, thought to be associated with the GCL. All major X-ray telescopes devoted a significant fraction of their time to the study of the GC. Chandra invested several Ms to monitor both Sgr A ’s activity (Baganoff et al. 2001, 2003; Neilsen et al. 2013) as well as diffuse soft and hard X-ray emission (Wang et al. 2002; Park et al. 2004). Suzaku and Swift also performed large observational campaigns to scan the Milky Way centre (Koyama et al. 2007; Degenaar & Wijnands 2010) and monitor the transients in the region (Degenaar et al. 2012). The study of the GC is one of the key programmes of the NuSTAR mission (Harrison et al. 2013; Mori et al. 2013; Barri`ere et al. 2014). XMM–Newton completed a first shallow (∼30 ks total cleaned exposure in each point) scan of the CMZ within a couple of years after launch (see the conference proceedings: Decourchelle et al. 2003; Sakano et al. 2003, 2004). A larger amount of time (more than ∼1.5 Ms) has been invested by XMM–Newton on studying the emission properties of Sgr A (Goldwurm et al. 2003; Porquet et al. 2003, 2008; B´elanger et al. 2005; Trap et al. 2011; Mossoux et al. 2014), focusing on the central ∼15 arcmin, only. Using the XMM–Newton observations from the shallow scan of the CMZ together with a number of the Sgr A pointings, Heard & Warwick (2013a,b) have investigated the distribution of the X-ray emission within the central region of the Galaxy. With the aim of studying the propagation of echoes of the past GC activity within the CMZ (Sunyaev et al. 1993; Koyama et al. 1996, 2008; Revnivtsev et al. 2004; Muno et al. 2007; Inui et al. 2009; Ponti et al. 2010, 2013; Terrier et al. 2010; Capelli et al. 2011, 2012; Nobukawa et al. 2011; Clavel et al. 2013, 2014; Ryu et al. 2013; Krivonos et al. 2014), recently, a new deep (with ∼100 ks exposure at each location) XMM–Newton scan of the CMZ has been completed (in fall 2012). We present here the combined images of both the new and old XMM–Newton scans, as well as all the XMM– Newton observations within the central degree of the Galaxy. In Section 2, we present the data reduction process and the key steps to produce the GC EPIC mosaic maps. Section 3 introduces the broad-band X-ray images, discussing the (transient) emission from the brightest point sources, the contribution from the fore- ground emission, as well as the soft and hard GC diffuse emission. In Section 4, the narrow-band images at the energies of the soft X-ray lines are displayed. Section 5 presents a new technique of 1 This is a well-known radio feature (see Fig. 6) composed of an array of straight, long, thin and linearly polarized vertical filaments, indicating the importance of the GC magnetic field. MNRAS 453, 172–213 (2015) byguestonAugust24,2015http://mnras.oxfordjournals.org/Downloadedfrom
- 3. 174 G. Ponti et al. spectral-imaging decomposition of the soft X-ray emission into three physical components. Section 6 presents an atlas of all the new and known diffuse features within the surveyed area. Section 7 presents the comparison with the distribution of column density of intervening matter. Discussion and conclusions are in Sections 8 and 9, respectively. Hereafter, unless otherwise stated, we will state all locations and positions in Galactic coordinates and Galactic cardinal points. Errors are given at 90 per cent confidence for one interesting parameter. 2 DATA REDUCTION AND CLEANING The new XMM–Newton CMZ scan has been performed in 2012 starting on August 30 and ending on October 10. It comprises of 16 XMM–Newton (Jansen et al. 2001) observations all performed with all the EPIC instruments in full-frame CCD readout mode with the medium optical blocking filters applied (we refer to Tables A1 and A2 for more details on the instruments set-ups). This paper is not limited to the use of the 2012 XMM–Newton scan of the CMZ. Instead, it is using all XMM–Newton observations pointed within 1◦ from Sgr A . Therefore we combined the 16 observations of the new CMZ scan with the 14 observations of the previous CMZ scan accumulated between 2000 and 2002. We also include the 30 observations pointing at Sgr A and other 49 observations aimed at studies of different sources in the vicinity of Sgr A (see Tables A1 and A2). We performed the analysis of the EPIC data with the version 13.0.0 of the XMM–Newton Science Analysis System (SAS). Periods of increased particle background have been removed from the data. To perform this, we first selected the good time intervals (GTIs) starting from the 7–15 keV background light curves, then we applied a threshold of 8 and 2.5 counts ks−1 arcmin−2 for EPIC pn (Str¨uder et al. 2001) and EPIC MOS (Turner et al. 2001), respectively (see e.g. Haberl et al. 2012). The chosen thresholds efficiently cut out all the periods of most extreme activity of soft proton flares. We noted, however, that an enhanced, but weak, background activity was still present in the data during several observations. Because of the non-uniform distribution of the GC diffuse emission, lowering the threshold uniformly in all observations, would result in cutting truly GTIs in observations with higher GC diffuse emission. Thus we decided to visually inspect the background light curve of all data sets and select a different threshold for each observation (see Tables A1 and A2). Such as in Haberl et al. (2012), when the data from several detectors were available, we combined the GTIs using only common time intervals, otherwise we included GTIs of the single detector. Most of the 2012 CMZ scan data were affected by negligible particle flaring activity. On the other hand, many of the previous observations have been severely affected by soft proton flares (see the reduction in exposure in Tables A1 and A2). To prevent infrared, optical and UV photons from bright sources in the field of view that would increase the noise and degrade the CCD energy scale, the different XMM–Newton observations have been performed with different filters applied, according to the optical–UV brightness of the sources in the field of view (see Tables A1 and A2). In particular, we used the filter wheel closed observations to remove the internal EPIC background. 2.1 Images and exposure maps Images and exposure maps, corrected for vignetting, have been produced with an image pixel size of 2 arcsec × 2 arcsec for each energy band (for the definition of all bands, see Section 2.2). To increase the sky coverage, we selected EPIC-pn events requiring (FLAG & 0xfa0000) = 0, which also includes events in pixels next to bad pixels or bad columns. Moreover, we used single to double pixel events. EPIC-MOS events were required to have FLAG = 0 and single to quadruple-pixel events were allowed. Fig. 1 shows the combined EPIC exposure map that covers the entire CMZ. Such as done in Sturm et al. (2013), EPIC-MOS1 and -MOS2 exposures are weighted by a factor of 0.4 relative to EPIC-pn, before being added to the latter, to account for the lower effective area. Therefore, the exposure times obtained correspond to the equivalent total EPIC-pn exposure time. This allows us to obtain a better combination of EPIC-pn and EPIC-MOS data for image display purposes. We note, however, that the fluxes cannot be easily read out directly from these combined images. Therefore, the line profiles and the measured fluxes/luminosities are computed from the EPIC-pn and each EPIC-MOS map separately and then combined (averaged) to obtain a better signal to noise. The top panel of Fig. 1 shows that more than 1.5 Ms of clean (after cut of time intervals during increased particle background activity) exposure time (EPIC-pn equivalent) has been accumulated on Sgr A and over ∼100–200 ks are present in each point of the CMZ. The few pointings above and below the plane have exposures between ∼15and40 ks. Regions with less than 7.2 ks of equivalent EPIC-pn exposure have been masked out. To check the impact of the bright transients on the images and on the physical quantities under investigation, two sets of maps have been created. The first series keeps all bright transients and point sources, while the second set removes their emission by excising from the data extended regions including the transients whenever they were in outburst (see Section 3.1). The middle and bottom panels of Fig. 1 show the exposure maps (computed in the same way) for the observations of new and old CMZ scans, separately. The maximum exposure times are ∼190 and ∼45 ks during the new and old scan, respectively. 2.2 Energy bands We created images in several energy bands (see Table 1). Fig. 2 shows the EPIC-pn spectra of the extended emission from several regions within the CMZ. In red and black are the spectra from the G0.11−0.11 and Center Superbubble regions, respectively (see Fig. 6). Both regions are located within 15 arcmin from Sgr A , thus they have excellent statistics because of the large exposure. In green and blue are the pn spectra of G0.687−0.146 and Sgr B1 soft, respectively, both are located further out, thus having lower exposure. We first selected the standard broad energy bands for the con- tinuum with the softer band being: E = 0.5–2 keV; the medium 2–4.5 keV and the hard 4.5–12 keV (see Table 1). We note that, at high energies, the EPIC-pn camera shows strong instrumental background emission lines due to Ni K α (at E ∼7.47 keV), Cu K α (∼8.04 keV) and ZnCu (∼8.63 and 8.87 keV) that strongly contribute to the observed X-ray emission in the hard band (see Freyberg et al. 2004). To avoid contamination from these strong internal background lines, we do not consider (for the EPIC-pn im- ages) photons in the 7.2–9.2 keV range (see Fig. 2 and Table 1). We chose these broad energy bands because they are typically used as input by the standard XMM–Newton point source detection al- gorithm and for comparison to other similar surveys of nearby galaxies (e.g. M33: Misanovic et al. 2006; T¨ullmann et al. 2011; M31: Henze et al. 2014; Stiele et al. 2011; LMC: Haberl et al. 1999; SMC: Haberl et al. 2012; Sturm et al. 2013). However we note that, MNRAS 453, 172–213 (2015) byguestonAugust24,2015http://mnras.oxfordjournals.org/Downloadedfrom
- 4. XMM–Newton view of the Milky Way centre 175 Figure 1. Top panel: combined exposure map of all the XMM–Newton EPIC-pn + MOS1 + MOS2 observations within 1◦ from Sgr A . Such as done in Sturm et al. (2013), EPIC-MOS1 and -MOS2 exposure is weighted by a factor of 0.4 relative to EPIC-pn to account for the lower effective area. The exposure times, thus, correspond to the equivalent total EPIC-pn exposure time. Regions with less than 7.2 ks of equivalent EPIC-pn exposure have been masked out. The cleaned EPIC-pn equivalent exposure time is reported in seconds. Medium panel: similar exposure map for the observations of the new CMZ scan only. Bottom panel: similar exposure map for the old CMZ scan only (regions with less than 7.2 ks of equivalent EPIC-pn exposure are included). The maximum exposure times are ∼1.5 Ms, ∼190 ks and ∼45 ks during the total, new and old scan, respectively. given the typical GC neutral column density of several 1022 cm−2 , the low-energy absorption cut-off occurs at the highest energies of the standard soft band, making standard broad-band RGB im- ages poorly sensitive to column density fluctuations. For this reason we define a second set of broad-bands, the ‘GC continuum bands’ (see Table 1). The first band (E = 0.5–1.5 keV) contains mainly emission from foreground sources. The second band (E = 1.5– 2.6 keV) is selected in order to contain the low-energy GC neutral absorption cut-off, thus making it more sensitive to either column density or soft gas temperature variations. While the ‘GC medium’ (E = 2.6–4.5 keV) and the ‘GC hard’ (E = 4.5–12 keV) bands are similar to the standard broad-bands. We also selected images at the energies of the soft emission lines, such as Si XIII, S XV, Ar XVII and Ca XIX. To perform continuum MNRAS 453, 172–213 (2015) byguestonAugust24,2015http://mnras.oxfordjournals.org/Downloadedfrom
- 5. 176 G. Ponti et al. Table 1. Energy bands used for each of the different continuum, and nar- row line images. Also shown are the energy bands used to determine the continuum underlying the line emission. Units are in keV. Several energy bands, at lower energies compared to the Fe K lines, have been computed to determine the best continuum subtraction for the Fe K lines. Standard continuum bands: Soft Medium Harda 0.5–2 2–4.5 4.5–12 GC continuum bands: Fore GC soft GC medium GC harda 0.5–1.5 1.5–2.6 2.6–4.5 4.5–12 Soft emission lines: Si XIII S XV Ar XVII Ca XIX 1.80–1.93 2.35–2.56 3.03–3.22 3.78–3.99 Continuum subtraction soft emission lines: Red–Si Si–S S–Ar Ar–Ca Blue–Ca 1.65–1.77 2.1–2.3 2.7–2.97 3.27–3.73 4.07–4.5 Fe K lines: Fe K α Fe XXV 6.3–6.5 6.62–6.8 Continuum subtraction Fe K: CFe K CsFe K CmFe K ChFe K soft medium hard 5–6.1 4.0–4.7 4.7–5.4 5.4–6.1 aTo avoid contribution from the strong internal detector background emis- sion lines, present in the EPIC-pn camera (such as Ni K α, Cu K α and ZnCu), we do not consider photons in the 7.2–9.2 keV from this instrument (on the other hand, we consider such photons detected in the EPIC-MOS cameras). Figure 2. EPIC-pn spectra of the regions: G0.11−0.11 (red), Center Super- bubble (black), G0.687−0.146 (green) and Sgr B1 soft (blue). In dark green are the energy bands of the broad GC continuum. In orange (bottom right) is shown the part of the hard energy band excluded in order to avoid con- tamination by Ni K α, Cu K α and ZnCu instrumental background emission lines. Yellow stripes show the energy bands of the soft and Fe K emission lines. Blue stripes indicate the regions selected for the determination of the amount of continuum underlying the soft lines. The dotted lines, from top to bottom, show the predicted emission of a source with a power-law spectrum (with slope = 1.6) if absorbed by a column density of NH = 3, 5 and 9 × 1022 cm−2, respectively. The blue and orange labels indicate the selected broad energy bands for the determination of the continuum underlying the Fe K line emission. subtracted line intensity maps as well as line equivalent width maps, it is essential to measure the level of the continuum underlying the emission line. Therefore, we created also several images in energy bands on each side of the soft emission lines2 (selecting, as far as possible, energy ranges free from line emission; see Fig. 2 and Table 1). In the Fe K region we selected two energy bands for the Fe K α and Fe XXV emission. At energies higher than Fe XXV the presence of both Fe K β, Fe XXVI, and of the Fe K edge can give a significant contribution. At even higher energies (E ∼ 7.5–8 keV) the con- tribution from internal background emission line (in the EPIC-pn camera) becomes very important, thus we decided to determine the continuum emission underlying the Fe K line emission (important to determine the Fe K line intensities and equivalent widths) through the extrapolation of the continuum redwards of the Fe K lines (see Fig. 2 and Table 1). The Fe K line emission and its variations will be the prime scientific focus of two future publication (Ponti et al. in preparation; Soldi et al. in preparation; see also Ponti et al. 2014; Soldi et al. 2014) and will not be discussed here any further. All images were exposure corrected and, to remove readout streaks, the images from EPIC-pn were corrected for out-of-time (OoT) events. Noisy CCDs in the MOS data (Kuntz & Snowden 2008) have been searched with the SAS task emtaglenoise and re- moved from the mosaic images. 2.2.1 Stray-light rejection Because the GC region is crowded with many bright (transient) X- ray sources, several observations, including the new XMM–Newton scan, are badly affected by stray light (see Fig. 3). Stray light is produced by photons from sources located outside of the XMM– Newton EPIC instrument’s fields of view and singly reflected by the mirror hyperbolas, thus creating concentric arc-like structures in the detector plane (see XMM–Newton user handbook). The stray-light contribution is small (the effective collecting area for stray light is less than ∼0.2 per cent of the effective on-axis area), but a very bright source can have an important impact up to ∼1.◦ 4 outside the field of view. Analogously to the removal of bright transients, we masked the strongest stray-light artefacts in the images of individual observa- tions. In most cases, affected regions are covered by other unaffected observations, thus leaving no features in the final mosaic map. To remove a stray-light artefact, we defined a rough region including the artefact and an individual cut-off value of the surface brightness. Using this cut-off, we created a mask from an image of this region in the total energy band that has been smoothed with a Gaussian kernel with an FWHM of 10 arcsec beforehand. This mask was multiplied by all images and exposure maps of this observation. 2.2.2 Adaptive smoothing All images have been smoothed separately using the SAS tool AS- MOOTH. To prevent different smoothing patterns from introducing colour artefacts in RGB images, we adaptively smoothed all energy bands in such images with the same smoothing template. For the broad-band XMM–Newton continuum RGB images (see Figs 3–9), we required a minimum signal-to-noise ratio of 6 in the 0.5–12 keV 2 The energy band redwards of the Si XIII line extends only down to 1.65 keV, because of the presence of the strong Al K α background emission line at E ∼1.49 keV (Freyberg et al. 2004). MNRAS 453, 172–213 (2015) byguestonAugust24,2015http://mnras.oxfordjournals.org/Downloadedfrom
- 6. XMM–Newton view of the Milky Way centre 177 Figure3.Standardbroadenergyband(seeTable1andFig.2)RGBmosaicimageofallXMM–Newtonobservationswithin1◦ofSgrA(seeTableA1).ThisrepresentsthedeepestX-rayviewoftheCMZregion withexposurehigherthan0.2MsalongtheGalacticdiscand1.5Msinthecentre(seeFig.1).X-rayemissionfromX-raybinaries,starclusters,SNRs,bubblesandsuperbubbles,HIIregions,PWNs,non-thermal filaments,nearbyX-rayactivestars,thesupermassiveBHSgrAandmanyotherfeaturesareobserved(seeFigs5and6).Thedetectorbackgroundhasbeensubtractedandadaptivesmoothingapplied.Residual featuresandholesgeneratedbycorrectionofthestraylightfromGX3+1arevisible(seealsoFig.1)atGalacticlatitudesbetweenl∼1.◦2andl∼1.◦4andlatitudesb∼−0.◦2andb∼0.◦4. MNRAS 453, 172–213 (2015) byguestonAugust24,2015http://mnras.oxfordjournals.org/Downloadedfrom
- 7. 178 G. Ponti et al. Figure4.StandardbroadenergybandRGBimageoftheXMM–NewtonCMZscanperformedin2012.TheCMZisobservedwithauniformexposure(seeFig.1). energy band image (i.e. the sum of the three energy bands composing the RGB image), as well as the standard minimum and maximum size of the smoothing Gaussian kernel of 10 arcsec (full width at half-maximum) and 200 arcsec, respectively. The signal-to-noise ratio at each pixel is defined as the value at that pixel divided by its standard deviation and the adaptive smoothing that we applied is making the signal-to-noise ratio as close as possible to 6, therefore fainter or less exposed areas are more smoothed than brighter or better exposed regions. For the narrower-band soft-line images (see Figs 10–13), we use the S xv map as a template, requiring a mini- mum signal-to-noise ratio of 4 and the same standard minimum and maximum of the smoothing kernel. The same smoothing kernel is then applied to all the other bands of the RGB images. 2.2.3 Internal particle background subtraction Unless otherwise specified, internal particle background has been removed from each broad-band image. Following Haberl et al. (2012) we first create, for each selected energy band, both the total emission and the filter wheel closed images. We then re-normalize and subtract the filter wheel closed images from the total emission images. The filter wheel closed image re-normalization factor is computed by equating, for each instrument, the number of pho- tons in the unexposed corners of the detector to that in the filter wheel closed images (see Haberl et al. 2012 for more details). This procedure is reliable and accurate for reasonably long exposures (t 5–10 ks). For this reason data sets with total clean EPIC-pn exposure shorter than 5 ks have not been considered in this analysis. 2.2.4 Continuum subtraction To subtract the continuum emission from an emission-line im- age, we define a narrow band (B) containing the line, typically sandwiched by two nearby but generally wider energy bands (A and C) that are dominated by continuum emission. Under the assump- tions that the emission in the A and C bands is dominated by the continuum and that the continuum emission can be described by a simple power-law, we could in principle determine the intensity of the continuum for each pixel of the band B image. Indeed, using the fluxes in A and C bands, it is possible to derive the continuum pa- rameters (spectral index and intensity). However, this requires the solution of non-linear equations. Therefore, we prefer to implement a different technique based on interpolation. Using XSPEC we simu- late, for power-law spectral indices going from = 0.3 to 3.6, the ratio between the observed flux (e.g. number of photons measured) in the continuum in bands A and C, compared to the simulated con- tinuum flux in band B (e.g. NB/(2 × NA) and NB/(2 × NC)). We record these ratios and then plot them as a function of the hardness ratios (NC − NA)/(NC + NA)), which is a proxy for the spectral in- dex . We then find the best-fitting linear relationship between these values, thus determining ConAB and LinAB that are then allowing us to measure the continuum emission underlying the line emission in band B (NB) from the intensity in band A (NA) and the hardness ratio (NB = 2 × NA × [ConAB + LinAB × (NC − NA)/(NC + NA)]. To reduce the uncertainties, we perform the same procedure for band C, determining ConCB and LinCB. We then average these values obtaining, for each pixel: NB = NA × [ConAB + LinAB × (NC − NA)/(NC + NA)] + NC × [ConCB + LinCB × (NC − NA)/(NC + NA)]. We finally subtract this continuum emission image from the total emission image B to determine the line intensity map. MNRAS 453, 172–213 (2015) byguestonAugust24,2015http://mnras.oxfordjournals.org/Downloadedfrom
- 8. XMM–Newton view of the Milky Way centre 179 Figure 5. Finding chart. The brightest X-ray point sources (all X-ray binaries) are labelled in white (see Table 2). In red the positions of some star clusters are reported, which are placed either in the GC or along the spiral arms of the Galaxy (see Table 3). With yellow dashed lines the location of some molecular complexes are shown. 3 THE XMM–NEWTON BROAD-BAND VIEW OF THE GC Fig. 3 shows the broad energy band mosaic image of all existing XMM–Newton observations within 1◦ from Sgr A . Fig. 4 shows the GC image obtained only with data from the 2012 XMM–Newton campaign. At the GC distance of 8 kpc, 1 arcmin corresponds to 2.3 pc, 10 pc subtends ∼4.3 arcmin and ∼0.◦ 2 corresponds to 28 pc. In red, green and blue, the soft (0.5–2 keV), medium (2–4.5 keV) and hard (4.5–12 keV) continuum bands are shown, respectively. Hundreds of point sources and strong diffuse emission are clearly observed in the map. These point sources are characterized by a wide variety of colours, ranging from distinctive red to dark blue. 3.1 Bright and transient GC point sources during the new (2012) XMM–Newton CMZ scan Many X-ray point sources are clearly visible in Figs 3 and 4. A detailed catalogue of the properties of all the detected point sources is beyond the scope of this paper. Here we briefly describe the brightest GC sources detected by XMM–Newton and the X-ray tran- sients in the field of the 2012 scan (see Degenaar et al. 2012 for a compendium of previously noted transients). The brightest GC point source of the 2012 XMM–Newton CMZ scan is 1E 1743.1−2843 (Porquet et al. 2003; Del Santo et al. 2006) a persistently accreting neutron star binary detected at an observed flux level of F2–10 keV ∼ 1.1 × 10⁻¹⁰ erg cm−2 s−1 (implying an unabsorbed flux of F2-10 keV, unab ∼ 2.6 × 10⁻¹⁰ erg cm−2 s−1 ; NH ∼ 2 × 1023 cm−2 ; obsid: 0694641201). During the 2012 XMM–Newton campaign we also detected an outburst from a new, very faint X-ray transient that we name XMMU J174505.3−291445. The source has a typical quiescent luminosity at or below LX ∼ 1033 erg s−1 , but on 2012 August 31 (during obsid 0694640201) it was observed to go into outburst for about ∼2 h and to reach a peak X-ray luminosity of LX ∼ 1035 erg s−1 . The detailed spectral and multiwavelength analysis of this new transient will be presented in a separate paper (Soldi et al. in preparation; but see also Soldi et al. 2014). Another faint X-ray transient, XMM J174457−2850.3, is de- tected in two 2012 observations: obsid: 0694641101–0694640301. The observed 2–10 keV flux is 1.1 ± 0.3 and 2.9 ± 0.6 × 10⁻¹³ erg cm−2 s−1 , respectively. A power-law fit to the spectrum with the pho- ton index fixed to the value reported by Sakano et al. (2005) yields a column density of NH = (1.4 ± 0.4) × 1023 cm−2 . This source was discovered in 2001 by Sakano et al. (2005) who reported a tentative detection of an X-ray pulsation of ∼5 s, during the ∼25 ks XMM– Newton observation. Both a visual inspection and timing analysis of the X-ray light curve show no evidence for bursts and/or dips. How- ever, even considering the four times longer exposure of the new data, we cannot exclude or confirm the ∼5 s periodic modulation because of the lower flux observed. In fact, during the 2001 XMM– Newton observation (obsid: 0112972101) XMM J174457−2850.3 had a flux about 10–40 times higher (∼45 × 10−13 erg cm−2 s−1 ) than in 2012 (in quiescence XMM J174457−2850.3 has a typical 2–10 keV flux lower than 0.2 × 10⁻¹³ erg cm−2 s−1 ). Only upper limits are measured for the other well-known X-ray transients within the field of view. The two bursters GRS 1741.9−2853 and AX J1745.6−2901 (Sakano et al. 2002; Trap et al. 2009; Ponti et al. 2014, 2015) have flux limits of F2–10 keV < 2 × 10⁻¹⁴ erg cm−2 s−1 and F2–10 keV < 10−13 erg MNRAS 453, 172–213 (2015) byguestonAugust24,2015http://mnras.oxfordjournals.org/Downloadedfrom
- 9. 180 G. Ponti et al. Figure 6. Finding charts. Top panel broad-band X-ray continuum image. White ellipses show the position and size of known, radio-detected SNRs. Cyan ellipses indicate the position and size of bright diffuse X-ray emission possibly associated with SNRs that lack a clear radio counterpart (or such in the case of G359.12−0.05 that show X-ray emission significantly displaced from the radio emission associated with the radio remnant G359.07−0.02). The magenta ellipses show the location and dimension of some bright H II regions, while the red ellipses indicate some of the largest non-thermal filaments detected in radio (see Table 4). Blue ellipses show some PWN and the yellow dashed ellipses show the regions used to accumulate the spectra shown in Fig. 2. Bottom panel: 90-cm radio image of the CMZ region obtained with the VLA (courtesy of LaRosa et al. 2000). For display purposes the radio SNRs are shown with green ellipses. The other regions have the same colour code as the top panel. The image shows the radio flux (Jy beam−1 unit). MNRAS 453, 172–213 (2015) byguestonAugust24,2015http://mnras.oxfordjournals.org/Downloadedfrom
- 10. XMM–Newton view of the Milky Way centre 181 Figure 7. Finding chart. Zoom of the central ∼10 arcmin of the Milky Way as seen by XMM–Newton (same energy bands and colour scheme as in Fig. 3). The position of Sgr A is indicated by the blue cross. The red ellipses show the position and extent of filamentary and diffuse X-ray emission features associated with, e.g. non-thermal filaments (Table 4). The magenta dashed ellipses show the location and extension of the 20 pc bipolar X-ray lobes. The black dashed ellipses indicate the position and orientation of the CND. cm−2 s−1 (obsid: 0694641101, 0694640301), respectively. Closer to Sgr A , we find an upper limit on the 2–10 keV flux of F2–10 keV < 5 × 10⁻¹² erg cm−2 s−1 towards three other sources: CXOGC J174540.0−290031, the low-mass X-ray binary showing X-ray eclipses (Muno et al. 2005b; Porquet et al. 2005b), CXOGC J174540.0−290005 (Koch et al. 2014) and the magnetar discovered on 2013 April 25 (Degenaar et al. 2013; Dwelly & Ponti 2013; Mori et al. 2013; Rea et al. 2013; Kaspi et al. 2014; Coti-Zelati et al. 2015), located at distances from Sgr A of only ∼2.9, ∼23 and ∼2.4 arcsec, respectively. Finally, we observe that both XMMU J174554.4−285456, the faint transient with a possible pulsation period of about 172 s (Por- quet et al. 2005b) and SAX J1747.7−2853, the bursting (show- ing also superbursts) X-ray transient (Wijnands, Miller & Wang MNRAS 453, 172–213 (2015) byguestonAugust24,2015http://mnras.oxfordjournals.org/Downloadedfrom
- 11. 182 G. Ponti et al. Figure 8. Top panel: neutral hydrogen column density distribution as derived from dust emission (Molinari et al. 2011). The image shows the NH distribution in logarithmic scale from NH = 4.5 × 10²² up to 3.8 × 1025 cm−2. The green, magenta and white contour levels correspond to NH = 1.5 × 10²³, 7 × 10²³ and 1.5 × 1024 cm−2, respectively. Bottom panel: X-ray continuum RGB map (Fig. 3) with the column density contours overlaid. MNRAS 453, 172–213 (2015) byguestonAugust24,2015http://mnras.oxfordjournals.org/Downloadedfrom
- 12. XMM–Newton view of the Milky Way centre 183 Figure 9. Top panel: 2–4.5 keV map. The dashed white ellipse shows the location of the radio SNR G0.30+0.04. The dashed and solid cyan ellipses show the positions of known X-ray SNRs and superbubbles, respectively. The green dashed ellipses indicate enhancements of soft X-ray-emitting gas (G0.40−0.02 was already observed in X-rays by Nobukawa et al. 2008), the magenta ellipse is used in the spectral analysis as a background region (Back in Table 7). The dashed yellow ellipse shows the location of the massive stars that could be in the tidal tail of the Quintuplet cluster (Habibi et al. 2013, 2014). Bottom panel: 850 µm map of the GC obtained with the SCUBA bolometer (Pierce-Price et al. 2000). The four green-dashed ellipses, selected because they show enhanced X-ray emission, correspond to holes in the 2 mm gas distribution. MNRAS 453, 172–213 (2015) byguestonAugust24,2015http://mnras.oxfordjournals.org/Downloadedfrom
- 13. 184 G. Ponti et al. Figure 10. Top panel: soft lines (continuum unsubtracted) RGB image of the CMZ. The Si XIII line emission is shown in red, S XV in green and Ar XVII+ Ca XIX in blue. Bottom panel: RGB image of the energy bands between soft emission lines. The Si–S band emission is shown in red (see Table 1 for a definition of the energy bands), S–Ar in green and Ar–Ca + Blue–Ca in blue. The diffuse emission in this interline continuum is very similar to the soft emission line one, suggesting that the same process is producing both the lines and the majority of the soft X-ray continuum. The colour variations within the map are modulated primarily by abundance variations (top), temperature of the emitting plasma, continuum shape and absorption. 2002; Natalucci et al. 2004; Werner et al. 2004), have flux limits of F2–10 keV < 2 × 10⁻¹³ erg cm−2 s−1 . 3.1.1 Bright sources outside the 2012 scan Three very bright sources are outside the field of view during the 2012 CMZ scan; however, they imprint their presence through bright stray-light arcs. The arc features between and south of the Sgr A and C complexes (l ∼ 359.◦ 6–359.◦ 9, b ∼ −0.◦ 15–0.◦ 4) testify that the bright X-ray burster 1A 1742-294 (B´elanger et al. 2006; Kuulkers et al. 2007) was active during the 2012 XMM–Newton campaign. The very bright arcs east of the Sgr D complex (obsid: 0694641601) are most probably produced by the very bright neutron star low- mass X-ray binary GX 3+1 (Piraino et al. 2012) located about 1.◦ 18 north-east of the arcs.3 On the far west edge of the 2012 scan a brightening is observed. This is due to 1E 1740.7−2942 (Reynolds & Miller 2010; Castro et al. 2013; Natalucci et al. 2014), a bright and persistent accreting microquasar, at only ∼1.5 arcmin from the edge of the 2012 field of view (see Fig. 3). The lack of stray light south of the Sgr B region suggests that the BH candidate IGR J17497−2821 (Soldi et al. 2006; Paizis et al. 2009) was in quiescence during these observations. Two bright X-ray bursters have been active during the 2003 XMM–Newton observation pointed to the pulsar wind nebula 3 This region is covered only by the observations of the 2012 XMM–Newton scan, therefore the removal of the stray-light arcs generates regions with null exposures in the final mosaic maps (e.g. Figs 3 and 4). MNRAS 453, 172–213 (2015) byguestonAugust24,2015http://mnras.oxfordjournals.org/Downloadedfrom
- 14. XMM–Newton view of the Milky Way centre 185 Figure 11. Top panel: RGB image composed of summed, continuum-subtracted line emission (Si XIII + S XV + Ar XVII + Ca XIX) in red, the sum of the interline continua (Si–S + S–Ar + Ar–Ca + Blue–Ca) in green and the CFe K emission in blue (see Table 1). Bottom panel: RGB image, in red the Si XIII + Si–S emission, in green the S–Ar + S XV + Ar–Ca and in blue the CFe K emission. called The Mouse, i.e. SLX 1744−299 and SLX 1744−300 (Mori et al. 2005). 3.2 Very soft emission: foreground emission Despite the presence of distinctively soft (red) point sources, Fig. 3 shows no strong, diffuse, very soft X-ray emission. This is mainly due to the very high column density of neutral hydrogen towards the GC (with typical values in the range NH ∼ 3–9 × 1022 cm−2 ; see also Section 7). Almost no GC X-ray radiation reaches us below E 1.3, 1.7 or 2.3 keV for column density values of NH 3, 5, or 9 × 1022 cm−2 , respectively (see Fig. 2). The majority of the ‘red’ sources present in the 0.5–1.5 keV band are point-like and are associated with foreground active stars characterized by an unabsorbed soft X-ray spectrum. Two clearly extended and soft X-ray-emitting sources are present in Fig. 3. These correspond to Sh2−10 and Sh2−17 (Wang et al. 2002; Dutra et al. 2003; Law & Yusef-Zadeh 2004; Fukuoka et al. 2009), two stellar clusters located in one of the Milky Way spiral arms and thus characterized by a lower column density of absorbing material, consequently appearing stronger in the 1–2.5 keV range (visible in Fig. 3 with orange colours). 3.3 Soft and hard GC emission GC radiation with energies above ∼2–3 keV can typically reach us and be detected (in green and blue in Fig. 3). GC sources with a sig- nificant continuum component (e.g. power-law or bremsstrahlung), such as observed from most GC point sources, the GC stellar clus- ters (e.g. the Arches, the Quintuplet and the Central cluster) as well MNRAS 453, 172–213 (2015) byguestonAugust24,2015http://mnras.oxfordjournals.org/Downloadedfrom
- 15. 186 G. Ponti et al. Figure 12. RGB image with colour scale chosen to highlight enhancements and depressions in the diffuse emission east of Sgr A . In red the sum of the Si–S and S XV bands is shown. In green the sum of S–Ar plus the S XV and Ar XVII bands is shown. The blue image shows the sum of the Ar–Ca plus Blue–Ca and Ca XIX bands (see Table 1 for the definition of the energy bands). as some SNRs (such as SNR G0.9+0.1 and Sgr A East) appear with a bright light blue colour. Colour gradients confirm the presence of at least two components of the diffuse emission, each having a different spatial distribution (see Figs 3 and 4). One component dominates the emission in the soft and medium energy bands, thus appearing with a distinctively green colour. Its distribution appears to be very patchy, peaking typically at the position of known SNRs. Another, harder component appears with a dark blue colour (Fig. 3). This harder emission is known to consist of at least two separate contributions. One, which is associated with intense high-ionization Fe K lines, is smoothly distributed and peaks right at the GC; it is likely produced by faint point sources (Muno et al. 2004; Revnivtsev et al. 2009; Heard & Warwick 2013a). The other, which is associated with neutral Fe K emission lines, has a patchy distribution peaking at the position of molecular cloud complexes; it is likely due to an ensemble of X- ray reflection nebulae (see Ponti et al. 2013 for a review). We also note that the Galactic plane emission is dominated by dark blue colours (Fig. 3), while regions located at b 0.◦ 2 and b −0.◦ 35 have a significantly greener colour. We address this in more detail in Sections 5, 7 and 8.7. 4 SOFT LINE EMISSION Fig. 2 shows the spectra of the diffuse emission from the regions marked in magenta in Fig. 6. The ∼1.5–5 keV band shows strong, narrow emission lines, the strongest of which are Si XIII, S XV, Ar XVII and Ca XIX. This line emission, as well as the underlying continuum and the intraline emission, are typically well fitted by a thermal model (e.g. APEC in XSPEC) with temperatures in the range 0.6– 1.5 keV (Kaneda et al. 1997; Tanaka et al. 2000; Muno et al. 2004; Nobukawa et al. 2010; Heard & Warwick 2013b). At higher energies a power-law component with intense Fe XXV and Fe XXVI lines is also observed over the entire GC region. Additionally, neutral Fe K α and K β lines are also observed. The neutral Fe K emission lines are associated with different processes, therefore they will be the focus of separate publications. 4.1 RGB images of soft emission lines The top and bottom panels of Fig. 10 show the line (continuum non- subtracted) RGB image and the interline continuum RGB image (see the caption of Fig. 10 and Table 1 for more details). We note that the soft X-ray line image shows very strong colour gradients (less dramatic colour variations are observed in the continuum image). In particular, the sources DS1 (the core of Sgr D), the western part of Sgr B1 (i.e. G0.52−0.046, G0.570−0.001), Sgr C, as well as the Chimney above it, all have a distinctively green–blue colour, while G359.12−0.05, G359.10−0.5, G359.79−0.26, G359.73−0.35 and the entire G359.77−0.09 superbubble are characterized by orange– brown colours. G0.1−0.1, the Radio Arc, the arched filaments (see fig. of Lang, Goss & Morris 2002), G0.224−0.032, and G0.40−0.02 MNRAS 453, 172–213 (2015) byguestonAugust24,2015http://mnras.oxfordjournals.org/Downloadedfrom
- 16. XMM–Newton view of the Milky Way centre 187 Figure 13. Left-hand panel: 20 µm MSX map of the GC. The contours indicate the intensity of S XV emission. Soft X-ray emission fills the arc bubble observed in the mid-IR. The green solid circle and the white dashed ellipses indicate the position of the PWN G0.13−0.11 and three structures in the soft X-ray emission map (see the right-hand panel). Right-hand panel: soft X-ray map of the GC (the same energy bands used in Fig. 12 are displayed). The position of the PWN G0.13−0.11 is indicated by a red circle with 1.5 arcmin radius. At least three sub-structures, appearing like holes, are observed within G0.1−0.1 (here indicated with white dashed ellipses). The positions of the Arches and Quintuplet star clusters are indicated by yellow dashed circles. The direction of the supersonic motion of the Quintuplet cluster is indicated and its past location is indicated by the yellow dashed line. The inferred positions of the Quintuplet 4 × 10⁴ and 9 × 10⁴ years ago are indicated with yellow crosses. The cyan dashed ellipse indicates the region in which many massive stars that might have been expelled by the Quintuplet cluster are located. are also characterized by red–brown colours; however, here a gra- dation of white and green is also present (please refer to Tables 3 and 4 and Figs 5 and 6 for the positions of the regions listed here). The lobes of Sgr A appear with a whiter colour than the surround- ings. In addition, we observe bright red–brown emission along two broad, linear ridges having relatively sharp edges to the north-west and north-east of Sgr A . This latter feature is discussed in detail in Section 8.4. In spite of the fact that these images show different components (one being dominated by emission lines, the other by continuum emission), they are remarkably similar. No clear diffuse emission component is present in one and absent from the other image. This indicates that most of the diffuse soft X-ray continuum and line emission are, indeed, produced by the same process. In addition, the differences in the ratio between photons emitted in the lines and in the continuum can add valuable information for understanding the radiative mechanism. In fact, such differences could be due, for example, to different cosmic abundances and/or variations in the relative contributions of various thermal and non-thermal radiation mechanisms. In order to better highlight these differences, we map the sum of the interline continua in the same image (see the caption of Fig. 11 and Table 1). As expected, none of the point sources is a strong soft line emitter (they in fact appear brighter in the interline image). We also note that the intense soft X-ray-emitting regions in the Galactic plane, such as Sgr D, Sgr B1, Sgr C, the Chimney and G359.9−0.125 are characterized by distinctively orange–red colours, indicating they are strong line emitters. For an alternative perspective, the bottom panel of Fig. 11 shows the Si XIII + Si–S bands in red, S–Ar + S XV + Ar–Ca in green, and CFe K in blue. These energy bands are chosen to highlight any energy dependence in the soft X-ray emission that could be due to column density variations of the obscuring matter or tem- perature fluctuations of the emitting gas. In fact, the softer energy bands (Si XIII + Si–S) will be more affected by absorption or low- temperature plasma emission compared to the medium (S–Ar + S XV + Ar–Ca) or high-energy bands. We defer the detailed discussion of the features present in these images to the discussion of the vari- ous physical components presented in Section 8 and subsections. 4.2 Continuum-subtracted soft emission line maps and profiles From top to bottom, the panels of Fig. 14 show the continuum- subtracted Si XIII, S XV, Ar XVII, Ca XIX intensity maps. Although the continuum subtraction procedure should naturally remove the emission from the line-free point sources, small fluctuations in the continuum subtraction, in the case of the brightest sources, some- times leave significant residuals. For this reason, we have masked out the brightest point sources in our computation of these maps. The different curves of Fig. 15 show the continuum-subtracted emission profiles (integrated over latitude from the magenta rectan- gle in Fig. 14) for the individual soft emission lines. The same four line profiles are compared in Fig. 15 with similar profiles in which the contribution of specific bright structures has been removed. 5 SPECTRAL DECOMPOSITION In order to better trace the relative contributions of the diffuse ther- mal (soft and hot) and non-thermal components, we have performed a simple component separation using a list of images depicting various energy bands. We use a total of 17 energy bands: 11 for the continuum4 and 6 for the lines (tracing Si XIII, S XV, Ar XVII, Ca XIX, Fe K α and Fe XXV, see Table 1). This treatment of the data 4 The 11 continuum energy bands used are 1.0–1.5 keV; 1.5–1.8 keV; 2.0– 2.35 keV; 2.55–3.05 keV; 3.25–3.75 keV; 3.95–4.70 keV; 4.70–5.40 keV; 5.40–6.30 keV; 6.50–6.60 keV; 6.80–7.80 keV and 8.20–9.50 keV. MNRAS 453, 172–213 (2015) byguestonAugust24,2015http://mnras.oxfordjournals.org/Downloadedfrom
- 17. 188 G. Ponti et al. Table 2. List of bright and transient point sources during the 2012 XMM–Newton scan as well as bright point sources observed in all scans of the region (see Fig. 5. To avoid excessive crowding around Sgr A , CXOCG J174540.0−290005 and SGR J1745−2900 are not shown). BRIGHT AND TRANSIENT POINT SOURCES Source name Coordinatesa Fluxb References Within the 2012 CMZ scan 1E 1743.1−2843 0.2608,−0.0287 110 90,92,93 XMMU J174505.3−291445 359.6756,−0.0634 14 94 XMMU J174457−2850.3 0.0076,−0.1743 0.3 90,95 GRS 1741.9−2853 359.9528,+0.1202 <0.02 90,59,96 AX J1745.6−2901 359.9203,−0.0420 <0.1 59,90,91,122 CXOGC J174540.0−290031 359.9435,−0.0465 <5 97,98 SGR J1745−2900 359.9441,−0.0468 <5 100,101,102,103 XMM J174445.5–295040 0.0506,−0.0429 <0.2 97 SAX J1747.0–2853 0.2073,−0.2385 <0.2 90,104,105,106 CXOCG J174540.0−290005 359.9497,−0.04269 <5 99 Within the total GC scan 1E 1740.7−2942 359.1160,−0.1057 110,111,112 1A 1742−294 359.5590,−0.3882 90,107,108 IGR J17497−2821 0.9532,−0.4528 90,113,114 GRO J1744−28 0.0445,+0.3015 90 XMMU J174654.1−291542 359.8675,−0.4086 90 XMMU J174554.4−285456 359.1268,−0.3143 84,85,86 SLX 1744−299 359.2961,−0.8892 37,59,87,88,89 SLX 1744−300 359.2565,−0.9111 37,59,87,88,89 aCoordinates are in Galactic format. bFluxes are given in units of 10−12 erg cm−2 s−1 and correspond to the mean flux observed during the 2012 XMM–Newton scan of the CMZ. References: (1) Wang, Dong & Lang (2006b); (2) Yusef-Zadeh et al. (2002); (3) Capelli et al. (2011); (4) Tatischeff, Decourchelle & Maurin (2012); (5) Sakano et al. (2003); (6) Habibi et al. (2013); (7) Habibi, Stolte & Harfst (2014); (8) Krivonos et al. (2014); (9) Clavel et al. (2014); (10) Dutra et al. (2003); (11) Law et al. (2004); (12) Fukuoka et al. (2009); (13) Wang et al. (2002a); (14) Tsuru et al. (2009); (15) Mori et al. (2008); (16) Mori et al. (2009); (17) Heard & Warwick (2013a); (18) Maeda et al. (2002); (19) Park et al. (2005); (20) Koyama et al. (2007b); (21) Kassim & Frail (1996); (22) Nobukawa et al. (2008); (23) Senda, Murakami & Koyama (2002); (24) Renaud et al. (2006); (25) Mereghetti, Sidoli & Israel (1998); (26) Gaensler, Pivovaroff & Garmire (2001); (27) Porquet et al. (2003b); (28) Aharonian et al. (2005); (29) Dubner, Giacani & Decourchelle (2008); (30) Nobukawa et al. (2009); (31) Sawada et al. (2009); (32) Morris et al. (2003); (33) Morris et al. (2004); (34) Markoff (2010); (35) Zhang et al. (2014); (36) Nynka et al. (2014); (37) Gaensler et al. (2004); (38) Pedlar et al. (1989); (39) Cotera et al. (1996); (40) Figer et al. (1999); (41) Johnson et al. (2009); (42) Lu, Yuan & Lou (2008); (43) Lu, Wang & Lang (2003); (44) Yusef-Zadeh et al. (2005); (45) Baganoff et al. (2003); (46) Ho et al. (1985); (47) Bamba et al. (2002); (48) LaRosa et al. (2000); (49) Morris & Yusef-Zadeh (1985); (50) Lang et al. (1999); (51) Anantharamaiah et al. (1991); (52) Yusef-Zadeh & Morris (1987b); (53) Yusef-Zadeh & Morris (1987a); (54) Yusef-Zadeh & Morris (1987c); (55) Muno et al. (2008); (56) Uchida, Morris & Yusef-Zadeh (1992); (57) Predehl & Kulkarni (1995); (58) Senda, Murakami & Koyama (2003); (59) Sakano et al. (2002); (60) Coil & Ho (2000); (61) Murakami (2002); (62) Yusef-Zadeh et al. (2007); (63) Dutra & Bica (2000); (64) Zoglauer et al. (2015); (65) Koyama et al. (2007a); (66) Nakashima et al. (2010); (67) Downes & Maxwell (1966); (68) Tanaka et al. (2009); (69) Tanaka et al. (2007); (70) Wang, Lu & Gotthelf (2006a); (71) Wang et al. (2002b); (72) Phillips & Marquez-Lugo (2010); (73) Hewitt, Yusef-Zadeh & Wardle (2008); (74) Reich & Fuerst (1984); (75) Gray (1994); (76) Roy & Bhatnagar (2006); (77) Marquez-Lugo & Phillips (2010); (78) Borkowski et al. (2013); (79) Yamauchi et al. (2014); (80) Inui et al. (2009); (81) Green (2014); (82) Yusef-Zadeh, Hewitt & Cotton (2004); (83) Nord et al. (2004); (84) Uchiyama et al. (2011); (85) Heinke et al. (2009); (86) Muno et al. (2006); (87) Mori et al. (2005); (88) Skinner et al. (1990); (89) Pavlinsky, Grebenev & Sunyaev et al. (1994); (90) Degenaar et al. (2012); (91) Ponti et al. (2014); (92) Porquet, Decourchelle & Warwick (2003a); (93) Del Santo et al. (2006); (94) Soldi et al. (2014); (95) Sakano et al. (2005); (96) Trap et al. (2009); (97) Porquet et al. (2005b); (98) Muno et al. (2005b); (99) Koch et al. (2014); (100) Degenaar et al. (2013); (101) Dwelly & Ponti (2013); (102) Rea et al. (2013); (103) Kaspi et al. (2014); (104) Wijnands et al. (2002); (105) Natalucci et al. (2004); (106) Werner et al. (2004); (107) B´elanger et al. (2006); (108) Kuulkers et al. (2007); (109) Piraino et al. (2012); (110) Castro et al. (2013); (111) Reynolds & Miller (2010); (112) Natalucci et al. (2014); (113) Soldi et al. (2006); (114) Paizis et al. (2009) (115) Lu et al. (2013); (116) Do et al. (2013); (117) Yelda et al. (2014); (118) Bamba et al. (2000); (119) Bamba et al. (2009); (120) Ohnishi et al. (2011); (121) Hales et al. (2009); (122) Ponti et al. (2015). allows us to be more confident about the spectral decomposition, e.g. compared to single RGB maps, retaining most of the mor- phological information on sufficiently large scales (i.e. beyond few arcmin scales). The general assumption is that the emission at any position can be represented by the linear sum of three main components, namely (i) a soft plasma with a temperature of 1 keV (Kaneda et al. 1997; Bamba et al. 2002); (ii) a hot plasma of temperature 6.5 keV and MNRAS 453, 172–213 (2015) byguestonAugust24,2015http://mnras.oxfordjournals.org/Downloadedfrom
- 18. XMM–Newton view of the Milky Way centre 189 Table 3. Atlas of diffuse X-ray-emitting features. The first two columns in the table indicate the name primarily used in this work to refer to the feature as well as the other names used in the previous literature. The third and fourth columns show the coordinates of each feature as well as its approximate projected size. Finally, the fifth column provides references to selected works discussing the feature. For convenience, we report in Table 2 all the references ordered according to the numbering used in this table. The other names column shows the different designations used in previous literature. In the case of bubbles, these features are not necessarily referring to the same structure but to features forming the bubble candidate. ATLAS OF DIFFUSE X-RAY-EMITTING FEATURES Name Other name or Coordinates Size References associated features (l, b) (arcmin) STAR CLUSTERS: Central cluster 359.9442, −0.046 0.33 45,115,116,117 Quintuplet 0.1604, −0.0591 0.5 1,63,11 Arches G0.12+0.02 0.1217, 0.0188 0.7 1,2,3,4,5,6,7,8,9,11,39,40 Sh2−10a DB−6 0.3072,−0.2000 1.92 10,11,12,63 Sh2−17a DB−58 0.0013, 0.1588 1.65 11,13,63 DB−05a G0.33−0.18 0.31 −0.19 0.4 11,22,63 SNR and Super-bubbles candidates: G359.0−0.9b G358.5−0.9–G359.1−0.9 359.03,−0.96 26 × 20 X-R 48,51,75,76,81,118,119 G359.07−0.02 G359.0−0.0 359.07,−0.02 22 × 10 R 14,48,51,66 G359.12−0.05 359.12,−0.05 24 × 16 X 66 G359.10−0.5b 359.10,−0.51 22 × 22 X-R 37,48,51,56,74,75,81,119,120 G359.41−0.12 359.41,−0.12 3.5 × 5.0 X 14 Chimneyc 359.46,+0.04 6.8 × 2.3 X 14 G359.73−0.35d 359.73,−0.35 4 X 58 G359.77−0.09 Superbubble 359.77,−0.09 20 × 16 X 15,16,17,58 G359.9−0.125 359.84,−0.14 15 × 3 X 15,16,17,58 G359.79−0.26e 359.79,−0.26 8 × 5.2 X 15,16,17,58 G0.0-0.16f 0.00,−0.16 X This work 20 pc lobes 359.94, −0.04 5.88 X-R 32,33,34,17 G359.92−0.09g Parachute – G359.93-0.07 359.93,−0.09 1 R 35,38,43,47,58,60,61 Sgr A East G0.0+0.0 359.963, −0.053 3.2 × 2.5 X-R 5,18,19,20,48,75,81 G0.1−0.1 Arc Bubble 0.109,−0.108 13.6 × 11 X This work G0.13.−0.11h 0.13,−0.12 3 × 3 X 17 G0.224−0.032 0.224,−0.032 2.3 × 4.6 X This work G0.30+0.04 G0.3+0.0 0.34,+0.045 14 × 8.8 R 21,48,51,81,82 G0.34+0.05 G0.33+0.04 G0.42−0.04 Suzaku J1746.4−2835.4 0.40,−0.02 4.7 × 7.4 X 22 G0.40-0.02 G0.52−0.046 0.519,−0.046i 2.4 × 5.1 This work G0.57−0.001 0.57,−0.001 1.5 × 2.9 This work G0.57−0.018j CXO J174702.6−282733 0.570,−0.018 0.2 X 23,24,58,59,68,80 G0.61+0.01j Suzaku J1747.0−2824.5 0.61,+0.01 2.2 × 4.8 X 22,65,79 G0.9+01k SNR 0.9+0.1 0.867,+0.073 7.6 × 7.2 R 25,26,27,28,29,48,75,81,82 DS1 G1.2−0.0 1.17,+0.00 3.4 × 6.9 X 31 Sgr D SNR G1.02−0.18 1.02,−0.17 10 × 8.0 R 30,31,48,51,75,77,81,82 G1.05−0.15 G1.05−0.1 G1.0−0.1 G1.4−0.1 1.4,−0.10 10 × 10 R 73,81,82 Notes. aThe low X-ray absorption towards these star clusters indicate that they are located in front of the GC region. bThe Chimney is most probably either part of a large-scale structure (see Section 8.7) or an outflow from G359.41−0.12 (Tsuru et al. 2009), therefore most probably it is not a separate SNR. cBecause of the low X-ray absorption column density (NH ∼ 2 × 1022 cm−2) this is most probably a foreground source (Bamba et al. 2000, 2009). dMost probably a foreground feature. eThis feature appears to be part of the superbubble G359.77−0.09. fNew extended X-ray feature, possibly part of the superbubble G359.77−0.09. gThe interpretation as an SNR is probably obsolete. hThis feature appears to be part of the arc bubble. iPossibly connected to G0.61+0.01. jPossibly due to a thermal filament. kX-ray emission primarily non-thermal, therefore it appears also in the next table. (iii) a non-thermal component modelled by an absorbed power-law plus a neutral, narrow iron line (with 1 keV equivalent width), that are subject to an additional absorbing column of NH = 1023 cm−2 . All three components are also absorbed by gas in front of the GC re- gion and both thermal plasmas are modelled using the APEC model in XSPEC. The resulting model is therefore PHABS (APEC + APEC + PHABS (POWERLAW + GAUSS)) and has only three free parameters: the relative normalizations of the three components. The hot-plasma compo- nent represents the emission associated with faint unresolved point sources, whose cumulative spectrum is well described by a thermal spectrum (Revnivtsev et al. 2009) plus a possibly truly diffuse hot- plasma component (Koyama et al. 2007). The spectral index of the MNRAS 453, 172–213 (2015) byguestonAugust24,2015http://mnras.oxfordjournals.org/Downloadedfrom
- 19. 190 G. Ponti et al. Table 4. Atlas of diffuse X-ray-emitting features. This table has the same structure as Table 3. Because of possible misplacements between the peak emission of the radio and X-ray counterparts of filaments, SNR, PWN and other diffuse structures (generally related to the different ages of the population of electrons traced at radio and X-ray bands), when available we give the best X-ray position (following the preference: Chandra, XMM–Newton, Suzaku), otherwise we state the radio position. We cite the literature results separating these between the X-ray (X) from the radio (R) detections. For convenience, we report in Table 2 all the references ordered according to the numbering used in this table. ATLAS OF DIFFUSE X-RAY-EMITTING FEATURES Name Other name or Coordinates Size References associate features (l, b) (arcsec) Radio and X-ray filaments and PWN candidates: Snake G359.15−0.2 359.15,−0.17 312 × 54 R 48 G539.40−0.08 359.40,−0.08 27.5 × 5.1 X 41 G359.43−0.14 359.43,−0.14 21.4 × 3.9 X 41 Sgr C Thread 359.45,−0.01 500 × 42 R 48,51 Ripple filament G359.54+0.18 359.548,+0.177 320 × 55 R 43,44,48,51 G359.55+0.16 X-ray thread 359.55,+0.16 56.1 × 8.0 X 13,41,42,43,79 Suzaku J174400−2913 Crescent G359.79+0.17 359.791,+0.16 300 × 74 R 63,50,51 Curved filament Pelican G359.85+0.47 359.859,+0.426 300 × 54 R 48,50,51 Cane G359.87+0.44 359.87,+0.44 420 × 50 R 48 G359.85+0.39 Sgr A−E G359.889−0.081- wisp 359.889,−0.081 20 × 5 R X 5,35,41,42,43,44,50,55 XMM J174540−2904.5 G359.89−0.08 G359.897−0.023 359.897,−0.023 6.4 × 4 X 55 G359.899−0.065 Sgr A−F 359.899,−0.065 6.5 × 2.5 X 42,44,55 G359.90−0.06 G359.904−0.047 359.904,−0.047 6.5 × 3 X 55 G359.915−0.061 359.915,−0.061 7 × 2 X 55 G359.91−1.03 359.919,−1.033 138 × 36 R 48 G359.921−0.030 F7 359.921,−0.030 7.5 × 3 X 42,55 G359.921−0.052 359.921,−0.052 5.5 × 2 X 55 The Mouse G359.23−0.82 359.30,−0.82 156 × 108 PWN F 37,48,57,121 G359.925−0.051 359.925,−0.051 8 × 2.2 X 55 G359.933−0.037 F2 359.934,−0.0372 12 × 3 X 41,42,55 G359.933−0.039 F1 359.933,−0.039 5 × 2 X 42,55 G359.941−0.029 359.941,−0.029 6 × 2 X 41,55 Stellar wind G359.942−0.045 359.942,−0.045 5 × 3 X 55 G359.944−0.052 359.944,−0.052 9 × 1.5 X 41,55 G359.945−0.044 359.945,−0.044 6 × 2.5 X 41,1,42,55 PWN G359.95−0.04 359.950,−0.043 10 × 4 X 55,70 PWN G359.956−0.052 359.956,−0.052 4 × 2.5 X 55 G359.959−0.027 F5 359.959,−0.027 9 × 3 X 41,42,55 Southern thread G359.96+0.09 359.96,+0.11 500 × 40 R 48,50,51 359.96+0.09 G359.962−0.062 359.962,−0.062 5.5 × 3.5 X 55 G359.964−0.053 F3 359.964,−0.053 16 × 3.5 X 41,42,45,55 PWN G359.965−0.056 F4 359.965,−0.056 9 × 3 X 42,55 G359.969−0.033 359.969,−0.033 5 × 2 X 55 G359.970−0.009 F8 359.970,−0.009 10 × 2.5 X 41,42,55 PWN G359.971−0.038 F6 359.971,−0.038 16 × 8 X 41,42,55 PWN G359.974−0.000 F9 359.974,−0.000 7 × 2 X 42 G359.977−0.076 359.977,−0.076 6 × 4 X 55 Cannonball J174545.5−285829 359.983,−0.0459 30 × 15 X-R PWN 36 G359.983−0.040 359.983,−0.040 6.5 × 4.5 X 42,55 G359.98−0.11 359.979,−0.110 Streak R 50 G0.007−0.014 G0.008−0.015 0.008,−0.015 11 × 3.5 X 41,55 G0.014−0.054 0.014,−0.054 18 × 14 X 55 G0.017−0.044 MC2 0.017,−0.044 15 × 4 X 41,42 FeKa G0.02+0.04 0.0219,+0.044 Streak R 50 G0.021−0.051 0.021,−0.051 15 × 12 X 55 G0.029−0.08 0.029,−0.08 29 × 18 X 55 G0.032−0.056 G0.029−0.06 – F10 0.0324,−0.0554 35 × 6 FeKa 41,42,55 PWN G0.03−0.06 MNRAS 453, 172–213 (2015) byguestonAugust24,2015http://mnras.oxfordjournals.org/Downloadedfrom
- 20. XMM–Newton view of the Milky Way centre 191 Table 4 – continued ATLAS OF DIFFUSE X-RAY-EMITTING FEATURES Name Other name or Coordinates Size References associate features (l, b) (arcsec) Radio and X-ray filaments and PWN candidates: G0.039−0.077 0.039,−0.077 22 × 15 X 55 G0.062+0.010 G0.06+0.06 0.062,+0.010 40 × 25 R 50,55 Northern thread G0.09+0.17 0.09,+0.17 714 × 48 R 48,49,50,51 G0.08+0.15 G0.097−0.131 0.097,−0.131 70 × 50 X 55 Radio Arc GCRA 0.167,−0.07 1690 × 145 R 38,48,49,50,51 G0.16−0.15 G0.116−0.111 0.116,−0.111 50 × 40 X 55 G0.13−0.11 0.13,−0.11 55 × 12 71,17,41,42 PWN G0.15−0.07 Steep spectrum of Radio Arc 0.138,−0.077 R 50 XMM J0.173−0.413 G0.17−0.42 0.173,−0.413 180 × 18 X This work S5 0.17,−0.42 160 × 9 R 82 G0.223−0.012 0.223,−0.012 50 × 20 X 41 G0.57−0.018a CXO J174702.6−282733 0.57,−0.0180 0.33 X 23,24,58,59,68,79,80 G0.61+0.01a 0.61,+0.01 132 × 288 X 22,65,79 G0.9+0.1 0.9,+0.1 PWN aPossibly part of a young SNR. non-thermal component is assumed to be = 2, consistent with the values measured through the combined spectral fits of XMM– Newton spectra with higher energy data (e.g. INTEGRAL and/or NuSTAR; Terrier et al. 2010; Mori et al. 2015, submitted; Zhang et al. 2015, submitted). The strongest assumptions in this approach are that the emission can be represented everywhere with these three components. This obviously fails on bright point sources or on regions where the emis- sion is much hotter (e.g. Sgr A East). For the soft components the even stronger assumption is that absorption to the GC is assumed to be uniform over the CMZ at a value of NH = 6 × 1022 cm−2 (Sakano et al. 2002; Ryu et al. 2009), putting aside absorption in the GC region itself. Clear column density modulations are ob- served towards different lines of sight (e.g. Ryu et al. 2009; Ryu et al. 2013). We tested significantly different column densities (up to NH = 1.5 × 1023 cm−2 characteristic of several GC sources; see e.g. Baganoff et al. 2003; Rea et al. 2013; Ponti et al. 2015). We found that if the soft plasma normalization is significantly modified, the overall morphology is consistent. We tested vari- ous values of the other parameters (spectral index or temperatures) and did not find strong effects on the soft plasma morphology or normalization. We first produced counts, exposure and background maps for each observation and each instrument. Background was obtained from cal-closed data sets distributed in the ESAS 5 calibration data base. For each observation and instrument, an average RMF is computed as well as the unvignetted ARF. For each instrument, individual observation images were reprojected using the final image astrometry and then combined to compose a mosaic. Average ARF and RMF for each instrument were obtained with the FTOOLS 6 routines ADDRMF and ADDARF. For each pixel of the final maps, we fit the measured numbers of counts in all the energy bands and instruments with a model 5 http://xmm2.esac.esa.int/external/xmm_sw_cal/background/epic_esas. shtml 6 https://heasarc.gsfc.nasa.gov/ftools/ftools_menu.html consisting of the three aforementioned components as well as the background events number and the OoT events for the EPIC-pn camera. The free parameters are the normalization of each individ- ual component. We apply Cash statistics (Cash 1979) to take into account the low statistics in each pixel. This analysis allows us to perform a rough spectral decomposition, better separating the spec- tral emission components, although retaining the maximum spatial resolution. Fig. 16 presents the map of the normalization (in units of 10−4 times the APEC normalization) of the soft thermal emission component. The normalization of the soft thermal component has a distribution similar to the one traced by the soft lines and the con- tinuum (Figs 3, 10, 11 and 14). Enhanced high-latitude soft plasma emission is observed. The white dashed lines show the position of two sharp edges in the distribution of this high-latitude emission (see also Figs 3, 10 and 11). The white solid line shows the edge of the region having more than 7.2 ks of exposure (see Fig. 1). 6 AN ATLAS OF DIFFUSE X-RAY-EMITTING FEATURES The patchy and non-uniform distribution of the diffuse emission makes the recognition of the shape, the border and connection of the different structures and components difficult. Occasionally, dif- ferent works report the same X-ray feature with different names and shapes and, in extreme cases, the same X-ray-emitting feature is associated with different larger scale complexes. In Tables 3 and 4, we report all the new X-ray features discussed in this paper, plus many GC features presented in previous works. The main purpose of these tables is to pro- vide a first step towards the building of an atlas of diffuse X-ray-emitting GC features. The table is available online at: http://www.mpe.mpg.de/HEG/GC/AtlasGCdiffuseX-ray and will be updated, should the authors be notified of missing extended features. This exercise is clearly prone to incompleteness and defi- ciencies; however, we believe this might help in providing a clearer and more systematic picture of the diffuse X-ray emission from the GC region. The spatial location and size of all these features is shown in the finding charts in Figs 5 and 6. MNRAS 453, 172–213 (2015) byguestonAugust24,2015http://mnras.oxfordjournals.org/Downloadedfrom
- 21. 192 G. Ponti et al. Figure 14. From top to bottom, continuum-subtracted Si XIII, S XV, Ar XVII, Ca XIX intensity maps of all the stacked XMM–Newton observations of the CMZ. Figure 15. Longitudinal intensity profiles of the Si XIII (red), S XV (green), Ar XVII (blue) and Ca XIX (violet) emission lines, integrated over Galactic latitude within the magenta rectangular region shown in Fig. 14. 7 THE FOREGROUND COLUMN DENSITY Given the high column densities of neutral or weakly ionized ma- terial absorbing the soft X-ray radiation, it is important to estimate the effects of X-ray obscuration. For example, a molecular complex having a column density of NH ∼ 1025 cm−2 , such as the Sgr B2 core, would completely obscure the radiation below about 4 keV, if placed in front of the GC; see Fig. 2. To calculate the effects of absorption of the X-ray emission, we computed the flux generated by a thermally emitting plasma with temperature of kT = 1 keV (using a PHABS*APEC model), in both the 2–4.5 and 4.5–10 keV bands, after being absorbed by a given column density of neutral material (see also Fig. 2). For each column density explored, we report in Table 5 the ratio of the observed flux (F2−4.5 and F4.5−10) over the respective unabsorbed (F0) flux. We note that the hard X-ray band starts to be affected (corresponding to flux reductions up to a factor of 2) for column densities up to NH ∼ 3 × 1023 cm−2 while it is heavily affected (flux reduction of a factor of 10 or more) for NH ∼ 1024 cm−2 or higher (see Table 5). At lower energies, the obscuration effect is even more pronounced. Already, for NH ∼ 3 × 1022 cm−2 , the observed flux is less than half and for NH 5 × 1023 cm−2 it is less than 0.1 per cent of its unobscured flux. This indicates that the softer band is expected to be heavily affected by absorption. MNRAS 453, 172–213 (2015) byguestonAugust24,2015http://mnras.oxfordjournals.org/Downloadedfrom
- 22. XMM–Newton view of the Milky Way centre 193 Figure 16. Map of the normalization of the soft thermal gas component (in units of 10−4 times the APEC normalization). The white lines indicate the extent of the survey having more than 7.2 ks exposure. The white dashed lines show the position of the two sharp edges in the distribution of the high-latitude plasma. Some bright point sources (i.e. 1E 1743.1−2843, AX J1745.6−2901, 1E 1740.7−2942, GRS 1741.9−2853) have been removed, thereby producing artificial holes in the maps at their respective locations. Table 5. Expected ratio of the obscured flux to the un- obscured flux for different values of the column density of obscuring material. A thermally emitting gas with tempera- ture of kT = 1 keV (PHABS*APEC model) is assumed in the computations. The predicted observed flux in both the 2–4.5 and 4.5–10 keV bands (F2 − 4.5 and F4.5 − 10) is computed and compared to the respective unabsorbed (F0) flux. NH F2 − 4.5/F0 F4.5 − 10/F0 (1022) 0.01 1 1 1 0.776 0.968 3 0.488 0.912 5 0.322 0.857 7 0.223 0.809 10 0.137 0.737 15 0.0698 0.636 30 0.0156 0.414 50 0.0033 0.244 70 0.0008 0.149 100 1.2 × 10⁻⁴ 0.0754 150 6.2 × 10⁻⁵ 0.0273 7.1 Column density distribution The top panel of Fig. 8 shows the neutral hydrogen column density distribution as derived from dust emission (Molinari et al. 2011).7 The image shows the NH distribution in logarithmic scale in the range NH = 4.5 × 10²² –3.8 × 1025 cm−2 . This total column density estimated from the dust has large uncertainties that can be mainly ascribed to the uncertainty associated with the dust-to-NH ratio. In particular, the column densities shown in this map appear to be sys- 7 We do not show the entire CMZ, because of the limited coverage of the Herschel dust emission map (Molinari et al. 2011). tematically larger than what is measured with other methods. For example, the column density of the G0.11−0.11 massive cloud is estimated to be NH ∼ 5–6 × 1023 cm−2 in this map, while Amo- Baladr´on et al. (2009) measure NH ∼ 2 × 1022 cm−2 , through a de- tailed modelling of the molecular line emission. The core of Sgr B2 is estimated by Molinari et al. (2011) to have NH ∼ 3 × 1025 cm−2 , while modelling of the X-ray emission (Terrier et al. 2010) suggests NH ∼ 7 × 1023 cm−2 , more than an order of magnitude lower. More- over, the average column densities of G0.40−0.02, G0.52−0.046, G0.57−0.018 and a fourth region (the magenta ellipse in Fig. 9) are estimated to be NH ∼ 4 × 10²³ , 4 × 10²³ , 1.2 × 1024 and 1.5 × 1024 cm−2 , respectively, from the dust map, while they are measured to be in the range NH ∼ 7–10 × 1022 cm−2 , from mod- elling of the X-ray emission. Therefore, the total normalization of the NH map built from the dust emission appears to be overesti- mated. However, the method employed to produce it does not suffer from self-absorption, so it is presumably giving unbiased relative NH ratios. 7.2 X-ray emission modulated by absorption The bottom panel of Fig. 8 shows the X-ray map with the column density contours overlaid for comparison. We observe that, as ex- pected, no soft X-ray emission is observed towards the central part of the most massive molecular cores. In particular, we observe de- pressed X-ray emission from (i) the Sgr B2 nucleus and its envelope (with NH > 7 × 1023 cm−2 ); (ii) the almost perfect coincidence be- tween the hole in soft X-ray emission east of G0.224−0.032 (see Figs 5 and 9) and the shape of the so-called Brick molecular cloud, M0.25+0.01 (see Fig. 5; Clark et al. 2013); (iii) the core of the Sgr C complex;8 (iv) the regions around DB-58 and at Galactic position 8 At this location a sharp transition in the soft X-ray emission, with an arc- like shape, is observed. This is spatially coincident to the edge of a very MNRAS 453, 172–213 (2015) byguestonAugust24,2015http://mnras.oxfordjournals.org/Downloadedfrom
- 23. 194 G. Ponti et al. Table 6. Fluxes (F) and surface brightnesses (f) of the continuum and the line intensities (line plus continuum) integrated over the small and big boxes described in Section 8.1. The fluxes are given in units of 10−12 erg cm−2 s−1, while the surface brightnesses are given in 10−15 erg cm−2 s−1 arcmin−2. Big box Small box Flux Surf. bright. Flux Surf. bright. F1 − 2 keV = 19.0 f1 − 2 keV = 6.2 F1 − 2 keV = 12.9 f1 − 2 keV = 6.9 F2 − 4.5 keV = 155.0 f2 − 4.5 keV = 50.7 F2 − 4.5 keV = 119.3 f2 − 4.5 keV = 64.3 F4.5 − 12 keV = 290.7 f4.5 − 12 keV = 95.1 F4.5 − 12 keV = 219.0 f4.5 − 12 keV = 118.0 FSi XIII = 4.4 fSi XIII = 1.5 FSi XIII = 3.4 fSi XIII = 1.8 FS XV = 15.1 fS XV = 4.9 FS XV = 12.0 fS XV = 6.4 FAr XVII = 15.1 fAr XVII = 4.9 FAr XVII = 11.9 fAr XVII = 6.4 FCa XIX = 18.4 fCa XIX = 9.9 FCa XIX = 14.3 fCa XIX = 7.7 l ∼ 0.◦ 2, b ∼ −0.◦ 48 also appear to have darker colours and, once again, it is possible to find molecular complexes (M0.018+0.126 and M0.20−0.48) covering roughly the same region (see Figs 5 and 8). All these clouds are characterized by very high column den- sities NH 3–7 × 1023 cm−2 and they most probably lie in front of Sgr A and of most of the GC (e.g. according to the twisted ring model of Molinari et al. 2011). Therefore, they are absorbing the GC’s extended, soft X-ray emission. All this evidence suggests that at least the most massive clouds located in front of the GC do actually modulate (obscure) the soft X- ray emission. However, fluctuations in column densities cannot be the only cause for the observed distribution of soft X-ray emission for two reasons. First, we do observe only weak soft X-ray emission along some lines of sight having a low column density of molecular material (such as around the Sgr C and Sgr D complexes and south of the Sgr B1 region). Secondly, we do detect intense (among the brightest) soft X-ray emission from several regions such as the Sgr A complex and the cores of the Sgr C and Sgr D complexes, where some of the highest column density clouds are found. In particular, in Sgr A very intense soft X-ray emission is observed along the line of sight towards the 50 km s−1 , the Bridge (Ponti et al. 2010) and the G0.11−0.11 clouds, some of the highest column density clouds in the CMZ. Although this might be explained by placing these clouds on the far side of the CMZ, it appears that these regions are characterized by truly enhanced soft X-ray emission (see e.g. Sections 8.4, 8.5 and 8.6). We defer the detailed disentangling of these effects to an elaborate spectral study of these regions. 8 DISCUSSION In the process of systematically analysing all XMM–Newton ob- servations of the central degrees of the Galaxy, we have discovered several new extended features and have produced an atlas of known, extended soft X-ray features. Here we discuss their general proper- ties and investigate the origin/existence of several specific features. 8.1 General properties To compute the total observed (absorbed) flux from the CMZ we first mask out the emission from the brightest binaries, by excluding a circle with a radius of 1 arcmin around SAX J1747.7−2853; 1.5 arcmin for AX J1745.6-2901 and GRS1741.9-2853; 2 arcmin dense core of dust, suggesting that the modulation in the soft X-ray emission is induced by obscuration by the molecular cloud. for XMMU J174445.5−295044; 2.5 arcmin for 1E 1743.1−2843; 3.5 arcmin for IGR J17497−2821 and 1E 1740.7−2942 (see the white circles in Fig. 5). We then compute the total observed count rate from two boxes, one with a size of 1.◦ 5 × 0.◦ 35 (l × b) and centred on Sgr A and one with a bigger size of 2.◦ 08 × 0.◦ 413 centred on l = 0.◦ 232, b = 0.◦ 080. We then measure the total count rate within these regions and convert it into a flux9 assuming that the soft X-ray diffuse emission is dominated by a thermally emitting plasma with a temperature of kT = 1 keV (Kaneda et al. 1997; Bamba et al. 2002). In particular, we assumed an APEC emission component with temperature kT = 1.08 keV, absorbed by a column density of neutral material of NH = 6 × 1022 cm−2 and with a solar abundance. The fluxes of the integrated continuum and line intensities (line plus continuum) within the big and small boxes are reported in Table 6. This corresponds to an observed 2–12 keV luminosity of L2 − 12 = 3.4 × 1036 erg s−1 and L2 − 12 = 2.6 × 1036 erg s−1 for the big and small boxes, respectively, assuming a distance of 8 kpc to the GC (Reid 1993; Reid et al. 2009). 8.2 A new X-ray filament, XMM J0.173−0.413 We observe a new X-ray filament extending ∼2.2 arcmin perpen- dicular to the Galactic plane and situated at l = 0.◦ 173, b = −0.◦ 413, which is almost directly towards negative longitudes from the GC Radio Arc (see Fig. 17). It coincides with the brightest segment of a much longer radio filament that extends towards the southernmost extensions of the filaments of the Radio Arc (Yusef-Zadeh & Morris 1989, 2004; see figs 7a, 16b,c, and 17a,b,c of the latter reference, where the filament is labelled ‘S5’), but because it is not continuous or exactly parallel with the filaments of the arc, it is not completely evident that it is an extension of the arc in three dimensions. The X-ray filament has a hard X-ray colour and does not appear in the soft line images, indicating a non-thermal emission spectrum. Three other non-thermal radio filaments have been found to have X-ray emission along some portion of their lengths: G359.54+0.18, G359.89−0.08 and G359.90−0.06 (Lu, Wang & Lang 2003; Sakano et al. 2003; Lu et al. 2008; Johnson et al. 2009; Morris, Zhao & Goss 2014; Zhang et al. 2014). XMM 0.173−0.413 is the 9 To perform this task we use WEBPIMMS: https:heasarc.gsfc. nasa.govcgi-binToolsw3pimmsw3pimms.pl. As explained in Section 2.1, the combined count rate is the sum of the EPIC-pn plus the EPIC-MOS count rates after scaling the latter exposure maps by 0.4. We then use the EPIC-pn, medium-filter, rate-to-flux conversion computed with WEBPIMMS. MNRAS 453, 172–213 (2015) byguestonAugust24,2015http://mnras.oxfordjournals.org/Downloadedfrom
- 24. XMM–Newton view of the Milky Way centre 195 Figure 17. XMM–Newton image in the 2–12 keV band showing the new X-ray filament located south of the Radio Arc. The filament is located at l 0.◦173 and b −0.◦413 and appears as a thin (<0.15 arcmin) and long (∼2.7 arcmin) filament running along the north–south direction, as the Radio Arc. The brightest source in the image is SAX J1747.7−2853. only one of the four known cases where the X-ray emission is not at or near a location where the radio filament shows unusually strong curvature. 8.3 SNR excavated bubbles within the CMZ? The top and bottom panels of Fig. 9 show the X-ray (2.5–4.5 keV) and 850 µm (Pierce-Price et al. 2000) maps of the Sgr B1 region. Four enhancements of X-ray emission are clearly present (shown by the green dashed ellipses in Fig. 9). In particular, G0.570−0.001, G0.52−0.046 and G0.40−0.02 correspond to holes in the dust dis- tribution derived from the 850 µm radiation (see the bottom panel of Fig. 9). To reinforce this evidence, we observe that their X-ray edges can be traced in the dust distribution all around the X-ray en- hancements, suggesting a tight connection between the two. Such phenomenology is typical of SNe exploding within or near molecu- lar clouds and interacting with them, creating bubbles in the matter distribution (Ferreira & de Jager 2008; Laki´cevi´c et al. 2015). In- deed, in this case, the SN ejecta might have cleared the entire region that is not filled with hot, X-ray-emitting plasma, pushing away the ambient molecular material. However, this is not the only possibil- ity. The apparent X-ray enhancements could have resulted instead from a higher obscuration surrounding the sub-mm holes, leading to higher X-ray extinction at the edges. We note that none of these re- gions has a known radio SNR counterpart (see Fig. 9). However, the radio emission might be confused within the very high radio back- ground of diffuse emission created by G0.30+0.04, the several H II regions present in this region (see Fig. 6), and the bright, extended synchrotron background of the GC. Enhanced X-ray emission has already been reported towards G0.40−0.02 (Nobukawa et al. 2008) and close to G0.570−0.001 (see the cyan ellipses in Fig. 9). 8.3.1 Spectral analysis To further investigate the origin of these structures, we extracted a spectrum from each of these features (in either obsid 0694641301 or 0694641201). We fitted each spectrum with a model composed of an SNR emission component (fitted with a PSHOCK model; a constant temperature, plane-parallel plasma shock model, meant to reproduce the X-ray emission from an SNR in the Sedov phase) plus the emission components typical of the GC environment such as a hot thermal plasma (with temperature in the range: kT = 6.5– 10 keV), and an Fe K α emission line, all absorbed by foreground neutral material (PHABS*(PSHOCK+APEC+GAUS) in XSPEC). We assume that all these components have solar abundances. Possible confusion effects produce uncertainties associated with the determination of the correct sizes of these candidate SNRs, so some of the results presented here, such as the dynamical time-scales, could thereby be affected. G0.40−0.02 shows a best-fitting temperature and normaliza- tion of the warm plasma associated with the SNR component of kT = 0.55 ± 0.1 keV and Apsho = 2.4+5 −1 × 10⁻² , while the col- umn density is observed to be NH = 7.7 ± 0.8 × 1022 cm−2 (see also Nobukawa et al. 2008). To test whether the observed X-ray enhancement is due to a real variation of the intensity of the soft X-ray emission or whether it is the product of lower ex- tinction, we also extracted a spectrum from a nearby background Table 7. Best-fitting and derived parameters of the SNR candidates described in Section 8.3. Parameter Unit G0.40−0.02 G0.52−0.046 G0.570−0.001 G0.224−0.032 Back kT keV 0.55 ± 0.1 0.77+0.7 −0.2 0.6a 0.54 ± 0.1 0.55c Apsho 2.4+5 −1 × 10⁻² 5+9 −3 × 10⁻³ 4.3+11 −4 × 10⁻³ 3+6 −2 × 10⁻² <6 × 10⁻³ τb s cm−3 >1.7 × 10¹¹ >7.5 × 10¹⁰ >1.4 × 10¹⁰ >3.5 × 10¹¹ 7.5 × 10¹¹ c Size pc 8.6 × 5.5 5.9 × 2.7 4.2 × 2.1 5.4 × 2.6 8.6 × 5.5 NH 1022 cm−2 7.7 ± 0.8 7.9 ± 1.1 9.5 ± 2 7.4 ± 1 8.8 ± 1 χ2/dof 807/777 342/364 141/134 369/338 834/741 ne cm−3 1.4 1.4 2.1 11 tdy yr 3.7 × 10³ 1.7 × 10³ 1.6 × 10³ 1.8 × 10³ Eth erg 1.9 × 1050 5.0 × 1049 2.6 × 1049 2.6 × 1050 aValue weakly constrained by the high column density of neutral material, therefore fixed for the corresponding fit. bIonization time-scale of the shock plasma model. cParameter unconstrained. MNRAS 453, 172–213 (2015) byguestonAugust24,2015http://mnras.oxfordjournals.org/Downloadedfrom
- 25. 196 G. Ponti et al. comparison region (magenta in Fig. 9 and ‘Back’ in Table 7). This second region has the same size as G0.40−0.02 and it is located in a fainter region in X-rays, characterized by higher NH, as suggested by the 850 µm map (see the bottom panel of Fig. 9). This back- ground region shows a slightly higher absorption column density, NH ∼ 8.8 ± 1 × 1022 cm−2 , and no significant warm plasma com- ponent. If we impose the presence of a warm plasma component having the same temperature and τ (the ionization time-scale of the shock plasma model) as observed in G0.40−0.02 we obtain an upper limit to its normalization of Apsho < 6 × 10⁻³ . This suggests that the enhanced X-ray emission towards G0.40−0.02 is due to a real excess of X-ray emission and is not a simple byproduct of lower extinction. The thermal energy, the dynamical time-scale and the size of G0.40−0.02 are Eth ∼ 1.9 × 1050 erg, tdy ∼ 3700 yr and 8.6 × 5.5 pc2 , respectively, as expected for a young SNR in the Sedov–Taylor phase (derived from the equations shown in Maggi et al. 2012). Similar parameters characterize G0.52−0.046 (kT = 0.77 ± 0.3 keV, Apsho = 5+7 −3 × 10⁻³ , NH = 7.9 ± 1.1 × 1022 cm−2 ). There- fore, this feature also appears to be consistent with an SNR origin. However, although we derive a dynamical age of the same order (tdy ∼ 1700 yr), the energy inferred for the SN explosion is substan- tially lower, Eth ∼ 5 × 1049 erg. The spectrum of G0.57−0.001 is characterized by significantly lower statistics and a higher column density of absorbing material. The best fit prefers a low temperature plasma, at the limit of detec- tion. We fix its temperature to a relatively low value of kT = 0.6 keV and find Apsho = 4.3+11 −4 × 10⁻³ and NH = 9.5 ± 2 × 1022 cm−2 . The derived thermal energy and dynamical times are Eth ∼ 2.6 × 1049 erg and tdy ∼ 1600 yr, respectively. The soft X-ray excess of this fea- ture lies spatially very close to a region of X-ray excess that has been traced by Fe XXV line emission (Nobukawa et al. 2008). We also note that the region defining G0.57−0.001 almost completely contains a diffuse X-ray source detected both by the Chandra and ASCA satellites (Senda et al. 2002). The Chandra image shows a very compact (∼10 arcsec radius) and hot shell, G0.57−0.018, pos- sibly the youngest SNR in the Galaxy, less than about 100 yr old. However, Renaud et al. (2006), because they found neither radio nor nucleosynthetic decay products (such as 44 Ti), questioned such an interpretation. Further investigations are required to understand the link, if any, between these features. The morphology of G0.224−0.032 appears more complex, com- pared to the other SNR candidates. The edge of the X-ray emission is well defined only towards the Brick molecular cloud (designated M0.25+0.01 in Fig. 5) that, with its very high column density, can obscure the soft X-ray emission there. In any case, the fit of its X-ray spectrum shows parameters typical of an SNR. In particular, we de- rive a thermal energy and a dynamical time of Eth ∼ 2.6 × 1050 erg and tdy ∼ 1800 yr, respectively. Therefore, G0.224−0.032 might be a new SNR partly obscured by the brick molecular cloud. In such a case, the true size and the energy estimate are likely larger. Overall, we remark that, if these SNR candidates are real, their dynamical time-scales are extremely short, which would imply an extremely high SN rate. The SN rate in the CMZ has been estimated to be as high as 0.4 SN per millennium (Crocker & Aharonian 2011). However, we caution that our dynamical time- scales could be off either because of a higher ambient density than we have assumed, or because absorption or confusion effects do not allow us to distinguish the proper border of the SNRs, or to detect any colder and more extended portions that might be present. 8.3.2 Expanding molecular shells The observed temperatures, ages and sizes of these SNR candidates are consistent with a Sedov–Taylor framework expanding into an average ambient density between 1 and 10 cm−3 (higher density environments would result in older and cooler SNRs; Ostriker & McKee 1988). If the X-ray enhancements described above truly arise from SNRs interacting with and carving bubbles inside or near the surfaces of molecular clouds (preceded, perhaps, by the wind of the massive progenitor), we should observe clear traces of such events also in the kinematics of the surrounding molecular matter. Such a complex and delicate investigation is beyond the scope of the present paper. Nevertheless, we note that Tanaka et al. (2009) discovered an ex- panding SiO shell (SiO0.56−0.01) centred at l ∼ 0.◦ 56, b ∼ −0.◦ 01 and having a size of ∼3.0 × 3.4 pc2 . The centre and size of the expanding SiO shell closely match the peak and size of the X-ray emission of G0.57−0.001 and suggest an association between the two. In particular, high-velocity clumps have been found consis- tent with the idea that the SiO shell consists of swept-up material. Tanaka et al. (2009) calculated a kinetic energy of Ekin ∼ 1050.4 erg for SiO0.56−0.01. This strongly suggests that G0.57−0.001 is in- deed an SNR caught in the process of carving its bubble. Further studies of the gas kinematics around the other X-ray enhancements are required to establish their real nature. We note that the thermal energy estimated for these SNRs is observed to be systematically lower than the theoretical value for the remnant of a standard Type II SN expanding into the interstellar medium. This might result from a relatively higher ambient density in the GC, leading to greater energy dissipation, or from a significant fraction of the energy budget going into the inflation of the bubbles and the production of cosmic rays. We also note that G0.570−0.001, G0.52−0.046 and G0.40−0.02 are located within the trail of massive stars that have been hypothe- sized to have tidally escaped from the Quintuplet cluster (see Fig. 9 and Habibi et al. 2013, 2014). This raises the possibility that some of these SNRs might be associated with SN explosions from stars originating in this massive, young stellar cluster. 8.4 Origin of the Sgr A X-ray lobes All the soft X-ray maps (see Figs 3, 7, 10, 11, 14 and 16) show the presence of two extended features, with a size of roughly 5–10 pc, located to the Galactic north and south of Sgr A , the so-called bipolar Sgr A lobes (Morris et al. 2003, 2004b; Markoff et al. 2010; Heard & Warwick 2013a,b). 8.4.1 Lobe morphology The lobes appear to have roughly oval shapes with co-aligned ma- jor axes oriented perpendicular to the Galactic plane. They ap- pear joined at the position of Sgr A suggesting the latter is their point of origin (see Fig. 18). The top panel of Fig. 11 and Fig. 7 show that the lobes’ emission is characterized by a smaller ra- tio of soft X-ray lines to continuum (therefore characterized by a greener colour) compared to the surrounding regions (appearing with a redder colour) such as the superbubble, G0.1−0.1 and the Radio Arc (Figs 7, 11 and 18). This suggests that the lobes, al- though they show thermal emission lines (see Section 4.2), have either a stronger non-thermal component or significantly hotter MNRAS 453, 172–213 (2015) byguestonAugust24,2015http://mnras.oxfordjournals.org/Downloadedfrom
- 26. XMM–Newton view of the Milky Way centre 197 Figure 18. Finding chart. Chandra RGB image of all the ACIS-I observations pointed at Sgr A (see Clavel et al. 2013 for data reduction and details on the image production). The red, green and blue images show the GC soft (1.5–2.6 keV), GC medium (2.6–4.5 keV) and GC hard (4.5–8 keV) energy bands, respectively. The same regions displayed in Fig. 7 are evidenced here. thermal emission than the surrounding regions.10 We also note that the eastern portion of what appears to be part of the southern lobe has a colour as red as G0.1−0.1 and the superbubble regions (see Fig. 10). Therefore, this emission might not be associated with 10 A hot plasma, with temperatures of ∼2–4 keV, produces intense X-ray emission but weaker soft X-ray lines, compared to a plasma having a tem- perature around 1 keV. the lobes, but rather with G0.1−0.1 or the edge of the superbub- ble (however, a gap such as might be produced by a foreground dust lane, appears to separate the lobes’ emission from G0.1−0.1). Figs 7 and 18 also show that the surface brightness of the north- ern lobe decreases with distance from Sgr A (Heard & Warwick 2013). The bottom panel of Fig. 11 shows that the lobes have an or- ange colour, indicating harder soft X-ray emission compared to the MNRAS 453, 172–213 (2015) byguestonAugust24,2015http://mnras.oxfordjournals.org/Downloadedfrom