

Recomendados
Recomendados
Mais conteúdo relacionado
Mais procurados
Mais procurados (20)
Destaque
Semelhante a Eso1147a
Semelhante a Eso1147a (20)
Mais de Sérgio Sacani
Mais de Sérgio Sacani (20)
Último
Último (20)
Eso1147a
- 1. A&A 530, A108 (2011) Astronomy DOI: 10.1051/0004-6361/201116782 & c ESO 2011 Astrophysics The VLT-FLAMES Tarantula Survey I. Introduction and observational overview C. J. Evans1 , W. D. Taylor2 , V. Hénault-Brunet2 , H. Sana3 , A. de Koter3,4 , S. Simón-Díaz5,6 , G. Carraro7 , T. Bagnoli3 , N. Bastian8,9 , J. M. Bestenlehner10 , A. Z. Bonanos11 , E. Bressert9,12,13 , I. Brott4,14 , M. A. Campbell2 , M. Cantiello15 , J. S. Clark16 , E. Costa17 , P. A. Crowther18 , S. E. de Mink19, , E. Doran18 , P. L. Dufton20 , P. R. Dunstall20 , K. Friedrich15 , M. Garcia5,6 , M. Gieles21 , G. Gräfener10 , A. Herrero5,6 , I. D. Howarth22 , R. G. Izzard15 , N. Langer15 , D. J. Lennon23 , J. Maíz Apellániz24 , , N. Markova25 , F. Najarro26 , J. Puls27 , O. H. Ramirez3 , C. Sabín-Sanjulián5,6 , S. J. Smartt20 , V. E. Stroud16,28 , J. Th. van Loon29 , J. S. Vink10 , and N. R. Walborn19 (Affiliations can be found after the references) Received 25 February 2011 / Accepted 26 March 2011 ABSTRACT The VLT-FLAMES Tarantula Survey (VFTS) is an ESO Large Programme that has obtained multi-epoch optical spectroscopy of over 800 massive stars in the 30 Doradus region of the Large Magellanic Cloud (LMC). Here we introduce our scientific motivations and give an overview of the survey targets, including optical and near-infrared photometry and comprehensive details of the data reduction. One of the principal objectives was to detect massive binary systems via variations in their radial velocities, thus shaping the multi-epoch observing strategy. Spectral classifications are given for the massive emission-line stars observed by the survey, including the discovery of a new Wolf-Rayet star (VFTS 682, classified as WN5h), 2 to the northeast of R136. To illustrate the diversity of objects encompassed by the survey, we investigate the spectral properties of sixteen targets identified by Gruendl & Chu from Spitzer photometry as candidate young stellar objects or stars with notable mid-infrared excesses. Detailed spectral classification and quantitative analysis of the O- and B-type stars in the VFTS sample, paying particular attention to the effects of rotational mixing and binarity, will be presented in a series of future articles to address fundamental questions in both stellar and cluster evolution. Key words. open clusters and associations: individual: 30 Doradus – stars: early-type – stars: fundamental parameters – binaries: spectroscopic – stars: Wolf-Rayet 1. Introduction local conditions are close to those found in the early universe (e.g., Bresolin et al. 2006, 2007; Evans et al. 2007). Massive stars have played an important role in galaxy evolution Unfortunately, we are currently limited to observations of throughout cosmological time via their intense winds, ultravi- the brightest stars in such galaxies. Only in the Galaxy and olet radiation fields, chemical processing, and explosions. For Magellanic Clouds can we potentially assemble large obser- instance, they dominate the rest-frame ultraviolet spectra of star- vational samples of massive stars that span a wide range of forming, Lyman-break galaxies, in which multiple “starburst” metallicity and intrinsic luminosities. Ultraviolet satellites have components (or mergers) are seen out to redshifts of at least z ∼ 5 enabled substantial surveys of terminal wind velocities (e.g., (Douglas et al. 2010). Indeed, they are thought to have been a Howarth & Prinja 1989; Prinja et al. 1990) and rotational ve- major factor in the reionization of the early universe (Haiman & locities (Penny 1996; Howarth et al. 1997; Penny & Gies 2009). Loeb 1997), comprising the dominant component in the earli- However, both observational and computational challenges have est galaxies, in which the star-formation rate appears to increase precluded the atmospheric analysis of a large, coherent sample by a factor of ten over a period of just 200 Myr (Bouwens et al. of O-type stars from optical spectroscopy, with studies limited 2011). to several tens of objects at most (e.g. Herrero et al. 2000, 2002; Population synthesis codes such as Starburst99 (Leitherer Repolust et al. 2004; Mokiem et al. 2005, 2006, 2007; Massey et al. 1999, 2010) form the bridge between our understanding of et al. 2009). At lower masses, while large observational sam- the physics and evolution of individual stars, and efforts to anal- ples of early B-type stars are available, recent results have high- yse entire populations on galaxy scales via interpretation of their lighted some serious problems regarding our understanding of integrated light. The sensitivity of the 8–10 m class telescopes massive-star evolution (Hunter et al. 2008, 2009; Brott et al. has enabled spectroscopy of individual massive stars in galaxies 2011). This leaves us in a situation where fundamental ques- at Mpc distances (e.g., Gieren et al. 2005; Kudritzki et al. 2008), tions concerning the formation, evolution, and eventual fate of including some in low-metallicity dwarf galaxies, in which the massive stars remain unanswered, particularly in the context of results that point to the majority of high-mass stars being in bi- Figures 10–12, Tables 5 and 6, and Appendix A are available in nary/multiple systems (e.g. Sana & Evans 2011). electronic form at http://www.aanda.org The Tarantula Nebula (NGC 2070, 30 Doradus – hereafter Hubble Fellow. “30 Dor”) in the Large Magellanic Cloud (LMC) is the bright- Ramón y Cajal Fellow. est H ii region in the Local Group. It is comprised of multiple Article published by EDP Sciences A108, page 1 of 53
- 2. A&A 530, A108 (2011) generations of star formation, with at least five distinct popu- obtain an improved estimate of the velocity dispersion of single lations (Walborn & Blades 1997), similar to cluster complexes stars in R136, which will be used to determine the dynamical seen well beyond the Local Group (e.g., Bastian et al. 2006). At mass of the cluster. the heart of 30 Dor is Radcliffe 136 (R136, Feast et al. 1960), This introductory article presents the significant observa- a massive, young stellar cluster (1–2 Myr; e.g., de Koter et al. tional material in one resource, comprising details of target se- 1998; Massey & Hunter 1998) dominated by early O-type and lection, observational strategy and data reduction (Sect. 2), opti- hydrogen-rich WN-type stars, some of which are thought to have cal and infrared photometry of the targets (Sect. 3), spectral clas- current masses in excess of 150 M (Crowther et al. 2010). To sifications for the observed massive emission-line and cooler- the north and west of R136 there is significant molecular gas type stars (Sect. 4), and a discussion of the spectral properties of (Werner et al. 1978; Johansson et al. 1998) with embedded mas- stars with published mid-infrared excesses (Sect. 5); concluding sive stars, which has been suggested as a second generation remarks are given in Sect. 6. of (perhaps triggered) star formation around R136 (Walborn & Blades 1997; Walborn et al. 1999a, 2002). By virtue of its location in the LMC, the distance to 30 Dor 2. Spectroscopy is well constrained (we adopt a distance modulus to the LMC of The Tarantula Survey employs three modes of the Fibre Large 18.5, e.g., Gibson 2000) and the foreground extinction is rela- Array Multi-Element Spectrograph (FLAMES; Pasquini et al. tively low compared to some of the most massive Galactic clus- 2002) instrument on the VLT: ters. Moreover, the metallicity of the LMC (∼50% solar) is well matched to typical results for high-redshift galaxies (e.g. Erb – Medusa-Giraffe: The majority of the spectra were obtained et al. 2006; Nesvadba et al. 2008). using the Medusa fibre-feed to the Giraffe spectrograph. Thus, 30 Dor provides an excellent opportunity to study a There are a total of 132 Medusa fibres available for science broad age range of massive stars within a single complex of (or sky) observations, deployable within a 25 diameter field- star formation. In addition to the rich populations of O- and of-view and with a diameter of 1. 2 on the sky. early B-type stars, there are over twenty Wolf-Rayet (W-R) – ARGUS-Giraffe: The ARGUS IFU was used to observe five stars, (including examples of both WN and WC subclasses, pointings of R136 and its environs in the central part of e.g., Breysacher et al. 1999), several transition Of/WN stars 30 Dor. The IFU was used in the 0. 52 per spatial pixel (Crowther & Walborn, in prep.), and candidates for high-mass (spaxel) mode, such that its 22 × 14 microlenses provide a young stellar objects (YSOs) identified from mid-infrared obser- total field-of-view for a single pointing of 12 × 7 on the vations with the Spitzer Space Telescope (see Sect. 5). With its sky. rich stellar populations, 30 Dor is the ideal laboratory in which to – UVES: In parallel to the ARGUS observations, the fibre investigate important outstanding questions regarding the phys- feed to the red arm of the Ultraviolet and Visual Echelle ical properties, binary fraction, chemical enrichment, and evo- Spectrograph (UVES) was used to observe a small sample lution of the most massive stars, as well as the relation of mas- of stars in the inner part of 30 Dor at greater spectral resolv- sive stars to the formation and evolution of stellar clusters (e.g., ing power than that delivered by Giraffe. de Koter et al. 2008; Portegies Zwart et al. 2010). Building on experience from the VLT-FLAMES Survey of The target selection is discussed in Sect. 2.1, followed by a de- Massive Stars (Evans et al. 2005, 2006), we introduce the VLT- scription of the reductions of the three spectroscopic components FLAMES Tarantula Survey (VFTS), a multi-epoch spectral sur- of the survey (Sects. 2.2–2.4). vey of over 800 massive stars in the 30 Dor region, including ∼300 O-type stars. In a series of articles, the VFTS data will be 2.1. Target selection used to investigate the properties of stellar winds and rotational mixing in O-type stars, and to extend studies of rotational mixing The Medusa fibre configurations were prepared using two in B-type stars. In particular, the surface abundances of O-type sources. Within a radius of ∼60 of the core, targets were stars are expected to be modified via the effects of rotational mix- (with a couple of exceptions) taken from Brian Skiff’s rework- ing but, to date, nitrogen abundances have not been determined ing of the astrometry from the U BV catalogue of Selman et al. for a large observational sample. The inclusion of new models of (1999)2. Targets beyond this region were selected from pre- N III in the fastwind model atmosphere code (Puls et al. 2005, liminary reductions of B- and V-band observations (with the 2011), combined with analytical methods such as those devel- B/123 and V/89 filters, respectively) with the Wide-Field Imager oped by Mokiem et al. (2005) or the use of a large model grid, (WFI) at the 2.2 m Max-Planck-Gesellschaft (MPG)/ESO tele- means that such a critical test of evolutionary prodictions is now scope at La Silla (from observations by J. Alves, B. Vandame feasible. & Y. Beletsky; programme 076.C-0888). Four overlapping WFI 30 Dor is known to have a rich binary population (Bosch fields were observed that cover approximately one square degree et al. 2009) – a key feature of the VFTS is a multi-epoch ob- – our FLAMES observations primarily include sources from the servational strategy to obtain clear indications of binarity1 in the first (northeast) WFI pointing, supplemented to the west by tar- large majority of the targets. This will add a valuable component gets from the second. The median seeing in the reduced images to quantitative analysis of the spectra and interpretation of the is ∼0. 8, although the conditions were non-photometric and stars results, enabling tests of the predictions of evolutionary models brighter than approximately 14th magnitude were saturated. that include all of the relevant physical processes for both sin- Source detections in the WFI frames were performed us- gle stars and binary systems (e.g. Langer et al. 2008). The sur- ing the daophot package (Stetson 1987) within iraf. The as- vey also includes multi-epoch spectroscopy in the inner part of trometry was calibrated using stars from the UCAC-2 catalogue 30 Dor with the FLAMES-ARGUS integral-field unit (IFU) to (Zacharias et al. 2004), which has an astrometric precision to better than 0. 1 (sufficient for the diameter of the Medusa fibres). 1 Hereafter we use “binary” as shorthand for both true binaries and 2 multiple systems. ftp://cdsarc.u-strasbg.fr/pub/cats/J/A+A/341/98 A108, page 2 of 53
- 3. C. J. Evans et al.: The VLT-FLAMES Tarantula Survey. I. Fig. 1. FLAMES-Medusa targets overlaid on the V-band WFI image. The targets (blue circles) are primarily in the central part of 30 Dor, but also span the broader region including Hodge 301 (∼3 NW of R136), NGC 2060 (∼6. 5 SW), and SL 639 (∼7. 5 SE). To highlight their locations, the emission-line stars discussed in Sect. 4.1 are encircled in green, and the five luminous red supergiants from Sect. 4.3 are encircled in red. In a bid to avoid significant selection biases we did not em- column of Table 5 provides a thorough (but not exhaustive) list ploy any colour cuts on our input target lists. The only constraint of previous aliases/identifications for our targets. imposed was a magnitude cut (before final photometric calibra- FLAMES has a corrected field-of-view of 25 . This means tion) of V ≤ 17 mag, to ensure adequate signal-to-noise (S/N) in that with one central telescope pointing we were able to ob- the resulting spectra. The Fibre Positioner Observation Support serve stars in some of the local environs of 30 Dor as well as Software (FPOSS) was used with our combined “Selman-Skiff” in the main body of the H II region. The distribution of the and WFI catalogue to create nine Medusa configurations, here- Medusa (and UVES) targets is shown in Fig. 1, overlaid on a after referred to as fields “A” through to “I”. Exactly 1000 tar- section of the V-band WFI mosaic. The targets are primarily gets were observed with the Medusa-Giraffe mode in these nine located in the main 30 Dor nebula (NGC 2070), but also in- configurations. The reductions and characteristics of these data clude at least three separate associations: 1) Hodge 301, approx- are discussed below. After rejection of foreground stars (and a imately 3 to the northwest of R136 (Hodge 1988), which is small number of others due to issues relating to data quality, see somewhat older than the rest of 30 Dor (20 to 25 Myr, Grebel Sect. 2.2.4), we have Medusa (or UVES) observations of 893 & Chu 2000); 2) NGC 2060 (aka 30 Dor B and LHA 120- unique targets. N 157B), 6. 5 to the southwest of R136, which is associated A full catalogue of the survey targets is given in Table 5 in with a supernova remnant (e.g. Chu et al. 1992); 3) SL 639 which they are RA-sorted and given a running number, which (Shapley & Lindsay 1963), 7. 5 to the southeast. The sur- hereafter serves as an identifier of the form VFTS ###. Given vey targets span a total diameter just in excess of 20 , with its importance and rich stellar populations, 30 Dor has been the over 500 of them within a 5 (≈75 pc) radius from the cen- subject of numerous studies over the past decades – the final tre of R136. Distances to each target from R136 (specifically, A108, page 3 of 53
- 4. A&A 530, A108 (2011) Table 1. Summary of the wavelength coverage, exposure time per ob- the tracking on the guide star, etc. In cases where full exposures serving block (OB), and measured spectral resolution (Δλ) of the dif- (i.e. 1815 s) were completed, these observations were retained – ferent FLAMES modes and settings used in the survey. even if the S/N is lower than in other frames, there will be use- ful radial velocity information for some targets. This leads to the “extra” frames for Fields A, B, E, and I in Tables A.1 and A.2. Mode Setting Exp. time/OB λ-coverage Δλ R There is also an extra LR03 exposure of Field F (“LR03 01 [c]”), [s] [Å] [Å] included out-of-sequence of its execution. This OB was aborted Medusa LR02 2 × 1815 3960–4564 0.61 7000 Medusa LR03 2 × 1815 4499–5071 0.56 8500 mid-execution because the telescope was being used for interfer- Medusa HR15N 2 × 2265 6442–6817 0.41 16 000 ometric observations – the one completed exposure was retained ARGUS LR02 2 × 1815 3960–4570 0.40 10 500 because it provides additional radial velocity information, for ex- UVES 520 2 × 1815 4175–6200 0.10 53 000 ample, in the case of R139 (Taylor et al. 2011). Notes. The UVES data do not include the 5155 to 5240 Å region be- cause of the gap between the two detectors. 2.2.2. Reductions The ESO Common Pipeline Library (CPL) FLAMES reduction routines (v2.8.7) were used for all of the initial data processing, i.e. bias subtraction, fibre location and (summed) extractions, R136-a1: α = 5h 38m 42. 39, δ = −69◦ 06 02. 91, J2000.0) are s division by a normalised flat-field, and wavelength calibration. given in the fifth and sixth columns of Table 5, in arcmin and The subsequent reduction stages were: pc, respectively. – Heliocentric correction: All spectra were corrected to the heliocentric frame, using the iraf packages rvcorrect and 2.2. VLT Medusa-Giraffe spectroscopy dopcor. – Sky subtraction: Each sky fibre was inspected for signs of 2.2.1. Observational strategy an on-sky source or cross-contamination from bright spec- The nine Medusa fibre configurations (“A”–“I”) were observed tra/emission lines from adjacent fibres on the detector (see using three of the standard Medusa-Giraffe settings (LR02, Sect. 2.2.4). Any contaminated sky fibres were rejected (typ- LR03, and HR15N). These provide intermediate-resolution ically one or two per frame) brefore creating a median sky spectroscopy of the lines commonly used in quantitative anal- spectrum, which was then subtracted from all fibres in that ysis of massive stars in the 3960–5070 Å region, combined with observation. higher-resolution observations of the Hα line to provide a diag- – Error spectrum: An error spectrum was produced by the nostic of the stellar wind intensity. pipeline for each fibre as part of the reduction process. For The wavelength coverage and spectral resolution (Δλ, as de- each wavelength bin it recorded the statistical error arising termined by the mean full-width at half-maximum of arc lines in from the different stages in the reduction, e.g., bias level, de- the wavelength calibration exposures) is summarised in Table 1. tector gain, read-out noise. These data were combined with We also give the effective resolving power, R (i.e., λ/Δλ), for the the errors on the median sky spectrum to obtain an estimate central wavelength of each setting. of the overall error for each spectrum. Most of the Medusa observations were obtained over the pe- – Cosmic-ray rejection: Our Medusa-Giraffe exposures were riod 2008 October to 2009 February, with a seeing constraint taken in consecutive pairs within the OBs. To clean the ex- of ≤1. 2. Pairs of exposures were taken in each observing block tracted spectra of cosmic rays we employed a technique (OB). To obtain sufficient S/N for quantitative analysis of each developed (by I.D.H.) for the 2dF survey of the Small target, three OBs at both the LR02 and LR03 settings were ob- Magellanic Cloud (SMC) by Evans et al. (2004). For each served, and two at HR15N. No explicit time constraints were spectrum, the ratio of the two exposures was calculated. A placed on the execution of these OBs and, in the majority of boxcar 4-sigma clip over 100 wavelength bins was then per- cases, the sequences at a given wavelength setting were ob- formed on this ratio value. Any unexpected and significant served consecutively (but not in all, e.g., the LR03 observations deviations in the ratio are indicative of a feature in only one of Field D). The modified Julian Dates (MJD) for each OB are of the observations. Because the exposures were consecu- given in Tables A.1 and A.2 in the Appendix. tive, it is safe to assume that a transient feature was a cosmic ray. The pixels identified as suspect were rejected, then re- The key observational feature of the survey is three re- placed with the value from the sister exposure, appropriately peat OBs at the LR02 setting to detect radial velocity variables scaled by the ratio of the surrounding region. This approach (epochs 4, 5, and 6 in the Appendix). These were scheduled in results in good removal of cosmics, but is not perfect (which the service queue such that a minimum of 28 days had passed would require inter-comparison between three exposures). between execution of the third and fourth epochs, similarly be- – Rejection of foreground stars: Preliminary inspection of the tween the fourth and fifth. The sixth epoch was obtained in 2009 LR02 data for each target was used to identify foreground October. The inclusion of the extra epoch a year later signifi- cool-type stars to exclude them from our final catalogue (em- cantly helps with the detection of both intermediate- and long- ploying a velocity threshold of vr < 100 km s−1 for rejection). period binaries. An important part of the interpretation of these A total of 102 stars were excluded at this stage, which also multi-epoch spectra will be modelling of the detection sensitivi- included a small number of cool stars with LMC-like radial ties to put firm limits on the observed binary fraction (Sana et al., velocities but with very poor S/N. in prep.). Owing to the nature of service-mode observations, a small As an example of the final S/N of the spectra we consider number of the OBs at the LR02 wavelength setting were re- VFTS 553, one of the faintest Medusa targets (V = 17.0 mag, for peated for operational reasons, e.g., deterioration of the seeing which the data reveals an early B-type spectrum). The mean S/N beyond the required constraints during the exposure, failure of ratio in the individual exposures per resolution element were A108, page 4 of 53
- 5. C. J. Evans et al.: The VLT-FLAMES Tarantula Survey. I. ∼50 for all three wavelength settings (determined using line- adjacent. The fifth pointing was located to the NNE of R136 free regions of the stellar continuum). In contrast, the S/N to target a reasonable number of stars at a slightly larger radius for VFTS 527 (R139, one of the brightest targets) exceeds from the core. 400 per resolution element in the best spectra (Taylor et al. Full spectral coverage for quantitative analysis is best ob- 2011). tained with AO-corrected or HST spectroscopy – our intention here was to probe the dynamics of these inner regions, again 2.2.3. Nebular contamination with follow-up observations to identify binary systems. Thus, only the LR02 Giraffe setting was used. The resulting wave- Related to the sky subtraction, one of the principal limita- length coverage was comparable to that from the Medusa ob- tions of fibre spectroscopy is the subtraction of local nebu- servations, but at greater resolving power because of the smaller lar emission. Indeed, at the distance of the Magellanic Clouds, aperture (see Table 1). even (seeing-limited) long-slit spectroscopy can suffer difficul- Two OBs were observed without time restrictions and, simi- ties from spatially-varying nebular emission (cf. the HST spec- lar to our strategy for the Medusa data, follow-up epochs (third troscopy from, e.g. Walborn et al. 2002). Given the significant and fourth) were observed with a minimum interval of 28 days. nebular emission in 30 Dor, the majority of the Giraffe spectra All these data were obtained over the period 2008 October have some degree of nebular contamination. to 2009 March, with a final (fifth) epoch observed in 2009 The combination of extended nebular emission with the stel- December/2010 January. lar flux from a point-source means that, because the seeing con- As with the Medusa observations, a number of the ARGUS ditions vary for different epochs, the relative intensity of the neb- OBs were re-observed owing to changes in conditions and other ular contamination can vary. Apart from a minority of spectra operational issues. The full list of completed exposures for the with particularly strong emission, this is not a big problem for ARGUS frames is given in Table A.3. These epochs also apply to the hydrogen Balmer lines, where the core nebular profile can the UVES observations (Sect. 2.4), which were taken in parallel (effectively) be ignored in quantitative analysis (e.g. Mokiem to the ARGUS data. et al. 2006). However, care is required when selecting He I lines for analysis (most notably λ4471) because small changes The seeing conditions are more critical to these IFU obser- in the nebulosity could be interpreted as evidence for binarity if vations than for the Medusa frames, so the adopted nomencla- unchecked with other lines. ture is slightly different for repeated OBs. The exposures ob- tained under the best conditions (ascertained from the seeing value recorded in the file headers at the time of observation) are 2.2.4. Cross-contamination of spectra identified as the “a+b” pair, with other exposures following in order of execution (as “c+d” etc.), e.g., epoch four for the fourth To keep the observing as simple and homogeneous as possible, pointing (“A4”). a constant exposure time was used for each fibre configuration. A consequence was that bright stars can cross-contaminate adja- cent spectra of fainter stars on the detector after dispersion. This 2.3.1. Reduction cross-contamination between fibres was generally minimal, but inspection of the reduced spectra revealed a small number of fi- The ARGUS frames were reduced using the same methods as for bres that were contaminated by bright emission lines in W-R or the Medusa data apart from the sky subtraction and the combina- “slash” stars and, in a couple of cases, by luminous supergiants tion of spectra from adjacent spaxels on the sky (individual stars with large continuum fluxes. typically extend over several spaxels). The extracted (cosmic- Thus, for the observation obtained in the best seeing, we in- clipped) spectra were corrected to the heliocentric frame, then spected the spectra adjacent to all “bright” stars (with counts combined as follows. greater than 10 000) for each Medusa field and wavelength set- Sources were selected if they appeared isolated in the re- ting. In some instances the contaminated spectra were sky fi- duced IFU datacube and if they could be matched to a star bres (rejected as described above), but five stellar targets were (or multiple, densely-packed stars) in an archival HST F555W omitted because they were pathologically contaminated by very image (from the early release science observations of 30 Dor strong emission lines. A further 22 stars have some element taken with the Wide-Field Camera Three, WFC3). Less iso- of cross-contamination – typically an artificial broad emission lated sources were also extracted if their spectra could be dis- “bump” at λ4686 from strong He II in emission-line stars in ad- tinguished from those of their surroundings, and if they had a jacent fibres. These are noted in the final column of Table 5 – matching bright source in the WFC3 image. (Some sources are quantitative spectral analysis of these stars may not be possible, obviously multiple in the WFC3 image but their spectra were re- but the radial velocities from other regions/lines will still be use- tained because they might still prove useful in the analysis of the ful to investigate binarity, gas dynamics, etc. velocity dispersion of R136.) The spaxels combined for a given source were selected on the basis that they showed the same spectral features (and relative strengths) as the brighest/central 2.3. VLT ARGUS-Giraffe spectroscopy spaxel of that source. There are small positional shifts of ap- The Medusa data were complemented by five pointings within proximately one spaxel between the different epochs of a given the central arcminute of 30 Dor with the ARGUS IFU, as shown pointing. These shifts were taken into account when defining (for in the main panel of Fig. 2. The coarser ARGUS sampling was each frame) the spaxels that contribute to each source. used (0. 52/microlens, giving a field-of-view of 11. 5×7. 3), with Spectra were extracted for a total of 41 sources from the a seeing constraint of ≤0. 8. ARGUS frames. The 37 unique ARGUS sources are appended These regions are densely populated with stars, particularly to the end of Table 5, with coordinates from centroids of match- in the core of R136. The first IFU pointing (“A1” in the fig- ing sources in the WFC3 image (transformed to the same astro- ure) was located on the core, with three pointings immediately metric system as the Selman–Skiff catalogue for consistency). A108, page 5 of 53
- 6. A&A 530, A108 (2011) A5 A1 A2 A3 A4 Fig. 2. Main image: the five ARGUS pointings overlaid on an F555W HST-WFC3 image. Right-hand panels: identification of individual extracted sources – upper panel: Field “A5”; central panel: Fields “A1” (eastern pointing) and “A2”; lower panel: Fields “A3” (eastern pointing) and “A4”. To distinguish from targets observed with Medusa and/or UVES, 2.4. VLT FLAMES-UVES spectroscopy these sources are given a separate series of RA-sorted identifiers, starting with VFTS 1001. Photometry is available for all but The fibre feed to the red arm of UVES was used to observe 25 three from Selman et al. (1999), as listed in Table 5. Note that stars in parallel to the ARGUS observations. Twenty of these four Medusa/UVES sources were also observed with ARGUS were also observed with Giraffe – our aim was to exploit the (VFTS 542, 545, 570, and 585), as noted in the final column availability of UVES to obtain broader spectral coverage and ad- of Table 5. The five ARGUS pointings and the location of the ditional epochs for radial velocity measurements (at even greater extracted sources are shown in Fig. 2. precision). The UVES targets are indicated by “U” in the second The four or five spaxels with the lowest counts in each point- column of Table 5, and are all from the Selman et al. (1999) ing were used for local sky spectra. Even so, for most sources the catalogue, i.e., in the inner part of 30 Dor near R136. nebular subtraction is still far from perfect given the small-scale variations discussed earlier. Before combining the sky spec- 2.4.1. Reduction tra, a 5σ-clip (compared to the noise of the median spectrum) was employed to remove remaining cosmic rays or artefacts. The two CCDs in the red arm of UVES were processed sep- A weighted-average sky spectrum was created, then subtracted arately. With the λ5200 central wavelength setting, the short- from the spectra from each of the source spaxels. wavelength CCD provided coverage of 4175 to 5155 Å, with Differential atmospheric refraction means that the apparent the long-wavelength CCD spanning 5240 to 6200 Å. The UVES slope of the continuum of a given source varies from spaxel to CPL routines (v4.3.0) from ESO were used for the preliminary spaxel. Thus, each spectrum was normalised individually before reduction stages: bias correction, fibre extraction, wavelength combining the contribution of different spaxels. This normalisa- calibration, and division by a normalised flat-field frame. Our tion was done by a spline-fit across carefully selected continuum own idl routines were then used for merging of the orders and regions, then division of the spectrum by the resulting smooth velocity correction to the heliocentric frame. For these bright curve. This method generally gave an excellent fit to the con- targets and at this resolving power, the sky background was rela- tinuum, but is less certain for spectra with broad emission lines, tively low – given the problems relating to merging of the echelle for which the continuum is hard to define. The final spectrum orders, subtraction of the sky spectra resulted in a poorer final of each source is a weighted average of the normalised spectra data product, so they were not used. From analysis of the re- from the individual spaxels, again employing a 5σ-clip around duced arc calibration frames, the delivered resolving power was the median to remove spurious pixels. R ∼ 53 000. A108, page 6 of 53
- 7. C. J. Evans et al.: The VLT-FLAMES Tarantula Survey. I. 3. Photometry The approximate photometric calibration of the WFI imaging was sufficient for target selection (Sect. 2.1), but quantitative spectroscopic analysis requires precise photometry. Given the complexity of 30 Dor (in terms of source detection in regions of bright nebulosity) and the non-photometric conditions/saturation of bright stars in the WFI observations, we revisited the data with a more refined photometric analysis. From combining the Selman-Skiff catalogue and our analy- sis of the WFI frames we obtained B- and V-band photometry for 717 of the VFTS targets. These were then supplemented by photometry for 68 stars from Parker (1993) and for 91 stars from new imaging at the Cerro Tololo Inter-American Observatory (CTIO), Chile. Each of these photometric sources is discussed briefly below. Moreover, when undertaking quantitative spectral analysis of Fig. 3. FLAMES targets with photometry from Selman et al. (1999) massive stars in regions of variable extinction, near-IR photom- (167 stars, red points) compared to all sources from their catalogue with etry can be a useful input towards the determination of accurate V ≤ 18 (black). stellar luminosities (e.g. Crowther et al. 2010). Cross-matches of the VFTS targets with published near-IR data are discussed in Sects. 3.6 and 3.7. We note that there is a significant amount of imaging of se- lected regions of 30 Dor at better spatial resolution, principally from the HST. Our philosophy here is to compile optical pho- tometry from seeing-limited, ground-based images, which are reasonably matched to the aperture of the Medusa fibres. Thus, even if our “stars” are actually multiple objects, the light re- ceived by the fibre is comparable to that measured from the adopted imaging. 3.1. “Selman” photometry The data used for target selection in the central region were taken from the Selman-Skiff catalogue, which was obtained using the Superb-Seeing Imager (SUSI) on the 3.5 m New Technology Telescope (NTT) at La Silla, Chile. The conditions were pho- Fig. 4. Photometric residuals for the WFI data (where both are WFI − Selman) as a function of (B − V)Selman. tometric with sub-arcsecond seeing, and short exposures (10– 30 s) were used to avoid saturation. The fine pixel scale of SUSI (0. 13/pixel) means that crowding is less problematic than in the resulting residuals for these matched sources are shown in Fig. 4, WFI frames. We therefore adopt the B- and V-band photome- with standard deviations of ≤0.1 mag in both bands. The second try from Selman et al. (1999) for the 167 stars observed from WFI pointing was bootstrapped from the first using the mean their catalogue, listed with the reference “S” in Table 5. To il- differences between overlapping stars. lustrate the selection effects employed on the FLAMES sources Photometry of 550 stars is adopted from analysis of the WFI (i.e. V ≤ 17 mag and no colour constraint), a colour–magnitude images (calibrated using the catalogue from Selman et al. 1999). diagram for the 167 stars with photometry from Selman et al. is These are listed with the reference “W” in Table 5. Their colour– shown in Fig. 3; their other sources (V ≤ 18 mag) are also shown. magnitude diagram is shown in Fig. 5; also shown are the ∼2000 other WFI sources (V ≤ 18 mag) within a radius of 12 from 3.2. WFI photometry R136. There are ten sources with WFI photometry in Table 5 with V ≤ 14.5 mag, each of which agrees with the CTIO pho- Our primary source of photometry is from point-spread func- tometry (Sect. 3.5) to within 0.1 mag, i.e., within the dispersion tion (PSF) fitting of sources in the WFI frames with the stand- of the calibrations in Fig. 4. alone version of daophot. We are mainly interested in the rel- atively bright population so we adopted a detection thresh- old of 20 times the root-mean-square noise of the local back- 3.3. “Parker” photometry ground to avoid spurious detections. We then applied a cut To supplement the WFI and Selman photometry we first turned of 0.2 < sharpness < 1 to further filter those detections for ex- to the catalogue from Parker (1993) in 30 Dor, using the re- tended objects, etc. The resulting B- and V-band catalogues worked astrometry from Brian Skiff3 . A comparison between were merged together using the daomatch and daomaster rou- the Parker results and the calibrated WFI photometry for 219 tines (Stetson 1994), i.e. the final catalogue includes only those matched stars (within a radius of 0. 5) yielded only small resid- sources detected in both bands. uals of ΔV = 0.01 (σ = 0.2) and ΔB = −0.03 (σ = 0.2) mag, as Zero-points for the WFI photometry were determined with shown in Fig. 6. reference to 67 stars (within a search radius of less than 0. 4 and V ≤ 18.0 mag) that overlap with the Selman–Skiff catalogue. The 3 ftp://cdsarc.u-strasbg.fr/pub/cats/II/187A A108, page 7 of 53
- 8. A&A 530, A108 (2011) Fig. 5. FLAMES targets with WFI photometry (550 stars, red points) Fig. 7. Photometric residuals for the WFI data (where both are compared to all WFI sources with V ≤ 18 within a 12 radius of the field WFI − MCPS) as a function of (B − V)MCPS . centre (black). while the photometry from Massey (2002) used an aperture of 16. 2. Although there is reasonable agreement in the zero-point calibrations between the WFI and MCPS data, the “plume” to brighter MCPS magnitudes is particularly notable in Fig. 7. Concerned by the potential of inter-CCD calibration prob- lems in the WFI data, we investigated the distribution of the residuals as a function of both declination and right ascension, as shown in Figs. 8 and 9, respectively. The residuals between the WFI and MCPS photometry are noticeably larger over the main body of 30 Dor (centred at α = 5. 645, δ = −69 ◦ 101, and with h . the densest nebulosity having a diameter of ∼6 ). Larger residu- als can also be seen in the region of α = 5. 702, the centre of the h dense cluster NGC 2100. The residuals are predominantly in the sense of brighter magnitudes from MCPS compared to the WFI frames, which suggests that they primarily arise from unresolved Fig. 6. Photometric residuals for the calibrated WFI data compared to blends or nebular contamination. those from Parker (1993) as a function of (B − V)Parker . 3.5. CTIO photometry A radial search (of 0. 5) and then visual matching of the Thus, to obtain optical photometry for the majority of the VFTS targets without WFI or Selman photometry yielded 68 remaining FLAMES targets, we observed 30 Dor on 2010 matches in the Parker catalogue (with a median radial offset of December 27 with the Y4KCAM camera on the CTIO 1 m 0. 11). For our current purposes, we adopt his photometry for telescope, operated by the SMARTS consortium4. The camera these 68 stars, listed with the reference “P” in Table 5. is equipped with an STA 4064 × 4064 CCD with 15 μm pix- els, yielding a scale of 0. 29 pixel−1 and total field-of-view of 20 × 20 at the Cassegrain focus. 3.4. MCPS photometry Observations were obtained in photometric conditions with good seeing (less than 1. 3), using B- and V-band filters in the As a potential source of photometric information for the re- Kitt Peak system5 . A range of exposure times in each band were maining 108 stars we turned to the LMC catalogue from the used to avoid saturating bright stars (from 10 s up to a maxi- Magellanic Clouds Photometric Survey (MCPS; Zaritsky et al. mum of 400 and 300 s in the B- and V-bands, respectively). 2004), which includes photometry of some of the bright sources Instrumental magnitudes were obtained using PSF-fitting rou- from Massey (2002). However, we found large uncertainties on tines in daophot, then observations of standard stars taken on the MCPS photometry in the 30 Dor region. the same night in Selected Area 98 (Landolt 1992) were used We first considered cross-matched sources from the MCPS to transform the photometry to the Johnson-Kron-Cousins sys- catalogue as an external check on the photometric calibration tem and to correct for atmospheric extinction. The standard of the WFI frames. Adopting a search radius of less than 1. 0, observations spanned a range of airmass (from 1.05 to 2.60) a total of 5726 “matches” were found between the northeast- and included stars over a broad range of colours (−0.3 ≤ (B − ern WFI frame and the MCPS. The residuals for B and V (in V) ≤ 1.7 mag). the sense of WFI − MCPS) are shown in Fig. 7 as a function of Robust matches were found for 91 of the remaining MCPS colour. The standard deviation of the residuals in both FLAMES targets, with photometry from the CTIO imaging bands is ∼0.25 mag, not unreasonable considering the potential for specious matches and complications relating to blending and 4 http://http://www.astro.yale.edu/smarts nebulosity in this field – the typical seeing from the MCPS is 1. 5 5 http://www.astronomy.ohio-state.edu/Y4KCam/filters. (with 0. 7 pixels), but extended up to 2. 5 (Zaritsky et al. 2004), html A108, page 8 of 53
- 9. C. J. Evans et al.: The VLT-FLAMES Tarantula Survey. I. 3.6. Near-IR photometry The extensive near-IR imaging survey of the Magellanic Clouds from Kato et al. (2007)6 provides JHKs photometry for nearly all of our FLAMES targets. The mean seeing at J, H, and Ks was 1. 3, 1. 2, and 1. 1, respectively, i.e., well-matched to the on-sky Medusa fibre aperture. To identify IRSF counterparts to the FLAMES targets we employed an astrometric search radius of 0. 5, then overlaid the resulting list on the WFI V-band images to reject specious matches. The IRSF magnitudes (JHKs , and their associated pho- tometric errors) are given for the FLAMES targets in Table 6. The IRSF “quality” flag in the final column indicates the source detection in each of the three bands as follows (for futher details see Kato et al. 2007): “1”, point-like; “2”, extended source; “3”, saturated; “4”, faint; “5”, odd shaped (e.g. double sources); “0”, Fig. 8. Photometric residuals for the WFI data (where both are no detection. WFI − MCPS) as a function of declination. The Two Micron All Sky Survey (2MASS, Skrutskie et al. 2006) catalogue was used to calibrate the IRSF astrometry and to provide checks on the photometry (see Kato et al. 2007). However, we note that the IRSF-SIRIUS filter-set was designed to match that of the Mauna Kea Observatories near-IR filters (Tokunaga et al. 2002), and is therefore slightly different to that used by 2MASS. Transformation equations between the IRSF- SIRIUS and 2MASS systems are given by Kato et al. (2007) and Kucinskas et al. (2008); in practise, the corrections between the two are relatively small, with typical differences of less than 0.05 mag for (J − Ks )IRSF < 1.7 mag (Kucinskas et al. 2008). There are five FLAMES targets without good IRSF matches within 0. 5: VFTS 275, 503, 620, 823, and 828. Additionally, VFTS 151 has two potential matches, but is excluded follow- ing the discussion of multiplicity in Sect. 3.5. In some instances there were two potential matches both within a radius of less than 0. 3. In approximately half of these one set of the IRSF measurements was obtained in the “periphery” of the dither Fig. 9. Photometric residuals for the WFI data (where both are WFI − MCPS) as a function of right ascension. patterns (so the S /N is lower) and these values were omitted. However, for seven targets (VFTS 125, 330, 368, 374, 377, 383, 384) both IRSF detections are good spatial matches and not sat- urated. For these sources we compared the observational con- listed in Table 5 with the reference “C”. Given the independent ditions of the relevant exposures (Table 2, Kato et al. 2007) calibration using published standards, we do not attempt to trans- and adopted the values obtained in the best seeing. As noted in form the photometry of these stars onto the same exact system Table 5, VFTS 240 appears slightly extended (or as a blended as the WFI photometry. However, they agree reasonably well – source) in the optical WFI image; the IRSF catalogue has a a comparison of nearly 800 matched stars yields mean residuals counterpart approximately 0. 5 from the FLAMES position, with of ΔV and ΔB ≤ 0.05 mag (with σ ∼ 0.2 mag in both bands). J = 16.31 ± 0.06 mag, but it was not detected in the other two Seven of the remaining targets were beyond the western and near-IR bands. southern extent of the CTIO images (VFTS 002, 003, 014, 016, Similar comparisons were undertaken between the IRSF cat- 017, 739, and 764) and five did not have counterparts in the alogue and the unique ARGUS targets (i.e. those numbered from CTIO catalogue owing to nearby blends or the PSF-fitting cri- 1001 to 1037, see Sect. 2.3). Good matches (all within 0. 3) were teria (VFTS 092, 172, 301, 776, and 835). Photometry is avail- found for 31 sources, as summarised in Table 6. Six ARGUS able from the MCPS catalogue for four of these (VFTS 016, 092, sources are without IRSF photometry: VFTS 1012, 1014, 1015, 739, 764), each of which is over 8 from the core of 30 Dor, so 1019, 1024, and 1025. the problems discussed in Sect. 3.4 should be minimised. The last five targets without optical photometry (VFTS 145, 3.7. Cross-references with 2MASS 147, 150, 151, & 153) are in the dense “Brey 73 complex”, which was first resolved by Testor et al. (1988) and later ob- Near-IR photometry for some of our targets is also available served with the HST by Walborn et al. (1995, 1999b). The HST from the 2MASS catalogue. However, with a pixel size of 2. 0, photometry from Walborn et al. (1999b) is adopted in Table 5 for its spatial resolution is inferior to the IRSF data. Nonetheless, we the three (visually) single stars: VFTS 145, 150, & 153. The two include cross-identifications to 2MASS for the VFTS targets in brightest members (#1 and #2 from Testor et al., VFTS 147 and the final column of Table 5 for completeness. Our approach was 151) were resolved into separate bright components by the HST imaging, i.e. the Medusa fibres will contain contributions from 6 Obtained using the Simultaneous three-colour InfraRed Imager for these, and any future analysis will have to consider their relative Unbiased Survey (SIRIUS) camera (0. 45 pixel−1 ) on the InfraRed fluxes (and colours). Survey Facility (IRSF) 1.4 m telescope at Sutherland, South Africa. A108, page 9 of 53
- 10. A&A 530, A108 (2011) Table 2. Summary of published and, where relevant, new spectral classifications for massive emission-line stars in the VLT-FLAMES Tarantula Survey (VFTS) observations. Identification VFTS BAT99 Brey Published spectral types VFTS spectral types 002 85 67 WC4+OB [SSM90] WC4+O6-6.5 III 019 86 69 WN4 [Brey]; WN3o+O9: [FMG03] WN3o 079 88 70a WN3-4 [MG87]; WN4b/WCE [FMG03] − 108 89 71 WN7 [Brey]; WN7h [CS97] − 136 90 74 WC5 [Brey]; WC4 [SSM90] − 147 91 73 WN6.5h and O7 V [W99]; WN6h:a [S08] WN6(h) 180 93 74a O3 If∗ /WN6 [TS90] O3 If∗ 402 95 80 WN7 [F60]; WN7 [Brey]; WN6 [Mk]; WN7h [CS97] WN7h+OB 427 96 81 WN8 [Brey]; WN8 [Mk]; WN8(h) [CS97] − 457 97 − O4 If [Mk]; O3 If∗ /WN7-A [WB97] O3.5 If∗ /WN7 482 99 78 O4 If [Mk]; O3 If∗ /WN6-A [WB97] O2.5 If∗ /WN6 507 101/102 87 WC5+WN4 [Mk]; WC4+WN6 [M87]; − 509 103 87 WN4.5 [Mk]; WN6 [M87]; WN5.5 [B99] WN5(h)+O 542 113 − O3 If [Mk]; O3 If∗ /WN6-A [WB97] O2 If∗ /WN5 545 114 − O3 If [Mk]; O3 If∗ /WN6-A [WB97] O2 If∗ /WN5 617 117 88 WN5ha [FMG03] − 682 − − − WN5h 695 119 90 WN6-7 [F60]; WN7 [Brey]; WN6 [Mk]; WN6 [B99]; WN6(h) [CS97] WN6h+? 731 121 90a WC4 [MG87]; WC4 [SSM90]; WC7-9 [B99] − 758 122 92 WN5+ [F60]; WN6 [Brey]; WN5(h) [FMG03] WN5h Notes. The spectral types adopted for the survey are given in bold font. Aliases to the Breysacher et al. (BAT99, 1999) and Breysacher (1981) catalogues are provided (other aliases are included in Table 5). Previous classifications are from F60 (Feast et al. 1960); Brey (Breysacher 1981); W84 (Walborn 1984); Mk (Melnick 1985); MG87 (Morgan & Good 1987); M87 (Moffat et al. 1987); SSM90 (Smith et al. 1990); TS90 (Testor & Schild 1990); CS97 (Crowther & Smith 1997); WB97 (Walborn & Blades 1997); B99 (Bosch et al. 1999); W99 (Walborn et al. 1999b); FMG03 (Foellmi et al. 2003); S08 (Schnurr et al. 2008). similar to the comparison with the IRSF catalogue, with visual Breysacher et al. 1999), and monitoring campaigns to study bi- inspection of potential matches to reject those notably blended narity (e.g. Moffat 1989; Schnurr et al. 2008). in the WFI data or with positions offset by contributions from The W-R and transitional “slash” stars (see Crowther & other nearby stars/nebulosity. In particular, given the crowding Walborn, in preparation) observed by the VFTS are summarised in the central region around R136 and the limited angular reso- in Table 2 (and are highlighted in green in Fig. 1). In addition to lution of 2MASS, we did not attempt cross-matching within the those in R136 (Crowther et al. 2010), these stars comprise some central 30 . Only cross-matches with 2MASS photometric qual- of the most massive stars in 30 Dor and will provide valuable ities of either “A” or “B” (i.e. S /N ≥ 7) were retained, leading to insights into some of the most critical phases of massive-star 2MASS identifications for 227 of our targets. evolution. Previous spectral types are included in Table 2, with revised classifications in the final column if new features and/or evi- 4. Spectral classification dence for companions are present in the FLAMES data. The new data reveal massive companions in at least two of these Following reduction, the first epoch of LR02 and LR03 spectra objects: VFTS 402 and 509 (BAT99-95 and 103, respectively). of each target were inspected; approximately 300 targets display Quantitative analysis of these data is now underway. Note that He II absorption, which is indicative of an O (or B0) spectral VFTS 527 (aka R139), has been treated as a W-R star by type. However, the multi-epoch nature of the VFTS spectroscopy some past studies; the VFTS observations have revealed it as complicates precise classification and entails significant analy- an evolved, massive binary system comprised of two O Iaf su- sis, which is being undertaken as part of studies towards binarity pergiants (Taylor et al. 2011). and the determination of stellar radial velocities (Sana et al.; and Dunstall et al., both in prep.). Detailed classifications of the O- and B-type spectra will therefore be given elsewhere. Here we 4.2. Discovery of a new W-R star in the LMC present classifications for the two smaller spectral groups in the The combined FLAMES spectrum of VFTS 682 is shown in survey: the W-R/massive emission-line stars and the cooler stars Fig. 10. Classified as WN5h (in which the “h” suffix denotes (of A-type and later). the presence of hydrogen lines), this is a previously unknown W-R star. From qualitative comparisons of the individual spec- 4.1. Wolf-Rayet and “slash” stars tra there is no evidence for significant (Δv 10 km s−1 ) radial velocity variations. Massive emission-line stars in the LMC have been well ob- In their analysis of the Spitzer-SAGE survey of the LMC served over the years, from the seminal Radcliffe Observatory (Meixner et al. 2006), VFTS 682 is included by Gruendl & study by Feast et al. (1960), to narrow-band imaging surveys to Chu (2009, hereafter GC09) in their list of “definite” young identify W-R stars (e.g. Azzopardi & Breysacher 1979, 1980), stellar objects (YSOs). Near-IR (from the IRSF catalogue) and comprehensive spectroscopic catalogues (e.g. Breysacher 1981; Spitzer photometry for VFTS 682 are summarised in Table 4. A108, page 10 of 53
- 11. C. J. Evans et al.: The VLT-FLAMES Tarantula Survey. I. Table 3. Spectral classifications for cool-type stars (A-type or later) from the VLT-FLAMES Tarantula Survey (VFTS). Star Sp. Type Star Sp. Type Star Sp. Type 006 Mid-late K 323 A5 II 773 Late G/Early K 011 Late G/Early K 341 Mid-late K 776 Carbon star 023 Late G/Early K 344 Mid-late K 783 Late G/Early K 026 Late G/Early K 357 Late G/Early K 785 Mid-late K 032 Late G/Early K 372 Late G/Early K 790 F0 057 Mid-late K 379 Mid-late K 791 Late G/Early K 081 Mid-late K 437 Mid-late K 793 Late G/Early K 092 Late F 439 Late G/Early K 803 Late G/Early K 115 Late G/Early K 454 Late G/Early K 805 Mid-late K 129 Mid-late K 490 Late G/Early K 808 Late G/Early K 139 Late F 524 G0 809 Late G/Early K 175 A2-3 II 544 Late G/Early K 816 G2 182 F0 595 Mid-late K 818 Mid-late K 193 Late G/Early K 614 Early G 820 A0 Ia 198 Mid-late K 655 Late G/Early K 828 Early M 222 G0 658 A7 II 839 G 236 Mid-late K 674 A2-3 II 844 Mid-late K 245 Mid-late K 680 Early G 852 Late F 260 Early G 691 A2-3 II 856 A7 II 262 F0 693 Late G/Early K 858 A7 II 264 Mid-late K 694 Mid-late K 861 Late G/Early K 265 A2-3 II 700 Mid-late K 862 Early G 271 A7 II 708 Late G/Early K 863 A5 II 275 Early M 721 A9 II 865 Late G/Early K 281 Mid-late K 744 Early M 870 F0 289 Late G/Early K 759 Mid-late K 871 A7 II 294 A0 Ib 760 A9-F0 II 873 A2-3 II 311 Carbon star 763 G5: 878 G2 312 Mid-late K 765 Early M 884 Carbon star 317 A9 II 767 Late G/Early K 893 A7: II 319 Mid-late K Notes. Previous classifications are available for 11 stars, primarily from Melnick (1985, Mk) and Schild & Testor (1992, ST92): 057: G8-K2 [ST92]; 129: G8-K3 [ST92]; 193: late G [ST92]; 198: G,K [ST92]; 222: G,K [ST92]; 271: A Ib [Mk]; 294: A0 Ib [Mk]; 317: A5 Ib [Mk]; 437: G8 III (Bosch et al. 1999); 691: A I (Walborn & Blades 1997), A2-3 I (Bosch et al. 1999); 793: early K I (Parker 1993). Near-IR photometry is also available from Hyland et al. (1992, and a pre-main sequence (“Herbig”) B[e] star (cf. the criteria infrared source 153) and 2MASS. The evolutionary status of from Lamers et al.). Nevertheless, the presence of such a rare VFTS 682 and the origins of its mid-IR excess are discussed object a mere 8. 5 from the core of R136 certainly warrants fur- by Bestenlehner et al. (in prep.). ther study. In particular, photometric monitoring would help to distinguish between the two evolutionary scenarios: small varia- tions (∼0.2 mag) would be expected for a B[e]-type supergiant, 4.2.1. A new B[e]-type star adjacent to R136 whereas much larger and irregular variations (related to accre- tion processes) would be expected for a “Herbig” object (Lamers The ARGUS spectrum of VFTS 1003 (Fig. 11) is particularly et al. 1998). striking owing to a large number of Fe II emission lines. It is similar to that of GG Carinae (see Walborn & Fitzpatrick 2000) but with emission lines from [Fe II]; some weak He I absorp- 4.3. Classification of later-type stars tion lines are also present. There is forbidden [S II] and [O III] emission at λ4069 and λ4363, respectively, although from the There are 91 stars with classifications of A-type or later that were present data it is not clear if these are from the local nebulosity retained as likely members of the LMC. For the purposes of clas- or are intrinsic to the star. There do not appear to be any sig- sification these were assumed to be single stars, i.e. all of the nificant radial velocity shifts between the individual spectra. Its available LR02 and LR03 spectra were stacked and co-added; near-IR colours (J − H) = 0.54 and (H − Ks ) = 1.43 mag (from classifications are given in Table 3. the IRSF catalogue) place it in a comparable region to the B[e] The small number of A-type spectra were classified with ref- stars from Gummersbach et al. (1995). We also note that it is erence to the standards presented by Evans & Howarth (2003) a single, isolated source in the high angular-resolution near-IR and the metal-poor A-type stars from Evans et al. (2006). The images from the Multiconjugate Adaptive-optics Demonstrator new FLAMES data do not include the Ca K line, so the primary (MAD) from Campbell et al. (2010). temperature diagnostic is the intensity of the metal lines; lumi- Lamers et al. (1998) presented a classification framework for nosity types were assigned on the basis of the Hγ equivalent- B[e]-type stars, with GG Car classified as a B[e] supergiant. The width criteria from Evans et al. (2004). spectrum of VFTS 1003 warrants a B[e] classification, but does Except for a small number of G-type stars (that were clas- not allow us to distinguish between an evolved B[e] supergiant sified following the criteria from Evans & Howarth 2003) we A108, page 11 of 53
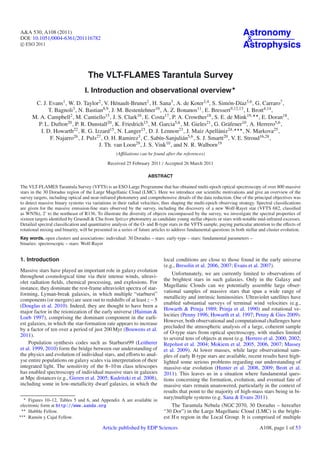
- 12. A&A 530, A108 (2011) Table 4. Summary of matches between targets in the VLT-FLAMES Tarantula Survey (VFTS) and candidate young stellar objects (YSOs) from Gruendl & Chu (2009, “GC09”). Star VFTS Sp. Type Identification Type Δr J H Ks [3.6] [4.5] [5.8] [8.0] [24.0] [VFTS] [GC09] [ ] 016 O2 III-If∗ 053708.79−690720.3 CS 0.5 13.39 13.37 13.35 12.99 12.20 10.61 8.73 3.82 178 O9.7 Iab 053751.03−690934.0 CS 0.1 12.84 12.83 12.81 12.71 12.48 11.69 9.76 3.87 320 Be 053821.10−690617.2 CS 0.4 15.19 14.98 14.64 13.21 12.86 11.85 10.04 − 345 O9.7 III(n) 053827.39−690809.0 CS 0.4 15.48 15.47 15.37 13.82 12.88 11.48 9.70 − 410 Late O 053834.77−690606.1 C 0.9 Multiple components – see Walborn et al. (1999a, 2002) 464 B0: 053839.24−690552.3 C 1.2 14.55 14.26 13.63 11.27 10.40 8.98 6.93 − 500 Late O+ late O 053841.23−690259.0 CS 0.7 13.80 13.73 13.68 13.27 12.52 10.89 8.74 3.02 586 O4 V((n))((fc))z 053845.33−690251.6 CS 0.4 14.96 14.91 14.88 14.51 13.34 11.62 9.51 2.82 631 O9.7 III(n) (SB1) 053848.86−690828.0 CS 0.1 15.76 15.66 15.66 14.60 13.53 12.37 11.13 − 682 WN5h 053855.56−690426.5 CS 0.3 13.53 12.96 12.48 11.69 11.37 10.48 9.15 − 702 O8.5 V (SB1) 053858.42−690434.7 C 0.5 15.35 15.12 14.91 12.57 11.74 9.59 7.71 − 751 O7-8 Vnnz 053909.13−690128.7 CS 0.9 15.62 15.48 15.31 13.87 13.07 − 10.37 3.75 152 B2 V 053746.64−690619.8 SD 0.4 14.66 14.47 14.30 14.05 13.99 13.26 11.76 − 323 A5 II 053821.78−691042.9 SD 0.1 14.26 14.07 13.91 13.81 13.86 13.15 11.57 − 641 B0.5: I: 053849.81−690643.3 SD 0.5 12.63 12.58 12.48 11.46 10.54 9.67 7.34 0.06 842 Be 053942.66−691151.6 SD 0.3 15.08 14.85 14.53 13.58 13.40 − 10.98 − Notes. The fourth column is the source classification from GC09: “C” – candidate YSO; “CS” – probable YSO, but could possibly be a star; “SD” – stars with photometric contamination from diffuse emission. Near-IR photometry (JHKs ) is from the IRSF catalogue (Kato et al. 2007), with mid-IR photometry from GC09. VFTS 410 = P93-409; the two major components were classified by Walborn et al. (2002) as O8.5 V and O9 V. employ broad classification bins for the cooler types. These are The near-IR images are particularly helpful to identify not a key component of our scientific motivations and due to robust counterparts. A notable false match at a distance of 1. 2 their red colours have relatively low S/N ratios. The spectral bins from VFTS 476 is GC09 053839.69−690538.1. The optical adopted in Table 3 encompass a range of types: “Early G” (G0- WFI image reveals only the VFTS target whereas, as shown by G5); “Late G/Early K” (G5-K3); “Mid-late K” (K3-M0); and Fig. 13 from Campbell et al. (2010), there is a very red source “Early M”. Three carbon stars with strong C2 Swan bands are at the GC09 position, with VFTS 476 the object to the south8 . also included in the sample. Near- and mid-IR photometry of matched sources from GC09 We do not attempt luminosity classifications for stars of F- are summarised in Table 4, each of these is now discussed in type and later. On the basis that their radial velocities are con- turn. sistent with membership of the LMC, from distance arguments they are notionally supergiants or bright giants (i.e. classes I and VFTS 016: This is the massive “runaway” star from Evans II). Indeed, five stars in Table 5 are sufficiently bright7 to be con- et al. (2010, “30 Dor 016”, classified as O2 III-If∗), which fea- sidered “red supergiants”: VFTS 081, 198, 236, 289, and 793, tures in the list of probable YSOs from GC09. each of which is encircled in red in Fig. 1. Mid-IR observations have been used by, e.g., Gvaramadze & Bomans (2008) and Gvaramadze et al. (2010, 2011) to iden- tify bow shocks associated with runaway stars. For instance, 5. Spitzer YSO candidates the SAGE 24 μm images were used to investigate six O2-type stars in the LMC thought to be runaways, including VFTS 016 Prompted by the mid-IR behaviour of VFTS 682 (Sect. 4.2), we (Gvaramadze et al. 2010). Of the six candidate runaways, only cross-matched the survey targets with the catalogues of “defi- BI 237 was reported to have a bow shock from inspection of the nite” and “probable” YSOs from GC09 to investigate their spec- MIPS images, consistent with the expectation from Gvaramadze tral properties. & Bomans (2008) that approximately 20% of runaways have an The SAGE data comprise imaging with two Spitzer instru- associated bow shock. ments: the InfraRed Array Camera (IRAC) at 3.6, 4.5, 5.8, Although the Spitzer resolution at 24 μm is less than ideal in and 8.0 μm, and the Multiband Imaging Photometer for Spitzer a region as crowded as 30 Dor, VFTS 016 is relatively isolated at (MIPS) at 24, 70, and 160 μm. The angular resolution of the a projected distance of 120 pc from the core of R136. The 24 μm IRAC images ranges from 1. 7 to 2. 0, with coarser resolu- magnitude from GC09 for VFTS 016 (see Table 4) suggests a tion of 6 , 18 , and 40 , at 24, 70, and 160 μm, respectively strong mid-IR excess – perhaps associated with a bow shock (but (Meixner et al. 2006). To compare our targets with the GC09 not extended sufficiently to be detected by Gvaramadze et al.). catalogues, we employed a conservative search radius (com- VFTS 178: A visually bright star, the spectrum of VFTS 178 pared to the IRAC resolution) of r < 2. 5, which yielded five appears as a relatively unremarkable supergiant, classified potential matches in the “definite” YSO list, and 11 potential O9.7 Iab (see Fig. 12). The star was previously classified as matches in the “probable” YSO list. Each potential match was B0.5 I by Schild & Testor (1992), with the new high-quality then examined using the optical WFI images and, where possi- data revealing sufficiently strong He II λ4542 absorption that ble, the MAD near-IR imaging from Campbell et al. (2010), and a slightly earlier type is required. No obvious radial velocity the imaging from the High Acuity Wide-field K-band Imager (HAWK-I) which was used to calibrate the MAD data. 8 Campbell et al. (2010) argued that the star was likely a massive star on the basis of its near-IR photometry. Indeed, the FLAMES spectra of 7 Assuming MV ∼–4.5 to 5.0 for late-type Ib supergiants. VFTS 476 reveal it as a late O-type star. A108, page 12 of 53
- 13. C. J. Evans et al.: The VLT-FLAMES Tarantula Survey. I. variations are apparent from inspection of the FLAMES data. VFTS 320: This was the closest match to GC09 053821.10−690617.2 (with VFTS 316 at a distance of only 1. 2). As noted in Table 5, the spectrum of VFTS 320 suffers from contamination from an adjacent fibre on the detector (see Sect. 2.2.2), manifested by a broad emission bump (approxi- mately 4% above the continuum) at λ4686. Aside from this wavelength region, the spectrum is that of an early B-type star with considerable nebular contamination plus weak Fe II emis- sion, which resembles that from a Be-type star. The adjacent ob- ject on the detector was VFTS 147, classified in Sect. 4.1 as WN6(h). This does not display Fe II emission (indeed, the He II λ4686 emission is by far the strongest line), i.e., the Fe II fea- tures seen in VFTS 320 are genuine. The spectrum (with the λ4686 region omitted) is shown in Fig. 12. VFTS 345: A single object in the WFI and HAWK-I frames, the co-added spectrum of VFTS 345 is shown in Fig. 12 and is classified as O9.7 III(n) (cf. the published classification of B0 V from Bosch et al. 1999). VFTS 410: This target is P93-409 (Parker 1993), located in “Knot 3” to the west of R136 (Walborn 1991). Classified as O3-6 V by Walborn & Blades (1997), HST imaging and spec- troscopy by Walborn et al. (1999a, 2002) resolved two bright components with spectral types of O8.5 V and O9 V. A third, much redder (visually fainter) source was reported just 0. 4 northwest of the two massive stars by Walborn et al. (1999a), as well as several very compact nebulosities to the northeast. This complex would be resolved poorly by the Spitzer observations, but is clearly an active site of star formation. For completeness, we show the combined spectrum of VFTS 410 in Fig. 12; there is significant nebular emission superimposed on the stellar profiles. Given the knowledge that there are two luminous components contributing to these data, it is worth noting that no radial velocity variations are seen from a comparison of the available spectra. Even if these are not in a bound binary system, their proximity in such a star-formation complex suggests they are associated. This object highlights the Fig. 13. Combined 6 × 6 H- and Ks -band MAD image of the can- benefit of high-resolution imaging for some systems (from HST, didate young stellar object 053839.24−690552.3 from the catalogue of MAD, etc.) when attempting to interpret the new spectroscopy. Gruendl & Chu (2009, centred on their position). The intensity is scaled to bring out the bow shock and the source at its centre, VFTS 464, in the upper and lower panels, respectively. VFTS 464: This is the star at the centre of the impressive bow-shock feature discovered by Campbell et al. (2010) from the MAD images. In Fig. 13 we show new combined colour im- might well be related to an ionization front (with associated trig- ages from MAD (with different intensity scalings). There is a gered star-formation) rather than a dynamical shock. source 0. 4 from the central object that is approximately three VFTS 500: This object appears as a single source in the times fainter – given the 1. 2 aperture of the Medusa fibres, the HAWK-I imaging, as shown in Fig. 14 (in which the slight spectra of the central star are likely contaminated by the com- northern extension of the star is an artefact of the dither pattern panion. used for the observations)9; the FLAMES spectroscopy reveals As one might expect, the FLAMES spectra are heavily con- it as a double-lined binary. Observed in Medusa Field A, the first taminated by nebular emission, which appears to include forbid- LR03 epoch was obtained on the same night as the first three den lines such as [S II] λλ4069-76, [Fe III] λ4702, and [Ar IV] LR02 spectra. The co-added spectrum from these epochs is λ4711. The combined blue-region spectrum is shown in Fig. 12 shown in Fig. 12, displaying twin components in the He I and II – note the weak He II absorption, leading to a provisional clas- lines. The nebular contamination thwarts precise classification, sification of B0:, with the uncertainty reflecting the problems of but both of the He I λ4026 components are greater in intensity nebular contamination and the potential contribution from the than the He II λ4200 features, requiring a type of later than O6. nearby object. Similarly, the intensity of the He II λ4200 profiles suggests a type of earlier than B0 for both components. The He II absorption at λ4542 and λ4686 appears consis- tent with the systemic radial velocity of 30 Dor, i.e., the object does not appear to be a candidate runaway in the radial direction. 9 The two sources ∼2. 75 to the SSE comprise VFTS 504, and the two Indeed, as noted by Campbell et al. (2010), the bow shock is ori- at the SE edge are VFTS 530. Both appear as probable blends in the entated towards R136 (and Brey 75/BAT99-100), suggesting it WFI imaging. A108, page 13 of 53
- 14. A&A 530, A108 (2011) Fig. 14. Combined 14 × 14 J- and Ks -band HAWK-I image of the Fig. 15. Combined 14 × 14 J- and Ks -band HAWK-I image of the candidate young stellar object 053841.23−690259.0, centred at the po- candidate young stellar object 053848.86−690828.0, centred at the po- sition from Gruendl & Chu (2009). The (near-)central bright source is sition from Gruendl & Chu (2009). The (near-)central bright source is VFTS 500, a double-lined binary comprised of two late O-type stars. VFTS 631, a single-lined massive binary. VFTS 586: The combined blue-region spectrum is shown in three sources indentified by GC09 as clear YSO candidates. Both Fig. 12. The spectrum is classified O4 V((n)))((fc))z, in which VFTS 410 and 464 are located immediately to the west of R136, the “c” suffix refers to C III emission at λλ4647-50-52 (Walborn while VFTS 702 is 2 to the northeast. Echoing the discussion et al. 2010). from Campbell et al. (2010) regarding the location of the candi- date high-mass YSOs (which included VFTS 464), all three ob- VFTS 631: Inspection of the spectra of VFTS 631 reveals jects are in regions associated with molecular gas (Werner et al. a single-lined binary, with radial velocity shifts of the order of 1978; Johansson et al. 1998) that comprise the second genera- 70 km s−1 in the final LR02 observation compared to the first tion of star-formation around R136 (Walborn & Blades 1997; epoch. To estimate the spectral type, the first three LR02 epochs Walborn et al. 1999a, 2002). (taken on the same night) were combined with the LR03 data, Closer scrutiny of the correlation between Hα emission as shown in Fig. 12. The combined spectrum is classified as (from archival HST images) and the GC09 sources was pro- O9.7 III(n), in good agreement with published types of O9-B0 II vided by Vaidya et al. (2009), in which they discussed four (Walborn & Blades 1997) and O9.5 II (Bosch et al. 1999). of the VFTS sources: VFTS 464 was identified as a type II There are two obvious components to the nebular emission YSO (cf. the criteria from Chen et al. 2009) in a bright-rimmed in the LR02 and LR03 spectra (e.g. twin-peaked emission in dust pillar, and VFTS 320, 682 and 702 were each classifed the [O III] lines). One of the components is consistent with as type III YSOs in H II regions. Vaidya et al. noted each of the typical systemic velocity of 30 Dor (∼270–280 km s−1 , with the latter three as comprising multiple sources in the Spitzer the other blueshifted by approximately 50–60 km s−1 ). These are PSF. The close companions to VFTS 320 have already been most likely from separate components of gas emission, but could noted above, while there are no obvious nearby companions to also be indicative of a wind-blown bubble around the binary, de- VFTS 702 in the HAWK-I images, nor in the IRSF catalogue. pending on the systemic velocity of the system. A third (weaker), There is a faint IRSF source approximately 2 from VFTS 682: longer-wavelength nebular component is also visible in the [N II] 05385578−6904285, with H = 17.56 ± 0.09 mag and no detec- and [S II] lines in the HR15N spectra. tions in J and Ks . Intriguingly, VFTS 682 is only ∼17. 5 from VFTS 702: As with VFTS 631, radial velocity shifts are seen VFTS 702, both of which appear to be co-located with the most between the LR02 observations. To estimate the spectral type intense CO-emission in the region (see Fig. 1 from Johansson we combined the second and third LR02 epochs with the LR03 et al. 1998). This poses additional evolutionary questions regard- observations (all obtained on the same night), shown in Fig. 12 ing VFTS 682 (Bestenlehner et al., in prep.). and classified as O8.5 V. From their multi-band approach, Vaidya et al. (2009) reported VFTS 016 and 631 as non-YSOs. They describe VFTS 751: An apparently single star, with the combined VFTS 016 (GC09 053708.79−690720.3) as a bright star, consis- spectrum shown in Fig. 12. The stellar lines appear broadened tent with the mid-IR excess perhaps arising from a bow shock. by rotation, leading to a classification of O7-8 Vnnz. However, they flag VFTS 631 (GC09 053848.86−690828.0) as a galaxy. Notwithstanding the discussion of the spectroscopy of 5.1. Discussion VFTS 631, the combined J- and Ks -band HAWK-I image ap- pears unremarkable (Fig. 15), nor is it obviously extended in the All of the spectra in Fig. 12 (except VFTS 178) contain some WFI images. degree of nebular contribution; this is not surprising given the Analysis of the SAGE data by Whitney et al. (2008) iden- spatial extent of the H II region in 30 Dor. However, the most tified 1197 candidate YSOs using different selection criteria intense [O III] emission is seen in VFTS 410, 464, and 702, the to GC09. The relative merits of the selection criteria were A108, page 14 of 53