Demographics of Senior and Veteran Housing in Rural America - Housing Assistance Council
•
2 gostaram•972 visualizações

Keith Wiley of HAC presents demographic data on rural seniors and veterans and their housing. Presentation from the Housing Assistance Councils symposium "Housing Seniors & Veterans in Rural America: Preservation, Development and Services" in Council Bluffs, IA on August 28-29, 2013

Recomendados
Recomendados
Mais conteúdo relacionado
Semelhante a Demographics of Senior and Veteran Housing in Rural America - Housing Assistance Council
Semelhante a Demographics of Senior and Veteran Housing in Rural America - Housing Assistance Council (20)
Mais de Housing Assistance Council
Mais de Housing Assistance Council (20)
Último
Último (20)
Demographics of Senior and Veteran Housing in Rural America - Housing Assistance Council
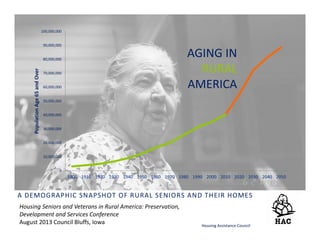
- 1. A DEMOGRAPHIC SNAPSHOT OF RURAL SENIORS AND THEIR HOMES Housing Assistance Council AGING IN RURAL AMERICA 0 10,000,000 20,000,000 30,000,000 40,000,000 50,000,000 60,000,000 70,000,000 80,000,000 90,000,000 100,000,000 1900 1910 1920 1930 1940 1950 1960 1970 1980 1990 2000 2010 2020 2030 2040 2050 Population Age 65 and Over Housing Seniors and Veterans in Rural America: Preservation, Development and Services Conference August 2013 Council Bluffs, Iowa
- 2. RURALSENIORSANDTHEIRHOMES 0.00% 5.00% 10.00% 15.00% 20.00% 25.00% 1900 1910 1920 1930 1940 1950 1960 1970 1980 1990 2000 2010 2020 2030 2040 2050 Percent Age 65 and Over U.S. Senior Population 1900 – 2050* THE WAVE IS COMING U.S. Census Bureau, U.S. Department of Commerce. Projections of the Population by Age and Sex for the United States: 2010 to 2050. *population projection
- 3. RURALSENIORSANDTHEIRHOMES 0 10,000,000 20,000,000 30,000,000 40,000,000 50,000,000 60,000,000 70,000,000 80,000,000 90,000,000 100,000,000 0.00% 5.00% 10.00% 15.00% 20.00% 25.00% 1900 1910 1920 1930 1940 1950 1960 1970 1980 1990 2000 2010 2020 2030 2040 2050 Percent Age 65 and OverU.S. Senior Population 1900 – 2050* THE WAVE IS COMING U.S. Census Bureau, U.S. Department of Commerce. Projections of the Population by Age and Sex for the United States: 2010 to 2050. *population projection
- 8. 13.0% 15.7% 12.9% 11.5% 0.0% 2.0% 4.0% 6.0% 8.0% 10.0% 12.0% 14.0% 16.0% 18.0% U.S. Rural & Small Town Suburban & Exurban Urban Percent of the Population Population Age 65 or Over, 2010 8 RURALSENIORSANDTHEIRHOMES HAC Tabulations of U.S. Census Bureau 2010 Census of Population and Housing. SENIORS ARE ALSO MORE PREVELANT IN RURAL AREAS
- 14. RURALSENIORSANDTHEIRHOUSING 0 10,000,000 20,000,000 30,000,000 40,000,000 50,000,000 60,000,000 70,000,000 80,000,000 90,000,000 100,000,000 1900 1910 1920 1930 1940 1950 1960 1970 1980 1990 2000 2010 2020 2030 2040 2050 Population Senior Population by Age Group, 1900 – 2050* 64 to 74 75 to 84 85 plus AND LIFE EXPECTANCIES WILL CONTINUE TO INCREASE U.S. Census Bureau, U.S. Department of Commerce. Projections of the Population by Age and Sex for the United States: 2010 to 2050. *population projection
- 15. 15 RURALSENIORSANDTHEIRHOMES 5 4 3 2 1 0 1 2 3 4 5 Under 5 5 to 9 10 to 14 15 to 19 20 to 24 25 to 29 30 to 34 35 to 39 40 to 44 45 to 49 50 to 54 55 to 59 60 to 64 65 to 69 70 to 74 75 to 79 80 to 84 85 Plus Percent Age Category Rural & Small Town Population by Age and Gender, 2010 Percent Female Percent Male
- 16. 16 RURALSENIORSANDTHEIRHOMES 5 4 3 2 1 0 1 2 3 4 5 Under 5 5 to 9 10 to 14 15 to 19 20 to 24 25 to 29 30 to 34 35 to 39 40 to 44 45 to 49 50 to 54 55 to 59 60 to 64 65 to 69 70 to 74 75 to 79 80 to 84 85 Plus Percent Age Category Rural & Small Town Population by Age and Gender, 2010 Percent Female Percent Male HAC Tabulations of U.S. Census Bureau 2010 Census of Population and Housing.
- 17. 17 RURALSENIORSANDTHEIRHOMES 5 4 3 2 1 0 1 2 3 4 5 Under 5 5 to 9 10 to 14 15 to 19 20 to 24 25 to 29 30 to 34 35 to 39 40 to 44 45 to 49 50 to 54 55 to 59 60 to 64 65 to 69 70 to 74 75 to 79 80 to 84 85 Plus Percent Age Category Rural & Small Town Population by Age and Gender, 2010 Percent Female Percent Male HAC Tabulations of U.S. Census Bureau 2010 Census of Population and Housing.
- 18. 18 RURALSENIORSANDTHEIRHOMES 5 4 3 2 1 0 1 2 3 4 5 Under 5 5 to 9 10 to 14 15 to 19 20 to 24 25 to 29 30 to 34 35 to 39 40 to 44 45 to 49 50 to 54 55 to 59 60 to 64 65 to 69 70 to 74 75 to 79 80 to 84 85 Plus Percent Age Category Rural & Small Town Population by Age and Gender, 2010 Percent Female Percent Male HAC Tabulations of U.S. Census Bureau 2010 Census of Population and Housing.
- 19. 19 RURALSENIORSANDTHEIRHOMES Produced by the Housing Assistance Council Washington, DC Source: HAC Tabulations of Census Bureau Data Population Loss 1980-2010 Legend Population Loss 1980-2010 states
- 21. 21 RURALSENIORSANDTHEIRHOMES Produced by the Housing Assistance Council Washington, DC Source: HAC Tabulations of 2005-2009 Ameican Community Survey Minority Population Age 65 and Over, 2010 Legend Elderly African American >33.3% Elderly Asian > 33.3% Elderly Hispanic > 33.3% Elderly Native American > 33.3% states
- 24. Veterans and Disabilities 16.3% 27.3% 36.8% 39.6% 0% 5% 10% 15% 20% 25% 30% 35% 40% 45% Total Population Veterans Seniors Senior Veterans Census Defined Rural Populations Living With A Disability* *HAC Tabulation of ACS 2009‐11 Three‐Year Estimate
- 28. 9.8% 11.4% 7.2% 8.2% 11.8% 14.0% 0.0% 2.0% 4.0% 6.0% 8.0% 10.0% 12.0% 14.0% 16.0% U.S. Rural & Small Town Percent in Poverty Senior Poverty By Residence & Gender, 2010 All Elderly Elderly Male Elderly Female 28 RURALSENIORSANDTHEIRHOMES POVERTY RATES ARE STILL HIGHER AMONG RURAL SENIORS HAC Tabulations of U.S. Census Bureau 2006‐2010 American Community Survey.
- 29. 29 RURALSENIORSANDTHEIRHOMES Legend Counties Percent Senior Poverty 0.0 - 8.5 8.6 - 12.9 13.0 - 18.6 18.7 - 27.5 27.6 - 61.0 Poverty, Persons Age 65 and Over, 2010
- 33. 0.0% 5.0% 10.0% 15.0% 20.0% 25.0% 30.0% U.S. Rural & Small Town Percent Elderly Occupied Homes Occupied Housing Units – Householder Age 65 or Older, 2010 Senior‐Occupied Homeowners Senior‐Occupied Renters 33 RURALSENIORSANDTHEIRHOMES HAC Tabulations of U.S. Census Bureau 2006‐2010 American Community Survey.
- 35. HO USI NG TE NU RE 35 RURALSENIORSANDTHEIRHOMES 0.0% 10.0% 20.0% 30.0% 40.0% 50.0% 60.0% 70.0% 80.0% 90.0% 15 to 34 35 to 44 45 to 54 55 to 59 60 to 64 65 to 74 75 + Homeownership Rate Age Group Rural & Small Town Homeownership by Age and Mortgage Status, 2010 With a Mortgage Without a Mortgage AS RURAL HOMEOWNERS AGE THEY HAVE LESS MORTGAGE DEBT HAC Tabulations of U.S. Census Bureau 2006‐2010 American Community Survey.
- 36. 36 RURALSENIORSANDTHEIRHOMES Manufactured Homes, 2010 Legend Counties Percent Manufactured Home 0.0 - 6.0 6.1 - 12.7 12.8 - 20.2 20.3 - 29.6 29.7 - 56.1 Manufactured Homes as a Percent of All Occupied Housing Units
- 40. Veteran Homelessness • While overall numbers have decreased since 2009, still over 60,000 veterans were homeless in recent 2012 Count* • Approximately 27,000 of these homeless veterans lived outside of a shelter* • Veterans make up 13 percent of homeless population but just 7 percent of total population* *The 2012 Point‐in‐Time Estimates of Homelessness Assessment Report Volume 1. HUD. Found at following url: https://www.onecpd.info/resources/documents/2012AHAR_PITestimates.pdf