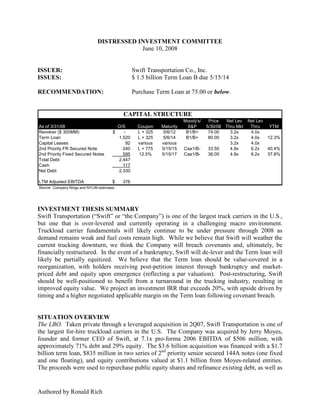
Distressed Investment Committee Recommends Purchase of Swift Transportation Term Loan
•
1 gostou•1,036 visualizações


Recomendados
Mais conteúdo relacionado
Mais procurados
Mais procurados (10)
Destaque
Semelhante a Distressed Investment Committee Recommends Purchase of Swift Transportation Term Loan
Semelhante a Distressed Investment Committee Recommends Purchase of Swift Transportation Term Loan (20)
Mais de Ronald Rich
Último
Último (20)
Distressed Investment Committee Recommends Purchase of Swift Transportation Term Loan
- 1. DISTRESSED INVESTMENT COMMITTEE June 10, 2008 ISSUER: Swift Transportation Co., Inc. ISSUES: $ 1.5 billion Term Loan B due 5/15/14 RECOMMENDATION: Purchase Term Loan at 75.00 or below. CAPITAL STRUCTURE Moody's/ Price Net Lev Net Lev As of 3/31/08 O/S Coupon Maturity S&P 5/30/08 Thru Mkt Thru YTM Revolver ($ 300MM) $ - L + 325 5/6/12 B1/B+ 74.00 3.2x 4.0x Term Loan 1,520 L + 325 5/6/14 B1/B+ 80.00 3.2x 4.0x 12.3% Capital Leases 92 various various 3.2x 4.0x 2nd Priority FR Secured Note 240 L + 775 5/15/15 Caa1/B- 33.50 4.8x 6.2x 40.4% 2nd Priority Fixed Secured Notes 595 12.5% 5/15/17 Caa1/B- 36.00 4.8x 6.2x 37.8% Total Debt 2,447 Cash 117 Net Debt 2,330 LTM Adjusted EBITDA $ 376 Source: Company filings and NYLIM estimates. INVESTMENT THESIS SUMMARY Swift Transportation (“Swift” or “the Company”) is one of the largest truck carriers in the U.S., but one that is over-levered and currently operating in a challenging macro environment. Truckload carrier fundamentals will likely continue to be under pressure through 2008 as demand remains weak and fuel costs remain high. While we believe that Swift will weather the current trucking downturn, we think the Company will breach covenants and, ultimately, be financially restructured. In the event of a bankruptcy, Swift will de-lever and the Term loan will likely be partially equitized. We believe that the Term loan should be value-covered in a reorganization, with holders receiving post-petition interest through bankruptcy and market- priced debt and equity upon emergence (reflecting a par valuation). Post-restructuring, Swift should be well-positioned to benefit from a turnaround in the trucking industry, resulting in improved equity value. We project an investment IRR that exceeds 20%, with upside driven by timing and a higher negotiated applicable margin on the Term loan following covenant breach. SITUATION OVERVIEW The LBO. Taken private through a leveraged acquisition in 2Q07, Swift Transportation is one of the largest for-hire truckload carriers in the U.S. The Company was acquired by Jerry Moyes, founder and former CEO of Swift, at 7.1x pro-forma 2006 EBITDA of $506 million, with approximately 71% debt and 29% equity. The $3.6 billion acquisition was financed with a $1.7 billion term loan, $835 million in two series of 2nd priority senior secured 144A notes (one fixed and one floating), and equity contributions valued at $1.1 billion from Moyes-related entities. The proceeds were used to repurchase public equity shares and refinance existing debt, as well as Authored by Ronald Rich
- 2. to make a $560 million shareholder loan to Moyes-related entities. This loan is personally guaranteed by Jerry Moyes, matures in 2018, and is secured by Swift stock held by family trusts. The Company pays dividends to these stockholders to cover the interest on the loan; should Swift be unable to make dividend payments, the loan interest will PIK. Recent Events. The timing and leverage of the acquisition could not have been worse. Entering into the acquisition, Jerry Moyes anticipated a relatively expedient turnaround to the trucking industry downturn, which had begun a year earlier in 2Q06; instead, Wall Street analysts currently expect the beginnings of a turnaround to commence in 2H08 at earliest. In the interim, Swift must contend with an aging tractor fleet, high capital expenditure requirements, high interest expense, and tightening maintenance covenants; mitigating these challenges are the ability to reduce the Company fleet size, flexible cash capital expenditure requirements (utilizing capital and operating leases), ample liquidity, and strong management expertise. COMPANY OVERVIEW Swift Transportation is a Nevada corporation headquartered in Phoenix, Arizona. Founded by current CEO, Jerry Moyes, in 1966, Swift began its early operations with a handful of trucks. Swift has grown into the largest for-hire truckload carrier, with approximately $3.3 billion in revenue and approximately 18,000 tractors and 50,000 trailers. The Company transports goods throughout an extensive network of 40 major terminals in the U.S. and Mexico, offering a diverse equipment selection including dry van, refrigerated, flatbed, and heavy-haul trucks and trailers on a for-hire or dedicated basis. HISTORICAL ANNUAL FINANCIALS As of 3/31/08 2000 2001 2002 2003 2004 2005 2006PF 2007PF LTM $ in millions SUMMARY INCOME STATEMENT Operating Revenue Trucking revenue $ 1,809 $ 1,993 $ 1,976 $ 2,208 $ 2,565 $ 2,723 $ 2,586 $ 2,551 $ 2,557 Fuel surcharge revenue 66 59 38 89 190 392 463 492 552 Other revenue 99 60 87 101 72 83 162 221 235 Total Operating Revenue 1,974 2,112 2,101 2,398 2,826 3,197 3,210 3,265 3,345 Adjusted EBITDA $ 276 $ 231 $ 263 $ 294 $ 365 $ 394 $ 499 $ 400 $ 376 Adjusted EBITDA Margin 14.0% 10.9% 12.5% 12.3% 12.9% 12.3% 15.5% 12.3% 11.2% KEY DRIVERS Trucking Rev. per Loaded Mile $ 1.39 $ 1.41 $ 1.41 $ 1.45 $ 1.52 $ 1.58 $ 1.64 $ 1.63 $ 1.63 Loaded Miles (MM) 1,304 1,409 1,398 1,520 1,683 1,724 1,580 1,562 1,571 Deadhead percentage 14.1% 15.1% 14.1% 13.8% 12.8% 12.1% 12.2% 13.0% 13.0% Avg ATA Tonnage Index 99 100 105 107 113 115 114 112 112 DOE Diesel Fuel Index 150 141 132 151 181 240 270 288 313 * Figures for fiscal 2006 and 2007 are pro forma for the acquisition of Swift and the contribution of IEL. Source: Company filings and NYLIM estimates. The Company went public in 1990 with Jerry Moyes remaining CEO, President and Chairman through late 2005. In March 2004, the Company, in connection with new NASDAQ governance requirements, named 3 independent directors. That May, the Board appointed a committee to investigate trades in Swift stock made by Mr. Moyes, ahead of positive news releases. An SEC investigation ensued, following which, Mr. Moyes agreed to pay a $1.5 million fine without admitting any wrongdoing. Disagreeing with the direction the new Board was taking the company, Mr. Moyes resigned in October 2005. He initially threatened a proxy fight (through 2
- 3. his 39% stock ownership at the time), but ultimately completed the leveraged buyout in May 2007. In 2005, along with industry trends, Swift significantly expanded its intermodal operations to better serve its customers who also utilize rail services; the Company now has partnerships with all major rail carriers. The intermodal fleet totals over 5,000 53-foot containers and is expected to grow along with this fast- growing freight transport mode. Swift also owns Trans-Mex, a top 5 transportation provider in Mexico, which has enabled the company to cross-sell its services and expand its geographic footprint. Swift offers border crossing services at all major Mexican border crossings, and also maintains a presence in every Canadian province. Swift’s major customers include manufacturers and service providers in the retail, home improvement, food and beverage, pharmaceuticals, and manufactured goods industries. Terminals are often located near significant customers. Swift has long-term relationships with its customers, with 17 of its top 25 customers holding a relationship longer than 10 years. Its customer base is also diverse, with Wal-Mart the largest, accounting for approximately 15% of revenues. While Swift represents approximately 1% of the U.S. for-hire trucking segment revenues, its top 25 customers represent over 50% of industry revenues. In addition to Wal- Mart, key customers include Sears, Target, Lowe’s, Home Depot, Costco, Clorox, Kimberly- Clark, P&G and Campbell’s Soup. 3
- 4. INDUSTRY OVERVIEW The freight transportation industry includes trucking, rail, pipeline, water, intermodal and air freight. Truckload, defined as consignments weighing greater than 10,000 pounds with full trucks dedicated to one customer with delivery of goods from start to finish, remains, by far, the dominant mode of freight transportation, with approximately 70% share by tonnage and 78% by revenue. Less-than-truckload (LTL) carriers take partial loads from multiple customers on a single truck and then route the goods through a series of terminals where freight is transferred to other trucks with similar destinations. Trucking has been growing over the past decade as a percentage of freight tonnage nationally, and is about evenly comprised of for-hire truckload and private fleet truckload segments. The average length of haul, however, has been in secular decline for several years since 2001 as some business has been lost/transferred to railroads and intermodal. The trucking industry hauled 10.7 billion tons or 69% of the total freight volume in the US in 2006 (most recent data available), which equates to $645.6 billion in freight revenue or 83.8% of the nation’s freight bill. This is up from 68% in tonnage and 78% by revenue in 2005. The for-hire segment is highly fragmented among carriers, with the top-ten companies representing only 3.2% of aggregate segment revenues in 2006. Recent Industry Trends In what has been described as “the worst trucking environment in 30 years,” the trucking industry has been in a downturn since early 2006. While declining freight tonnage is endemic to a downturn in the trucking industry, and in that regard the current cycle is of no greater magnitude than previous ones, it is an excess supply of trucks that has exacerbated this cycle. Tractor Supply. During 2006, many trucking companies pre-bought tractors in advance of the 2007 change to emission standards; the pre-2007 tractors have higher fuel efficiency and contain engine technology that is proven on the road and better known to maintenance staffs. Unfortunately, the pre-buy coincided with the downturn in freight tonnage, producing a supply/demand imbalance that is still working itself out. The excess supply of tractors has placed unprecedented pressure on pricing, which is expected to firm, at earliest, in 2H08. Fuel Costs. The cost of diesel fuel increased 9% Q/Q in 1Q08 and is projected by the DOE to increase another 26% Y/Y in 2008. The rapid change in cost structure that carriers are experiencing is unprecedented and could ultimately lead to permanent industry shifts, driving increased competitive advantage to larger carriers with a greater emphasis on short and medium- haul lines, and to rail intermodal for long-haul lines. Profit Margins. With a significant portion of large trucking company business subject to annual contracts, rate increases will likely not fully flow through until 2009 (typically measured by revenue per loaded mile). For the portion of business that is transacted on the spot market, bid inquiry has increased as shippers shop for the best price. Margins are forecasted to remain under pressure in the near-term given the high cost of tractors (including compliance with EPA emissions regulations), fuel expense (which fuel surcharges do not fully capture), maintenance expense, labor inflation (mitigated by current driver oversupply), and operating and licensing fees. 4
- 5. COMPETITOR METRICS In reviewing Swift’s metrics against those of its competitors, one quickly concludes that there are many fronts on which Swift needs to make improvements: 1) the Company’s operating ratio (operating expenses / operating revenue) is higher than most (and hence, EBITDA margin is lower) and is an area that management has set a formal goal of improving by 200bps on a run- rate basis by the end of 2009; 2) Swift is more leveraged than all of its competitors; 3) the Company’s deadhead (miles driven but not paid for) percentage is at the high end of the sample range; and 4) as reflected in net revenue/tractor, a number of its competitors are more productive with their asset base. To the positive, Swift is among the largest carriers, which allows it to leverage its customer relationships across a large geographic footprint and maintain its loaded miles. In addition, its pricing per loaded mile is better than most. Fiscal YE Figures PUBLIC COMPETITOR METRICS $ in millions Swift JB Hunt Werner Knight Celadon Marten USA P.A.M. Exchange Ticker Private JBHT Werner KNX CVTI MRTN USAK PTSI Financial Trucking Revenue $ 2,551 NA $ 1,483 NA $ 436 $ 409 $ 378 $ 317 Operating Revenue 3,265 3,397 2,071 702 524 547 470 403 Operating Ratio 97.1% 89.1% 93.4% 83.9% 94.8% 94.3% 96.8% 96.5% Adjusted EBITDA $ 400 $ 571 $ 304 $ 176 $ 58 $ 76 $ 63 $ 53 Adjusted EBITDA Margin 12.3% 16.8% 14.7% 25.1% 11.1% 13.9% 13.4% 13.2% Cash Cap Ex $ 297 $ 399 $ 133 $ 139 $ 38 $ 105 $ 41 $ 81 Sale of PP&E 70 54 107 43 34 29 21 14 Net Cash Cap Ex 227 344 26 96 4 76 20 67 Cash Flow Before Financing $ 42 $ 53 NM $ 35 $ 40 -$ 11 $ 38 -$ 18 Cash Flow/Net Debt 1.7% 6.2% NM NM 48.9% -21.1% 40.1% -78.6% Net Debt 2,496 853 No debt No debt 81 54 94 23 Net Leverage 6.2x 1.5x NM NM 1.4x 0.7x 1.5x 0.4x EV/Adjusted EBITDA NA 7.9x 4.2x 7.8x 5.1x 5.2x 3.7x 3.4x Operating Loaded Miles (MM) 1,562 NA 876 NA 282 NA 263 216 Deadhead Percentage 13.0% 11.3% 13.5% 12.9% 10.0% NA 11.3% 5.9% Total Miles (MM) 1,796 NA 1,013 NA 314 277 296 230 Net Revenue/Tractor/Week 2,869 3,704 3,341 2,910 2,793 3,103 2,948 NM Net Revenue/Loaded Mile 1.63 2.17 1.69 NA 1.53 NA 1.47 1.43 Linehaul Tractor Count Company 16,017 4,233 7,470 3,584 2,546 2,191 2,542 1,949 Owner Operator 3,221 962 780 229 370 358 32 49 Total 19,238 5,195 8,250 3,813 2,916 2,549 2,574 1,998 Source: Company filings and NYLIM estimates. 5
- 6. COMPANY FINANCIAL PERFORMANCE Historical Quarterly Financials Swift’s recent financial performance has been challenged. With a cost structure that is greatly fixed in the near-term, Swift’s profitability is highly sensitive to the amount and pricing of loaded miles. As shipping demand has declined against a backdrop of an oversupply of trucks, pricing power has eroded; additionally, rising diesel fuel costs have increased shipping costs to the customer, further limiting the carrier’s ability to pass-through price increases. As a result, pricing has come under pressure, a dynamic which will likely remain unchanged until fuel costs decline or shipping demand accelerates. In the first fiscal quarter of 2008, operating revenues increased 11% Y/Y to $816 million, while adjusted EBITDA declined $24 million Y/Y to $58 million and adjusted EBITDA margin declined 410bps Y/Y to 7.1% (see table below). The margin erosion was due primarily to lower pricing and higher fuel costs. While fuel surcharges accounted for 75% of the increase in operating revenues, they also contributed to the decline in EBITDA margin (Swift typically recoups 70% to 80% of fuel cost increases through contracted fuel surcharges), as well as the decrease in pricing. Adjusted for inflation, pricing declined 5% (1% nominally) Y/Y to $1.61 (nominal), accounting for $7.5 million of lost EBITDA, while a timing shift in fuel surcharge billing accounted for another $15 million. QUARTERLY HISTORICAL FINANCIALS $ in millions 1Q06PF 2Q06PF 3Q06PF 4Q06PF 1Q07PF 2Q07PF 3Q07 4Q07 1Q08 SUMMARY INCOME STATEMENT Operating Revenue Trucking revenue $ 642 $ 660 $ 647 $ 637 $ 598 $ 644 $ 660 $ 650 $ 604 Fuel surcharge revenue 99 126 133 104 96 119 127 150 156 Other revenue 34 36 44 51 43 52 61 65 57 Total Operating Revenue 775 822 825 792 736 816 848 865 816 Adjusted EBITDA * $ 118 $ 133 $ 134 $ 113 $ 82 $ 97 $ 110 $ 111 $ 58 LTM Adjusted EBITDA 439 469 507 497 462 425 401 400 376 Adjusted EBITDA Margin 15.2% 16.2% 16.2% 14.2% 11.2% 11.8% 13.0% 12.9% 7.1% LTM Adjusted EBITDA Margin 13.6% 14.4% 15.5% 15.5% 14.6% 13.4% 12.6% 12.3% 11.2% CREDIT METRICS Net Leverage Covenant - - - - - - - 6.95x 6.75x Net Leverage Calculation NM NM NM NM NM 5.61x 5.57x 5.81x 6.20x Interest Coverage Covenant - - - - - - - 1.30x 1.35x Interest Coverage Calculation NM NM NM NM NM NA NA 1.49x 1.43x KEY DRIVERS Trucking Rev. per Loaded Mile $ 1.61 $ 1.62 $ 1.64 $ 1.67 $ 1.63 $ 1.62 $ 1.65 $ 1.63 $ 1.61 Loaded Miles (MM) 398 406 395 381 366 398 400 398 375 Deadhead percentage 12.4% 11.6% 11.6% 13.2% 13.3% 12.9% 12.7% 13.1% 13.3% Avg ATA Tonnage Index 113 114 114 115 115 111 111 113 115 DOE Diesel Fuel Index 250 284 292 256 255 281 290 327 355 * Adjusted EBITDA contains addbacks for non-cash and non-recurring items. ** Figures for periods 1Q06 through 2Q07 are pro forma for the acquisition of Swift and the contribution of IEL. Source: Company filings and NYLIM estimates. 6
- 7. Base Case Projected Financials We expect continued pressure on pricing and high fuel costs for the rest of 2008. Management has seen improvement in pricing in 2Q08, but by all industry accounts, it is, by far, a shipper’s market. In our base case (see table below), we project adjusted EBITDA to decline $74 million Y/Y to $326 million by year-end 2008. As smaller truck carriers continue to go out of business, supply and demand should equilibrate, possibly restoring pricing power in 1H09. Our projections for fiscal 2009 and 2010 assume some price improvement, higher loaded miles and some relief in fuel costs. We project adjusted EBITDA of $330 million and $381 million for fiscal 2009 and 2010, respectively. BASE CASE PROJECTED FINANCIALS $ in millions 2Q08 3Q08 4Q08 2008 2009 2010 KEY DRIVERS Trucking Rev. per Loaded Mile $ 1.62 $ 1.62 $ 1.63 $ 1.62 $ 1.63 $ 1.65 Loaded Miles (MM) 390 390 400 1,555 1,600 1,640 Deadhead percentage 13.0% 13.0% 12.9% 13.1% 12.9% 12.8% DOE Diesel Fuel Index 412 412 398 394 367 340 SUMMARY INCOME STATEMENT Operating Revenue Trucking revenue $ 632 $ 632 $ 652 $ 2,520 $ 2,608 $ 2,706 Fuel surcharge revenue 215 215 207 792 741 666 Other revenue 66 75 79 277 327 367 Total Operating Revenue 913 922 938 3,589 3,676 3,739 Adjusted EBITDA $ 85 $ 87 $ 96 $ 326 $ 330 $ 381 LTM Adjusted EBITDA 364 341 326 Adjusted EBITDA Margin 9.3% 9.4% 10.2% 9.1% 9.0% 10.2% LTM Adjusted EBITDA Margin 10.6% 9.7% 9.1% CREDIT METRICS Net Leverage Covenant 6.55x 6.35x 6.15x 6.15x 5.05x 4.40x Net Leverage Calculation 6.45x 6.92x 7.41x 7.41x 7.76x 6.95x Interest Coverage Covenant 1.45x 1.50x 1.60x 1.60x 1.85x 2.25x Interest Coverage Calculation 1.42x 1.37x 1.36x 1.36x 1.29x 1.44x Source: NYLIM estimates. Projected Covenant Breach and Loan Re-pricing We expect Swift to breach its leverage ratio covenant in 3Q08, resulting in lenders demanding a substantial margin increase. While an increase in applicable margin is limited to 150bps by the Intercreditor Agreement for both the Term loan and 2nd Priority Notes, loan holders may be able to negotiate a higher margin upon threat of a filing; in the near-term, we would expect noteholders to be disadvantaged in bankruptcy, given the partial equitization of the Term loan that would be necessary to properly de-lever the Company. It should be noted that, in January 2008, term holders of smaller trucker Gainey re-priced their loan from L+250 to L+700 (200bps of which is PIK). Liquidity We anticipate that Swift has sufficient liquidity to navigate the trucking industry downturn, though the Company may not be able to hold off a restructuring in the event of multiple covenants breaches. As of March 31, 2008, Swift had liquidity of $372 million, comprised of $92 million of unrestricted cash ($25 million restricted) and $280 million of revolver availability. 7
- 8. We project Swift will generate cash before financings of $28 million in fiscal 2008 and burn cash before financings of $147 million and $84 million in fiscal 2009 and 2010, respectively. The cash burn is primarily due to projected annual cash net (net of equipment dispositions) capital expenditures of $200 million and increasing cash interest expense. Capital expenditures are an extremely important component of cash management for all trucking companies. Given its fleet size, Swift’s annual net capex is approximately $300 million, which can be financed through cash, capital leases and operating leases. The Company currently has significant room and flexibility to utilize these financing sources. BASE CASE PROJECTED LIQUIDITY $ in millions 2Q08 3Q08 4Q08 2008 2009 2010 PROJECTED CASH FLOW Adjusted EBITDA $ 85 $ 87 $ 96 $ 326 $ 330 $ 381 Cash Taxes - - - - - - Cash Interest (77) (40) (78) (239) (257) (264) Net Capital Expenditures (18) (38) (38) (91) (200) (200) Change in Working Capital 18 10 (9) 33 (20) (1) CASH BEFORE FINANCINGS 9 19 (28) 28 (147) (84) Term Loan Amortization - - - - (9) (17) Revolver Draw / (Repayment) - - - - 60 101 Excess Cash Flow Prepayment - - - - - - NET CHANGE IN CASH $ 9 $ 19 $ (28) $ 28 $ (96) $ (0) Beginning Cash Balance 117 125 144 101 116 20 Ending Cash Balance 125 144 116 116 20 20 LIQUIDITY Cash $ 125 $ 144 $ 116 $ 116 $ 20 $ 20 Restricted Cash (25) (25) (25) (25) (25) (25) Revolver Available 280 280 280 280 220 119 Total 380 399 371 371 215 114 Source: NYLIM estimates. Should our base case come to fruition, Swift will have drawn $161 million on its revolver by the end of 2010 and likely breached covenants multiple times. If this were on course to occurring, we think it likely that lenders force a restructuring, given the dilution of value to the Term loan that would be caused by revolver draws and interest payments to noteholders. High Case. Our scenario analysis SCENARIO DRIVERS incorporates changes to revenue per 2Q08 3Q08 4Q08 2009 2010 loaded mile, number of loaded miles BASE CASE LTM Adjusted EBITDA $ 364 $ 341 $ 326 $ 330 $ 380 and the cost of diesel fuel. In our Trucking Revenue/Loaded Miles $ 1.62 $ 1.62 $ 1.63 $ 1.63 $ 1.65 high case, we project adjusted No. Loaded MilesIndex DOE Diesel Fuel 390 412 390 412 400 398 1,600 367 1,640 340 EBITDA of $349 million, $374 HIGH CASE million and $447 million in the LTM Adjusted EBITDA Miles $ 1.62 $ 1.63 $ 1.64 $ Trucking Revenue/Loaded $ 369 $ 355 $ 349 $ 374 1.65 $ $ 447 1.68 years-ended 2008 through 2010, No. Loaded Miles 400 400 410 1,640 1,700 respectively, which in turn, drives DOE Diesel Fuel Index 412 LOW CASE 395 385 340 300 improved liquidity and negligible LTM Adjusted EBITDA $ 356 $ 324 $ 294 $ 309 $ 352 revolver draw. While much Trucking Revenue/Loaded Miles $ 1.61 $ 1.61 $ 1.62 $ No. Loaded Miles 380 380 380 1.62 1,520 $ 1.64 1,600 improved over our base case, Swift DOE Diesel Fuel Index 425 450 412 400 400 is still projected to breach its net Source: NYLIM estimates. leverage and interest coverage covenants in fiscal 3Q08, given covenant tightening. 8
- 9. Low Case. Our low case results in adjusted EBITDA bottoming in 2008 at $294 million and rebounding to $352 million in fiscal 2010, though still below 2007 levels. The anemic EBITDA results in high revolver draws and minimal liquidity availability at the end of 2010. With 2009 adjusted EBITDA of $309 million and a $115 million revolver draw in the same year, a medium- term restructuring would be certain. INVESTMENT THESIS Swift Transportation is one of the largest truck carriers in the U.S., but one that is over-levered and currently operating in a challenging macro environment. Truckload carrier fundamentals will likely continue to be under pressure through 2008 as demand remains weak and fuel costs remain high. While we believe that Swift will weather the current trucking downturn, we think the Company will likely breach covenants and, ultimately, be financially restructured. In the event of a bankruptcy, Swift will de-lever and the Term loan will likely be partially equitized. We believe that the Term loan should be value-covered in a reorganization, with holders receiving post-petition interest through bankruptcy and market-priced debt and equity upon emergence (reflecting a par valuation). Post-restructuring, Swift should be well-positioned to benefit from a turnaround in the trucking industry, resulting in improved equity value. We recommend purchasing the Term loan on further fundamental deterioration, which should provide sufficient risk-adjusted return and downside value protection. Trucking is Cyclical Trucking Demand. The trucking industry is a cyclical one that ebbs and flows with the health of the economy. The strength of the industry is typically gauged by freight tonnage and pricing per loaded mile, and is highly correlated to the change in GDP (see graph). Truckload freight tonnage is published monthly by the American Truckers Associations (ATA), and historically, has been a leading indicator of economic recovery. During the economic recessions of 1991-1992 and 2001-2002, trucking tonnage fell in the periods leading up to these downturns (on average about two and a half years prior to a bottom) and began to 9
- 10. recover leading out of these periods; however, this was not the Avg LTM Tonnage Index case during the shorter slowdown 115.0 in 1995 when tonnage decreased for sometime thereafter. 114.5 114.0 Monthly ATA tonnage data shows the U.S. having entered a “freight 113.5 recession” in early 2006. Given 113.0 the recent improvement of ATA Index figures and the length of the 112.5 current freight downturn, most 112.0 industry analysts, as well as Swift M 5 5 N 5 M 6 6 N 6 M 7 7 N 7 M 8 M 5 5 Ja 5 M 6 6 Ja 6 M 7 7 Ja 7 8 -0 -0 -0 0 -0 l- 0 0 -0 0 -0 l- 0 0 -0 0 -0 l- 0 0 -0 0 -0 n- p- n- p- n- p- n- ay ov ay ov ay ov ar ar ar ar Ju Ju Ju Ja management, believe tonnage Se Se Se recovery may be underway (see Source: American Trucking Association graph). With ATA’s economists uncertain of the implications of recent Index figures and the possibility of a consumer-led recession, we believe that it is far from certain that a near-term freight recovery is at hand. While the exact timing of a turnaround in trucking demand is uncertain, it is inevitable, and we believe that Swift is well situated to leverage its position in the industry when it does occur. Tractor Supply. Driven by a number of factors that include fleet reductions, the sale of used tractors to Russia and South America, and truck company failures, many expect tractor supply to begin to rationalize in 2H08, which should result in firmer pricing. Pricing. Pricing in the trucking industry has been adversely affected by tractor pre-buys that occurred in 2006 and coincided with the decline in freight tonnage. As it pertains to Swift’s financial performance, the Company’s trucking revenue per loaded mile in 1Q08 was $1.61 as compared with $1.73 (adjusted for inflation) at the peak of the last cycle, which could imply substantial room for price increases when the trucking cycle turns; this is tempered by the unprecedented high cost of diesel fuel. Motivated and Qualified CEO By all accounts, Jerry Moyes’ acquisition of Swift Transportation was personal. In making the acquisition, Jerry Moyes assumed a $560 million loan, which is secured by his shares in Swift and personally guaranteed; Mr. Moyes also placed his Swift and IEL (a leasing company owned by Mr. Moyes) equity interests, valued at $910 million and $150 million, respectively, at risk. Jerry Moyes has a lot to lose should Swift file bankruptcy. As for Jerry Moyes’ ability to lead Swift through this challenging period, our due diligence calls concerning Jerry Moyes’ expertise yielded positive feedback. In conversations with senior executives at JB Hunt, Schneider, Marten Transport, Celadon and Old Dominion, most regarded Jerry Moyes as capable and competent. The criticism that we did hear primarily addressed Jerry’s historical propensity to acquire market share at the expense of pricing; feedback was mixed as to whether this has been the case recently. 10
- 11. Resilience in Bankruptcy Given our conversations with industry executives, we have concluded that, in the event of a bankruptcy filing, Swift will remain of strategic importance to its customer base. With 18,000 tractors and 50,000 trailers, Swift’s capacity is meaningful in the context of its customers’ shipping requirements; according to competitors, the transfer/reallocation of these requirements to Swift’s competitors could not occur quickly and would be extremely disruptive to any large customer. The fragmentation of the truckload trucking industry also plays to Swift’s advantage. With the top ten truckload carriers accounting for 3.2% of for-hire truckload industry revenues, customers such as Wal-Mart do not have many sophisticated carrier alternatives, though the impact of truck brokers such as C.H. Robinson is unclear. Should a restructuring ultimately lead to Jerry Moyes’ departure, competitors, with whom we have spoken, have noted that there is sufficient talent among competitors’ ranks to replace his leadership. Strong Recovery to Term Loan in Bankruptcy In the event of bankruptcy, the TERM LOAN RECOVERY Term loan should have strong $ in millions Normalized EBITDA value coverage across a wide EV/EBITDA 6.5x $ 100% $ 100% $ 100% $ 100% $ 100% $ 100% $ 100% 0% 400 375 350 325 300 275 250 range of sensitivities. At a Multiple 6.0x 100% 100% 100% 100% 100% 100% 93% 5.5x 100% 100% 100% 100% 100% 96% 85% price of 75.00, Swift is created 5.0x 100% 100% 100% 100% 97% 87% 77% at 3.0x trailing EBITDA 4.5x 100% 100% 100% 96% 87% 78% 68% Source: NYLIM estimates. through the Term loan. Given historical multiples and current comps, we value Swift at a 5.0x EV/EBITDA multiple, providing material value subordination. We consider Swift’s normalized EBITDA (the EBITDA around which Swift would be restructured) to be approximately $350 million; the Term loan is first impaired at a normalized EBITDA below $325 million, which represents significant permanent value deterioration from today. We have assumed that bank lenders force a restructuring of the Company’s balance sheet before the revolver is drawn, which would likely occur following multiple covenant breaches. 11
- 12. RECOVERY ANALYSIS $ in millions RECOVERY TO TERM LOAN Normalized EBITDA 400 375 350 325 300 275 250 Recovery 100% 100% 100% 100% 97% 87% 77% RECOVERY WORKSHEET Normalized EBITDA $ 400 $ 375 $ 350 $ 325 $ 300 $ 275 $ 250 Multiple 5.0x 5.0x 5.0x 5.0x 5.0x 5.0x 5.0x EV 2,000 1,875 1,750 1,625 1,500 1,375 1,250 Cash Build + A/R Re-Secur. 264 214 200 200 200 200 200 Distributable Value 2,264 2,089 1,950 1,825 1,700 1,575 1,450 DIP Financing 200 200 211 236 261 286 311 Value to Pre-Petition Bank 2,064 1,889 1,739 1,589 1,439 1,289 1,139 Pre-Petition Bank Claim 1,486 1,486 1,486 1,486 1,486 1,486 1,486 Recovery to Bank Debt 100% 100% 100% 100% 97% 87% 77% Value of Equity to Mgmt 40 38 35 33 30 28 25 Value to Notes 538 366 218 71 - - - 2nd Priority Notes Claim 835 835 835 835 835 835 835 Recovery to Priority Notes 64% 44% 26% 8% 0% 0% 0% * Assumes restructured leverage of 3.0x. Source: NYLIM estimates. INVESTMENT RECOMMENDATION Term Loan Given our expectation that the U.S. macro environment will likely get worse before it improves, we recommend scaling into Swift’s Term loan over time, at 75.00 or below, or YTM of 13.8% and greater (which assumes the 3-month LIBOR forward curve). Assuming an increase in pricing of at least 150bps in early-2009, and an exit at par at the end of 2010, we calculate an IRR of 21%. The Term loan re-pricing that we expect is a result of a $ in millions TERM LOAN IRR Normalized EBITDA covenant breach that we 0% $ 400 $ 375 $ 350 $ 325 $ 300 $ 275 $ 250 project will occur in 3Q08. Entry 80.00 Price 75.00 17.7% 20.9% 17.7% 20.9% 17.7% 20.9% 17.7% 20.9% 16.5% 19.6% 12.4% 15.5% 8.1% 11.1% The net leverage ratio 70.00 24.4% 24.4% 24.4% 24.4% 23.1% 18.9% 14.3% 65.00 28.3% 28.3% 28.3% 28.3% 27.0% 22.6% 17.9% delineated in the credit 60.00 32.6% 32.6% 32.6% 32.6% 31.3% 26.8% 22.0% agreement ratchets down to * Assumes par recovery at end of 2010 Source: NYLIM estimates. 6.15x by the end of FY08 from 6.95x in FY07, and further declines to 5.05x and 4.40x in 2009 and 2010, respectively. If we progress into a consumer-led recession, we anticipate further downside for Swift and its securities in 2008; should the trucking cycle turn faster than anticipated and save Swift from multiple covenant breaches, we would then expect the Term loan to move to par faster than currently projected. 12
- 13. Strengths · Leading U.S. market position in truckload freight with national footprint · Diversified blue-chip customer base · Demonstrated track record of growth and profitability · Experienced leadership management team as owners · Positive long-term industry fundamentals · Flexibility of capital expenditure programs · Substantial liquidity provided by cash balance and undrawn revolver Weaknesses · Overleveraged going into weaker operating and economic cycle · Leverage covenant tightens with each quarter – could cause violation · Industry supply/demand imbalance will limit price improvement in near-term · Company margins below industry average. Margins will remain under pressure with high fuel costs, labor inflation and maintenance/EPA requirements. · High capital expenditure requirements to maintain fleet age 13
- 14. APPENDIX MANAGEMENT Jerry Moyes - Chairman of the Board, President and CEO Jerry Moyes began hauling steel from Arizona to Los Angeles ports with one truck in 1966, forming a partnership with a steel importer called Common Market Distribution Corp., which he later merged with a company he founded, Swift Transportation. In 1986, he was named Chairman of the Board, President, and CEO of the company. From 1986, Mr. Moyes has helped grow Swift from a single truck to a leading company in its industry. Mr. Moyes has also been involved in a number of other organizations, serving as vice president of the American Trucking Associations and as president of the Arizona Motor Transport Association. He currently serves as a board member of the Truckload Carriers Association, a Director for the Greater Phoenix Economic Council, and a member of the Center for Entrepreneurship at Brigham Young Univ. Ginnie Henkels, EVP and CFO Ginnie Henkels has served as Executive Vice President and Chief Financial Officer since May of 2008. Ginnie joined Swift in 2004 and was the Assistant Treasurer and Investor Relations Officer prior to her current role. Before joining Swift, Ginnie served in various finance and accounting leadership roles for Honeywell during a 12-year tenure. During this time she served as the Director of Financial, Planning and Reporting for its Industrial Control business segment, the Finance Manager of the Building Controls segment in the United Kingdom, and the Manager of External Corporate Reporting, among other roles. Kenneth C. Runnels - EVP, Eastern Region Ken Runnels has served as Executive Vice President, Eastern Region since December 2007. His current responsibilities include overseeing all the Eastern terminals. Since 1983 he has held a myriad of positions including: log audit, forklift operator, light mechanic, dispatcher, Terminal Manager at several locations, Regional Vice President, and Vice President of Fleet Operations. Rodney Sartor - EVP, Western Region Rodney Sartor served as an Executive Vice President from May 1990 until November 2005. Mr. Sartor joined Swift in May 1979. He served as Director of Operations from May 1982 until August 1988 and as Regional Vice President from August 1988 until May 1990. Richard Stocking - EVP, Central Region Richard Stocking has served as Executive Vice President of Sales of Swift Transportation Co., Inc. since April 2005. Mr. Stocking previously served as Regional Vice President of the Central Region and in various operations and sales management positions over the last 15 years. Mark Young - EVP, Intermodal Mark Young has served as Executive Vice President, Intermodal Division of Swift Transportation Co., Inc. since November 2005. From 2004 to 2005 Mr. Young served as Vice President of Intermodal. Prior to joining Swift, Mr. Young worked in Transportation Logistics with Hub Group for five years. From 1990 to 1998, Mr. Young was employed by CSX Intermodal. 14