SlideShare uma empresa Scribd logo
1 de 37
The language of graphs
Mathematics. 1st Year Secondary Education
You know…
 Cartesian coordinate system
x-axis: horizontal
y-axis: vertical
Origin: point (o,o)
 To plot points on a graph
P (3,5): “ordered pair”
(3 units to the right, and 5 units up)
 To plot the graph of a function
y = 2x + 1
“You have to be able to understand the
qualitative meaning
of a graph”
“Let’s practice together…”
Hamilton Alonso Vettel
Podiums
World Championships
Podiums
WorldChampionships
A
H
V
“Who has more Podiums?”
“Who has won more World Championships?”
H: Hamilton A: Alonso V: Vettel
Hamilton Alonso Vettel
Podiums
World Championships
Podiums
WorldChampionships
A
H
V
“Who has more Podiums?” ALONSO
“Who has won more World Championships?” VETTEL
H: Hamilton A: Alonso V: Vettel
Hamilton Alonso Vettel
Podiums 56 95 64
World Championships 1 2 4
Podiums
WorldChampionships
A
H
V
“Who has more Podiums?” ALONSO
“Who has won more World Championships?” VETTEL
H: Hamilton A: Alonso V: Vettel
1. The Bus Stop Queue
Point 7 represents…
1. The Bus Stop Queue
Point 7 represents Gavin
“He is the shortest and youngest person”
7
1. The Bus Stop Queue
Point 6 represents…
7
1. The Bus Stop Queue
Point 6 represents Cathy
“She is taller than Gavin but shorter than the rest of
the people”
7
6
1. The Bus Stop Queue
Points 2 and 5 represent…
7
6
1. The Bus Stop Queue
Points 2 and 5 represent Alice or Errol
“They are the tallest”
Point 2 represents…
7
6
1. The Bus Stop Queue
Points 2 and 5 represent Alice or Errol
“They are the tallest”
Point 2 represents Alice
“She is one of the tallest and older than Errol”
So point 5 represents…
7
62
1. The Bus Stop Queue
Points 2 and 5 represent Alice or Errol
“They are the tallest”
Point 2 represents Alice
“She is one of the tallest and older than Errol”
So point 5 represents Errol
“He is one of the tallest and younger than Alice”
7
62 5
1. The Bus Stop Queue
Point 3 represents…
7
62 5
1. The Bus Stop Queue
Point 3 represents Freda
“She is shorter than Alice and Errol but taller than
the rest of the people”
7
62 25
1. The Bus Stop Queue
Points 1 and 4 represent…
7
62 5 2
1. The Bus Stop Queue
Points 1 and 4 represent Brendaor Dennis
“They have the same height”
Point 1 represents…
7
62 5 2
1. The Bus Stop Queue
Points 1 and 4 represent Brenda or Dennis
“They have the same height”
Point 1 represents Dennis
“He is older than Brenda”
So point 4 represents…
7
62 5 21
1. The Bus Stop Queue
Points 1 and 4 represent Brenda or Dennis
“They have the same height”
Point 1 represents Dennis
“He is older than Brenda”
So point 4 represents Brenda
“She is younger than Dennis”
7
62 5 214
1. The Bus Stop Queue
7
62 5 214
2. Planes
A (Dusty) B (Siddeley)
2. Planes
A (Dusty) B (Siddeley)
 Airplane A is older than airplane B
2. Planes
A (Dusty) B (Siddeley)
 Airplane A is older than airplane B
 Airplane B is more expensive than airplane A
2. Planes
A (Dusty) B (Siddeley)
 Airplane A is older than airplane B
 Airplane B is more expensive tan airplane A
 The older airplane is cheaper
2. Planes
A (Dusty) B (Siddeley)
 Airplane A is older than airplane B
 Airplane B is more expensive tan airplane A
 The older airplane is cheaper
2. Planes
A (Dusty) B (Siddeley)
 Airplane A is older than airplane B
 Airplane B is more expensive tan airplane A
 The older airplane is cheaper
 The faster airplane is smaller
2. Planes
A (Dusty) B (Siddeley)
 Airplane A is older than airplane B
 Airplane B is more expensive tan airplane A
 The older airplane is cheaper
 The faster airplane is smaller
2. Planes
A (Dusty) B (Siddeley)
 Airplane A is older than airplane B
 Airplane B is more expensive tan airplane A
 The older airplane is cheaper
 The faster airplane is smaller
 The larger airplane is older
2. Planes
A (Dusty) B (Siddeley)
 Airplane A is older than airplane B
 Airplane B is more expensive tan airplane A
 The older airplane is cheaper
 The faster airplane is smaller
 The larger airplane is older
2. Planes
A (Dusty) B (Siddeley)
 Airplane A is older than airplane B
 Airplane B is more expensive tan airplane A
 The older airplane is cheaper
 The faster airplane is smaller
 The larger airplane is older
 The cheaper airplane carries fewer passengers
2. Planes
A (Dusty) B (Siddeley)
 Airplane A is older than airplane B
 Airplane B is more expensive tan airplane A
 The older airplane is cheaper
 The faster airplane is smaller
 The larger airplane is older
 The cheaper airplane carries fewer passengers
2. Planes
A (Dusty) B (Siddeley)
3. Which Graph?
The 100 metres race.
The men's world record is
9.58 seconds, set by Usain Bolt
0,00
2,00
4,00
6,00
8,00
10,00
12,00
0 50 100 150SPEED
DISTANCE
GRAPH 3
0
2
4
6
8
10
12
0 50 100 150
SPEED
DISTANCE
GRAPH 1
0
2
4
6
8
10
12
0 50 100 150
SPEED
DISTANCE
GRAPH 2
0,00
2,00
4,00
6,00
8,00
10,00
12,00
0 20 40 60 80 100 120 140
SPEED
DISTANCE
GRAPH 3
3. Which Graph?
To sum up…
Graphsare very useful to draw conclusionsfrom different set of data
and to find if there is a correlation between them.
http://www.nytimes.com/interactive/2012/08/05/sports/olympics/the-100-meter-dash-one-race-every-medalist-ever.html?_r=0
The language of graphs
Mathematics. 1st Year Secondary Education

Mais conteúdo relacionado

Mais de ROCIO YUSTE

CLIL. Portfolio.
CLIL. Portfolio.CLIL. Portfolio.
CLIL. Portfolio.ROCIO YUSTE
 
Skills. Portfolio.
Skills. Portfolio.Skills. Portfolio.
Skills. Portfolio.ROCIO YUSTE
 
Learning Unit. The Universe and the Solar System. First Year. Presentation
Learning Unit. The Universe and the Solar System. First Year. PresentationLearning Unit. The Universe and the Solar System. First Year. Presentation
Learning Unit. The Universe and the Solar System. First Year. PresentationROCIO YUSTE
 
Learning Unit. The Universe and the Solar System. First Year
Learning Unit. The Universe and the Solar System. First YearLearning Unit. The Universe and the Solar System. First Year
Learning Unit. The Universe and the Solar System. First YearROCIO YUSTE
 
Natural Science. Sexual reproduction in plants - Presentation
Natural Science. Sexual reproduction in plants - PresentationNatural Science. Sexual reproduction in plants - Presentation
Natural Science. Sexual reproduction in plants - PresentationROCIO YUSTE
 
Statistics - Presentation
Statistics - PresentationStatistics - Presentation
Statistics - PresentationROCIO YUSTE
 
Diseño Industrial de Sillas de Ruedas Modulares - Presentación
Diseño Industrial de Sillas de Ruedas Modulares - PresentaciónDiseño Industrial de Sillas de Ruedas Modulares - Presentación
Diseño Industrial de Sillas de Ruedas Modulares - PresentaciónROCIO YUSTE
 
Diseño Industrial de Sillas de Ruedas Modulares
Diseño Industrial de Sillas de Ruedas ModularesDiseño Industrial de Sillas de Ruedas Modulares
Diseño Industrial de Sillas de Ruedas ModularesROCIO YUSTE
 

Mais de ROCIO YUSTE (8)

CLIL. Portfolio.
CLIL. Portfolio.CLIL. Portfolio.
CLIL. Portfolio.
 
Skills. Portfolio.
Skills. Portfolio.Skills. Portfolio.
Skills. Portfolio.
 
Learning Unit. The Universe and the Solar System. First Year. Presentation
Learning Unit. The Universe and the Solar System. First Year. PresentationLearning Unit. The Universe and the Solar System. First Year. Presentation
Learning Unit. The Universe and the Solar System. First Year. Presentation
 
Learning Unit. The Universe and the Solar System. First Year
Learning Unit. The Universe and the Solar System. First YearLearning Unit. The Universe and the Solar System. First Year
Learning Unit. The Universe and the Solar System. First Year
 
Natural Science. Sexual reproduction in plants - Presentation
Natural Science. Sexual reproduction in plants - PresentationNatural Science. Sexual reproduction in plants - Presentation
Natural Science. Sexual reproduction in plants - Presentation
 
Statistics - Presentation
Statistics - PresentationStatistics - Presentation
Statistics - Presentation
 
Diseño Industrial de Sillas de Ruedas Modulares - Presentación
Diseño Industrial de Sillas de Ruedas Modulares - PresentaciónDiseño Industrial de Sillas de Ruedas Modulares - Presentación
Diseño Industrial de Sillas de Ruedas Modulares - Presentación
 
Diseño Industrial de Sillas de Ruedas Modulares
Diseño Industrial de Sillas de Ruedas ModularesDiseño Industrial de Sillas de Ruedas Modulares
Diseño Industrial de Sillas de Ruedas Modulares
 

Último

SOCIAL AND HISTORICAL CONTEXT - LFTVD.pptx
SOCIAL AND HISTORICAL CONTEXT - LFTVD.pptxSOCIAL AND HISTORICAL CONTEXT - LFTVD.pptx
SOCIAL AND HISTORICAL CONTEXT - LFTVD.pptxiammrhaywood
 
Making and Justifying Mathematical Decisions.pdf
Making and Justifying Mathematical Decisions.pdfMaking and Justifying Mathematical Decisions.pdf
Making and Justifying Mathematical Decisions.pdfChris Hunter
 
Ecological Succession. ( ECOSYSTEM, B. Pharmacy, 1st Year, Sem-II, Environmen...
Ecological Succession. ( ECOSYSTEM, B. Pharmacy, 1st Year, Sem-II, Environmen...Ecological Succession. ( ECOSYSTEM, B. Pharmacy, 1st Year, Sem-II, Environmen...
Ecological Succession. ( ECOSYSTEM, B. Pharmacy, 1st Year, Sem-II, Environmen...Shubhangi Sonawane
 
Measures of Central Tendency: Mean, Median and Mode
Measures of Central Tendency: Mean, Median and ModeMeasures of Central Tendency: Mean, Median and Mode
Measures of Central Tendency: Mean, Median and ModeThiyagu K
 
Seal of Good Local Governance (SGLG) 2024Final.pptx
Seal of Good Local Governance (SGLG) 2024Final.pptxSeal of Good Local Governance (SGLG) 2024Final.pptx
Seal of Good Local Governance (SGLG) 2024Final.pptxnegromaestrong
 
Class 11th Physics NEET formula sheet pdf
Class 11th Physics NEET formula sheet pdfClass 11th Physics NEET formula sheet pdf
Class 11th Physics NEET formula sheet pdfAyushMahapatra5
 
Advanced Views - Calendar View in Odoo 17
Advanced Views - Calendar View in Odoo 17Advanced Views - Calendar View in Odoo 17
Advanced Views - Calendar View in Odoo 17Celine George
 
Application orientated numerical on hev.ppt
Application orientated numerical on hev.pptApplication orientated numerical on hev.ppt
Application orientated numerical on hev.pptRamjanShidvankar
 
Gardella_PRCampaignConclusion Pitch Letter
Gardella_PRCampaignConclusion Pitch LetterGardella_PRCampaignConclusion Pitch Letter
Gardella_PRCampaignConclusion Pitch LetterMateoGardella
 
Z Score,T Score, Percential Rank and Box Plot Graph
Z Score,T Score, Percential Rank and Box Plot GraphZ Score,T Score, Percential Rank and Box Plot Graph
Z Score,T Score, Percential Rank and Box Plot GraphThiyagu K
 
Activity 01 - Artificial Culture (1).pdf
Activity 01 - Artificial Culture (1).pdfActivity 01 - Artificial Culture (1).pdf
Activity 01 - Artificial Culture (1).pdfciinovamais
 
psychiatric nursing HISTORY COLLECTION .docx
psychiatric  nursing HISTORY  COLLECTION  .docxpsychiatric  nursing HISTORY  COLLECTION  .docx
psychiatric nursing HISTORY COLLECTION .docxPoojaSen20
 
This PowerPoint helps students to consider the concept of infinity.
This PowerPoint helps students to consider the concept of infinity.This PowerPoint helps students to consider the concept of infinity.
This PowerPoint helps students to consider the concept of infinity.christianmathematics
 
APM Welcome, APM North West Network Conference, Synergies Across Sectors
APM Welcome, APM North West Network Conference, Synergies Across SectorsAPM Welcome, APM North West Network Conference, Synergies Across Sectors
APM Welcome, APM North West Network Conference, Synergies Across SectorsAssociation for Project Management
 
Measures of Dispersion and Variability: Range, QD, AD and SD
Measures of Dispersion and Variability: Range, QD, AD and SDMeasures of Dispersion and Variability: Range, QD, AD and SD
Measures of Dispersion and Variability: Range, QD, AD and SDThiyagu K
 
ICT Role in 21st Century Education & its Challenges.pptx
ICT Role in 21st Century Education & its Challenges.pptxICT Role in 21st Century Education & its Challenges.pptx
ICT Role in 21st Century Education & its Challenges.pptxAreebaZafar22
 

Último (20)

SOCIAL AND HISTORICAL CONTEXT - LFTVD.pptx
SOCIAL AND HISTORICAL CONTEXT - LFTVD.pptxSOCIAL AND HISTORICAL CONTEXT - LFTVD.pptx
SOCIAL AND HISTORICAL CONTEXT - LFTVD.pptx
 
Making and Justifying Mathematical Decisions.pdf
Making and Justifying Mathematical Decisions.pdfMaking and Justifying Mathematical Decisions.pdf
Making and Justifying Mathematical Decisions.pdf
 
Ecological Succession. ( ECOSYSTEM, B. Pharmacy, 1st Year, Sem-II, Environmen...
Ecological Succession. ( ECOSYSTEM, B. Pharmacy, 1st Year, Sem-II, Environmen...Ecological Succession. ( ECOSYSTEM, B. Pharmacy, 1st Year, Sem-II, Environmen...
Ecological Succession. ( ECOSYSTEM, B. Pharmacy, 1st Year, Sem-II, Environmen...
 
Measures of Central Tendency: Mean, Median and Mode
Measures of Central Tendency: Mean, Median and ModeMeasures of Central Tendency: Mean, Median and Mode
Measures of Central Tendency: Mean, Median and Mode
 
Seal of Good Local Governance (SGLG) 2024Final.pptx
Seal of Good Local Governance (SGLG) 2024Final.pptxSeal of Good Local Governance (SGLG) 2024Final.pptx
Seal of Good Local Governance (SGLG) 2024Final.pptx
 
Class 11th Physics NEET formula sheet pdf
Class 11th Physics NEET formula sheet pdfClass 11th Physics NEET formula sheet pdf
Class 11th Physics NEET formula sheet pdf
 
Advanced Views - Calendar View in Odoo 17
Advanced Views - Calendar View in Odoo 17Advanced Views - Calendar View in Odoo 17
Advanced Views - Calendar View in Odoo 17
 
Application orientated numerical on hev.ppt
Application orientated numerical on hev.pptApplication orientated numerical on hev.ppt
Application orientated numerical on hev.ppt
 
Gardella_PRCampaignConclusion Pitch Letter
Gardella_PRCampaignConclusion Pitch LetterGardella_PRCampaignConclusion Pitch Letter
Gardella_PRCampaignConclusion Pitch Letter
 
Z Score,T Score, Percential Rank and Box Plot Graph
Z Score,T Score, Percential Rank and Box Plot GraphZ Score,T Score, Percential Rank and Box Plot Graph
Z Score,T Score, Percential Rank and Box Plot Graph
 
Código Creativo y Arte de Software | Unidad 1
Código Creativo y Arte de Software | Unidad 1Código Creativo y Arte de Software | Unidad 1
Código Creativo y Arte de Software | Unidad 1
 
Activity 01 - Artificial Culture (1).pdf
Activity 01 - Artificial Culture (1).pdfActivity 01 - Artificial Culture (1).pdf
Activity 01 - Artificial Culture (1).pdf
 
psychiatric nursing HISTORY COLLECTION .docx
psychiatric  nursing HISTORY  COLLECTION  .docxpsychiatric  nursing HISTORY  COLLECTION  .docx
psychiatric nursing HISTORY COLLECTION .docx
 
Mehran University Newsletter Vol-X, Issue-I, 2024
Mehran University Newsletter Vol-X, Issue-I, 2024Mehran University Newsletter Vol-X, Issue-I, 2024
Mehran University Newsletter Vol-X, Issue-I, 2024
 
INDIA QUIZ 2024 RLAC DELHI UNIVERSITY.pptx
INDIA QUIZ 2024 RLAC DELHI UNIVERSITY.pptxINDIA QUIZ 2024 RLAC DELHI UNIVERSITY.pptx
INDIA QUIZ 2024 RLAC DELHI UNIVERSITY.pptx
 
This PowerPoint helps students to consider the concept of infinity.
This PowerPoint helps students to consider the concept of infinity.This PowerPoint helps students to consider the concept of infinity.
This PowerPoint helps students to consider the concept of infinity.
 
APM Welcome, APM North West Network Conference, Synergies Across Sectors
APM Welcome, APM North West Network Conference, Synergies Across SectorsAPM Welcome, APM North West Network Conference, Synergies Across Sectors
APM Welcome, APM North West Network Conference, Synergies Across Sectors
 
Measures of Dispersion and Variability: Range, QD, AD and SD
Measures of Dispersion and Variability: Range, QD, AD and SDMeasures of Dispersion and Variability: Range, QD, AD and SD
Measures of Dispersion and Variability: Range, QD, AD and SD
 
Advance Mobile Application Development class 07
Advance Mobile Application Development class 07Advance Mobile Application Development class 07
Advance Mobile Application Development class 07
 
ICT Role in 21st Century Education & its Challenges.pptx
ICT Role in 21st Century Education & its Challenges.pptxICT Role in 21st Century Education & its Challenges.pptx
ICT Role in 21st Century Education & its Challenges.pptx
 

The language of Graphs - Presentation

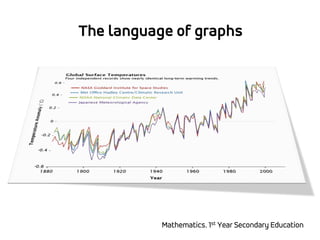
  • 1. The language of graphs Mathematics. 1st Year Secondary Education
  • 2. You know…  Cartesian coordinate system x-axis: horizontal y-axis: vertical Origin: point (o,o)  To plot points on a graph P (3,5): “ordered pair” (3 units to the right, and 5 units up)  To plot the graph of a function y = 2x + 1
  • 3. “You have to be able to understand the qualitative meaning of a graph” “Let’s practice together…”
  • 4. Hamilton Alonso Vettel Podiums World Championships Podiums WorldChampionships A H V “Who has more Podiums?” “Who has won more World Championships?” H: Hamilton A: Alonso V: Vettel
  • 5. Hamilton Alonso Vettel Podiums World Championships Podiums WorldChampionships A H V “Who has more Podiums?” ALONSO “Who has won more World Championships?” VETTEL H: Hamilton A: Alonso V: Vettel
  • 6. Hamilton Alonso Vettel Podiums 56 95 64 World Championships 1 2 4 Podiums WorldChampionships A H V “Who has more Podiums?” ALONSO “Who has won more World Championships?” VETTEL H: Hamilton A: Alonso V: Vettel
  • 7. 1. The Bus Stop Queue Point 7 represents…
  • 8. 1. The Bus Stop Queue Point 7 represents Gavin “He is the shortest and youngest person” 7
  • 9. 1. The Bus Stop Queue Point 6 represents… 7
  • 10. 1. The Bus Stop Queue Point 6 represents Cathy “She is taller than Gavin but shorter than the rest of the people” 7 6
  • 11. 1. The Bus Stop Queue Points 2 and 5 represent… 7 6
  • 12. 1. The Bus Stop Queue Points 2 and 5 represent Alice or Errol “They are the tallest” Point 2 represents… 7 6
  • 13. 1. The Bus Stop Queue Points 2 and 5 represent Alice or Errol “They are the tallest” Point 2 represents Alice “She is one of the tallest and older than Errol” So point 5 represents… 7 62
  • 14. 1. The Bus Stop Queue Points 2 and 5 represent Alice or Errol “They are the tallest” Point 2 represents Alice “She is one of the tallest and older than Errol” So point 5 represents Errol “He is one of the tallest and younger than Alice” 7 62 5
  • 15. 1. The Bus Stop Queue Point 3 represents… 7 62 5
  • 16. 1. The Bus Stop Queue Point 3 represents Freda “She is shorter than Alice and Errol but taller than the rest of the people” 7 62 25
  • 17. 1. The Bus Stop Queue Points 1 and 4 represent… 7 62 5 2
  • 18. 1. The Bus Stop Queue Points 1 and 4 represent Brendaor Dennis “They have the same height” Point 1 represents… 7 62 5 2
  • 19. 1. The Bus Stop Queue Points 1 and 4 represent Brenda or Dennis “They have the same height” Point 1 represents Dennis “He is older than Brenda” So point 4 represents… 7 62 5 21
  • 20. 1. The Bus Stop Queue Points 1 and 4 represent Brenda or Dennis “They have the same height” Point 1 represents Dennis “He is older than Brenda” So point 4 represents Brenda “She is younger than Dennis” 7 62 5 214
  • 21. 1. The Bus Stop Queue 7 62 5 214
  • 22. 2. Planes A (Dusty) B (Siddeley)
  • 23. 2. Planes A (Dusty) B (Siddeley)  Airplane A is older than airplane B
  • 24. 2. Planes A (Dusty) B (Siddeley)  Airplane A is older than airplane B  Airplane B is more expensive than airplane A
  • 25. 2. Planes A (Dusty) B (Siddeley)  Airplane A is older than airplane B  Airplane B is more expensive tan airplane A  The older airplane is cheaper
  • 26. 2. Planes A (Dusty) B (Siddeley)  Airplane A is older than airplane B  Airplane B is more expensive tan airplane A  The older airplane is cheaper
  • 27. 2. Planes A (Dusty) B (Siddeley)  Airplane A is older than airplane B  Airplane B is more expensive tan airplane A  The older airplane is cheaper  The faster airplane is smaller
  • 28. 2. Planes A (Dusty) B (Siddeley)  Airplane A is older than airplane B  Airplane B is more expensive tan airplane A  The older airplane is cheaper  The faster airplane is smaller
  • 29. 2. Planes A (Dusty) B (Siddeley)  Airplane A is older than airplane B  Airplane B is more expensive tan airplane A  The older airplane is cheaper  The faster airplane is smaller  The larger airplane is older
  • 30. 2. Planes A (Dusty) B (Siddeley)  Airplane A is older than airplane B  Airplane B is more expensive tan airplane A  The older airplane is cheaper  The faster airplane is smaller  The larger airplane is older
  • 31. 2. Planes A (Dusty) B (Siddeley)  Airplane A is older than airplane B  Airplane B is more expensive tan airplane A  The older airplane is cheaper  The faster airplane is smaller  The larger airplane is older  The cheaper airplane carries fewer passengers
  • 32. 2. Planes A (Dusty) B (Siddeley)  Airplane A is older than airplane B  Airplane B is more expensive tan airplane A  The older airplane is cheaper  The faster airplane is smaller  The larger airplane is older  The cheaper airplane carries fewer passengers
  • 33. 2. Planes A (Dusty) B (Siddeley)
  • 34. 3. Which Graph? The 100 metres race. The men's world record is 9.58 seconds, set by Usain Bolt 0,00 2,00 4,00 6,00 8,00 10,00 12,00 0 50 100 150SPEED DISTANCE GRAPH 3 0 2 4 6 8 10 12 0 50 100 150 SPEED DISTANCE GRAPH 1 0 2 4 6 8 10 12 0 50 100 150 SPEED DISTANCE GRAPH 2
  • 35. 0,00 2,00 4,00 6,00 8,00 10,00 12,00 0 20 40 60 80 100 120 140 SPEED DISTANCE GRAPH 3 3. Which Graph?
  • 36. To sum up… Graphsare very useful to draw conclusionsfrom different set of data and to find if there is a correlation between them. http://www.nytimes.com/interactive/2012/08/05/sports/olympics/the-100-meter-dash-one-race-every-medalist-ever.html?_r=0
  • 37. The language of graphs Mathematics. 1st Year Secondary Education