SlideShare a Scribd company logo
1 of 20
Phylogenetic Analysis of Molluscan Mitochondrial LSU rDNA
Sequences and Secondary Structures
Charles Lydeard,* Wallace E. Holznagel,* Murray N. Schnare,† and Robin R. Gutell‡
*Biodiversity and Systematics, Department of Biological Sciences, University of Alabama, Box 870345, Tuscaloosa, Alabama 35487;
†Department of Biochemistry and Molecular Biology, Dalhousie University, Halifax, Nova Scotia B3H 4H7, Canada; and
‡Institute for Cellular and Molecular Biology, University of Texas at Austin, 2500 Speedway, Austin, Texas 78712-1095
Received March 30, 1999; revised July 26, 1999
Mollusks are an extraordinarily diverse group of
animals with an estimated 200,000 species, second only
to the phylum Arthropoda. We conducted a compara-
tive analysis of complete mitochondrial ribosomal large
subunit sequences (LSU) of a chiton, two bivalves, six
gastropods, and a cephalopod. In addition, we deter-
mined secondary structure models for each of them.
Comparative analyses of nucleotide variation revealed
substantial length variation among the taxa, with
stylommatophoran gastropods possessing the shortest
lengths. Phylogenetic analyses of the nucleotide se-
quence data supported the monophyly of Albinaria,
Euhadra herklotsi ؉ Cepaea nemoralis, Stylommato-
phora, Cerithioidea, and when only transversions are
included, the Bivalvia. The phylogenetic limits of the
mitochondrial LSU rRNA gene within mollusks appear
to be up to 400 million years, although this estimate
will have to be tested further with additional taxa. Our
most novel finding was the discovery of phylogenetic
signal in the secondary structure of rRNA of mollusks.
The absence of entire stem/loop structures in Domains
II, III, and V can be viewed as three shared derived
characters uniting the stylommatophoran gastropods.
The absence of the aforementioned stem/loop struc-
ture explains much of the observed length variation of
the mitochondrial LSU rRNA found within mollusks.
The distribution of these unique secondary structure
characters within mollusks should be examined. ௠ 2000
Academic Press
Key Words: LSU mitochondrial DNA; 16S mitochon-
drial DNA; 23S-like rRNA; ribosomal RNA secondary
structure; mollusks; bivalves; chiton; gastropods; pul-
monates; molecular phylogeny; gene utility
INTRODUCTION
Molecular systematics and molecular evolution can
be reciprocally illuminating. Since molecular evolution-
ary studies are conducted in a phylogenetic context,
tremendous opportunity exists for improving the mod-
els and assumptions used for phylogenetic reconstruc-
tion. One important challenge is to distinguish phyloge-
netically informative changes from potential ‘‘noise’’
generated from multiple substitutions that may accrue
at a single site. Conservative sites and changes are
better indicators of phylogenetic history because they
are less likely to experience parallel and back muta-
tions. For example, for deep phylogenetic questions, it
is often best to downweight or exclude transitions in the
third codon position of a protein-encoding gene (e.g.,
Lydeard and Roe, 1997).
Knowledge of nucleotide substitution patterns helps
investigators make objective decisions regarding weight-
ing to increase the likelihood of recovering an accurate
phylogeny. Indeed, justification for a variety of com-
monly employed weighting strategies was demon-
strated in an analysis of linked mitochondrial genes in
the mammalian order Artiodactyla (Miyamoto et al.,
1994). In addition to their value for understanding
nucleotide substitution patterns, sequence alignments
are crucial for phylogenetic reconstruction because
positional homology is assumed to be accurate prior to
estimating phylogeny. There are many ways to align a
nucleotide sequence data matrix: manual (visual) align-
ment, a multiple sequence alignment software package
like CLUSTAL W or MALIGN (Thompson et al., 1994;
Wheeler and Gladstein, 1991; respectively), and utiliz-
ing information from the structure of the gene. Many
studies have highlighted the importance of alignment
on phylogenetic reconstruction (e.g., Gatesy et al., 1993;
Kjer, 1995; Hickson et al., 1996). Indeed, the use of the
ribosomal RNA (rRNA) secondary structure informa-
tion in combination with a computer-assisted optimal-
ity approach resulted in a marked increase in the
number of alignments that recovered a topology congru-
ent with a well-corroborated morphological hypothesis
in comparison to those alignments based on the com-
puter-assisted approach alone (Titus and Frost, 1996).
Ribosomal RNA genes have received considerable
attention from biologists. Because rRNAs are involved
in the synthesis of proteins and are present in all life
forms (Woese, 1987; Woese et al., 1990), it was rational-
Molecular Phylogenetics and Evolution
Vol. 15, No. 1, April, pp. 83–102, 2000
doi:10.1006/mpev.1999.0719, available online at http://www.idealibrary.com on
83
1055-7903/00 $35.00
Copyright ௠ 2000 by Academic Press
All rights of reproduction in any form reserved.
ized that they will have an imprint of their evolutionary
history encoded in their sequence. The ribosomal small
subunit (SSU) contains the 16S rRNA in prokaryotes,
the 18S rRNA in the eukaryotic cytoplasm, and the 12S
rRNA in animal mitochondria. The ribosomal large
subunit (LSU) contains the 23S rRNA in prokaryotes,
the 26S–28S rRNA gene in the eukaryotic cytoplasm,
and the 16S rRNA in animal mitochondria.
Ribosomal RNA sequences fold into complex second-
ary structures based largely on intramolecular base
pairing. Experimental methods have elucidated some
of the rRNA secondary and tertiary structure (Noller,
1984, 1991; Zimmermann and Dahlberg, 1996). How-
ever, the vast majority of the rRNA secondary structure
models have been determined with comparative se-
quence analyses (Woese et al., 1980; Noller et al., 1981;
Gutell et al., 1994; Gutell, 1996). The comparative
approach was first used to establish the so-called
cloverleaf configuration of tRNA and is based on posi-
tional covariance in an alignment of RNA sequences
(Gutell et al., 1994). Two positions covary when nucleo-
tide substitutions at one column in a sequence align-
ment are correlated with a similar pattern of substitu-
tions at another position. The earliest models of rRNA
secondary structure have been improved over the years
(see Gutell et al., 1993; Gutell, 1994) and additional
services are provided by the Ribosomal Database Project
(Maidak et al., 1997).
Mitochondrial (mt) rRNA genes have attracted a
great deal of attention from molecular systematists
(reviews by Mindell and Honeycutt, 1990; Hillis and
Dixon, 1991). Some of the earliest studies conducted
substantiated the endosymbiotic model of eukaryotic
origin comparing mitochondrial ribosomal gene se-
quences with homologous bacterial and nuclear cyto-
plasmic genes of eukaryotes (Yang et al., 1985; Woese,
1987). In addition, with the advent of mitochondrial
‘‘universal’’ primers (Kocher et al., 1989; Palumbi et al.,
1991; Simon et al., 1994), which permit the amplifica-
tion of specific gene regions of homologous DNA via the
polymerase chain reaction (PCR) (Saiki et al., 1985),
there has been a veritable explosion in studies employ-
ing mt rRNA genes for systematic studies. Unfortu-
nately, many investigators employing mt rRNA gene
sequences do not utilize information from the second-
ary structure models to aid in the alignment of their
data set and some use models proposed for distantly
related taxa. Part of the problem associated with using
secondary structure models is simply the lack of avail-
able rRNA sequences for many taxa. For example, of
the 40 animal mitochondrial LSU complete or near
complete rRNA sequences reported in 1993, 7 are from
arthropods, 28 are from chordates (with ca. 85% of the
chordates being mammals), 2 are from echinoderms, 2
are from nematodes, and only 1 is from a mollusk
(Gutell et al., 1993). One significantly underrepre-
sented group is the phylum Mollusca.
Mollusks are an extraordinarily diverse group of
animals with an estimated 200,000 species, second only
to the phylum Arthropoda. Mollusks constitute an
amazing morphological array of species, including the
familiar gastropods, cephalopods, scaphopods, bi-
valves, and chitons and the more obscure Tryblidia,
solenogasters, and scutopods. Mollusks made their first
fossil appearance in the Cambrian explosion along with
many other experimental ‘‘phylo-types,’’ and many of
the classes appear shortly after the Cambrian explo-
sion. Surprisingly, despite the ecological and/or eco-
nomic importance of many of the species of mollusks,
few molecular systematic studies have employed the
useful mt rRNA genes (e.g., Lieberman et al., 1993;
Lydeard et al., 1996, 1997, 1998; Mulvey et al., 1997;
Douris et al., 1998). The aforementioned studies that
have been conducted relied on arthropod secondary
structure models for alignment purposes.
Today there are ca. 180 complete (or nearly so) LSU
rRNA animal mitochondrial sequences. Of these, there
are 10 arthropod, 150 chordate, 6 echinoderm, 1 hemi-
chordate, 2 annelid, and 10 mollusk sequences. Within
the mollusks, there are 1 chiton, 2 bivalves, 6 gastro-
pods, and 1 cephalopod. In this paper, we conduct a
comparative analysis of the complete mollusk mt LSU
sequences and determine secondary structure models
for them. As in the detailed analysis presented by
Hickson et al. (1996) on the third domain of animal
mitochondrial SSU rRNA, these data will provide an
important foundation for future research on the mol-
lusk mt LSU rRNA sequences.
MATERIALS AND METHODS
Table 1 lists the 10 mollusk species examined in this
study and their placement in a classification scheme of
mollusks (Salvini-Plawen and Steiner, 1996; Ponder
and Lindberg, 1997; Vaught, 1989). Cacozeliana lac-
ertina (New South Wales, Long Reef, collected, N of
Sydney, 33°45ЈS, 151°19ЈE upper intertidal under rocks
in gutters, 15 April 1996; source Winston Ponder;
Sydney Museum, Australia) and Paracrostoma palu-
diformis (labeled Brotia sp., Thailand, Field Museum of
Natural History FMNH 15706; species identified by
Matthias Glaubrecht, Berlin Museum, Germany) ge-
nomic DNA was isolated by standard phenol/chloro-
form extraction. Approximately 100 ng of genomic DNA
provided a template for double-stranded reactions via
the PCR in 25 µl of a reaction solution containing each
dNTP at 0.1 mM, a pair of LSU primers at 10 µM, 4.0
mM MgCl2, 2.5 µl 10ϫ reaction buffer, and 1.25 units of
AmpliTaq polymerase. DNAwas amplified for 32 cycles,
each involving denaturation at 92°C for 45 s, annealing
at 52°C for 45 s, and extension at 72°C for 60 s. The mt
LSU rRNA amplification primer pairs used were LR-N-
12948 and N1-J-12585 (modified from Simon et al.,
1994), L2510 and H3080 (Palumbi et al., 1991), and
84 LYDEARD ET AL.
SR-14231 and SNL002 (Lydeard et al., 1997). Single-
stranded DNA was obtained by asymmetric amplifica-
tion (Gyllensten and Erlich, 1988) using a single primer
in limited quantity, concentrated on Millipore Ultrafree
MC filters, and sequenced using the Sequenase version
2 kit (Amersham Life Science) with 35S-labeled dATP.
In addition to the amplification primers, the following
primers were used as independent sequencing primers
to give overlapping fragment products: SNL-N-003,
SNL-N-004, and LR-J-13114. Primer sequences or
sources and relative position are provided in Table 2.
The complete mtDNA LSU rRNA gene sequences for
the remaining mollusk and outgroup specimens (Table
1) were retrieved from GenBank and include the follow-
ing: Cepaea nemoralis (Terrett et al., 1996; U23045),
Euhadra herklotsi (Yamazaki et al., unpublished;
Z71693), Albinaria coerulea (Hatzoglou et al., 1995;
X83390), Albinaria turrita (Lecanidou et al., 1994;
X71393, X71394), Loligo bleekeri (Tomita et al., 1998;
AB009838), Mytilus edulis (Hoffmann et al., 1992;
M83756), Pecten maximus (Sellos, D., Mommerot, M.,
and Rigaa, A., unpublished; X92688), Katharina tuni-
cata (Boore and Brown, 1994; U09810), Lumbricus
terrestris (Boore and Brown, 1995; U24570), and Dro-
sophila melanogaster (Kobayashi and Okada, 1990;
X53506).
Secondary structure diagrams for the mollusk mito-
chondrial LSU rRNAs were modeled from the current
23S rRNA structure model with comparative sequence
analysis (Gutell, 1996). This method is based on the
simple premise that RNAs within the same family (e.g.,
23S rRNAs) have very similar secondary and tertiary
structures, regardless of the differences in their nucleo-
tide sequences. Today, the starting point for our analy-
sis is the comparatively inferred structure model and
our structure-based alignment of 23S and 23S-like
(LSU) rRNA sequences. In 1999, both the structure
model and the alignments are well defined—having
undergone more than 15 years of analysis, evaluation,
and refinement. For the current analysis, the mollusk
sequences were aligned with other invertebrate mito-
chondrial sequences with the Escherichia coli 23S
rRNA sequence included as a reference. Positions that
can be aligned with the most confidence were aligned
first. After the most conserved nucleotides were juxta-
posed, positions with less sequence similarity were
aligned and evaluated at base-paired positions for their
TABLE 3
Summary Statistics of Structural Domains of
Mitochondrial LSU rRNA of Mollusks
Domain Rangea
No. of
nucleotidesb PIc
I 49–143 0 0
I/II ‘‘link’’ 17–18 18 6
II 327–422 218 167
II/III ‘‘link’’ 9–14 14 7
III 0–54 0 0
IV 213–231 221 96
IV/V ‘‘link’’ 32–34 34 22
V 268–414 279 135
VI 44–113 36 21
a The min–max range of number of nucleotides within mollusks.
b The number of unambiguously aligned nucleotides.
c The number of phylogenetically informative sites among all taxa
within unambiguously aligned nucleotides.
TABLE 1
Representative Taxa and Classification Scheme
of Taxa Used in the Study
Mollusca
Polyplacophora
Katharina tunicata
Conchifera
Bivalvia
Pteroidea
Pecten maximus
Mytiloidea
Mytilus edulis
Cephalopoda
Loligo bleekeri
Gastropoda
Caenogastropoda
Cerithioidea
Thiaridae
Paracrostoma paludiformis
Batillariidae
Cacozeliana lacertina
Heterobranchia
Stylommatophora
Clausilioidea
Clausiliidae
Albinaria turrita
Albinaria coerulea
Helicoidea
Bradybaenidae
Euhadra herklotsi
Helicidae
Cepaea nemoralis
TABLE 2
Source or Sequence of Amplification and Sequencing
Primers Used in the Present Study
Source or sequence Location/direction
Sr-14231 Lydeard et al., 1997 12S rRNA gene
SNL-N-003 5Јccttccaagtagaaagatta3Ј tRNA glycine gene
SNL-N-004 5Јcyttttgtatcatggtttagc3Ј 135 to 155
L2510 Palumbi et al., 1991 642 to 661
SNL002 Lydeard et al., 1997 756 to 736
LR-J-13114 5Јtgttcctyagtcgccccaac3Ј 962 to 942
LR-N-12948 5Јttgtgacctcgatgttggac3Ј 1086 to 1105
H3080 Palumbi et al., 1991 1188 to 1167
N1-J-12585 5Јggtccttttcgaatttgaatatatcc3Ј ND1 gene
Note. Location and direction is relative to the 16S rRNA secondary
structure model of chiton, Katharina tunicata.
85MOLLUSCAN MITOCHONDRIAL rDNA SEQUENCES
FIG. 1. Secondary structure model of Katharina tunicata mitochondrial LSU rRNA. (A) 5Ј-half including Domains I, II, and III. (B) 3Ј-half
including Domains IV, V, and VI. Structural Domains are shaded.
86 LYDEARD ET AL.
ability to form canonical (G–C, A–U, and G–U) base
pairs in the 23S rRNA structure model. Sequences were
manually adjusted with the alignment editor AE2
(Maidak et al., 1997; T. Macke at the Scripps Clinic, San
Diego, CA) to minimize the number of insertion/
deletion events, to maximize the degree of sequence
identity, and to maintain our previously proposed base
pairings. The secondary structure diagrams were gener-
ated with the interactive graphics program XRNA,
developed by B. Weiser and H. Noller (ftp://fangio.ucsu.
edu/pub/XRNA/), which runs on SUN Microsystems
computers.
Nucleotide variation and substitution patterns were
examined using the software package MEGA (Kumar et
al., 1993; version 1.01). ␹2 test of homogeneity of base
frequencies across taxa was conducted using PAUP*
(Phylogenetic Analysis Using Parsimony (*and other
methods), version 4.0b1; Swofford, 1998). Phylogenies
were estimated by maximum-parsimony analysis
using the heuristic search option (25 replicates) of
PAUP*. Bootstrapping (Felsenstein, 1985) was em-
ployed to measure the internal stability of the data
using 200 iterations. The skewness of tree length
distributions as a measure of phylogenetic information
content (Hillis and Huelsenbeck, 1992) was tested by
generating 10,000 random trees. The two generated
DNA sequences were submitted to GenBank (Accession
Nos. AF101007 and AF101008). The secondary struc-
ture models are available electronically at http://
www.rna.icmb.utexas.edu.
FIG. 1— Continued
87MOLLUSCAN MITOCHONDRIAL rDNA SEQUENCES
FIG. 2. Mollusk consensus diagram based on superimposing the 10 mollusk sequences onto the Katharina tunicata large subunit
ribosomal RNA secondary structure diagram. Positions with a nucleotide in all 10 sequences are shown in one of four categories. Uppercase
letters are for positions that are conserved in all 10 sequences, lowercase letters are conserved in 9/10 sequences, solid circles are for positions
conserved in 8/10 sequences, and open circles are for positions conserved in less than 8/10 sequences. Positions with at least one deletion are
shown with arcs; the arc labels indicate the upper and lower number of nucleotides known to exist within the variable region. We designated
arcs with a range of 4 or more nucleotides as ambiguous (one exception is the arc with a range of 3–25 nt in Domain V, largely due to the
absence of this region in stylommatophoran gastropods).
88 LYDEARD ET AL.
RESULTS AND DISCUSSION
Mitochondrial LSU rRNA Variation
The length of the complete mitochondrial LSU rRNA
gene is 1035 nt, Albinaria coerulea; 1077 nt, Albinaria
turrita; 1024 nt, Euhadra herklotsi; 1004 nt, Cepaea
nemoralis; 1342 nt, Cacozeliana lacertina; 1360 nt,
Paracrostoma paludiformis; 1302 nt, Loligo bleekeri;
1411 nt, Pecten maximus; 1244 nt, Mytilus edulis; 1275
nt, Katharina tunicata; and for the outgroup taxa 1325
nt, Drosophila melanogaster and 1245 nt, Lumbricus
terrestris. Terrett et al. (1996) reported the gene length
of Cepaea nemoralis to be 1210 nt, which is due to their
including additional sequence at the 5Ј-end of the gene.
Determining the exact 5Ј- and 3Ј-terminal ends of the
gene can be problematic, but both estimates for Cepaea
nemoralis are consistent with the shorter lengths ob-
served for other stylommatophoran gastropods. The
stylommatophoran gastropods have the shortest gene
lengths reported for coelomate metazoans; however,
they are longer than those observed in nematodes, ca.
960 nt (Wolstenholme, 1992; Okimoto et al., 1992). The
remaining molluscan taxa exhibit lengths that are
somewhat shorter than this sampling of other metazo-
ans, including humans, 1558 nt (Anderson et al., 1981);
1640 nt in the frog, Xenopus leavis (Roe et al., 1985),
and 1525 nt in the sea urchin, Strongylocentrotus
purpuratus (Jacobs et al., 1988).
FIG. 2— Continued
89MOLLUSCAN MITOCHONDRIAL rDNA SEQUENCES
Considerable length variation among mollusks exists
within each of the six structural domains (Table 3).
Length variation is exhibited at the 5Ј and 3Ј ends of
the mitochondrial LSU rRNA (Domains I and VI)
among molluscan species. However, considerable length
variation among taxa is also attributed to the presence
or absence of entire helical/loop structures within par-
ticular domains, including Domains II, III, and V. The
stylommatophoran gastropods consistently possessed
shorter domain lengths than all the other molluscan
taxa examined. The significance of this variation will be
discussed further under Phylogenetic Content of Second-
ary Structural characters.
The secondary structure model of Katharina tunicata
23S-like rRNA is shown in Fig. 1. Secondary structure
models for the other mollusk mitochondrial LSU rRNA
are available online (http://www.rna.icmb.utexas.edu).
The general shape of the six structural domains (see
Fig. 1) shows remarkable conservation with those of
other metazoans (e.g., Gutell et al., 1993). The consen-
sus of 10 mitochondrial 23S-like rRNA sequences (see
Table 1) was superimposed onto the K. tunicata LSU
rRNA secondary structure diagram (Fig. 2). The nucle-
otides at the most conserved positions (constant in
10/10 and 9/10 sequences) are shown as upper- and
lowercase letters. Positions conserved in 8/10 and 7/10
and fewer are shown with closed and open circles.
Positions in K. tunicata that are deleted in one or more
mollusk sequences are shown with an arc line. Fewer
conservative sites (90%ϩ) were found in the 5Ј-half (64)
than in the 3Ј-half (230) of the gene (Fig. 2).
Table 3 provides the number of unambiguously
aligned nucleotides and phylogenetically informative
(PI) sites for each domain. We designated all regions
with a high degree of length variation among taxa (i.e.,
4 or more nucleotides) as ambiguous (one exception is
the arc with a range of 3–25 nt in Domain V, due to the
absence of this region in stylommatophoran gastro-
pods). These highly variable regions are referred to as
arcs on Fig. 2. Ambiguous areas of alignment are data
dependent and some of the same regions would not
necessarily be deemed ambiguous in a study focusing
on more taxonomically restricted groups (e.g., cerithioi-
dean or stylommatophoran gastropods).
A scatterplot (Fig. 3) of pairwise genetic sequence
differences (p-distance) versus the absolute number of
transitions (ts) and absolute number of transversions
(tv) among all taxa shows that transversions outnum-
ber transitions for all pairwise comparisons. This atypi-
cal finding is probably a function of scale and site
saturation of transitions. Lydeard et al. (1997, 1998)
examined an approximately 900-nt section of the mito-
chondrial LSU rRNA gene in pleurocerid gastropods
and obtained a typical pattern of ts outnumbering tv up
to about 20% sequence difference (p-distance). At or
near the 20% value ts began to level off, and tv began to
outnumber ts, indicating saturation of ts. Although not
directly comparable, all taxon pairwise comparisons in
the present study are greater than 20% different. The
same observations of biased sampling of more distantly
related taxa influencing the lack of transitional bias
has been observed in insects (Derr et al., 1992; Fang et
al., 1993; Han and McPheron, 1997).
Nucleotide Base Composition
Base compositional bias is common in DNA se-
quences. For example, the mitochondrial genome of
insects is typically very A and T rich (e.g., Simon et al.,
FIG. 3. A pairwise sequence comparison scatterplot showing absolute number of transitions and transversions against percentage
sequence difference (p-distance; uncorrected for multiple hits). Transitions, closed boxes; transversions, open boxes.
90 LYDEARD ET AL.
1994). Table 4 provides the nucleotide composition of all
12 taxa examined in this study. The average percentage
of each nucleotide among all mollusks is A ϭ 34.5%, T ϭ
33.7%, C ϭ 13.1%, and G ϭ 18.7%. There is a deficiency
of G ϩ C (average among all mollusks ϭ 31.8%) and a
higher percentage of A ϩ T (68.2%). The percentage A ϩ
T in mollusks is higher than that reported in the
human (57.2%; Anderson et al., 1981), frog (60.8%; Roe
et al., 1985), and fish (Notropis atherinoides, 54.5%;
Simons and Mayden, 1998) but lower than that in
insects, which are noted for their A ϩ T richness (e.g.,
D. melanogaster ϭ 82.9%; this study). Loligo bleekeri
exhibits the most divergent nucleotide composition in
regard to its extreme deficiency of C (only 7.5%) and
high percentage of T (40.0%).A␹2 test of homogeneity of
base frequencies across taxa revealed significant differ-
ences (␹2 ϭ 423.68, df ϭ 33, P Ͻ 0.001). Conventional
tree-building methods can be unreliable when the base
composition of taxa varies between sequences (Penny et
al., 1990; Lockhart et al., 1994). However, using the
LogDet transformation (Lockhart et al., 1994) imple-
mented in PAUP* (Swofford, 1998), which allows tree-
selection methods (e.g., neighbor-joining) to consis-
tently recover the correct tree in cases of differing
nucleotide compositions, did not alter the topology from
those obtained without the LogDet transformation.
Phylogenetic Analyses and Phylogenetic Content
In an ideal setting, the best way to evaluate the
phylogenetic content of a gene tree is to compare it with
the known species tree or at least with a well-
corroborated phylogeny based on independently de-
rived data. One phylogeny that most malacological
systematists agree upon in the context of the taxa
included in the present study is shown in Fig. 4, which
is based on a cladistic analysis of morphological data
and current views of classification (Vaught, 1989; Sal-
vini-Plawen and Steiner, 1996; Ponder and Lindberg,
1997). Although the phylogeny has not been substanti-
ated by many different studies using both molecular
and morphological characters, it provides a compara-
tive framework for examining the utility of the LSU
mtDNAgene. The estimated time of divergence for each
node is based on surveying the literature for the
earliest known fossil appearance for each higher-order
group (e.g., earliest known family for cerithioidean
gastropods) and not just the taxa included in the study
(Albinaria species: Zilch, 1959–1960; Helicoidea fami-
lies: Zilch, 1959–1960; Bandel, 1997; Stylommato-
phora: Bandel, 1994; Cerithioidean families: Bandel,
1993; Heterobranchia–Caenogastropoda divergence:
Bandel, 1994; Cephalopoda–Gastropoda–Bivalvia split:
Moore, 1969; Runnegar, 1996; Yochelson, 1988; Pterioi-
dea–Mytiloidea split: Moore, 1969; Conchifera–Polypla-
cophora divergence: Smith, 1960; Annelida–Athropoda–
Mollusca divergence: Grotzinger et al., 1995; Valentine
et al., 1996). Given the lack of congruence for estimates
of the age of many molluscan taxa among studies,
divergence estimates serve only as a crude approxima-
tion.
The phylogenetic performance of the LSU mtDNA
gene was evaluated using taxonomic congruence. Obser-
vation of congruent patterns in the molecular phylog-
eny and the morphological-based phylogeny indicates
that the two independently derived phylogenies have
converged on the best estimate of the true phylogeny.
Areas of incongruence in the morphological- and molecu-
lar-based phylogenetic hypotheses may be due to sev-
eral factors: (1) the gene tree is incorrect and does not
provide useful phylogenetic information, (2) the morpho-
logical tree is incorrect, or (3) both trees are incorrect
because the data are ambiguous. Given the well-
corroborated, monophyletic status of the taxa exam-
ined in this study (Table 1), however, we will presume
that incongruence is due to the molecular-based phylog-
eny being incorrect. Consequently, the nine nodes of
interest on the morphological-based phylogeny are
treated as the ‘‘expected’’ phylogeny and congruence
indicates ‘‘correct’’clades observed (Cunningham, 1997).
This approach allows for an objective evaluation of
phylogenetic content of molecular data (e.g., Graybeal,
1994).
Phylogenetic analyses were conducted using two
different strategies for detecting stability in the resul-
tant topologies and for compensating for potential site
saturation. The following maximum-parsimony analy-
ses were conducted: unordered, equal weight for all
substitutions and transversions only. Phylogenetic
analyses were conducted excluding ambiguous areas of
alignment for each of the two approaches. An aligned
nexus file with E. coli included as a reference taxon is
available from the authors. Maximum-parsimony analy-
sis using equal weighting yielded one most-parsimoni-
ous tree (Fig. 5A) with a total length (TL) of 1911 and a
consistency index (CI) of 0.543, excluding uninforma-
tive characters. A constraint tree depicting current
views of molluscan relationships (Fig. 4) was 60 steps
TABLE 4
Percentage Nucleotide Base Composition
of Molluscan Taxa Included in Study
A T C G
Albinaria turrita 36.0 35.6 12.9 15.5
Albinaria coerulea 38.5 34.7 12.4 14.5
Euhadra herklotsi 35.9 37.0 12.1 15.0
Cepaea nemoralis 29.7 31.7 16.6 22.0
Cacozeliana lacertina 34.6 28.9 15.9 20.6
Paracrostoma paludiformis 36.1 31.0 14.3 18.7
Loligo bleekeri 34.4 40.0 7.5 18.0
Mytilus edulis 32.0 33.4 13.3 21.4
Pecten maximus 28.1 31.8 13.8 26.4
Katharina tunicata 40.1 34.0 12.8 13.2
Average 34.5 33.7 13.1 18.7
91MOLLUSCAN MITOCHONDRIAL rDNA SEQUENCES
longer, which is significantly different from the most-
parsimonious tree based on Templeton’s (1983) Wil-
coxon signed-rank test as implemented in PAUP*
(P Ͻ 0.001). Four of the nine expected clades are ‘‘cor-
rect’’(4/9 ϭ 44.4% ϭ % clades correct (ϭ%CC); see Cun-
ningham, 1997). The bootstrapped %CC is the average
bootstrap support for each clade in the expected tree
(Cunningham, 1997), which in this case is 44.05%,
indicating low bootstrap support for the nine expected
nodes. The four correct clades include Albinaria tur-
rita ϩ Albinaria coerulea, Euhadra ϩ Cepaea, stylom-
matophoran gastropods, and cerithioidean gastropods.
A monophyletic Bivalvia was only 2 more steps and not
significantly longer in length (P ϭ 0.763). Average boot-
strap support for the four correct clades is 93.6%.
Interestingly, the five expected nodes that failed to
appear in the gene tree were the most basal nodes (i.e.,
Bivalvia, Gastropoda, Cephalopoda ϩ Gastropoda,
Bivalvia ϩ Gastropoda ϩ Cephalopoda, and Mollusca),
which diverged within a roughly 150-million-year span.
The g1 value is significant (g1 ϭ Ϫ1.133), indicating
strong phylogenetic signal, likely a response to the four
strongly supported nodes.
The maximum-parsimony analysis of all taxa using
Drosophila and Lumbricus as outgroup taxa and only
transversions resulted in a single most-parsimonious
tree (TL ϭ 1071; g1 ϭ Ϫ1.086) (Fig. 5B). The topology
differs in the placement of some taxa; however, five of
nine nodes (55.5%) are depicted as correct, with the
Bivalvia being monophyletic. The other four correct
clades were identical to those found in the phylogenetic
analysis using equal weighting (Fig. 5A). The bootstrap
%CC for the nine expected nodes is 46.9%, which is
slightly higher than the support obtained when transi-
tions are included (44.05%). The topology obtained
differs significantly from the traditional molluscan
phylogeny (P Ͻ 0.01).
The four correct clades obtained in both of the
FIG. 4. Phylogenetic hypothesis of Mollusca and estimated dates of divergence (millions of years) based on first appearance in fossil
record. See text for literature examined to obtain phylogeny and estimates of divergence times.
92 LYDEARD ET AL.
aforementioned maximum-parsimony analyses span
an estimated range of less than 360 million years
among the gastropods (Fig. 4), based on the first fossil
appearance. Using an annelid and an arthropod as
outgroups extends the divergence time back to 525–545
mya, which appears to be beyond the resolving power of
the mitochondrial LSU gene. Kumazawa and Nishida
(1993) examined the phylogenetic utility of the mito-
chondrial cytochrome b (cyt b) gene by looking at the
phylogenetic relationships among a mouse, rat, cow,
human, chicken, and frog using a sea urchin to root the
tree. Kumazawa and Nishida (1993) obtained high
bootstrap support for the mouse–rat clade and mam-
mal clade (nearly 95%); however, the frog was sister to
the mammals instead of the chicken, suggesting prob-
lems associated with rooting the tree. Reanalysis exclud-
ing the sea urchin, however, resulted in the correct
topology and high bootstrap values, supporting the
notion that the cyt b gene simply could not resolve
relationships for nodes deeper than 525 mya. Likewise,
we were interested in determining whether the lack of
resolution was due to a rooting problem (i.e., too deep of
a node to properly root the tree). The lack of a monophy-
letic Mollusca supports this contention. Therefore, we
conducted a maximum-parsimony analysis excluding
Drosophila, Lumbricus, and Katharina tunicata, which
diverged over 500 mya, and used the two bivalve
species to root the tree.
Maximum-parsimony analysis using transitions and
transversions (equal weight) resulted in a single most-
parsimonious tree with TL ϭ 1440 and CI ϭ 0.652 (Fig.
6A). The %CC ϭ 4/6 ϭ 66.66% and the bootstrap
%CC ϭ 71.66%. The most-parsimonious topology is not
significantly different from the traditional molluscan
phylogeny (P ϭ 0.272). The g1 value was significant
(g1 ϭ Ϫ1.075). Maximum-parsimony analysis of only
transversions yielded a single most-parsimonious tree
(TL ϭ 785; g1 ϭ Ϫ0.942). The topology is shown in Fig.
6B. The %CC ϭ 5/6 ϭ 83.33% and the bootstrap %CC ϭ
68.5%. The topology is not statistically different from
the traditional molluscan phylogeny (P ϭ 0.134). The
topology obtained using only transversions results in a
Cephalopoda ϩ Gastropoda clade; however, gastropods
are still not rendered monophyletic. The %CC and
bootstrap %CC values were higher for the analyses
without Katharina tunicata, Lumbricus terrestris, and
Drosophila melanogaster than the values obtained
when including all taxa in the analyses. These findings
are partly due to the exclusion of ‘‘expected’’ or correct
clades that were not observed in the phylogenetic
analysis that included all taxa (e.g., the Mollusca and
Bivalvia ϩ Gastropoda ϩ Cephalopoda clades). Be-
cause of the weak support for the Gastropoda ϩ Cepha-
lopoda clade and the failure to obtain a monophyletic
Gastropoda, it appears that the limits of resolving
power of the mitochondrial LSU rRNA gene may be
fewer than 400 million years but certainly greater than
the 80 mya estimate suggested by Graybeal (1994).
Obviously, this estimate will have to be further tested
when additional sequences are available and other
factors are examined, including rate variation among
sites as well as lineages and the effects of long branches
(Abouheif et al., 1998; Philiippe and Laurent, 1998).
Most previous molluscan molecular systematic stud-
ies have used either partial (e.g., Field et al., 1988;
Ghiselin, 1988; Adamkewicz et al., 1997; Harasewych et
al., 1997a,b, 1998) or complete (e.g., Winnepenninckx et
al., 1994, 1996, 1998; Steiner and Mu¨ller, 1996) eukary-
otic nuclear cytoplasmic SSU rRNA sequences or par-
tial (Ͻ200 nucleotides) eukaryotic nuclear cytoplasmic
LSU rRNA sequences (e.g., Tillier et al., 1992; Rosen-
berg et al., 1994). Support for monophyly of Mollusca
and various classes within the phylum differs among
studies (see Winnepenninckx et al., 1996 for review of
results). Perhaps the most striking difference is the fact
that a phylogeny based on complete SSU rRNA se-
quences supports the monophyly of mollusks, gastro-
pods, and bivalves in one study (Winnepenninckx et al.,
1994) and fails to recover molluscan, gastropod, and
bivalve monophyly in another (Winnepenninckx et al.,
1996). The only substantial differences between the two
studies are the number of taxa and taxonomic sam-
pling, which have been shown to be significant factors
in phylogenetic reconstruction (e.g., Lecointre et al.,
1993; Hillis, 1998; Graybeal, 1998). Winnepenninckx et
al., 1996) suggest that the rapid radiation of phyla and
molluscan classes has resulted in short internodal
differences and the inability to fully resolve relation-
ships. Our results support their hypothesis. In con-
trast, the eukaryotic nuclear cytoplasmic LSU and SSU
rRNA genes seem to be useful for resolving relation-
ships within molluscan classes, including bivalves
(Steiner and Mu¨ller, 1996; Adamkewicz et al., 1997)
and gastropods (e.g., Tillier et al., 1992; Harasewych et
al., 1997a,b, 1998).
Stems and Loops
Some ribosomal RNAinvestigators choose to compart-
mentalize the RNA into two components—stems (ϭhe-
lices) and loops (ϭunpaired regions)—operating under
the assumption that the regions behave differently
(e.g., Ortı´ et al., 1996). This appears to be an oversimpli-
fication because some nucleotides within stems and
loops are highly conserved and others are highly vari-
able (see Fig. 2 this study; Gutell et al., 1985; Hickson et
al., 1996; Vawter and Brown, 1993; and consensus
diagrams posted at http://www.rna.icmb.utexas.edu).
Of the 64 positions conserved in more than 90% of the
mollusk sequences in the 5Ј-half, 23 (35.9%) are in
short unpaired regions and bulges, 20 (31.3%) are in
unpaired regions linking Domains I–II and II–III, 12
(18.8%) are in loops, 8 (12.5%) are in internal stems
(i.e., strands separated by at least one other set of
stem–loop structures), and 1 is in hairpin regions
93MOLLUSCAN MITOCHONDRIAL rDNA SEQUENCES
FIG. 5. The single most-parsimonious phylogram obtained based on maximum-parsimony analysis of the complete mitochondrial LSU
rRNA gene, excluding ambiguously aligned regions based on (A) equal weighting (TL ϭ 1911; CI ϭ 0.54) and (B) transversions only
(TL ϭ 1071). Bootstrap values are shown above nodes having support of greater than 50%. Lumbricus and Drosophila were treated as
outgroup taxa.
94 LYDEARD ET AL.
FIG. 5— Continued
95MOLLUSCAN MITOCHONDRIAL rDNA SEQUENCES
FIG. 6. The single most-parsimonious phylogram obtained based on maximum-parsimony analysis of the complete mitochondrial LSU
rRNA gene, excluding ambiguously aligned regions based on (A) equal weighting (TL ϭ 1440; CI ϭ 0.65) and (B) transversions only
(TL ϭ 785). Bootstrap values are shown above nodes having support of greater than 50%. The two bivalve species (Mytilus edulis and Pecten
maximus) were treated as outgroup taxa.
96 LYDEARD ET AL.
FIG. 6— Continued
97MOLLUSCAN MITOCHONDRIAL rDNA SEQUENCES
98
7
(strands separated by a single, unpaired loop struc-
ture). Of the 230 90%ϩ conserved sites in the 3Ј-half, 86
(37.4%) are in short unpaired regions and bulges, 4
(1.7%) are in unpaired regions linking Domain IV–V, 31
(13.5%) are in loops, 39 (17.0%) are in internal stems,
and 73 (30.4%) are in hairpin regions.
Molecular systematists are interested in discovering
molecular characters that are going to yield a robust
phylogeny. One question that we examined was whether
there was any pattern in where the most conservative
phylogenetically informative sites were located in the
context of the ribosomal RNA secondary structure
model. This issue was investigated by generating a
molecular phylogeny constraining the topology to pro-
duce the ‘‘correct’’ tree shown in Fig. 4 and mapping the
characters with a retention index (RI) of 1.0 (from
unambiguously aligned regions) on the ribosomal RNA
secondary structure model of Katharina tunicata. The
retention index expresses the fraction of apparent
synapomorphy in the character that is retained as
synapomorphy on the tree (Farris, 1989). A synapomor-
phy is a shared-derived character. Forty-nine charac-
ters were found that had a retention index of 1.0. The
vast majority of the 49 characters represented synapo-
morphies for the stylommatophoran gastropods, the
cerithioidean gastropods, and the bivalves revealed in
the unconstrained phylogeny. Of the 15 characters that
had an RI of 1.0 in the 5Ј-half, 4 are in short unpaired
regions and bulges, 2 are in unpaired regions linking
Domain I–II, 2 are in loops, 4 are in internal stems, and
3 are in hairpin regions. Of the 34 characters that had
an RI of 1.0 in the 3Ј-half, 4 are in short unpaired
regions and bulges, 3 are in unpaired regions linking
Domain IV–V, 2 are in loops, 8 are in internal stems,
and 17 are in hairpin regions. Interestingly, 25 of 49
characters with an RI of 1.0 were located within three
nucleotides of an invariant character, suggesting that
the most conservative phylogenetically informative sites
are located in highly conservative regions of the gene.
Phylogenetic Content of Secondary
Structural Characters
Woese (1987) and later Gutell (1992) envisioned the
possible reconstruction of a phylogenetic tree of metazo-
ans based on a phylogenetic analysis of secondary
structure of rRNA. During our comparative analysis of
FIG. 7. (a) Ribosomal RNA secondary structure models of two regions from Domain II (ϭcharacter 1) and Domain V (ϭcharacter 2),
showing variation among taxa. (b) Data matrix based on the qualitative coding of three characters. Character 1 ϭ Domain II, presence (1) or
absence (0) of stem-loop structure; character 2 ϭ Domain V, stem/bulge/stem/loop structure (0), stem/bulge/stem/bulge/stem/loop structure (1);
character 3 (not shown) ϭ presence of Domain III (1) or absence of Domain III (0). (c) Placement of three characters in the context of the entire
ribosomal rRNA secondary structure of K. tunicata.
99MOLLUSCAN MITOCHONDRIAL rDNA SEQUENCES
molluscan secondary structure models, it became appar-
ent that there may be phylogenetic signal. To examine
the phylogenetic content in the secondary structure
models, a data matrix was constructed based on a
qualitative analysis of variable stem/loop structures.
We chose to code only potentially phylogenetically
informative sites and excluded autapomorphies (charac-
ters unique to a single taxon). The final data matrix and
two of the three characters are presented in Fig. 7
(character 3 is the presence or absence of Domain III). A
maximum-parsimony analysis of the three ribosomal
RNAsecondary structural characters (unordered; equal
weight), including all taxa with Drosophila and Lumbri-
cus as outgroups, yielded a single most-parsimonious
tree (TL ϭ 3; CI ϭ 1.0) with characters 1 (loss of stem
loop structure in Domain II) and 2 (stem/bulge/stem/
loop structure in Domain V) uniting the stylommatopho-
ran gastropods and character 3 (absence of Domain III)
uniting stylommatophoran gastropods ϩ Drosophila.
Obviously, if we constrained the monophyly of the
Mollusca, the loss of Domain III would be depicted as
two independent evolutionary events. Given that the
three coded characters yielded synapomorphies for
stylommatophoran gastropods, it appears that there is
indeed phylogenetic signal in the secondary structure
of rRNA that is worthy of future investigation not only
in mollusks but in all metazoans.
ACKNOWLEDGMENTS
Thanks are extended to R. Minton, K. Roe, P. J. West, and the
Advanced Systematics Discussion Group at U.A. for helpful com-
ments on the manuscript and to R. Minton for assistance with Figs. 5
and 7 and J. Cannone for Figs. 1 and 2. Thanks are also given to M.
Glaubrecht, W. Ponder, and B. Roth for help finding relevant litera-
ture on molluscan fossils. This research was supported in part by a
Research Grants Committee Award (2-67858) from the University of
Alabama and the National Science Foundation (DEB-9707623) to
C.L. and the National Institutes of Health (GM48207) to R.R.G.
REFERENCES
Abouheif, E., Zardoya, R., and Meyer, A. (1998). Limitations of
metazoan 18S rDNA sequence data: Implications for reconstruct-
ing a phylogeny of the animal kingdom and inferring the reality of
the Cambrian explosion. J. Mol. Evol. 47: 394–405.
Adamkewicz, S. L., Harasewych, M. G., Black, J., Saudek, D., and
Bult, C. J. (1997). A molecular phylogeny of the bivalve mollusks.
Mol. Biol. Evol. 14: 619–629.
Anderson, S., Bankier, A. T., Barrell, B. G., de Bruijn, M. H. L.,
Coulson, A. R., Drouin, J., Eperon, I. C., Nierlich, D. P., Roe, B. A.,
Sanger, F., Schreier, P. H., Smith, A. J. H., Staden, R., and Young,
I. G. (1981). Sequence and organization of the human mitochon-
drial genome. Nature 290: 457–465.
Bandel, K. (1993). Caenogastropoda during Mesozoic times. In ‘‘Mol-
luscan Palaeontology’’ (A. W. Janssen and R. Janssen, Eds.), pp.
7–56. 11th International Malacological Congress Siena, Italy,
Symposium Proceedings. Scripta Geologica, Special Issue 2, Leiden.
Bandel, K. (1994). Triassic euthyneura (Gastropoda) from St. Cassian
Formation (Italian Alps) with a discussion on the evolution of the
Heterostropha. Freiberger Forschungshefte C 452: 79–100.
Bandel, K. (1997). Higher classification and pattern of evolution of
the Gastropoda: A synthesis of biological and paleontological data.
Cour. Forsch. Inst. Senckenberg 201: 57–81.
Boore, J. L., and Brown, W. M. (1994). Complete DNA sequence of the
mitochondrial genome of the black chiton, Katharina tunicata.
Genetics 138: 423–443.
Boore, J. L., and Brown, W. M. (1995). Complete sequence of the
mitochondrial DNA of the annelid worm Lumbricus terrestris.
Genetics 141: 305–319.
Cunningham, C. W. (1997). Can three incongruence tests predict
when data should be combined? Mol. Biol. Evol. 14: 733–740.
Derr, J. N., Davis, S. K., Woolley, J. B., and Whartono, R. A. (1992).
Reassessment of the 16S rRNA nucleotide sequence from members
of the parasitic Hymenoptera. Mol. Phylogenet. Evol. 1: 338–341.
Douris, V., Giokas, S., Lecanidou, R., Mylonas, M., and Rodakis, G. C.
(1998). Phylogenetic analysis of mitochondrial DNA and morpho-
logical characters suggest a need for taxonomic re-evaluation
within the Alopiinae (Gastropoda: Clausiliidae). J. Moll. Stud. 64:
81–92.
Fang, Q., Black, W. C., Blocker, H. D., IV, and Whitcomb, R. F. (1993).
A phylogeny of New World Deltocephalus-like leafhopper genera
based on mitochondrial 16S ribosomal DNA sequences. Mol. Phylo-
genet. Evol. 2: 119–131.
Farris, J. S. (1989). The retention index and the rescaled consistency
index. Cladistics 5: 417–419.
Felsenstein, J. F. (1985). Confidence limits on phylogenies: An
approach using the bootstrap. Evolution 39: 783–791.
Field, K. G., Olsen, G. J., Lane, D. J., Giovannoni, S. J., Ghiselin,
M. T., Raff, E. C., Pace, N. R., and Raff, R. A. (1988). Molecular
phylogeny of the animal kingdom. Science 239: 748–753.
Gatesy, J., Desalle, R., and Wheeler, W. (1993). Alignment-ambiguous
nucleotide sites and the exclusion of systematic data. Mol. Phylo-
genet. Evol. 2: 152–157.
Ghiselin, M. T. (1988). The origin of molluscs in the light of molecular
evidence. In ‘‘Oxford Surveys in Evolutionary Biology’’ (P. H.
Harvey and L. Partridge, Eds.), Vol. 5, pp. 66–95. Oxford Univ.
Press, New York.
Graybeal, A. (1994). Evaluating the phylogenetic utility of genes: A
search for genes informative about deep divergences among verte-
brates. Syst. Biol. 43: 174–193.
Graybeal, A. (1998). Is it better to add taxa or characters to a difficult
phylogenetic problem? Syst. Biol. 47: 9–17.
Grotzinger, J. P., Bowring, S. A., Saylor, B., and Kauffman, A. J.
(1995). New biostratigraphic and geochronologic constraints on
early animal evolution. Science 270: 598–604.
Gutell, R. R. (1992). Evolutionary characteristics of 16S and 23S
rRNA structures. In ‘‘The Origin and Evolution of the Cell’’ (H.
Hartman and K. Matsuno, Eds.), pp. 243–309. World Scientific,
Singapore.
Gutell, R. R. (1994). Collection of small subunit (16S- and 16S-like)
ribosomal RNA structures: 1994. Nucleic Acids Res. 22: 3502–3507.
Gutell, R. R. (1996). Comparative sequence analysis and the struc-
ture of 16S and 23S RNA. In ‘‘Ribosomal RNA: Structure, Evolu-
tion, Processing and Function in Protein Biosynthesis’’ (R. A.
Zimmermann and A. E. Dahlberg, Eds.), pp. 111–128. CRC Press,
New York.
Gutell, R. R., Weiser, B., Woese, C. R., and Noller, H. F. (1985).
Comparative anatomy of 16S-like ribosomal RNA. Prog. Nucleic
Acid Res. Mol. Biol. 32: 155–216.
Gutell, R. R., Gray, M. W., and Schnare, M. N. (1993). Compilation of
large subunit (23S- & 23S-like) ribosomal RNA structures: 1993.
Nucleic Acids Res. 21: 3055–3074.
Gutell, R. R., Larsen, N., and Woese, C. R. (1994). Lessons from an
evolving rRNA: 16S and 23S rRNA structures from a comparative
perspective. Microbiol. Rev. 58: 10–26.
100 LYDEARD ET AL.
Gyllensten, U. B., and Erlich, H. A. (1988). Generation of single-
stranded DNA by the polymerase chain reaction and its application
to direct sequencing of the HLA-DQA locus. Proc. Natl. Acad. Sci.
USA 85: 7652–7656.
Han, H., and McPheron, B. A. (1997). Molecular phylogenetic study of
Tephritidae (Insecta: Diptera) using partial sequences of the
mitochondrial 16S ribosomal DNA. Mol. Phylogenet. Evol. 7:
17–32.
Harasewych, M. G., Adamkewicz, S. L., Blake, J. A., Saudek, D.,
Spriggs, T., and Bult, C. J. (1997a). Neogastropod phylogeny: A
molecular perspective. J. Moll. Stud. 63: 327–351.
Harasewych, M. G., Adamkewicz, S. L., Blake, J. A., Saudek, D.,
Spriggs, T., and Bult, C. J. (1997b). Phylogeny and relationships of
pleurotomariid gastropods (Mollusca: Gastropoda): An assessment
based on partial 18S rDNA and cytochrome c oxidase I sequences.
Mol. Mar. Biol. Biotechnol. 6: 1–20.
Harasewych, M. G., Adamkewicz, S. L., Plassmeyer, M., and Gillevet,
P. M. (1998). Phylogenetic relationships of the lower caenogas-
tropoda (Mollusca, Gastropoda, Architaenioglossa, Campaniloidea,
Cerithioidea) as determined by partial 18S rDNA sequences. Zool.
Scripta 27: 361–372.
Hatzoglou, E., Rodakis, G. C., and Lecanidou, R. (1995). Complete
sequence and gene organization of the mitochondrial genome of the
land snail Albinaria coerulea. Genetics 140: 1353–1366.
Hickson, R. E., Simon, C., Cooper, A., Spicer, G. S., Sullivan, J., and
Penny, D. (1996). Conserved sequence motifs, alignment, and
secondary structure for the third domain of animal 12S rRNA. Mol.
Biol. Evol. 13: 150–169.
Hillis, D. M. (1998). Taxonomic sampling, phylogenetic accuracy, and
investigator bias. Syst. Biol. 47: 3–8.
Hillis, D. M., and Huelsenbeck, J. P. (1992). Signal, noise, and
reliability in molecular phylogenetic analyses. J. Hered. 83: 189–
195.
Hillis, D. M., and Dixon, M. T. (1991). Ribosomal DNA: Molecular
evolution and phylogenetic inference. Q. Rev. Biol. 66: 411–453.
Hoffmann, R. J., Boore, J. L., and Brown, W. M. (1992). A novel
mitochondrial genome organization for the blue mussel, Mytilus
edulis. Genetics 131: 397–412.
Jacobs, H. T., Elliott, D. J., Math, V. B., and Farquarson, A. (1988).
Nucleotide sequence and gene organization of sea urchin mitochon-
drial DNA. J. Mol. Biol. 202: 185–217.
Kjer, K. M. (1995). Use of rRNA secondary structure in phylogenetic
studies to identify homologous positions: An example of alignment
and data presentation from the frogs. Mol. Phylogenet. Evol. 4:
314–330.
Kobayashi, S., and Okada, M. (1990). Complete cDNA sequence
encoding mitochondrial large ribosomal RNAof Drosophila melano-
gaster. Nucleic Acids Res. 18: 4592.
Kocher, T. D., Thomas, W. K., Meyer, A., Edwards, S. V., Pa¨a¨bo, S.,
Villablanca, F. X., and Wilson, A. C. (1989). Dynamics of mitochon-
drial DNA evolution in animals: Amplification and sequencing with
conserved primers. Proc. Natl. Acad. Sci. USA 86: 6196–6200.
Kumar, S., Tamura, K., and Nei, M. (1993). MEGA: Molecular
evolutionary genetics analysis. Institute of Molecular Evolutionary
Genetics. Pennsylvania State Univ., University Park, PA.
Kumazawa, Y., and Nishida, M. (1993). Sequence evolution of mito-
chondrial tRNA genes and deep-branch animal phylogenetics. J.
Mol. Evol. 37: 380–398.
Lecanidou, R., Douris, V., and Rodakis, G. C. (1994). Novel features of
metazoan mtDNA revealed from sequence analysis of three mito-
chondrial DNA segments of the land snail Albinaria turrita
(Gastropoda: Clausiliidae). J. Mol. Evol. 38: 369–382.
Lecointre, G., Philippe, H., Vaˆn Leˆ, H. L., and Le Guyader, H. (1993).
Species sampling has a major impact on phylogenetic inference.
Mol. Phylogenet. Evol. 2: 205–224.
Lieberman, B. S., Allmon, W. D., and Eldredge, N. (1993). Levels of
selection and macroevolutionary patterns in the turritellid gastro-
pods. Paleobiology 19: 205–215.
Lockhart, P. J., Steel, M. A., Hendy, M. D., and Penny, D. (1994).
Recovering evolutionary trees under a more realistic model of
sequence evolution. Mol. Biol. Evol. 11: 605–612.
Lydeard, C., and Roe, K. J. (1997). The phylogenetic utility of the
mitochondrial cytochrome b gene for inferring relationships among
actinopterygian fishes. In ‘‘Molecular Systematics of Fishes’’ (T. D.
Kocher and C. A. Stepien, Eds.), pp. 285–303. Academic Press, New
York.
Lydeard, C., Mulvey, M., and Davis, G. M. (1996). Molecular system-
atics and evolution of reproductive traits of North American
freshwater unionacean mussels (Mollusca: Bivalvia) as inferred
from 16S rRNA gene sequences. Philos. Trans. R. Soc. Lond. B 351:
1593–1603.
Lydeard, C., Holznagel, W. E., Garner, J., Hartfield, P., and Pierson,
J. M. (1997). A molecular phylogeny of Mobile River drainage basin
pleurocerid snails (Caenogastropoda: Cerithioidea). Mol. Phylo-
genet. Evol. 7: 117–128.
Lydeard, C., Yoder, J. H., Holznagel, W. E., Thompson, F. G., and
Hartfield, P. (1998). Phylogenetic utility of the 5Ј-half of mitochon-
drial 16S rDNA gene sequences for inferring relationships of
Elimia (Cerithioidea: Pleuroceridae). Malacologia 39: 183–193.
Maidak, B. L., Olsen, G. J., Larsen, N., Overbeek, R., McCaughey,
M. J., and Woese, C. R. (1997). The RDP (Ribosomal Database
Project). Nucleic Acids Res. 25: 109–111.
Mindell, D. P., and Honeycutt, R. L. (1990). Ribosomal RNA in
vertebrates: Evolution and phylogenetic applications. Annu. Rev.
Ecol. Syst. 21: 541–566.
Miyamoto, M. M., Allard, M. W., Adkins, R. M., Janecek, L. L., and
Honeycutt, R. L. (1994). A congruence test of reliability using
linked mitochondrial DNA sequences. Syst. Biol. 43: 236–249.
Moore, R. C., Ed. (1969). ‘‘Treatise on Invertebrate Paleontology.
Bivalvia. Mollusca 6, Part N, 1,’’ Geol. Soc. Am. and Univ. Press of
Kansas, Lawrence.
Mulvey, M., Lydeard, C., Pyer, D. L., Hicks, K. M., Brim-Box, J.,
Williams, J. D., and Butler, R. S. (1997). Conservation genetics of
North American freshwater mussels Amblema and Megalonaias.
Conserv. Biol. 11: 868–878.
Noller, H. F. (1984). Structure of ribosomal RNA. Annu. Rev. Bio-
chem. 53: 119–162.
Noller, H. F. (1991). Ribosomal RNA and translation. Annu. Rev.
Biochem. 60: 191–227.
Noller, H. F., Kop, J., Wheaton, V., Brosius, J., Gutell, R. R., Kopylov,
A. M., Dohme, F., and Herr, W. (1981). Secondary structure model
for 23S ribosomal RNA. Nucleic Acids Res. 9: 6167–6189.
Okimoto, R., Macfarlane, J. L., Clary, D. O., and Wolstenholme, D. R.
(1992). The mitochondrial genomes of two nematodes, Caenorhab-
ditis elegans and Ascaris suum. Genetics 130: 471–498.
Ortı´, G., Petry, P., Porto, J. I. R., Je´gu, M., and Meyer, A. (1996).
Patterns of nucleotide change in mitochondrial ribosomal RNA
genes and the phylogeny of piranhas. J. Mol. Evol. 42: 169–182.
Palumbi, S. R., Martin, A. P., Romano, S. L., McMillan, W. O., Stice,
L., and Grabowski, G. (1991). ‘‘The Simple Fool’s Guide to PCR,’’
Univ. of Hawaii Press, Honolulu.
Penny, D., Hendy, M. D., Zimmer, E. A., and Hamby, R. I. (1990).
Trees from sequences: Panacea or Pandora’s box? Aust. Syst. Bot. 3:
21–38.
Philippe, H., and Laurent, J. (1998). How good are deep phylogenetic
trees? Curr. Opin. Genet. Dev. 8: 616–623.
Ponder, W. F., and Lindberg, D. R. (1997). Towards a phylogeny of
gastropod molluscs: An analysis using morphological characters.
Zool. J. Linn. Soc. 119: 83–265.
Roe, B. A., Ma, D. P., Wilson, R. K., and Wong, J. F. H. (1985). The
101MOLLUSCAN MITOCHONDRIAL rDNA SEQUENCES
complete nucleotide sequence of the Xenopus laevis mitochondrial
genome. J. Biol. Chem. 260: 9759–9774.
Rosenberg, G., Kuncio, G. S., Davis, G. M., and Harasewych, M. G.
(1994). Preliminary ribosomal RNA phylogeny of gastropod and
unionoidean bivalve mollusks. Nautilus Suppl. 2: 111–121.
Runnegar, B. (1996). Early evolution of the Mollusca: the fossil
record. In ‘‘Origin and Evolutionary Radiation of the Mollusca’’
(J. D. Taylor, Ed.), pp. 77–87. Oxford Univ. Press, Oxford.
Saiki, R. K., Scharf, S., Faloona, F., Mullis, K. B., Horn, G. T., Erlich,
H. A., and Arnheim, N. (1985). Enzymatic amplification of ␤-globin
genomic sequences and restriction site analysis for diagnosis of
sickle cell anemia. Science 230: 1350–1354.
Salvini-Plawen, L. V., and Steiner, G. (1996). Synapomorphies and
plesiomorphies in higher classification of mollusca. In ‘‘Origin and
Evolutionary Radiation of the Mollusca’’ (J. D. Taylor, Ed.), pp.
29–51. Oxford Univ. Press, Oxford.
Simon, C., Frati, F., Beckenbach, A., Crespi, B., Liu, H., and Flook, P.
(1994). Evolution, weighting, and phylogenetic utility of mitochon-
drial gene sequences and a compilation of conserved polymerase
chain reaction primers. Ann. Entomol. Soc. Am. 87: 651–701.
Simons, A. M., and Mayden, R. L. (1998). Phylogenetic relationships
of the western North American phoxinins (Actinopterygii: Cyprini-
dae) as inferred from mitochondrial 12S and 16S ribosomal RNA
sequences. Mol. Phylogenet. Evol. 9: 308–329.
Smith, A. G. (1960). Amphineura. In ‘‘Treatise on Invertebrate
Paleontology. Part I, Mollusca 1’’ (R. C. Moore, Ed.), pp. I41–I76.
Geol. Soc. Am. and Univ. Press of Kansas, Lawrence.
Steiner, G., and Mu¨ller, M. (1996). What can 18S rDNA do for bivalve
phylogeny? J. Mol. Evol. 43: 58–70.
Swofford, D. L. (1998). PAUP*. Phylogenetic Analysis Using Par-
simony (*and Other Methods). Version 4.0b1. Sinauer, Sunder-
land, MA.
Templeton, A. R. (1983). Convergent evolution and non-parametric
inferences from restriction fragment and DNA sequence data. In
‘‘Statistical Analysis of DNA Sequence Data’’ (B. Weir, Ed.), pp.
151–179. Dekker, New York.
Terrett, J. A., Miles, S., and Thomas, R. H. (1996). Complete DNA
sequence of the mitochondrial genome of Cepaea nemoralis (Gas-
tropoda: Pulmonata). J. Mol. Evol. 42: 160–168.
Thompson, J. D., Higgins, D. G., and Gibson, T. J. (1994). CLUSTAL
W: Improving the sensitivity of progressive multiple sequence
alignment through sequence weighting, positions-specific gap pen-
alties and weight matrix choice. Nucleic Acids Res. 22: 4673–4680.
Tomita, K., Ueda, T., and Watanabe, K. (1998). 7-Methylguanosine at
the anticodon wobble position of squid mitochondrial tRNA
(Ser)GCU: Molecular basis for assignment of AGA/AGG codons as
serine in invertebrate mitochondria. Biochim. Biophys. Acta 1399:
78–82.
Tillier, S., Masselot, M., Philippe, H., and Tillier, A. (1992). Phylog-
e´nie mole´culaire des gastropoda (Mollusca) fonde´e sur le se´quen-
cage partiel de l’ARN ribosominque 28S. C. R. Acad. Sci. Paris 314:
79–85.
Titus, T. A., and Frost, D. R. (1996). Molecular homology assessment
and phylogeny in the lizard family Opluridae (Squamata: Iguania).
Mol. Phylogenet. Evol. 6: 49–62.
Valentine, J. W., Erwin, D. H., and Jablonski, D. (1996). Developmen-
tal evolution of metazoan bodyplans: The fossil evidence. Dev. Biol.
173: 373–381.
Vaught, K. C. (1989). ‘‘A Classification of the Living Mollusca,’’ Am.
Malacol. Inc. Melbourne, FL.
Vawter, L., and Brown, W. M. (1993). Rates and patterns of base
change in the small subunit ribosomal RNA gene. Genetics 134:
597–608.
Wheeler, W. C., and Gladstein, D. (1991). MALIGN (Multiple align-
ment). Privately distributed.
Winnepenninckx, B., Backeljau, T., and De Wachter, R. (1994). Small
ribosomal subunit RNA and the phylogeny of Mollusca. Nautilus
Suppl. 2: 98–110.
Winnepenninckx, B., Backeljau, T., and De Wachter, R. (1996).
Investigation of molluscan phylogeny on the basis of 18S rRNA
sequences. Mol. Biol. Evol. 13: 1306–1317.
Winnepenninckx, B., Steiner, G., Backeljau, T., and De Wachter, R.
(1998). Details of gastropod phylogeny inferred from 18S rRNA
sequences. Mol. Phylogenet. Evol. 9: 55–63.
Woese, C. R. (1987). Bacterial evolution. Microbiol. Rev. 51: 221–271.
Woese, C. R., Magrum, L. J., Gupta, R., Siegel, R. B., and Stahl, D. A.
(1980). Secondary structure model for bacterial 16S ribosomal
RNA: Phylogenetic, enzymatic and chemical evidence. Nucleic
Acids Res. 8: 2275–2293.
Woese, C. R., Kandler, O., and Wheelis, M. L. (1990). Towards a
natural system of organisms: Proposal for the domains Archaea,
Bacteria, and Eucarya. Proc. Natl. Acad. Sci. USA 87: 4576–4579.
Wolstenholme, D. R. (1992). Animal mitochondrial DNA: Structure
and evolution. Int. Rev. Cytol. 141: 173–216.
Yang, D., Oyaizu, Y., Olsen, G. J., and Woese, C. R. (1985). Mitochon-
drial origins. Proc. Natl. Acad. Sci. USA 82: 4443–4447.
Yochelson, E. L. (1988). A new genus of Patellacea (Gastropoda) from
the Middle Ordovician of Utah: The oldest known example of the
superfamily. New Mexico Bur. Mines Min. Res. Mem. 44: 195–200.
Zilch, A. (1959–1960). Gastropoda, Teil 2, Euthyneura. Handb.
Paleozool. 6(2)1: 1–400 [1959]; 2: 401–834 [1960].
Zimmermann, R. A., and Dahlberg, A. E., Eds. (1996). ‘‘Ribosomal
RNA: Structure, Evolution, Processing and Function in Protein
Biosynthesis,’’ CRC Press, New York.
102 LYDEARD ET AL.

More Related Content

What's hot

Bioinformatics and the logic of life
Bioinformatics and the logic of lifeBioinformatics and the logic of life
Bioinformatics and the logic of lifeM. Gonzalo Claros
 
Using phylogenetic metadata for large-scale phylogeny synthesis
Using phylogenetic metadata for large-scale phylogeny synthesisUsing phylogenetic metadata for large-scale phylogeny synthesis
Using phylogenetic metadata for large-scale phylogeny synthesisKaren Cranston
 
Gutell 002.nar.1981.09.06167
Gutell 002.nar.1981.09.06167Gutell 002.nar.1981.09.06167
Gutell 002.nar.1981.09.06167Robin Gutell
 
Gutell 034.mr.1994.58.0010
Gutell 034.mr.1994.58.0010Gutell 034.mr.1994.58.0010
Gutell 034.mr.1994.58.0010Robin Gutell
 
Epigenome roadmap ge-mvt2016-amb.slideshare
Epigenome roadmap ge-mvt2016-amb.slideshareEpigenome roadmap ge-mvt2016-amb.slideshare
Epigenome roadmap ge-mvt2016-amb.slidesharebarrioam
 
Metabolomics: The Next Generation of Biochemistry
Metabolomics: The Next Generation of BiochemistryMetabolomics: The Next Generation of Biochemistry
Metabolomics: The Next Generation of BiochemistryMargaret Eason
 
Gutell 086.bmc.evol.biol.2003.03.07
Gutell 086.bmc.evol.biol.2003.03.07Gutell 086.bmc.evol.biol.2003.03.07
Gutell 086.bmc.evol.biol.2003.03.07Robin Gutell
 
The evolutionary history of the hominin hand since the last common ancestor o...
The evolutionary history of the hominin hand since the last common ancestor o...The evolutionary history of the hominin hand since the last common ancestor o...
The evolutionary history of the hominin hand since the last common ancestor o...José Luis Moreno Garvayo
 
3.3-million-year-old stone tools from Lomekwi 3, West Turkana, Kenya
3.3-million-year-old stone tools from Lomekwi 3, West Turkana, Kenya3.3-million-year-old stone tools from Lomekwi 3, West Turkana, Kenya
3.3-million-year-old stone tools from Lomekwi 3, West Turkana, KenyaJosé Luis Moreno Garvayo
 
ConSurf_an_algorithmic_tool_for_the_iden
ConSurf_an_algorithmic_tool_for_the_idenConSurf_an_algorithmic_tool_for_the_iden
ConSurf_an_algorithmic_tool_for_the_idenRony Armon
 
Taxonomy and classification Implications for avian identification
Taxonomy and classification Implications for avian identificationTaxonomy and classification Implications for avian identification
Taxonomy and classification Implications for avian identificationNicola snow
 
Juan Primary Article pub
Juan Primary Article pubJuan Primary Article pub
Juan Primary Article pubmaldjuan
 
Sequence alignment 1
Sequence alignment 1Sequence alignment 1
Sequence alignment 1SumatiHajela
 

What's hot (20)

Bioinformatics and the logic of life
Bioinformatics and the logic of lifeBioinformatics and the logic of life
Bioinformatics and the logic of life
 
Using phylogenetic metadata for large-scale phylogeny synthesis
Using phylogenetic metadata for large-scale phylogeny synthesisUsing phylogenetic metadata for large-scale phylogeny synthesis
Using phylogenetic metadata for large-scale phylogeny synthesis
 
Gutell 002.nar.1981.09.06167
Gutell 002.nar.1981.09.06167Gutell 002.nar.1981.09.06167
Gutell 002.nar.1981.09.06167
 
Topology
TopologyTopology
Topology
 
Gutell 034.mr.1994.58.0010
Gutell 034.mr.1994.58.0010Gutell 034.mr.1994.58.0010
Gutell 034.mr.1994.58.0010
 
Interactomeee
InteractomeeeInteractomeee
Interactomeee
 
Epigenome roadmap ge-mvt2016-amb.slideshare
Epigenome roadmap ge-mvt2016-amb.slideshareEpigenome roadmap ge-mvt2016-amb.slideshare
Epigenome roadmap ge-mvt2016-amb.slideshare
 
GJB6
GJB6GJB6
GJB6
 
Evo s jurnal
Evo s jurnalEvo s jurnal
Evo s jurnal
 
Metabolomics: The Next Generation of Biochemistry
Metabolomics: The Next Generation of BiochemistryMetabolomics: The Next Generation of Biochemistry
Metabolomics: The Next Generation of Biochemistry
 
Benvenuti-Amigo.full
Benvenuti-Amigo.fullBenvenuti-Amigo.full
Benvenuti-Amigo.full
 
Gutell 086.bmc.evol.biol.2003.03.07
Gutell 086.bmc.evol.biol.2003.03.07Gutell 086.bmc.evol.biol.2003.03.07
Gutell 086.bmc.evol.biol.2003.03.07
 
The evolutionary history of the hominin hand since the last common ancestor o...
The evolutionary history of the hominin hand since the last common ancestor o...The evolutionary history of the hominin hand since the last common ancestor o...
The evolutionary history of the hominin hand since the last common ancestor o...
 
3.3-million-year-old stone tools from Lomekwi 3, West Turkana, Kenya
3.3-million-year-old stone tools from Lomekwi 3, West Turkana, Kenya3.3-million-year-old stone tools from Lomekwi 3, West Turkana, Kenya
3.3-million-year-old stone tools from Lomekwi 3, West Turkana, Kenya
 
ConSurf_an_algorithmic_tool_for_the_iden
ConSurf_an_algorithmic_tool_for_the_idenConSurf_an_algorithmic_tool_for_the_iden
ConSurf_an_algorithmic_tool_for_the_iden
 
Taxonomy and classification Implications for avian identification
Taxonomy and classification Implications for avian identificationTaxonomy and classification Implications for avian identification
Taxonomy and classification Implications for avian identification
 
Tradus de onisim
 Tradus de onisim Tradus de onisim
Tradus de onisim
 
Juan Primary Article pub
Juan Primary Article pubJuan Primary Article pub
Juan Primary Article pub
 
Sequence alignment 1
Sequence alignment 1Sequence alignment 1
Sequence alignment 1
 
zmk2820
zmk2820zmk2820
zmk2820
 

Viewers also liked

Live barcelona vs almeria 8 april
Live barcelona vs almeria 8 aprilLive barcelona vs almeria 8 april
Live barcelona vs almeria 8 aprilcrosbybruce33
 
Live football barcelona vs almeria 8 april
Live football barcelona vs almeria 8 aprilLive football barcelona vs almeria 8 april
Live football barcelona vs almeria 8 aprilcrosbybruce33
 
Live football barcelona vs almeria 8 april 2015
Live football barcelona vs almeria 8 april 2015Live football barcelona vs almeria 8 april 2015
Live football barcelona vs almeria 8 april 2015crosbybruce33
 
Mazen Atteya Al Hmaide1-1(2)
Mazen Atteya Al Hmaide1-1(2)Mazen Atteya Al Hmaide1-1(2)
Mazen Atteya Al Hmaide1-1(2)Mazen Atteya
 
Gutell 124.rna 2013-woese-19-vii-xi
Gutell 124.rna 2013-woese-19-vii-xiGutell 124.rna 2013-woese-19-vii-xi
Gutell 124.rna 2013-woese-19-vii-xiRobin Gutell
 
Mẫu nhật ký thi công
Mẫu nhật ký thi côngMẫu nhật ký thi công
Mẫu nhật ký thi côngNam Phuong
 
Surat permohonan iai 1
Surat permohonan iai 1Surat permohonan iai 1
Surat permohonan iai 1Abdul Jaelani
 
Elementos de cambio Educativo. Tema 2
Elementos de cambio Educativo. Tema 2Elementos de cambio Educativo. Tema 2
Elementos de cambio Educativo. Tema 2lopezpelaez
 
Sedgwick-E0498336-D0105-30531a-Assessment 02-presentation (2)
Sedgwick-E0498336-D0105-30531a-Assessment 02-presentation (2)Sedgwick-E0498336-D0105-30531a-Assessment 02-presentation (2)
Sedgwick-E0498336-D0105-30531a-Assessment 02-presentation (2)Colleen Sedgwick
 

Viewers also liked (15)

Live barcelona vs almeria 8 april
Live barcelona vs almeria 8 aprilLive barcelona vs almeria 8 april
Live barcelona vs almeria 8 april
 
Tostadora Smeg TSF01BLEU
Tostadora Smeg TSF01BLEUTostadora Smeg TSF01BLEU
Tostadora Smeg TSF01BLEU
 
Live football barcelona vs almeria 8 april
Live football barcelona vs almeria 8 aprilLive football barcelona vs almeria 8 april
Live football barcelona vs almeria 8 april
 
Live football barcelona vs almeria 8 april 2015
Live football barcelona vs almeria 8 april 2015Live football barcelona vs almeria 8 april 2015
Live football barcelona vs almeria 8 april 2015
 
Solving Complex SEO Problems When Standard Fixes Do Not Appl
Solving Complex SEO Problems When Standard Fixes Do Not ApplSolving Complex SEO Problems When Standard Fixes Do Not Appl
Solving Complex SEO Problems When Standard Fixes Do Not Appl
 
Mazen Atteya Al Hmaide1-1(2)
Mazen Atteya Al Hmaide1-1(2)Mazen Atteya Al Hmaide1-1(2)
Mazen Atteya Al Hmaide1-1(2)
 
Scrum
ScrumScrum
Scrum
 
Gutell 124.rna 2013-woese-19-vii-xi
Gutell 124.rna 2013-woese-19-vii-xiGutell 124.rna 2013-woese-19-vii-xi
Gutell 124.rna 2013-woese-19-vii-xi
 
018 Company Productivity
018 Company Productivity018 Company Productivity
018 Company Productivity
 
Easter in uk
Easter in ukEaster in uk
Easter in uk
 
Mẫu nhật ký thi công
Mẫu nhật ký thi côngMẫu nhật ký thi công
Mẫu nhật ký thi công
 
Easter in uk
Easter in ukEaster in uk
Easter in uk
 
Surat permohonan iai 1
Surat permohonan iai 1Surat permohonan iai 1
Surat permohonan iai 1
 
Elementos de cambio Educativo. Tema 2
Elementos de cambio Educativo. Tema 2Elementos de cambio Educativo. Tema 2
Elementos de cambio Educativo. Tema 2
 
Sedgwick-E0498336-D0105-30531a-Assessment 02-presentation (2)
Sedgwick-E0498336-D0105-30531a-Assessment 02-presentation (2)Sedgwick-E0498336-D0105-30531a-Assessment 02-presentation (2)
Sedgwick-E0498336-D0105-30531a-Assessment 02-presentation (2)
 

Similar to Gutell 069.mpe.2000.15.0083

Gutell 095.imb.2005.14.625
Gutell 095.imb.2005.14.625Gutell 095.imb.2005.14.625
Gutell 095.imb.2005.14.625Robin Gutell
 
Gutell 080.bmc.bioinformatics.2002.3.2
Gutell 080.bmc.bioinformatics.2002.3.2Gutell 080.bmc.bioinformatics.2002.3.2
Gutell 080.bmc.bioinformatics.2002.3.2Robin Gutell
 
Gutell 094.int.j.plant.sci.2005.166.815
Gutell 094.int.j.plant.sci.2005.166.815Gutell 094.int.j.plant.sci.2005.166.815
Gutell 094.int.j.plant.sci.2005.166.815Robin Gutell
 
Gutell 122.chapter comparative analy_russell_2013
Gutell 122.chapter comparative analy_russell_2013Gutell 122.chapter comparative analy_russell_2013
Gutell 122.chapter comparative analy_russell_2013Robin Gutell
 
Gutell 120.plos_one_2012_7_e38320_supplemental_data
Gutell 120.plos_one_2012_7_e38320_supplemental_dataGutell 120.plos_one_2012_7_e38320_supplemental_data
Gutell 120.plos_one_2012_7_e38320_supplemental_dataRobin Gutell
 
Gutell 111.bmc.genomics.2010.11.485
Gutell 111.bmc.genomics.2010.11.485Gutell 111.bmc.genomics.2010.11.485
Gutell 111.bmc.genomics.2010.11.485Robin Gutell
 
Gutell 005.mr.1983.47.0621
Gutell 005.mr.1983.47.0621Gutell 005.mr.1983.47.0621
Gutell 005.mr.1983.47.0621Robin Gutell
 
Gutell 029.nar.1993.21.03055
Gutell 029.nar.1993.21.03055Gutell 029.nar.1993.21.03055
Gutell 029.nar.1993.21.03055Robin Gutell
 
Gutell 097.jphy.2006.42.0655
Gutell 097.jphy.2006.42.0655Gutell 097.jphy.2006.42.0655
Gutell 097.jphy.2006.42.0655Robin Gutell
 
Stalking the Fourth Domain in Metagenomic Data: Searching for, Discovering, a...
Stalking the Fourth Domain in Metagenomic Data: Searching for, Discovering, a...Stalking the Fourth Domain in Metagenomic Data: Searching for, Discovering, a...
Stalking the Fourth Domain in Metagenomic Data: Searching for, Discovering, a...Jonathan Eisen
 
Phylogenetic patterns in the genus Manihot (Euphorbiaceae) inferred from anal...
Phylogenetic patterns in the genus Manihot (Euphorbiaceae) inferred from anal...Phylogenetic patterns in the genus Manihot (Euphorbiaceae) inferred from anal...
Phylogenetic patterns in the genus Manihot (Euphorbiaceae) inferred from anal...CIAT
 
Gutell 101.physica.a.2007.386.0564.good
Gutell 101.physica.a.2007.386.0564.goodGutell 101.physica.a.2007.386.0564.good
Gutell 101.physica.a.2007.386.0564.goodRobin Gutell
 
Gutell 059.fold.design.01.0419
Gutell 059.fold.design.01.0419Gutell 059.fold.design.01.0419
Gutell 059.fold.design.01.0419Robin Gutell
 
holothuriidae phylo
holothuriidae phyloholothuriidae phylo
holothuriidae phyloila Haysia
 
Bioinformatica 24-11-2011-t6-phylogenetics
Bioinformatica 24-11-2011-t6-phylogeneticsBioinformatica 24-11-2011-t6-phylogenetics
Bioinformatica 24-11-2011-t6-phylogeneticsProf. Wim Van Criekinge
 
Gutell 093.jphy.2005.41.0380
Gutell 093.jphy.2005.41.0380Gutell 093.jphy.2005.41.0380
Gutell 093.jphy.2005.41.0380Robin Gutell
 
Gutell 082.jphy.2002.38.0807
Gutell 082.jphy.2002.38.0807Gutell 082.jphy.2002.38.0807
Gutell 082.jphy.2002.38.0807Robin Gutell
 

Similar to Gutell 069.mpe.2000.15.0083 (20)

Gutell 095.imb.2005.14.625
Gutell 095.imb.2005.14.625Gutell 095.imb.2005.14.625
Gutell 095.imb.2005.14.625
 
Gutell 080.bmc.bioinformatics.2002.3.2
Gutell 080.bmc.bioinformatics.2002.3.2Gutell 080.bmc.bioinformatics.2002.3.2
Gutell 080.bmc.bioinformatics.2002.3.2
 
Gutell 094.int.j.plant.sci.2005.166.815
Gutell 094.int.j.plant.sci.2005.166.815Gutell 094.int.j.plant.sci.2005.166.815
Gutell 094.int.j.plant.sci.2005.166.815
 
Gutell 122.chapter comparative analy_russell_2013
Gutell 122.chapter comparative analy_russell_2013Gutell 122.chapter comparative analy_russell_2013
Gutell 122.chapter comparative analy_russell_2013
 
Gutell 120.plos_one_2012_7_e38320_supplemental_data
Gutell 120.plos_one_2012_7_e38320_supplemental_dataGutell 120.plos_one_2012_7_e38320_supplemental_data
Gutell 120.plos_one_2012_7_e38320_supplemental_data
 
Gutell 111.bmc.genomics.2010.11.485
Gutell 111.bmc.genomics.2010.11.485Gutell 111.bmc.genomics.2010.11.485
Gutell 111.bmc.genomics.2010.11.485
 
Gutell 005.mr.1983.47.0621
Gutell 005.mr.1983.47.0621Gutell 005.mr.1983.47.0621
Gutell 005.mr.1983.47.0621
 
bai2
bai2bai2
bai2
 
2000 JME (51)278-285
2000 JME (51)278-2852000 JME (51)278-285
2000 JME (51)278-285
 
Gutell 029.nar.1993.21.03055
Gutell 029.nar.1993.21.03055Gutell 029.nar.1993.21.03055
Gutell 029.nar.1993.21.03055
 
Final Draft
Final DraftFinal Draft
Final Draft
 
Gutell 097.jphy.2006.42.0655
Gutell 097.jphy.2006.42.0655Gutell 097.jphy.2006.42.0655
Gutell 097.jphy.2006.42.0655
 
Stalking the Fourth Domain in Metagenomic Data: Searching for, Discovering, a...
Stalking the Fourth Domain in Metagenomic Data: Searching for, Discovering, a...Stalking the Fourth Domain in Metagenomic Data: Searching for, Discovering, a...
Stalking the Fourth Domain in Metagenomic Data: Searching for, Discovering, a...
 
Phylogenetic patterns in the genus Manihot (Euphorbiaceae) inferred from anal...
Phylogenetic patterns in the genus Manihot (Euphorbiaceae) inferred from anal...Phylogenetic patterns in the genus Manihot (Euphorbiaceae) inferred from anal...
Phylogenetic patterns in the genus Manihot (Euphorbiaceae) inferred from anal...
 
Gutell 101.physica.a.2007.386.0564.good
Gutell 101.physica.a.2007.386.0564.goodGutell 101.physica.a.2007.386.0564.good
Gutell 101.physica.a.2007.386.0564.good
 
Gutell 059.fold.design.01.0419
Gutell 059.fold.design.01.0419Gutell 059.fold.design.01.0419
Gutell 059.fold.design.01.0419
 
holothuriidae phylo
holothuriidae phyloholothuriidae phylo
holothuriidae phylo
 
Bioinformatica 24-11-2011-t6-phylogenetics
Bioinformatica 24-11-2011-t6-phylogeneticsBioinformatica 24-11-2011-t6-phylogenetics
Bioinformatica 24-11-2011-t6-phylogenetics
 
Gutell 093.jphy.2005.41.0380
Gutell 093.jphy.2005.41.0380Gutell 093.jphy.2005.41.0380
Gutell 093.jphy.2005.41.0380
 
Gutell 082.jphy.2002.38.0807
Gutell 082.jphy.2002.38.0807Gutell 082.jphy.2002.38.0807
Gutell 082.jphy.2002.38.0807
 

More from Robin Gutell

Gutell 123.app environ micro_2013_79_1803
Gutell 123.app environ micro_2013_79_1803Gutell 123.app environ micro_2013_79_1803
Gutell 123.app environ micro_2013_79_1803Robin Gutell
 
Gutell 119.plos_one_2017_7_e39383
Gutell 119.plos_one_2017_7_e39383Gutell 119.plos_one_2017_7_e39383
Gutell 119.plos_one_2017_7_e39383Robin Gutell
 
Gutell 118.plos_one_2012.7_e38203.supplementalfig
Gutell 118.plos_one_2012.7_e38203.supplementalfigGutell 118.plos_one_2012.7_e38203.supplementalfig
Gutell 118.plos_one_2012.7_e38203.supplementalfigRobin Gutell
 
Gutell 114.jmb.2011.413.0473
Gutell 114.jmb.2011.413.0473Gutell 114.jmb.2011.413.0473
Gutell 114.jmb.2011.413.0473Robin Gutell
 
Gutell 117.rcad_e_science_stockholm_pp15-22
Gutell 117.rcad_e_science_stockholm_pp15-22Gutell 117.rcad_e_science_stockholm_pp15-22
Gutell 117.rcad_e_science_stockholm_pp15-22Robin Gutell
 
Gutell 116.rpass.bibm11.pp618-622.2011
Gutell 116.rpass.bibm11.pp618-622.2011Gutell 116.rpass.bibm11.pp618-622.2011
Gutell 116.rpass.bibm11.pp618-622.2011Robin Gutell
 
Gutell 115.rna2dmap.bibm11.pp613-617.2011
Gutell 115.rna2dmap.bibm11.pp613-617.2011Gutell 115.rna2dmap.bibm11.pp613-617.2011
Gutell 115.rna2dmap.bibm11.pp613-617.2011Robin Gutell
 
Gutell 113.ploso.2011.06.e18768
Gutell 113.ploso.2011.06.e18768Gutell 113.ploso.2011.06.e18768
Gutell 113.ploso.2011.06.e18768Robin Gutell
 
Gutell 112.j.phys.chem.b.2010.114.13497
Gutell 112.j.phys.chem.b.2010.114.13497Gutell 112.j.phys.chem.b.2010.114.13497
Gutell 112.j.phys.chem.b.2010.114.13497Robin Gutell
 
Gutell 110.ant.v.leeuwenhoek.2010.98.195
Gutell 110.ant.v.leeuwenhoek.2010.98.195Gutell 110.ant.v.leeuwenhoek.2010.98.195
Gutell 110.ant.v.leeuwenhoek.2010.98.195Robin Gutell
 
Gutell 109.ejp.2009.44.277
Gutell 109.ejp.2009.44.277Gutell 109.ejp.2009.44.277
Gutell 109.ejp.2009.44.277Robin Gutell
 
Gutell 108.jmb.2009.391.769
Gutell 108.jmb.2009.391.769Gutell 108.jmb.2009.391.769
Gutell 108.jmb.2009.391.769Robin Gutell
 
Gutell 107.ssdbm.2009.200
Gutell 107.ssdbm.2009.200Gutell 107.ssdbm.2009.200
Gutell 107.ssdbm.2009.200Robin Gutell
 
Gutell 106.j.euk.microbio.2009.56.0142.2
Gutell 106.j.euk.microbio.2009.56.0142.2Gutell 106.j.euk.microbio.2009.56.0142.2
Gutell 106.j.euk.microbio.2009.56.0142.2Robin Gutell
 
Gutell 105.zoologica.scripta.2009.38.0043
Gutell 105.zoologica.scripta.2009.38.0043Gutell 105.zoologica.scripta.2009.38.0043
Gutell 105.zoologica.scripta.2009.38.0043Robin Gutell
 
Gutell 104.biology.direct.2008.03.016
Gutell 104.biology.direct.2008.03.016Gutell 104.biology.direct.2008.03.016
Gutell 104.biology.direct.2008.03.016Robin Gutell
 
Gutell 103.structure.2008.16.0535
Gutell 103.structure.2008.16.0535Gutell 103.structure.2008.16.0535
Gutell 103.structure.2008.16.0535Robin Gutell
 
Gutell 102.bioinformatics.2007.23.3289
Gutell 102.bioinformatics.2007.23.3289Gutell 102.bioinformatics.2007.23.3289
Gutell 102.bioinformatics.2007.23.3289Robin Gutell
 
Gutell 099.nature.2006.443.0931
Gutell 099.nature.2006.443.0931Gutell 099.nature.2006.443.0931
Gutell 099.nature.2006.443.0931Robin Gutell
 
Gutell 098.jmb.2006.360.0978
Gutell 098.jmb.2006.360.0978Gutell 098.jmb.2006.360.0978
Gutell 098.jmb.2006.360.0978Robin Gutell
 

More from Robin Gutell (20)

Gutell 123.app environ micro_2013_79_1803
Gutell 123.app environ micro_2013_79_1803Gutell 123.app environ micro_2013_79_1803
Gutell 123.app environ micro_2013_79_1803
 
Gutell 119.plos_one_2017_7_e39383
Gutell 119.plos_one_2017_7_e39383Gutell 119.plos_one_2017_7_e39383
Gutell 119.plos_one_2017_7_e39383
 
Gutell 118.plos_one_2012.7_e38203.supplementalfig
Gutell 118.plos_one_2012.7_e38203.supplementalfigGutell 118.plos_one_2012.7_e38203.supplementalfig
Gutell 118.plos_one_2012.7_e38203.supplementalfig
 
Gutell 114.jmb.2011.413.0473
Gutell 114.jmb.2011.413.0473Gutell 114.jmb.2011.413.0473
Gutell 114.jmb.2011.413.0473
 
Gutell 117.rcad_e_science_stockholm_pp15-22
Gutell 117.rcad_e_science_stockholm_pp15-22Gutell 117.rcad_e_science_stockholm_pp15-22
Gutell 117.rcad_e_science_stockholm_pp15-22
 
Gutell 116.rpass.bibm11.pp618-622.2011
Gutell 116.rpass.bibm11.pp618-622.2011Gutell 116.rpass.bibm11.pp618-622.2011
Gutell 116.rpass.bibm11.pp618-622.2011
 
Gutell 115.rna2dmap.bibm11.pp613-617.2011
Gutell 115.rna2dmap.bibm11.pp613-617.2011Gutell 115.rna2dmap.bibm11.pp613-617.2011
Gutell 115.rna2dmap.bibm11.pp613-617.2011
 
Gutell 113.ploso.2011.06.e18768
Gutell 113.ploso.2011.06.e18768Gutell 113.ploso.2011.06.e18768
Gutell 113.ploso.2011.06.e18768
 
Gutell 112.j.phys.chem.b.2010.114.13497
Gutell 112.j.phys.chem.b.2010.114.13497Gutell 112.j.phys.chem.b.2010.114.13497
Gutell 112.j.phys.chem.b.2010.114.13497
 
Gutell 110.ant.v.leeuwenhoek.2010.98.195
Gutell 110.ant.v.leeuwenhoek.2010.98.195Gutell 110.ant.v.leeuwenhoek.2010.98.195
Gutell 110.ant.v.leeuwenhoek.2010.98.195
 
Gutell 109.ejp.2009.44.277
Gutell 109.ejp.2009.44.277Gutell 109.ejp.2009.44.277
Gutell 109.ejp.2009.44.277
 
Gutell 108.jmb.2009.391.769
Gutell 108.jmb.2009.391.769Gutell 108.jmb.2009.391.769
Gutell 108.jmb.2009.391.769
 
Gutell 107.ssdbm.2009.200
Gutell 107.ssdbm.2009.200Gutell 107.ssdbm.2009.200
Gutell 107.ssdbm.2009.200
 
Gutell 106.j.euk.microbio.2009.56.0142.2
Gutell 106.j.euk.microbio.2009.56.0142.2Gutell 106.j.euk.microbio.2009.56.0142.2
Gutell 106.j.euk.microbio.2009.56.0142.2
 
Gutell 105.zoologica.scripta.2009.38.0043
Gutell 105.zoologica.scripta.2009.38.0043Gutell 105.zoologica.scripta.2009.38.0043
Gutell 105.zoologica.scripta.2009.38.0043
 
Gutell 104.biology.direct.2008.03.016
Gutell 104.biology.direct.2008.03.016Gutell 104.biology.direct.2008.03.016
Gutell 104.biology.direct.2008.03.016
 
Gutell 103.structure.2008.16.0535
Gutell 103.structure.2008.16.0535Gutell 103.structure.2008.16.0535
Gutell 103.structure.2008.16.0535
 
Gutell 102.bioinformatics.2007.23.3289
Gutell 102.bioinformatics.2007.23.3289Gutell 102.bioinformatics.2007.23.3289
Gutell 102.bioinformatics.2007.23.3289
 
Gutell 099.nature.2006.443.0931
Gutell 099.nature.2006.443.0931Gutell 099.nature.2006.443.0931
Gutell 099.nature.2006.443.0931
 
Gutell 098.jmb.2006.360.0978
Gutell 098.jmb.2006.360.0978Gutell 098.jmb.2006.360.0978
Gutell 098.jmb.2006.360.0978
 

Recently uploaded

Breaking the Kubernetes Kill Chain: Host Path Mount
Breaking the Kubernetes Kill Chain: Host Path MountBreaking the Kubernetes Kill Chain: Host Path Mount
Breaking the Kubernetes Kill Chain: Host Path MountPuma Security, LLC
 
Automating Google Workspace (GWS) & more with Apps Script
Automating Google Workspace (GWS) & more with Apps ScriptAutomating Google Workspace (GWS) & more with Apps Script
Automating Google Workspace (GWS) & more with Apps Scriptwesley chun
 
Boost Fertility New Invention Ups Success Rates.pdf
Boost Fertility New Invention Ups Success Rates.pdfBoost Fertility New Invention Ups Success Rates.pdf
Boost Fertility New Invention Ups Success Rates.pdfsudhanshuwaghmare1
 
GenCyber Cyber Security Day Presentation
GenCyber Cyber Security Day PresentationGenCyber Cyber Security Day Presentation
GenCyber Cyber Security Day PresentationMichael W. Hawkins
 
08448380779 Call Girls In Diplomatic Enclave Women Seeking Men
08448380779 Call Girls In Diplomatic Enclave Women Seeking Men08448380779 Call Girls In Diplomatic Enclave Women Seeking Men
08448380779 Call Girls In Diplomatic Enclave Women Seeking MenDelhi Call girls
 
Histor y of HAM Radio presentation slide
Histor y of HAM Radio presentation slideHistor y of HAM Radio presentation slide
Histor y of HAM Radio presentation slidevu2urc
 
From Event to Action: Accelerate Your Decision Making with Real-Time Automation
From Event to Action: Accelerate Your Decision Making with Real-Time AutomationFrom Event to Action: Accelerate Your Decision Making with Real-Time Automation
From Event to Action: Accelerate Your Decision Making with Real-Time AutomationSafe Software
 
A Call to Action for Generative AI in 2024
A Call to Action for Generative AI in 2024A Call to Action for Generative AI in 2024
A Call to Action for Generative AI in 2024Results
 
Driving Behavioral Change for Information Management through Data-Driven Gree...
Driving Behavioral Change for Information Management through Data-Driven Gree...Driving Behavioral Change for Information Management through Data-Driven Gree...
Driving Behavioral Change for Information Management through Data-Driven Gree...Enterprise Knowledge
 
Axa Assurance Maroc - Insurer Innovation Award 2024
Axa Assurance Maroc - Insurer Innovation Award 2024Axa Assurance Maroc - Insurer Innovation Award 2024
Axa Assurance Maroc - Insurer Innovation Award 2024The Digital Insurer
 
EIS-Webinar-Prompt-Knowledge-Eng-2024-04-08.pptx
EIS-Webinar-Prompt-Knowledge-Eng-2024-04-08.pptxEIS-Webinar-Prompt-Knowledge-Eng-2024-04-08.pptx
EIS-Webinar-Prompt-Knowledge-Eng-2024-04-08.pptxEarley Information Science
 
Strategies for Unlocking Knowledge Management in Microsoft 365 in the Copilot...
Strategies for Unlocking Knowledge Management in Microsoft 365 in the Copilot...Strategies for Unlocking Knowledge Management in Microsoft 365 in the Copilot...
Strategies for Unlocking Knowledge Management in Microsoft 365 in the Copilot...Drew Madelung
 
Tata AIG General Insurance Company - Insurer Innovation Award 2024
Tata AIG General Insurance Company - Insurer Innovation Award 2024Tata AIG General Insurance Company - Insurer Innovation Award 2024
Tata AIG General Insurance Company - Insurer Innovation Award 2024The Digital Insurer
 
Artificial Intelligence: Facts and Myths
Artificial Intelligence: Facts and MythsArtificial Intelligence: Facts and Myths
Artificial Intelligence: Facts and MythsJoaquim Jorge
 
Bajaj Allianz Life Insurance Company - Insurer Innovation Award 2024
Bajaj Allianz Life Insurance Company - Insurer Innovation Award 2024Bajaj Allianz Life Insurance Company - Insurer Innovation Award 2024
Bajaj Allianz Life Insurance Company - Insurer Innovation Award 2024The Digital Insurer
 
08448380779 Call Girls In Greater Kailash - I Women Seeking Men
08448380779 Call Girls In Greater Kailash - I Women Seeking Men08448380779 Call Girls In Greater Kailash - I Women Seeking Men
08448380779 Call Girls In Greater Kailash - I Women Seeking MenDelhi Call girls
 
Understanding Discord NSFW Servers A Guide for Responsible Users.pdf
Understanding Discord NSFW Servers A Guide for Responsible Users.pdfUnderstanding Discord NSFW Servers A Guide for Responsible Users.pdf
Understanding Discord NSFW Servers A Guide for Responsible Users.pdfUK Journal
 
How to convert PDF to text with Nanonets
How to convert PDF to text with NanonetsHow to convert PDF to text with Nanonets
How to convert PDF to text with Nanonetsnaman860154
 
Presentation on how to chat with PDF using ChatGPT code interpreter
Presentation on how to chat with PDF using ChatGPT code interpreterPresentation on how to chat with PDF using ChatGPT code interpreter
Presentation on how to chat with PDF using ChatGPT code interpreternaman860154
 
IAC 2024 - IA Fast Track to Search Focused AI Solutions
IAC 2024 - IA Fast Track to Search Focused AI SolutionsIAC 2024 - IA Fast Track to Search Focused AI Solutions
IAC 2024 - IA Fast Track to Search Focused AI SolutionsEnterprise Knowledge
 

Recently uploaded (20)

Breaking the Kubernetes Kill Chain: Host Path Mount
Breaking the Kubernetes Kill Chain: Host Path MountBreaking the Kubernetes Kill Chain: Host Path Mount
Breaking the Kubernetes Kill Chain: Host Path Mount
 
Automating Google Workspace (GWS) & more with Apps Script
Automating Google Workspace (GWS) & more with Apps ScriptAutomating Google Workspace (GWS) & more with Apps Script
Automating Google Workspace (GWS) & more with Apps Script
 
Boost Fertility New Invention Ups Success Rates.pdf
Boost Fertility New Invention Ups Success Rates.pdfBoost Fertility New Invention Ups Success Rates.pdf
Boost Fertility New Invention Ups Success Rates.pdf
 
GenCyber Cyber Security Day Presentation
GenCyber Cyber Security Day PresentationGenCyber Cyber Security Day Presentation
GenCyber Cyber Security Day Presentation
 
08448380779 Call Girls In Diplomatic Enclave Women Seeking Men
08448380779 Call Girls In Diplomatic Enclave Women Seeking Men08448380779 Call Girls In Diplomatic Enclave Women Seeking Men
08448380779 Call Girls In Diplomatic Enclave Women Seeking Men
 
Histor y of HAM Radio presentation slide
Histor y of HAM Radio presentation slideHistor y of HAM Radio presentation slide
Histor y of HAM Radio presentation slide
 
From Event to Action: Accelerate Your Decision Making with Real-Time Automation
From Event to Action: Accelerate Your Decision Making with Real-Time AutomationFrom Event to Action: Accelerate Your Decision Making with Real-Time Automation
From Event to Action: Accelerate Your Decision Making with Real-Time Automation
 
A Call to Action for Generative AI in 2024
A Call to Action for Generative AI in 2024A Call to Action for Generative AI in 2024
A Call to Action for Generative AI in 2024
 
Driving Behavioral Change for Information Management through Data-Driven Gree...
Driving Behavioral Change for Information Management through Data-Driven Gree...Driving Behavioral Change for Information Management through Data-Driven Gree...
Driving Behavioral Change for Information Management through Data-Driven Gree...
 
Axa Assurance Maroc - Insurer Innovation Award 2024
Axa Assurance Maroc - Insurer Innovation Award 2024Axa Assurance Maroc - Insurer Innovation Award 2024
Axa Assurance Maroc - Insurer Innovation Award 2024
 
EIS-Webinar-Prompt-Knowledge-Eng-2024-04-08.pptx
EIS-Webinar-Prompt-Knowledge-Eng-2024-04-08.pptxEIS-Webinar-Prompt-Knowledge-Eng-2024-04-08.pptx
EIS-Webinar-Prompt-Knowledge-Eng-2024-04-08.pptx
 
Strategies for Unlocking Knowledge Management in Microsoft 365 in the Copilot...
Strategies for Unlocking Knowledge Management in Microsoft 365 in the Copilot...Strategies for Unlocking Knowledge Management in Microsoft 365 in the Copilot...
Strategies for Unlocking Knowledge Management in Microsoft 365 in the Copilot...
 
Tata AIG General Insurance Company - Insurer Innovation Award 2024
Tata AIG General Insurance Company - Insurer Innovation Award 2024Tata AIG General Insurance Company - Insurer Innovation Award 2024
Tata AIG General Insurance Company - Insurer Innovation Award 2024
 
Artificial Intelligence: Facts and Myths
Artificial Intelligence: Facts and MythsArtificial Intelligence: Facts and Myths
Artificial Intelligence: Facts and Myths
 
Bajaj Allianz Life Insurance Company - Insurer Innovation Award 2024
Bajaj Allianz Life Insurance Company - Insurer Innovation Award 2024Bajaj Allianz Life Insurance Company - Insurer Innovation Award 2024
Bajaj Allianz Life Insurance Company - Insurer Innovation Award 2024
 
08448380779 Call Girls In Greater Kailash - I Women Seeking Men
08448380779 Call Girls In Greater Kailash - I Women Seeking Men08448380779 Call Girls In Greater Kailash - I Women Seeking Men
08448380779 Call Girls In Greater Kailash - I Women Seeking Men
 
Understanding Discord NSFW Servers A Guide for Responsible Users.pdf
Understanding Discord NSFW Servers A Guide for Responsible Users.pdfUnderstanding Discord NSFW Servers A Guide for Responsible Users.pdf
Understanding Discord NSFW Servers A Guide for Responsible Users.pdf
 
How to convert PDF to text with Nanonets
How to convert PDF to text with NanonetsHow to convert PDF to text with Nanonets
How to convert PDF to text with Nanonets
 
Presentation on how to chat with PDF using ChatGPT code interpreter
Presentation on how to chat with PDF using ChatGPT code interpreterPresentation on how to chat with PDF using ChatGPT code interpreter
Presentation on how to chat with PDF using ChatGPT code interpreter
 
IAC 2024 - IA Fast Track to Search Focused AI Solutions
IAC 2024 - IA Fast Track to Search Focused AI SolutionsIAC 2024 - IA Fast Track to Search Focused AI Solutions
IAC 2024 - IA Fast Track to Search Focused AI Solutions
 

Gutell 069.mpe.2000.15.0083

  • 1. Phylogenetic Analysis of Molluscan Mitochondrial LSU rDNA Sequences and Secondary Structures Charles Lydeard,* Wallace E. Holznagel,* Murray N. Schnare,† and Robin R. Gutell‡ *Biodiversity and Systematics, Department of Biological Sciences, University of Alabama, Box 870345, Tuscaloosa, Alabama 35487; †Department of Biochemistry and Molecular Biology, Dalhousie University, Halifax, Nova Scotia B3H 4H7, Canada; and ‡Institute for Cellular and Molecular Biology, University of Texas at Austin, 2500 Speedway, Austin, Texas 78712-1095 Received March 30, 1999; revised July 26, 1999 Mollusks are an extraordinarily diverse group of animals with an estimated 200,000 species, second only to the phylum Arthropoda. We conducted a compara- tive analysis of complete mitochondrial ribosomal large subunit sequences (LSU) of a chiton, two bivalves, six gastropods, and a cephalopod. In addition, we deter- mined secondary structure models for each of them. Comparative analyses of nucleotide variation revealed substantial length variation among the taxa, with stylommatophoran gastropods possessing the shortest lengths. Phylogenetic analyses of the nucleotide se- quence data supported the monophyly of Albinaria, Euhadra herklotsi ؉ Cepaea nemoralis, Stylommato- phora, Cerithioidea, and when only transversions are included, the Bivalvia. The phylogenetic limits of the mitochondrial LSU rRNA gene within mollusks appear to be up to 400 million years, although this estimate will have to be tested further with additional taxa. Our most novel finding was the discovery of phylogenetic signal in the secondary structure of rRNA of mollusks. The absence of entire stem/loop structures in Domains II, III, and V can be viewed as three shared derived characters uniting the stylommatophoran gastropods. The absence of the aforementioned stem/loop struc- ture explains much of the observed length variation of the mitochondrial LSU rRNA found within mollusks. The distribution of these unique secondary structure characters within mollusks should be examined. ௠ 2000 Academic Press Key Words: LSU mitochondrial DNA; 16S mitochon- drial DNA; 23S-like rRNA; ribosomal RNA secondary structure; mollusks; bivalves; chiton; gastropods; pul- monates; molecular phylogeny; gene utility INTRODUCTION Molecular systematics and molecular evolution can be reciprocally illuminating. Since molecular evolution- ary studies are conducted in a phylogenetic context, tremendous opportunity exists for improving the mod- els and assumptions used for phylogenetic reconstruc- tion. One important challenge is to distinguish phyloge- netically informative changes from potential ‘‘noise’’ generated from multiple substitutions that may accrue at a single site. Conservative sites and changes are better indicators of phylogenetic history because they are less likely to experience parallel and back muta- tions. For example, for deep phylogenetic questions, it is often best to downweight or exclude transitions in the third codon position of a protein-encoding gene (e.g., Lydeard and Roe, 1997). Knowledge of nucleotide substitution patterns helps investigators make objective decisions regarding weight- ing to increase the likelihood of recovering an accurate phylogeny. Indeed, justification for a variety of com- monly employed weighting strategies was demon- strated in an analysis of linked mitochondrial genes in the mammalian order Artiodactyla (Miyamoto et al., 1994). In addition to their value for understanding nucleotide substitution patterns, sequence alignments are crucial for phylogenetic reconstruction because positional homology is assumed to be accurate prior to estimating phylogeny. There are many ways to align a nucleotide sequence data matrix: manual (visual) align- ment, a multiple sequence alignment software package like CLUSTAL W or MALIGN (Thompson et al., 1994; Wheeler and Gladstein, 1991; respectively), and utiliz- ing information from the structure of the gene. Many studies have highlighted the importance of alignment on phylogenetic reconstruction (e.g., Gatesy et al., 1993; Kjer, 1995; Hickson et al., 1996). Indeed, the use of the ribosomal RNA (rRNA) secondary structure informa- tion in combination with a computer-assisted optimal- ity approach resulted in a marked increase in the number of alignments that recovered a topology congru- ent with a well-corroborated morphological hypothesis in comparison to those alignments based on the com- puter-assisted approach alone (Titus and Frost, 1996). Ribosomal RNA genes have received considerable attention from biologists. Because rRNAs are involved in the synthesis of proteins and are present in all life forms (Woese, 1987; Woese et al., 1990), it was rational- Molecular Phylogenetics and Evolution Vol. 15, No. 1, April, pp. 83–102, 2000 doi:10.1006/mpev.1999.0719, available online at http://www.idealibrary.com on 83 1055-7903/00 $35.00 Copyright ௠ 2000 by Academic Press All rights of reproduction in any form reserved.
  • 2. ized that they will have an imprint of their evolutionary history encoded in their sequence. The ribosomal small subunit (SSU) contains the 16S rRNA in prokaryotes, the 18S rRNA in the eukaryotic cytoplasm, and the 12S rRNA in animal mitochondria. The ribosomal large subunit (LSU) contains the 23S rRNA in prokaryotes, the 26S–28S rRNA gene in the eukaryotic cytoplasm, and the 16S rRNA in animal mitochondria. Ribosomal RNA sequences fold into complex second- ary structures based largely on intramolecular base pairing. Experimental methods have elucidated some of the rRNA secondary and tertiary structure (Noller, 1984, 1991; Zimmermann and Dahlberg, 1996). How- ever, the vast majority of the rRNA secondary structure models have been determined with comparative se- quence analyses (Woese et al., 1980; Noller et al., 1981; Gutell et al., 1994; Gutell, 1996). The comparative approach was first used to establish the so-called cloverleaf configuration of tRNA and is based on posi- tional covariance in an alignment of RNA sequences (Gutell et al., 1994). Two positions covary when nucleo- tide substitutions at one column in a sequence align- ment are correlated with a similar pattern of substitu- tions at another position. The earliest models of rRNA secondary structure have been improved over the years (see Gutell et al., 1993; Gutell, 1994) and additional services are provided by the Ribosomal Database Project (Maidak et al., 1997). Mitochondrial (mt) rRNA genes have attracted a great deal of attention from molecular systematists (reviews by Mindell and Honeycutt, 1990; Hillis and Dixon, 1991). Some of the earliest studies conducted substantiated the endosymbiotic model of eukaryotic origin comparing mitochondrial ribosomal gene se- quences with homologous bacterial and nuclear cyto- plasmic genes of eukaryotes (Yang et al., 1985; Woese, 1987). In addition, with the advent of mitochondrial ‘‘universal’’ primers (Kocher et al., 1989; Palumbi et al., 1991; Simon et al., 1994), which permit the amplifica- tion of specific gene regions of homologous DNA via the polymerase chain reaction (PCR) (Saiki et al., 1985), there has been a veritable explosion in studies employ- ing mt rRNA genes for systematic studies. Unfortu- nately, many investigators employing mt rRNA gene sequences do not utilize information from the second- ary structure models to aid in the alignment of their data set and some use models proposed for distantly related taxa. Part of the problem associated with using secondary structure models is simply the lack of avail- able rRNA sequences for many taxa. For example, of the 40 animal mitochondrial LSU complete or near complete rRNA sequences reported in 1993, 7 are from arthropods, 28 are from chordates (with ca. 85% of the chordates being mammals), 2 are from echinoderms, 2 are from nematodes, and only 1 is from a mollusk (Gutell et al., 1993). One significantly underrepre- sented group is the phylum Mollusca. Mollusks are an extraordinarily diverse group of animals with an estimated 200,000 species, second only to the phylum Arthropoda. Mollusks constitute an amazing morphological array of species, including the familiar gastropods, cephalopods, scaphopods, bi- valves, and chitons and the more obscure Tryblidia, solenogasters, and scutopods. Mollusks made their first fossil appearance in the Cambrian explosion along with many other experimental ‘‘phylo-types,’’ and many of the classes appear shortly after the Cambrian explo- sion. Surprisingly, despite the ecological and/or eco- nomic importance of many of the species of mollusks, few molecular systematic studies have employed the useful mt rRNA genes (e.g., Lieberman et al., 1993; Lydeard et al., 1996, 1997, 1998; Mulvey et al., 1997; Douris et al., 1998). The aforementioned studies that have been conducted relied on arthropod secondary structure models for alignment purposes. Today there are ca. 180 complete (or nearly so) LSU rRNA animal mitochondrial sequences. Of these, there are 10 arthropod, 150 chordate, 6 echinoderm, 1 hemi- chordate, 2 annelid, and 10 mollusk sequences. Within the mollusks, there are 1 chiton, 2 bivalves, 6 gastro- pods, and 1 cephalopod. In this paper, we conduct a comparative analysis of the complete mollusk mt LSU sequences and determine secondary structure models for them. As in the detailed analysis presented by Hickson et al. (1996) on the third domain of animal mitochondrial SSU rRNA, these data will provide an important foundation for future research on the mol- lusk mt LSU rRNA sequences. MATERIALS AND METHODS Table 1 lists the 10 mollusk species examined in this study and their placement in a classification scheme of mollusks (Salvini-Plawen and Steiner, 1996; Ponder and Lindberg, 1997; Vaught, 1989). Cacozeliana lac- ertina (New South Wales, Long Reef, collected, N of Sydney, 33°45ЈS, 151°19ЈE upper intertidal under rocks in gutters, 15 April 1996; source Winston Ponder; Sydney Museum, Australia) and Paracrostoma palu- diformis (labeled Brotia sp., Thailand, Field Museum of Natural History FMNH 15706; species identified by Matthias Glaubrecht, Berlin Museum, Germany) ge- nomic DNA was isolated by standard phenol/chloro- form extraction. Approximately 100 ng of genomic DNA provided a template for double-stranded reactions via the PCR in 25 µl of a reaction solution containing each dNTP at 0.1 mM, a pair of LSU primers at 10 µM, 4.0 mM MgCl2, 2.5 µl 10ϫ reaction buffer, and 1.25 units of AmpliTaq polymerase. DNAwas amplified for 32 cycles, each involving denaturation at 92°C for 45 s, annealing at 52°C for 45 s, and extension at 72°C for 60 s. The mt LSU rRNA amplification primer pairs used were LR-N- 12948 and N1-J-12585 (modified from Simon et al., 1994), L2510 and H3080 (Palumbi et al., 1991), and 84 LYDEARD ET AL.
  • 3. SR-14231 and SNL002 (Lydeard et al., 1997). Single- stranded DNA was obtained by asymmetric amplifica- tion (Gyllensten and Erlich, 1988) using a single primer in limited quantity, concentrated on Millipore Ultrafree MC filters, and sequenced using the Sequenase version 2 kit (Amersham Life Science) with 35S-labeled dATP. In addition to the amplification primers, the following primers were used as independent sequencing primers to give overlapping fragment products: SNL-N-003, SNL-N-004, and LR-J-13114. Primer sequences or sources and relative position are provided in Table 2. The complete mtDNA LSU rRNA gene sequences for the remaining mollusk and outgroup specimens (Table 1) were retrieved from GenBank and include the follow- ing: Cepaea nemoralis (Terrett et al., 1996; U23045), Euhadra herklotsi (Yamazaki et al., unpublished; Z71693), Albinaria coerulea (Hatzoglou et al., 1995; X83390), Albinaria turrita (Lecanidou et al., 1994; X71393, X71394), Loligo bleekeri (Tomita et al., 1998; AB009838), Mytilus edulis (Hoffmann et al., 1992; M83756), Pecten maximus (Sellos, D., Mommerot, M., and Rigaa, A., unpublished; X92688), Katharina tuni- cata (Boore and Brown, 1994; U09810), Lumbricus terrestris (Boore and Brown, 1995; U24570), and Dro- sophila melanogaster (Kobayashi and Okada, 1990; X53506). Secondary structure diagrams for the mollusk mito- chondrial LSU rRNAs were modeled from the current 23S rRNA structure model with comparative sequence analysis (Gutell, 1996). This method is based on the simple premise that RNAs within the same family (e.g., 23S rRNAs) have very similar secondary and tertiary structures, regardless of the differences in their nucleo- tide sequences. Today, the starting point for our analy- sis is the comparatively inferred structure model and our structure-based alignment of 23S and 23S-like (LSU) rRNA sequences. In 1999, both the structure model and the alignments are well defined—having undergone more than 15 years of analysis, evaluation, and refinement. For the current analysis, the mollusk sequences were aligned with other invertebrate mito- chondrial sequences with the Escherichia coli 23S rRNA sequence included as a reference. Positions that can be aligned with the most confidence were aligned first. After the most conserved nucleotides were juxta- posed, positions with less sequence similarity were aligned and evaluated at base-paired positions for their TABLE 3 Summary Statistics of Structural Domains of Mitochondrial LSU rRNA of Mollusks Domain Rangea No. of nucleotidesb PIc I 49–143 0 0 I/II ‘‘link’’ 17–18 18 6 II 327–422 218 167 II/III ‘‘link’’ 9–14 14 7 III 0–54 0 0 IV 213–231 221 96 IV/V ‘‘link’’ 32–34 34 22 V 268–414 279 135 VI 44–113 36 21 a The min–max range of number of nucleotides within mollusks. b The number of unambiguously aligned nucleotides. c The number of phylogenetically informative sites among all taxa within unambiguously aligned nucleotides. TABLE 1 Representative Taxa and Classification Scheme of Taxa Used in the Study Mollusca Polyplacophora Katharina tunicata Conchifera Bivalvia Pteroidea Pecten maximus Mytiloidea Mytilus edulis Cephalopoda Loligo bleekeri Gastropoda Caenogastropoda Cerithioidea Thiaridae Paracrostoma paludiformis Batillariidae Cacozeliana lacertina Heterobranchia Stylommatophora Clausilioidea Clausiliidae Albinaria turrita Albinaria coerulea Helicoidea Bradybaenidae Euhadra herklotsi Helicidae Cepaea nemoralis TABLE 2 Source or Sequence of Amplification and Sequencing Primers Used in the Present Study Source or sequence Location/direction Sr-14231 Lydeard et al., 1997 12S rRNA gene SNL-N-003 5Јccttccaagtagaaagatta3Ј tRNA glycine gene SNL-N-004 5Јcyttttgtatcatggtttagc3Ј 135 to 155 L2510 Palumbi et al., 1991 642 to 661 SNL002 Lydeard et al., 1997 756 to 736 LR-J-13114 5Јtgttcctyagtcgccccaac3Ј 962 to 942 LR-N-12948 5Јttgtgacctcgatgttggac3Ј 1086 to 1105 H3080 Palumbi et al., 1991 1188 to 1167 N1-J-12585 5Јggtccttttcgaatttgaatatatcc3Ј ND1 gene Note. Location and direction is relative to the 16S rRNA secondary structure model of chiton, Katharina tunicata. 85MOLLUSCAN MITOCHONDRIAL rDNA SEQUENCES
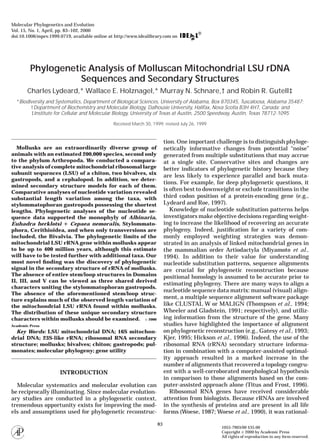
  • 4. FIG. 1. Secondary structure model of Katharina tunicata mitochondrial LSU rRNA. (A) 5Ј-half including Domains I, II, and III. (B) 3Ј-half including Domains IV, V, and VI. Structural Domains are shaded. 86 LYDEARD ET AL.
  • 5. ability to form canonical (G–C, A–U, and G–U) base pairs in the 23S rRNA structure model. Sequences were manually adjusted with the alignment editor AE2 (Maidak et al., 1997; T. Macke at the Scripps Clinic, San Diego, CA) to minimize the number of insertion/ deletion events, to maximize the degree of sequence identity, and to maintain our previously proposed base pairings. The secondary structure diagrams were gener- ated with the interactive graphics program XRNA, developed by B. Weiser and H. Noller (ftp://fangio.ucsu. edu/pub/XRNA/), which runs on SUN Microsystems computers. Nucleotide variation and substitution patterns were examined using the software package MEGA (Kumar et al., 1993; version 1.01). ␹2 test of homogeneity of base frequencies across taxa was conducted using PAUP* (Phylogenetic Analysis Using Parsimony (*and other methods), version 4.0b1; Swofford, 1998). Phylogenies were estimated by maximum-parsimony analysis using the heuristic search option (25 replicates) of PAUP*. Bootstrapping (Felsenstein, 1985) was em- ployed to measure the internal stability of the data using 200 iterations. The skewness of tree length distributions as a measure of phylogenetic information content (Hillis and Huelsenbeck, 1992) was tested by generating 10,000 random trees. The two generated DNA sequences were submitted to GenBank (Accession Nos. AF101007 and AF101008). The secondary struc- ture models are available electronically at http:// www.rna.icmb.utexas.edu. FIG. 1— Continued 87MOLLUSCAN MITOCHONDRIAL rDNA SEQUENCES
  • 6. FIG. 2. Mollusk consensus diagram based on superimposing the 10 mollusk sequences onto the Katharina tunicata large subunit ribosomal RNA secondary structure diagram. Positions with a nucleotide in all 10 sequences are shown in one of four categories. Uppercase letters are for positions that are conserved in all 10 sequences, lowercase letters are conserved in 9/10 sequences, solid circles are for positions conserved in 8/10 sequences, and open circles are for positions conserved in less than 8/10 sequences. Positions with at least one deletion are shown with arcs; the arc labels indicate the upper and lower number of nucleotides known to exist within the variable region. We designated arcs with a range of 4 or more nucleotides as ambiguous (one exception is the arc with a range of 3–25 nt in Domain V, largely due to the absence of this region in stylommatophoran gastropods). 88 LYDEARD ET AL.
  • 7. RESULTS AND DISCUSSION Mitochondrial LSU rRNA Variation The length of the complete mitochondrial LSU rRNA gene is 1035 nt, Albinaria coerulea; 1077 nt, Albinaria turrita; 1024 nt, Euhadra herklotsi; 1004 nt, Cepaea nemoralis; 1342 nt, Cacozeliana lacertina; 1360 nt, Paracrostoma paludiformis; 1302 nt, Loligo bleekeri; 1411 nt, Pecten maximus; 1244 nt, Mytilus edulis; 1275 nt, Katharina tunicata; and for the outgroup taxa 1325 nt, Drosophila melanogaster and 1245 nt, Lumbricus terrestris. Terrett et al. (1996) reported the gene length of Cepaea nemoralis to be 1210 nt, which is due to their including additional sequence at the 5Ј-end of the gene. Determining the exact 5Ј- and 3Ј-terminal ends of the gene can be problematic, but both estimates for Cepaea nemoralis are consistent with the shorter lengths ob- served for other stylommatophoran gastropods. The stylommatophoran gastropods have the shortest gene lengths reported for coelomate metazoans; however, they are longer than those observed in nematodes, ca. 960 nt (Wolstenholme, 1992; Okimoto et al., 1992). The remaining molluscan taxa exhibit lengths that are somewhat shorter than this sampling of other metazo- ans, including humans, 1558 nt (Anderson et al., 1981); 1640 nt in the frog, Xenopus leavis (Roe et al., 1985), and 1525 nt in the sea urchin, Strongylocentrotus purpuratus (Jacobs et al., 1988). FIG. 2— Continued 89MOLLUSCAN MITOCHONDRIAL rDNA SEQUENCES
  • 8. Considerable length variation among mollusks exists within each of the six structural domains (Table 3). Length variation is exhibited at the 5Ј and 3Ј ends of the mitochondrial LSU rRNA (Domains I and VI) among molluscan species. However, considerable length variation among taxa is also attributed to the presence or absence of entire helical/loop structures within par- ticular domains, including Domains II, III, and V. The stylommatophoran gastropods consistently possessed shorter domain lengths than all the other molluscan taxa examined. The significance of this variation will be discussed further under Phylogenetic Content of Second- ary Structural characters. The secondary structure model of Katharina tunicata 23S-like rRNA is shown in Fig. 1. Secondary structure models for the other mollusk mitochondrial LSU rRNA are available online (http://www.rna.icmb.utexas.edu). The general shape of the six structural domains (see Fig. 1) shows remarkable conservation with those of other metazoans (e.g., Gutell et al., 1993). The consen- sus of 10 mitochondrial 23S-like rRNA sequences (see Table 1) was superimposed onto the K. tunicata LSU rRNA secondary structure diagram (Fig. 2). The nucle- otides at the most conserved positions (constant in 10/10 and 9/10 sequences) are shown as upper- and lowercase letters. Positions conserved in 8/10 and 7/10 and fewer are shown with closed and open circles. Positions in K. tunicata that are deleted in one or more mollusk sequences are shown with an arc line. Fewer conservative sites (90%ϩ) were found in the 5Ј-half (64) than in the 3Ј-half (230) of the gene (Fig. 2). Table 3 provides the number of unambiguously aligned nucleotides and phylogenetically informative (PI) sites for each domain. We designated all regions with a high degree of length variation among taxa (i.e., 4 or more nucleotides) as ambiguous (one exception is the arc with a range of 3–25 nt in Domain V, due to the absence of this region in stylommatophoran gastro- pods). These highly variable regions are referred to as arcs on Fig. 2. Ambiguous areas of alignment are data dependent and some of the same regions would not necessarily be deemed ambiguous in a study focusing on more taxonomically restricted groups (e.g., cerithioi- dean or stylommatophoran gastropods). A scatterplot (Fig. 3) of pairwise genetic sequence differences (p-distance) versus the absolute number of transitions (ts) and absolute number of transversions (tv) among all taxa shows that transversions outnum- ber transitions for all pairwise comparisons. This atypi- cal finding is probably a function of scale and site saturation of transitions. Lydeard et al. (1997, 1998) examined an approximately 900-nt section of the mito- chondrial LSU rRNA gene in pleurocerid gastropods and obtained a typical pattern of ts outnumbering tv up to about 20% sequence difference (p-distance). At or near the 20% value ts began to level off, and tv began to outnumber ts, indicating saturation of ts. Although not directly comparable, all taxon pairwise comparisons in the present study are greater than 20% different. The same observations of biased sampling of more distantly related taxa influencing the lack of transitional bias has been observed in insects (Derr et al., 1992; Fang et al., 1993; Han and McPheron, 1997). Nucleotide Base Composition Base compositional bias is common in DNA se- quences. For example, the mitochondrial genome of insects is typically very A and T rich (e.g., Simon et al., FIG. 3. A pairwise sequence comparison scatterplot showing absolute number of transitions and transversions against percentage sequence difference (p-distance; uncorrected for multiple hits). Transitions, closed boxes; transversions, open boxes. 90 LYDEARD ET AL.
  • 9. 1994). Table 4 provides the nucleotide composition of all 12 taxa examined in this study. The average percentage of each nucleotide among all mollusks is A ϭ 34.5%, T ϭ 33.7%, C ϭ 13.1%, and G ϭ 18.7%. There is a deficiency of G ϩ C (average among all mollusks ϭ 31.8%) and a higher percentage of A ϩ T (68.2%). The percentage A ϩ T in mollusks is higher than that reported in the human (57.2%; Anderson et al., 1981), frog (60.8%; Roe et al., 1985), and fish (Notropis atherinoides, 54.5%; Simons and Mayden, 1998) but lower than that in insects, which are noted for their A ϩ T richness (e.g., D. melanogaster ϭ 82.9%; this study). Loligo bleekeri exhibits the most divergent nucleotide composition in regard to its extreme deficiency of C (only 7.5%) and high percentage of T (40.0%).A␹2 test of homogeneity of base frequencies across taxa revealed significant differ- ences (␹2 ϭ 423.68, df ϭ 33, P Ͻ 0.001). Conventional tree-building methods can be unreliable when the base composition of taxa varies between sequences (Penny et al., 1990; Lockhart et al., 1994). However, using the LogDet transformation (Lockhart et al., 1994) imple- mented in PAUP* (Swofford, 1998), which allows tree- selection methods (e.g., neighbor-joining) to consis- tently recover the correct tree in cases of differing nucleotide compositions, did not alter the topology from those obtained without the LogDet transformation. Phylogenetic Analyses and Phylogenetic Content In an ideal setting, the best way to evaluate the phylogenetic content of a gene tree is to compare it with the known species tree or at least with a well- corroborated phylogeny based on independently de- rived data. One phylogeny that most malacological systematists agree upon in the context of the taxa included in the present study is shown in Fig. 4, which is based on a cladistic analysis of morphological data and current views of classification (Vaught, 1989; Sal- vini-Plawen and Steiner, 1996; Ponder and Lindberg, 1997). Although the phylogeny has not been substanti- ated by many different studies using both molecular and morphological characters, it provides a compara- tive framework for examining the utility of the LSU mtDNAgene. The estimated time of divergence for each node is based on surveying the literature for the earliest known fossil appearance for each higher-order group (e.g., earliest known family for cerithioidean gastropods) and not just the taxa included in the study (Albinaria species: Zilch, 1959–1960; Helicoidea fami- lies: Zilch, 1959–1960; Bandel, 1997; Stylommato- phora: Bandel, 1994; Cerithioidean families: Bandel, 1993; Heterobranchia–Caenogastropoda divergence: Bandel, 1994; Cephalopoda–Gastropoda–Bivalvia split: Moore, 1969; Runnegar, 1996; Yochelson, 1988; Pterioi- dea–Mytiloidea split: Moore, 1969; Conchifera–Polypla- cophora divergence: Smith, 1960; Annelida–Athropoda– Mollusca divergence: Grotzinger et al., 1995; Valentine et al., 1996). Given the lack of congruence for estimates of the age of many molluscan taxa among studies, divergence estimates serve only as a crude approxima- tion. The phylogenetic performance of the LSU mtDNA gene was evaluated using taxonomic congruence. Obser- vation of congruent patterns in the molecular phylog- eny and the morphological-based phylogeny indicates that the two independently derived phylogenies have converged on the best estimate of the true phylogeny. Areas of incongruence in the morphological- and molecu- lar-based phylogenetic hypotheses may be due to sev- eral factors: (1) the gene tree is incorrect and does not provide useful phylogenetic information, (2) the morpho- logical tree is incorrect, or (3) both trees are incorrect because the data are ambiguous. Given the well- corroborated, monophyletic status of the taxa exam- ined in this study (Table 1), however, we will presume that incongruence is due to the molecular-based phylog- eny being incorrect. Consequently, the nine nodes of interest on the morphological-based phylogeny are treated as the ‘‘expected’’ phylogeny and congruence indicates ‘‘correct’’clades observed (Cunningham, 1997). This approach allows for an objective evaluation of phylogenetic content of molecular data (e.g., Graybeal, 1994). Phylogenetic analyses were conducted using two different strategies for detecting stability in the resul- tant topologies and for compensating for potential site saturation. The following maximum-parsimony analy- ses were conducted: unordered, equal weight for all substitutions and transversions only. Phylogenetic analyses were conducted excluding ambiguous areas of alignment for each of the two approaches. An aligned nexus file with E. coli included as a reference taxon is available from the authors. Maximum-parsimony analy- sis using equal weighting yielded one most-parsimoni- ous tree (Fig. 5A) with a total length (TL) of 1911 and a consistency index (CI) of 0.543, excluding uninforma- tive characters. A constraint tree depicting current views of molluscan relationships (Fig. 4) was 60 steps TABLE 4 Percentage Nucleotide Base Composition of Molluscan Taxa Included in Study A T C G Albinaria turrita 36.0 35.6 12.9 15.5 Albinaria coerulea 38.5 34.7 12.4 14.5 Euhadra herklotsi 35.9 37.0 12.1 15.0 Cepaea nemoralis 29.7 31.7 16.6 22.0 Cacozeliana lacertina 34.6 28.9 15.9 20.6 Paracrostoma paludiformis 36.1 31.0 14.3 18.7 Loligo bleekeri 34.4 40.0 7.5 18.0 Mytilus edulis 32.0 33.4 13.3 21.4 Pecten maximus 28.1 31.8 13.8 26.4 Katharina tunicata 40.1 34.0 12.8 13.2 Average 34.5 33.7 13.1 18.7 91MOLLUSCAN MITOCHONDRIAL rDNA SEQUENCES
  • 10. longer, which is significantly different from the most- parsimonious tree based on Templeton’s (1983) Wil- coxon signed-rank test as implemented in PAUP* (P Ͻ 0.001). Four of the nine expected clades are ‘‘cor- rect’’(4/9 ϭ 44.4% ϭ % clades correct (ϭ%CC); see Cun- ningham, 1997). The bootstrapped %CC is the average bootstrap support for each clade in the expected tree (Cunningham, 1997), which in this case is 44.05%, indicating low bootstrap support for the nine expected nodes. The four correct clades include Albinaria tur- rita ϩ Albinaria coerulea, Euhadra ϩ Cepaea, stylom- matophoran gastropods, and cerithioidean gastropods. A monophyletic Bivalvia was only 2 more steps and not significantly longer in length (P ϭ 0.763). Average boot- strap support for the four correct clades is 93.6%. Interestingly, the five expected nodes that failed to appear in the gene tree were the most basal nodes (i.e., Bivalvia, Gastropoda, Cephalopoda ϩ Gastropoda, Bivalvia ϩ Gastropoda ϩ Cephalopoda, and Mollusca), which diverged within a roughly 150-million-year span. The g1 value is significant (g1 ϭ Ϫ1.133), indicating strong phylogenetic signal, likely a response to the four strongly supported nodes. The maximum-parsimony analysis of all taxa using Drosophila and Lumbricus as outgroup taxa and only transversions resulted in a single most-parsimonious tree (TL ϭ 1071; g1 ϭ Ϫ1.086) (Fig. 5B). The topology differs in the placement of some taxa; however, five of nine nodes (55.5%) are depicted as correct, with the Bivalvia being monophyletic. The other four correct clades were identical to those found in the phylogenetic analysis using equal weighting (Fig. 5A). The bootstrap %CC for the nine expected nodes is 46.9%, which is slightly higher than the support obtained when transi- tions are included (44.05%). The topology obtained differs significantly from the traditional molluscan phylogeny (P Ͻ 0.01). The four correct clades obtained in both of the FIG. 4. Phylogenetic hypothesis of Mollusca and estimated dates of divergence (millions of years) based on first appearance in fossil record. See text for literature examined to obtain phylogeny and estimates of divergence times. 92 LYDEARD ET AL.
  • 11. aforementioned maximum-parsimony analyses span an estimated range of less than 360 million years among the gastropods (Fig. 4), based on the first fossil appearance. Using an annelid and an arthropod as outgroups extends the divergence time back to 525–545 mya, which appears to be beyond the resolving power of the mitochondrial LSU gene. Kumazawa and Nishida (1993) examined the phylogenetic utility of the mito- chondrial cytochrome b (cyt b) gene by looking at the phylogenetic relationships among a mouse, rat, cow, human, chicken, and frog using a sea urchin to root the tree. Kumazawa and Nishida (1993) obtained high bootstrap support for the mouse–rat clade and mam- mal clade (nearly 95%); however, the frog was sister to the mammals instead of the chicken, suggesting prob- lems associated with rooting the tree. Reanalysis exclud- ing the sea urchin, however, resulted in the correct topology and high bootstrap values, supporting the notion that the cyt b gene simply could not resolve relationships for nodes deeper than 525 mya. Likewise, we were interested in determining whether the lack of resolution was due to a rooting problem (i.e., too deep of a node to properly root the tree). The lack of a monophy- letic Mollusca supports this contention. Therefore, we conducted a maximum-parsimony analysis excluding Drosophila, Lumbricus, and Katharina tunicata, which diverged over 500 mya, and used the two bivalve species to root the tree. Maximum-parsimony analysis using transitions and transversions (equal weight) resulted in a single most- parsimonious tree with TL ϭ 1440 and CI ϭ 0.652 (Fig. 6A). The %CC ϭ 4/6 ϭ 66.66% and the bootstrap %CC ϭ 71.66%. The most-parsimonious topology is not significantly different from the traditional molluscan phylogeny (P ϭ 0.272). The g1 value was significant (g1 ϭ Ϫ1.075). Maximum-parsimony analysis of only transversions yielded a single most-parsimonious tree (TL ϭ 785; g1 ϭ Ϫ0.942). The topology is shown in Fig. 6B. The %CC ϭ 5/6 ϭ 83.33% and the bootstrap %CC ϭ 68.5%. The topology is not statistically different from the traditional molluscan phylogeny (P ϭ 0.134). The topology obtained using only transversions results in a Cephalopoda ϩ Gastropoda clade; however, gastropods are still not rendered monophyletic. The %CC and bootstrap %CC values were higher for the analyses without Katharina tunicata, Lumbricus terrestris, and Drosophila melanogaster than the values obtained when including all taxa in the analyses. These findings are partly due to the exclusion of ‘‘expected’’ or correct clades that were not observed in the phylogenetic analysis that included all taxa (e.g., the Mollusca and Bivalvia ϩ Gastropoda ϩ Cephalopoda clades). Be- cause of the weak support for the Gastropoda ϩ Cepha- lopoda clade and the failure to obtain a monophyletic Gastropoda, it appears that the limits of resolving power of the mitochondrial LSU rRNA gene may be fewer than 400 million years but certainly greater than the 80 mya estimate suggested by Graybeal (1994). Obviously, this estimate will have to be further tested when additional sequences are available and other factors are examined, including rate variation among sites as well as lineages and the effects of long branches (Abouheif et al., 1998; Philiippe and Laurent, 1998). Most previous molluscan molecular systematic stud- ies have used either partial (e.g., Field et al., 1988; Ghiselin, 1988; Adamkewicz et al., 1997; Harasewych et al., 1997a,b, 1998) or complete (e.g., Winnepenninckx et al., 1994, 1996, 1998; Steiner and Mu¨ller, 1996) eukary- otic nuclear cytoplasmic SSU rRNA sequences or par- tial (Ͻ200 nucleotides) eukaryotic nuclear cytoplasmic LSU rRNA sequences (e.g., Tillier et al., 1992; Rosen- berg et al., 1994). Support for monophyly of Mollusca and various classes within the phylum differs among studies (see Winnepenninckx et al., 1996 for review of results). Perhaps the most striking difference is the fact that a phylogeny based on complete SSU rRNA se- quences supports the monophyly of mollusks, gastro- pods, and bivalves in one study (Winnepenninckx et al., 1994) and fails to recover molluscan, gastropod, and bivalve monophyly in another (Winnepenninckx et al., 1996). The only substantial differences between the two studies are the number of taxa and taxonomic sam- pling, which have been shown to be significant factors in phylogenetic reconstruction (e.g., Lecointre et al., 1993; Hillis, 1998; Graybeal, 1998). Winnepenninckx et al., 1996) suggest that the rapid radiation of phyla and molluscan classes has resulted in short internodal differences and the inability to fully resolve relation- ships. Our results support their hypothesis. In con- trast, the eukaryotic nuclear cytoplasmic LSU and SSU rRNA genes seem to be useful for resolving relation- ships within molluscan classes, including bivalves (Steiner and Mu¨ller, 1996; Adamkewicz et al., 1997) and gastropods (e.g., Tillier et al., 1992; Harasewych et al., 1997a,b, 1998). Stems and Loops Some ribosomal RNAinvestigators choose to compart- mentalize the RNA into two components—stems (ϭhe- lices) and loops (ϭunpaired regions)—operating under the assumption that the regions behave differently (e.g., Ortı´ et al., 1996). This appears to be an oversimpli- fication because some nucleotides within stems and loops are highly conserved and others are highly vari- able (see Fig. 2 this study; Gutell et al., 1985; Hickson et al., 1996; Vawter and Brown, 1993; and consensus diagrams posted at http://www.rna.icmb.utexas.edu). Of the 64 positions conserved in more than 90% of the mollusk sequences in the 5Ј-half, 23 (35.9%) are in short unpaired regions and bulges, 20 (31.3%) are in unpaired regions linking Domains I–II and II–III, 12 (18.8%) are in loops, 8 (12.5%) are in internal stems (i.e., strands separated by at least one other set of stem–loop structures), and 1 is in hairpin regions 93MOLLUSCAN MITOCHONDRIAL rDNA SEQUENCES
  • 12. FIG. 5. The single most-parsimonious phylogram obtained based on maximum-parsimony analysis of the complete mitochondrial LSU rRNA gene, excluding ambiguously aligned regions based on (A) equal weighting (TL ϭ 1911; CI ϭ 0.54) and (B) transversions only (TL ϭ 1071). Bootstrap values are shown above nodes having support of greater than 50%. Lumbricus and Drosophila were treated as outgroup taxa. 94 LYDEARD ET AL.
  • 13. FIG. 5— Continued 95MOLLUSCAN MITOCHONDRIAL rDNA SEQUENCES
  • 14. FIG. 6. The single most-parsimonious phylogram obtained based on maximum-parsimony analysis of the complete mitochondrial LSU rRNA gene, excluding ambiguously aligned regions based on (A) equal weighting (TL ϭ 1440; CI ϭ 0.65) and (B) transversions only (TL ϭ 785). Bootstrap values are shown above nodes having support of greater than 50%. The two bivalve species (Mytilus edulis and Pecten maximus) were treated as outgroup taxa. 96 LYDEARD ET AL.
  • 15. FIG. 6— Continued 97MOLLUSCAN MITOCHONDRIAL rDNA SEQUENCES
  • 16. 98 7
  • 17. (strands separated by a single, unpaired loop struc- ture). Of the 230 90%ϩ conserved sites in the 3Ј-half, 86 (37.4%) are in short unpaired regions and bulges, 4 (1.7%) are in unpaired regions linking Domain IV–V, 31 (13.5%) are in loops, 39 (17.0%) are in internal stems, and 73 (30.4%) are in hairpin regions. Molecular systematists are interested in discovering molecular characters that are going to yield a robust phylogeny. One question that we examined was whether there was any pattern in where the most conservative phylogenetically informative sites were located in the context of the ribosomal RNA secondary structure model. This issue was investigated by generating a molecular phylogeny constraining the topology to pro- duce the ‘‘correct’’ tree shown in Fig. 4 and mapping the characters with a retention index (RI) of 1.0 (from unambiguously aligned regions) on the ribosomal RNA secondary structure model of Katharina tunicata. The retention index expresses the fraction of apparent synapomorphy in the character that is retained as synapomorphy on the tree (Farris, 1989). A synapomor- phy is a shared-derived character. Forty-nine charac- ters were found that had a retention index of 1.0. The vast majority of the 49 characters represented synapo- morphies for the stylommatophoran gastropods, the cerithioidean gastropods, and the bivalves revealed in the unconstrained phylogeny. Of the 15 characters that had an RI of 1.0 in the 5Ј-half, 4 are in short unpaired regions and bulges, 2 are in unpaired regions linking Domain I–II, 2 are in loops, 4 are in internal stems, and 3 are in hairpin regions. Of the 34 characters that had an RI of 1.0 in the 3Ј-half, 4 are in short unpaired regions and bulges, 3 are in unpaired regions linking Domain IV–V, 2 are in loops, 8 are in internal stems, and 17 are in hairpin regions. Interestingly, 25 of 49 characters with an RI of 1.0 were located within three nucleotides of an invariant character, suggesting that the most conservative phylogenetically informative sites are located in highly conservative regions of the gene. Phylogenetic Content of Secondary Structural Characters Woese (1987) and later Gutell (1992) envisioned the possible reconstruction of a phylogenetic tree of metazo- ans based on a phylogenetic analysis of secondary structure of rRNA. During our comparative analysis of FIG. 7. (a) Ribosomal RNA secondary structure models of two regions from Domain II (ϭcharacter 1) and Domain V (ϭcharacter 2), showing variation among taxa. (b) Data matrix based on the qualitative coding of three characters. Character 1 ϭ Domain II, presence (1) or absence (0) of stem-loop structure; character 2 ϭ Domain V, stem/bulge/stem/loop structure (0), stem/bulge/stem/bulge/stem/loop structure (1); character 3 (not shown) ϭ presence of Domain III (1) or absence of Domain III (0). (c) Placement of three characters in the context of the entire ribosomal rRNA secondary structure of K. tunicata. 99MOLLUSCAN MITOCHONDRIAL rDNA SEQUENCES
  • 18. molluscan secondary structure models, it became appar- ent that there may be phylogenetic signal. To examine the phylogenetic content in the secondary structure models, a data matrix was constructed based on a qualitative analysis of variable stem/loop structures. We chose to code only potentially phylogenetically informative sites and excluded autapomorphies (charac- ters unique to a single taxon). The final data matrix and two of the three characters are presented in Fig. 7 (character 3 is the presence or absence of Domain III). A maximum-parsimony analysis of the three ribosomal RNAsecondary structural characters (unordered; equal weight), including all taxa with Drosophila and Lumbri- cus as outgroups, yielded a single most-parsimonious tree (TL ϭ 3; CI ϭ 1.0) with characters 1 (loss of stem loop structure in Domain II) and 2 (stem/bulge/stem/ loop structure in Domain V) uniting the stylommatopho- ran gastropods and character 3 (absence of Domain III) uniting stylommatophoran gastropods ϩ Drosophila. Obviously, if we constrained the monophyly of the Mollusca, the loss of Domain III would be depicted as two independent evolutionary events. Given that the three coded characters yielded synapomorphies for stylommatophoran gastropods, it appears that there is indeed phylogenetic signal in the secondary structure of rRNA that is worthy of future investigation not only in mollusks but in all metazoans. ACKNOWLEDGMENTS Thanks are extended to R. Minton, K. Roe, P. J. West, and the Advanced Systematics Discussion Group at U.A. for helpful com- ments on the manuscript and to R. Minton for assistance with Figs. 5 and 7 and J. Cannone for Figs. 1 and 2. Thanks are also given to M. Glaubrecht, W. Ponder, and B. Roth for help finding relevant litera- ture on molluscan fossils. This research was supported in part by a Research Grants Committee Award (2-67858) from the University of Alabama and the National Science Foundation (DEB-9707623) to C.L. and the National Institutes of Health (GM48207) to R.R.G. REFERENCES Abouheif, E., Zardoya, R., and Meyer, A. (1998). Limitations of metazoan 18S rDNA sequence data: Implications for reconstruct- ing a phylogeny of the animal kingdom and inferring the reality of the Cambrian explosion. J. Mol. Evol. 47: 394–405. Adamkewicz, S. L., Harasewych, M. G., Black, J., Saudek, D., and Bult, C. J. (1997). A molecular phylogeny of the bivalve mollusks. Mol. Biol. Evol. 14: 619–629. Anderson, S., Bankier, A. T., Barrell, B. G., de Bruijn, M. H. L., Coulson, A. R., Drouin, J., Eperon, I. C., Nierlich, D. P., Roe, B. A., Sanger, F., Schreier, P. H., Smith, A. J. H., Staden, R., and Young, I. G. (1981). Sequence and organization of the human mitochon- drial genome. Nature 290: 457–465. Bandel, K. (1993). Caenogastropoda during Mesozoic times. In ‘‘Mol- luscan Palaeontology’’ (A. W. Janssen and R. Janssen, Eds.), pp. 7–56. 11th International Malacological Congress Siena, Italy, Symposium Proceedings. Scripta Geologica, Special Issue 2, Leiden. Bandel, K. (1994). Triassic euthyneura (Gastropoda) from St. Cassian Formation (Italian Alps) with a discussion on the evolution of the Heterostropha. Freiberger Forschungshefte C 452: 79–100. Bandel, K. (1997). Higher classification and pattern of evolution of the Gastropoda: A synthesis of biological and paleontological data. Cour. Forsch. Inst. Senckenberg 201: 57–81. Boore, J. L., and Brown, W. M. (1994). Complete DNA sequence of the mitochondrial genome of the black chiton, Katharina tunicata. Genetics 138: 423–443. Boore, J. L., and Brown, W. M. (1995). Complete sequence of the mitochondrial DNA of the annelid worm Lumbricus terrestris. Genetics 141: 305–319. Cunningham, C. W. (1997). Can three incongruence tests predict when data should be combined? Mol. Biol. Evol. 14: 733–740. Derr, J. N., Davis, S. K., Woolley, J. B., and Whartono, R. A. (1992). Reassessment of the 16S rRNA nucleotide sequence from members of the parasitic Hymenoptera. Mol. Phylogenet. Evol. 1: 338–341. Douris, V., Giokas, S., Lecanidou, R., Mylonas, M., and Rodakis, G. C. (1998). Phylogenetic analysis of mitochondrial DNA and morpho- logical characters suggest a need for taxonomic re-evaluation within the Alopiinae (Gastropoda: Clausiliidae). J. Moll. Stud. 64: 81–92. Fang, Q., Black, W. C., Blocker, H. D., IV, and Whitcomb, R. F. (1993). A phylogeny of New World Deltocephalus-like leafhopper genera based on mitochondrial 16S ribosomal DNA sequences. Mol. Phylo- genet. Evol. 2: 119–131. Farris, J. S. (1989). The retention index and the rescaled consistency index. Cladistics 5: 417–419. Felsenstein, J. F. (1985). Confidence limits on phylogenies: An approach using the bootstrap. Evolution 39: 783–791. Field, K. G., Olsen, G. J., Lane, D. J., Giovannoni, S. J., Ghiselin, M. T., Raff, E. C., Pace, N. R., and Raff, R. A. (1988). Molecular phylogeny of the animal kingdom. Science 239: 748–753. Gatesy, J., Desalle, R., and Wheeler, W. (1993). Alignment-ambiguous nucleotide sites and the exclusion of systematic data. Mol. Phylo- genet. Evol. 2: 152–157. Ghiselin, M. T. (1988). The origin of molluscs in the light of molecular evidence. In ‘‘Oxford Surveys in Evolutionary Biology’’ (P. H. Harvey and L. Partridge, Eds.), Vol. 5, pp. 66–95. Oxford Univ. Press, New York. Graybeal, A. (1994). Evaluating the phylogenetic utility of genes: A search for genes informative about deep divergences among verte- brates. Syst. Biol. 43: 174–193. Graybeal, A. (1998). Is it better to add taxa or characters to a difficult phylogenetic problem? Syst. Biol. 47: 9–17. Grotzinger, J. P., Bowring, S. A., Saylor, B., and Kauffman, A. J. (1995). New biostratigraphic and geochronologic constraints on early animal evolution. Science 270: 598–604. Gutell, R. R. (1992). Evolutionary characteristics of 16S and 23S rRNA structures. In ‘‘The Origin and Evolution of the Cell’’ (H. Hartman and K. Matsuno, Eds.), pp. 243–309. World Scientific, Singapore. Gutell, R. R. (1994). Collection of small subunit (16S- and 16S-like) ribosomal RNA structures: 1994. Nucleic Acids Res. 22: 3502–3507. Gutell, R. R. (1996). Comparative sequence analysis and the struc- ture of 16S and 23S RNA. In ‘‘Ribosomal RNA: Structure, Evolu- tion, Processing and Function in Protein Biosynthesis’’ (R. A. Zimmermann and A. E. Dahlberg, Eds.), pp. 111–128. CRC Press, New York. Gutell, R. R., Weiser, B., Woese, C. R., and Noller, H. F. (1985). Comparative anatomy of 16S-like ribosomal RNA. Prog. Nucleic Acid Res. Mol. Biol. 32: 155–216. Gutell, R. R., Gray, M. W., and Schnare, M. N. (1993). Compilation of large subunit (23S- & 23S-like) ribosomal RNA structures: 1993. Nucleic Acids Res. 21: 3055–3074. Gutell, R. R., Larsen, N., and Woese, C. R. (1994). Lessons from an evolving rRNA: 16S and 23S rRNA structures from a comparative perspective. Microbiol. Rev. 58: 10–26. 100 LYDEARD ET AL.
  • 19. Gyllensten, U. B., and Erlich, H. A. (1988). Generation of single- stranded DNA by the polymerase chain reaction and its application to direct sequencing of the HLA-DQA locus. Proc. Natl. Acad. Sci. USA 85: 7652–7656. Han, H., and McPheron, B. A. (1997). Molecular phylogenetic study of Tephritidae (Insecta: Diptera) using partial sequences of the mitochondrial 16S ribosomal DNA. Mol. Phylogenet. Evol. 7: 17–32. Harasewych, M. G., Adamkewicz, S. L., Blake, J. A., Saudek, D., Spriggs, T., and Bult, C. J. (1997a). Neogastropod phylogeny: A molecular perspective. J. Moll. Stud. 63: 327–351. Harasewych, M. G., Adamkewicz, S. L., Blake, J. A., Saudek, D., Spriggs, T., and Bult, C. J. (1997b). Phylogeny and relationships of pleurotomariid gastropods (Mollusca: Gastropoda): An assessment based on partial 18S rDNA and cytochrome c oxidase I sequences. Mol. Mar. Biol. Biotechnol. 6: 1–20. Harasewych, M. G., Adamkewicz, S. L., Plassmeyer, M., and Gillevet, P. M. (1998). Phylogenetic relationships of the lower caenogas- tropoda (Mollusca, Gastropoda, Architaenioglossa, Campaniloidea, Cerithioidea) as determined by partial 18S rDNA sequences. Zool. Scripta 27: 361–372. Hatzoglou, E., Rodakis, G. C., and Lecanidou, R. (1995). Complete sequence and gene organization of the mitochondrial genome of the land snail Albinaria coerulea. Genetics 140: 1353–1366. Hickson, R. E., Simon, C., Cooper, A., Spicer, G. S., Sullivan, J., and Penny, D. (1996). Conserved sequence motifs, alignment, and secondary structure for the third domain of animal 12S rRNA. Mol. Biol. Evol. 13: 150–169. Hillis, D. M. (1998). Taxonomic sampling, phylogenetic accuracy, and investigator bias. Syst. Biol. 47: 3–8. Hillis, D. M., and Huelsenbeck, J. P. (1992). Signal, noise, and reliability in molecular phylogenetic analyses. J. Hered. 83: 189– 195. Hillis, D. M., and Dixon, M. T. (1991). Ribosomal DNA: Molecular evolution and phylogenetic inference. Q. Rev. Biol. 66: 411–453. Hoffmann, R. J., Boore, J. L., and Brown, W. M. (1992). A novel mitochondrial genome organization for the blue mussel, Mytilus edulis. Genetics 131: 397–412. Jacobs, H. T., Elliott, D. J., Math, V. B., and Farquarson, A. (1988). Nucleotide sequence and gene organization of sea urchin mitochon- drial DNA. J. Mol. Biol. 202: 185–217. Kjer, K. M. (1995). Use of rRNA secondary structure in phylogenetic studies to identify homologous positions: An example of alignment and data presentation from the frogs. Mol. Phylogenet. Evol. 4: 314–330. Kobayashi, S., and Okada, M. (1990). Complete cDNA sequence encoding mitochondrial large ribosomal RNAof Drosophila melano- gaster. Nucleic Acids Res. 18: 4592. Kocher, T. D., Thomas, W. K., Meyer, A., Edwards, S. V., Pa¨a¨bo, S., Villablanca, F. X., and Wilson, A. C. (1989). Dynamics of mitochon- drial DNA evolution in animals: Amplification and sequencing with conserved primers. Proc. Natl. Acad. Sci. USA 86: 6196–6200. Kumar, S., Tamura, K., and Nei, M. (1993). MEGA: Molecular evolutionary genetics analysis. Institute of Molecular Evolutionary Genetics. Pennsylvania State Univ., University Park, PA. Kumazawa, Y., and Nishida, M. (1993). Sequence evolution of mito- chondrial tRNA genes and deep-branch animal phylogenetics. J. Mol. Evol. 37: 380–398. Lecanidou, R., Douris, V., and Rodakis, G. C. (1994). Novel features of metazoan mtDNA revealed from sequence analysis of three mito- chondrial DNA segments of the land snail Albinaria turrita (Gastropoda: Clausiliidae). J. Mol. Evol. 38: 369–382. Lecointre, G., Philippe, H., Vaˆn Leˆ, H. L., and Le Guyader, H. (1993). Species sampling has a major impact on phylogenetic inference. Mol. Phylogenet. Evol. 2: 205–224. Lieberman, B. S., Allmon, W. D., and Eldredge, N. (1993). Levels of selection and macroevolutionary patterns in the turritellid gastro- pods. Paleobiology 19: 205–215. Lockhart, P. J., Steel, M. A., Hendy, M. D., and Penny, D. (1994). Recovering evolutionary trees under a more realistic model of sequence evolution. Mol. Biol. Evol. 11: 605–612. Lydeard, C., and Roe, K. J. (1997). The phylogenetic utility of the mitochondrial cytochrome b gene for inferring relationships among actinopterygian fishes. In ‘‘Molecular Systematics of Fishes’’ (T. D. Kocher and C. A. Stepien, Eds.), pp. 285–303. Academic Press, New York. Lydeard, C., Mulvey, M., and Davis, G. M. (1996). Molecular system- atics and evolution of reproductive traits of North American freshwater unionacean mussels (Mollusca: Bivalvia) as inferred from 16S rRNA gene sequences. Philos. Trans. R. Soc. Lond. B 351: 1593–1603. Lydeard, C., Holznagel, W. E., Garner, J., Hartfield, P., and Pierson, J. M. (1997). A molecular phylogeny of Mobile River drainage basin pleurocerid snails (Caenogastropoda: Cerithioidea). Mol. Phylo- genet. Evol. 7: 117–128. Lydeard, C., Yoder, J. H., Holznagel, W. E., Thompson, F. G., and Hartfield, P. (1998). Phylogenetic utility of the 5Ј-half of mitochon- drial 16S rDNA gene sequences for inferring relationships of Elimia (Cerithioidea: Pleuroceridae). Malacologia 39: 183–193. Maidak, B. L., Olsen, G. J., Larsen, N., Overbeek, R., McCaughey, M. J., and Woese, C. R. (1997). The RDP (Ribosomal Database Project). Nucleic Acids Res. 25: 109–111. Mindell, D. P., and Honeycutt, R. L. (1990). Ribosomal RNA in vertebrates: Evolution and phylogenetic applications. Annu. Rev. Ecol. Syst. 21: 541–566. Miyamoto, M. M., Allard, M. W., Adkins, R. M., Janecek, L. L., and Honeycutt, R. L. (1994). A congruence test of reliability using linked mitochondrial DNA sequences. Syst. Biol. 43: 236–249. Moore, R. C., Ed. (1969). ‘‘Treatise on Invertebrate Paleontology. Bivalvia. Mollusca 6, Part N, 1,’’ Geol. Soc. Am. and Univ. Press of Kansas, Lawrence. Mulvey, M., Lydeard, C., Pyer, D. L., Hicks, K. M., Brim-Box, J., Williams, J. D., and Butler, R. S. (1997). Conservation genetics of North American freshwater mussels Amblema and Megalonaias. Conserv. Biol. 11: 868–878. Noller, H. F. (1984). Structure of ribosomal RNA. Annu. Rev. Bio- chem. 53: 119–162. Noller, H. F. (1991). Ribosomal RNA and translation. Annu. Rev. Biochem. 60: 191–227. Noller, H. F., Kop, J., Wheaton, V., Brosius, J., Gutell, R. R., Kopylov, A. M., Dohme, F., and Herr, W. (1981). Secondary structure model for 23S ribosomal RNA. Nucleic Acids Res. 9: 6167–6189. Okimoto, R., Macfarlane, J. L., Clary, D. O., and Wolstenholme, D. R. (1992). The mitochondrial genomes of two nematodes, Caenorhab- ditis elegans and Ascaris suum. Genetics 130: 471–498. Ortı´, G., Petry, P., Porto, J. I. R., Je´gu, M., and Meyer, A. (1996). Patterns of nucleotide change in mitochondrial ribosomal RNA genes and the phylogeny of piranhas. J. Mol. Evol. 42: 169–182. Palumbi, S. R., Martin, A. P., Romano, S. L., McMillan, W. O., Stice, L., and Grabowski, G. (1991). ‘‘The Simple Fool’s Guide to PCR,’’ Univ. of Hawaii Press, Honolulu. Penny, D., Hendy, M. D., Zimmer, E. A., and Hamby, R. I. (1990). Trees from sequences: Panacea or Pandora’s box? Aust. Syst. Bot. 3: 21–38. Philippe, H., and Laurent, J. (1998). How good are deep phylogenetic trees? Curr. Opin. Genet. Dev. 8: 616–623. Ponder, W. F., and Lindberg, D. R. (1997). Towards a phylogeny of gastropod molluscs: An analysis using morphological characters. Zool. J. Linn. Soc. 119: 83–265. Roe, B. A., Ma, D. P., Wilson, R. K., and Wong, J. F. H. (1985). The 101MOLLUSCAN MITOCHONDRIAL rDNA SEQUENCES
  • 20. complete nucleotide sequence of the Xenopus laevis mitochondrial genome. J. Biol. Chem. 260: 9759–9774. Rosenberg, G., Kuncio, G. S., Davis, G. M., and Harasewych, M. G. (1994). Preliminary ribosomal RNA phylogeny of gastropod and unionoidean bivalve mollusks. Nautilus Suppl. 2: 111–121. Runnegar, B. (1996). Early evolution of the Mollusca: the fossil record. In ‘‘Origin and Evolutionary Radiation of the Mollusca’’ (J. D. Taylor, Ed.), pp. 77–87. Oxford Univ. Press, Oxford. Saiki, R. K., Scharf, S., Faloona, F., Mullis, K. B., Horn, G. T., Erlich, H. A., and Arnheim, N. (1985). Enzymatic amplification of ␤-globin genomic sequences and restriction site analysis for diagnosis of sickle cell anemia. Science 230: 1350–1354. Salvini-Plawen, L. V., and Steiner, G. (1996). Synapomorphies and plesiomorphies in higher classification of mollusca. In ‘‘Origin and Evolutionary Radiation of the Mollusca’’ (J. D. Taylor, Ed.), pp. 29–51. Oxford Univ. Press, Oxford. Simon, C., Frati, F., Beckenbach, A., Crespi, B., Liu, H., and Flook, P. (1994). Evolution, weighting, and phylogenetic utility of mitochon- drial gene sequences and a compilation of conserved polymerase chain reaction primers. Ann. Entomol. Soc. Am. 87: 651–701. Simons, A. M., and Mayden, R. L. (1998). Phylogenetic relationships of the western North American phoxinins (Actinopterygii: Cyprini- dae) as inferred from mitochondrial 12S and 16S ribosomal RNA sequences. Mol. Phylogenet. Evol. 9: 308–329. Smith, A. G. (1960). Amphineura. In ‘‘Treatise on Invertebrate Paleontology. Part I, Mollusca 1’’ (R. C. Moore, Ed.), pp. I41–I76. Geol. Soc. Am. and Univ. Press of Kansas, Lawrence. Steiner, G., and Mu¨ller, M. (1996). What can 18S rDNA do for bivalve phylogeny? J. Mol. Evol. 43: 58–70. Swofford, D. L. (1998). PAUP*. Phylogenetic Analysis Using Par- simony (*and Other Methods). Version 4.0b1. Sinauer, Sunder- land, MA. Templeton, A. R. (1983). Convergent evolution and non-parametric inferences from restriction fragment and DNA sequence data. In ‘‘Statistical Analysis of DNA Sequence Data’’ (B. Weir, Ed.), pp. 151–179. Dekker, New York. Terrett, J. A., Miles, S., and Thomas, R. H. (1996). Complete DNA sequence of the mitochondrial genome of Cepaea nemoralis (Gas- tropoda: Pulmonata). J. Mol. Evol. 42: 160–168. Thompson, J. D., Higgins, D. G., and Gibson, T. J. (1994). CLUSTAL W: Improving the sensitivity of progressive multiple sequence alignment through sequence weighting, positions-specific gap pen- alties and weight matrix choice. Nucleic Acids Res. 22: 4673–4680. Tomita, K., Ueda, T., and Watanabe, K. (1998). 7-Methylguanosine at the anticodon wobble position of squid mitochondrial tRNA (Ser)GCU: Molecular basis for assignment of AGA/AGG codons as serine in invertebrate mitochondria. Biochim. Biophys. Acta 1399: 78–82. Tillier, S., Masselot, M., Philippe, H., and Tillier, A. (1992). Phylog- e´nie mole´culaire des gastropoda (Mollusca) fonde´e sur le se´quen- cage partiel de l’ARN ribosominque 28S. C. R. Acad. Sci. Paris 314: 79–85. Titus, T. A., and Frost, D. R. (1996). Molecular homology assessment and phylogeny in the lizard family Opluridae (Squamata: Iguania). Mol. Phylogenet. Evol. 6: 49–62. Valentine, J. W., Erwin, D. H., and Jablonski, D. (1996). Developmen- tal evolution of metazoan bodyplans: The fossil evidence. Dev. Biol. 173: 373–381. Vaught, K. C. (1989). ‘‘A Classification of the Living Mollusca,’’ Am. Malacol. Inc. Melbourne, FL. Vawter, L., and Brown, W. M. (1993). Rates and patterns of base change in the small subunit ribosomal RNA gene. Genetics 134: 597–608. Wheeler, W. C., and Gladstein, D. (1991). MALIGN (Multiple align- ment). Privately distributed. Winnepenninckx, B., Backeljau, T., and De Wachter, R. (1994). Small ribosomal subunit RNA and the phylogeny of Mollusca. Nautilus Suppl. 2: 98–110. Winnepenninckx, B., Backeljau, T., and De Wachter, R. (1996). Investigation of molluscan phylogeny on the basis of 18S rRNA sequences. Mol. Biol. Evol. 13: 1306–1317. Winnepenninckx, B., Steiner, G., Backeljau, T., and De Wachter, R. (1998). Details of gastropod phylogeny inferred from 18S rRNA sequences. Mol. Phylogenet. Evol. 9: 55–63. Woese, C. R. (1987). Bacterial evolution. Microbiol. Rev. 51: 221–271. Woese, C. R., Magrum, L. J., Gupta, R., Siegel, R. B., and Stahl, D. A. (1980). Secondary structure model for bacterial 16S ribosomal RNA: Phylogenetic, enzymatic and chemical evidence. Nucleic Acids Res. 8: 2275–2293. Woese, C. R., Kandler, O., and Wheelis, M. L. (1990). Towards a natural system of organisms: Proposal for the domains Archaea, Bacteria, and Eucarya. Proc. Natl. Acad. Sci. USA 87: 4576–4579. Wolstenholme, D. R. (1992). Animal mitochondrial DNA: Structure and evolution. Int. Rev. Cytol. 141: 173–216. Yang, D., Oyaizu, Y., Olsen, G. J., and Woese, C. R. (1985). Mitochon- drial origins. Proc. Natl. Acad. Sci. USA 82: 4443–4447. Yochelson, E. L. (1988). A new genus of Patellacea (Gastropoda) from the Middle Ordovician of Utah: The oldest known example of the superfamily. New Mexico Bur. Mines Min. Res. Mem. 44: 195–200. Zilch, A. (1959–1960). Gastropoda, Teil 2, Euthyneura. Handb. Paleozool. 6(2)1: 1–400 [1959]; 2: 401–834 [1960]. Zimmermann, R. A., and Dahlberg, A. E., Eds. (1996). ‘‘Ribosomal RNA: Structure, Evolution, Processing and Function in Protein Biosynthesis,’’ CRC Press, New York. 102 LYDEARD ET AL.