SlideShare uma empresa Scribd logo
1 de 128
Baixar para ler offline
GROUP ON
    EARTH OBSERVATIONS


Crafting geoinformation
         The art and science of Earth observation
GROUP ON
EARTH OBSERVATIONS


              Crafting
       geoinformation
    The art and science of Earth observation
GROUP ON
                              EARTH OBSERVATIONS
7 bis, avenue de la Paix, CP 2300
CH-1211 Geneva 2, Switzerland
Tel +41 22 730 8505
www.earthobservations.org


The Group on Earth Observations is coordinating efforts to build a Global      © Group on Earth Observations, November 2010
Earth Observation System of Systems, or GEOSS. It was launched in
response to calls for action by the 2002 World Summit on Sustainable           ISBN 978-0-9563387-4-7
Development and by the G8 (Group of Eight) leading industrialized countries.
These high-level meetings recognized that international collaboration is       Prepared by the GEO Secretariat, Geneva, Switzerland
essential for exploiting the growing potential of Earth observations to        Coordination: Michael Williams and José Achache
support decision making in an increasingly complex and environmentally
stressed world.                                                                URL: www.earthobservations.org/docs_pub.shtml
       GEO is a voluntary partnership of governments and international
organizations. It provides a framework within which these partners can         Cover photo: The EIGEN-CG01C geoid. The NASA/DLR GRACE mission
develop new projects and coordinate their strategies and investments. As       (Gravity Recovery And Climate Experiment) provides highly accurate data
of June 2010, GEO’s members include 81 governments and the European            on Earth’s gravity field. Using these data, models such as this ‘EIGEN-
Commission. In addition, 58 intergovernmental, international and regional      CG01C’ geoid can be created. The geoid is a reference surface in the
organizations with a mandate in Earth observation or related issues have       gravity field of Earth for the measurement and description of the planet’s
been recognized as participating organizations.                                shape. The data come from both GRACE and the satellite CHAMP.
       GEO is constructing GEOSS on the basis of a 10-year implementation
plan for the period 2005 to 2015. The plan defines a vision statement for      A Banson production
GEOSS, its purpose and scope, expected benefits, and the nine “Societal        Cambridge, UK
Benefit Areas” of disasters, health, energy, climate, water, weather,          Printed in the UK by the Lavenham Press
ecosystems, agriculture and biodiversity.                                      using FSC-certified papers.
CONTENTS

INTRODUCTION                                                                                                                                                                                          5

CONTRIBUTING AGENCIES AND ORGANIZATIONS                                                                                                                                                               8

INFORMATION FOR DECISION MAKING                                                                                                                                                                      13

      DISASTERS: The Haiti earthquake                                                                                                                                                                15

      HEALTH: Meningitis in Africa                                                                                                                                                                   25

      ENERGY: The Deepwater Horizon oil spill                                                                                                                                                        30

      CLIMATE: Forests and carbon                                                                                                                                                                    37

      WATER: Water resources                                                                                                                                                                         45


    PRODUCING DATA                                                                                                                                                                           55
    Carbon dioxide: flux towers ................................................................................................................................................................56
    Ocean temperature and salinity: Argo buoys .....................................................................................................................58
    Volcanic ash clouds: Lidars................................................................................................................................................61
    Greenhouse gases: the “IBUKI” satellite...........................................................................................................................66
    Topography: radar from satellites ....................................................................................................................................68
    Gravity: the GRACE satellites.............................................................................................................................................70
    Past climates: ice cores ....................................................................................................................................................72
    Rain: radar stations...........................................................................................................................................................74
    Mapping the surface: virtual satellite consellations..........................................................................................................76
    Earthquakes: the Global Seismographic Network .............................................................................................................78
    On-site validation: the GEO-Wiki ......................................................................................................................................79
    Interoperability: the Sensor Web.......................................................................................................................................83
    In situ observation: people power .....................................................................................................................................84


                                                                                                                                              The art and science of Earth observation 3
WEATHER: Typhoon Lupit                 85

       ECOSYSTEMS: Ecosystem services         92

       AGRICULTURE: Food security             99

       BIODIVERSITY: Protected areas          108

       CONCLUSION: Global change and trends   116


4 Crafting geoinformation
Crafting geoinformation:
   The art and science of Earth observation
   INTRODUCTION


    roducing geoinformation is a science, and an art. Like every creative     the feast that is GEOSS, the Global Earth Observation System of Systems.
P   human endeavour, it requires a sense of purpose, plus fortitude,
ingenuity, training and talent.
                                                                              They are the individuals standing behind the multitude of observation
                                                                              systems, models, computers and information services that are
                                                                              increasingly essential to helping humanity mitigate natural disasters and
Forecasting next week’s weather, next winter’s snow cover, this year’s        disease epidemics, predict severe weather events, sustainably manage
global soy production, or long-term changes in forest cover all require       natural resources and maintain our ecological balance.
an impressive combination of technology, hard work and expertise. The
production chain for generating such forecasts and assessments, from          Crafting geoinformation seeks to inspire greater appreciation of the art
the conception of an Earth monitoring instrument for gathering the            and science of Earth observation by taking the reader behind the scenes
necessary data to the final delivery of useful information, is a long one.    and revealing the secrets of the kitchen where geoinformation is made.

Compelling photos of the cloud-wreathed Earth from space, or highly           OBSERVING OUR PLANET
processed, multi-coloured images of its surface, are familiar sights          GEOSS interconnects the Earth observation systems that are owned
today. What people do not always realize is just how much work goes into      and maintained by the member governments and participating
making these observations available. Designing, building, launching,          organizations of the Group on Earth Observations (GEO). Investments in
testing, processing and delivering data from an observation system takes      environmental monitoring and forecasting have now reached a critical
a minimum of five years, often 10 years for space-based instruments.          mass, resulting in a vast and expanding array of observation systems.
Even more time, technology, expertise and collaboration are required to       These include ocean buoys, meteorological stations and balloons, sonar
transform these data into information products and services that can          and radar systems, seismic and Global Positioning System (GPS)
support decision making. This endeavour can be compared to making             stations, more than 60 high-tech environmental satellites and a large
fine wine or preparing a great meal: although the diner rarely peeks into     number of powerful computerized models. GEO seeks to make these
the kitchen to see how the ingredients are being assembled and                systems fully interoperable and accessible.
processed, he can only enjoy the gourmet dishes and vintage bottles
thanks to the intensive labour, technology, creativity and skills of highly   Crafting geoinformation describes a small sample of the observing
trained teams.                                                                instruments and systems that monitor the Earth from space, the
                                                                              atmosphere, the oceans and the land. Each instrument provides a unique
This book is dedicated to the engineers, technicians, scientists, computer    vantage point on some aspect of the Earth system; together, they offer a
geeks and practitioners – the wine makers and chefs who are serving up        comprehensive picture of the planet.


                                                                                                                                        Introduction 5
Many of these instruments are arrayed in regional networks, while             Geo-Wiki project provides an innovative example of how the internet can
others are contained in global networks maintained by international           be used to network people and ensure the in situ validation of remote
partnerships. The examples given here are of radars for tracking rain,        observations; it invites individuals around the world to share their
flux towers for measuring carbon dioxide levels, ocean buoys for              personal knowledge and observations to help validate regional and
monitoring currents and heat transport, and seismographs for recording        global land cover maps.
earthquakes. Also featured are the high-powered drills used to obtain
ice cores for reconstructing past climates.                                   INFORMING DECISION MAKERS
                                                                              The bulk of this book is dedicated to nine stories that picture GEOSS-
In addition to these instruments based on or near the Earth’s surface,        based decision making in the nine GEO societal benefit areas, thus
more and more instruments are being flown by satellites. The ones             illustrating the range of highly topical issues that Earth observation
described in this book are used to measure atmospheric levels of carbon       helps to address. We have deliberately chosen not to provide the
dioxide and methane; to image the Earth’s surface, topography and             technical details of how each system works. Instead, the stories simply
tectonic deformation; and to monitor the Earth’s gravity field in order to    outline the process for gathering data and images, processing and
gain insight into the thickness of the polar ice caps and changes in the      combining them, and then presenting the resulting information to
subsurface water table.                                                       decision makers.

To date, one of GEO’s greatest accomplishments has been to advance            For example, earthquakes were big news in 2010. The days and weeks
the full and open sharing of Earth observation data. Several examples         following the quake that struck Port-au-Prince in January 2010 revealed
are offered that highlight the importance of such openness and                that the rapid provision of information was critical in enabling emergency
collaboration. The concept of virtual constellations, whereby space           responders to take rapid action.
agencies coordinate the missions and outputs of their satellites in
order to compensate for the long time it takes individual instruments         The case study on meningitis epidemics in Africa provides further
to revisit the same site, is illustrated by complementary images of           evidence of how collaboration amongst data providers and analysts from
central Beijing.                                                              different communities – in this case health experts and climate
                                                                              researchers – can generate information and answers that can save
Lidars (LIght Detection And Ranging) have enormous potential for              human lives.
measuring forests, polar ice, clouds, aerosols, gases, wind and many other
parameters. The need to track the ash cloud that Iceland’s Eyjafjallajökull   Also in 2010, observations from satellites, ocean vessels and other
volcano emitted in early 2010, causing chaos for air travellers in Europe,    carriers were critical to the early and near-real time assessments of,
provides a superb example of data sharing and collaboration.                  and responses to, the Deepwater Horizon oil spill in the Gulf of Mexico.

One should not forget human observers with their pens and notebooks,          The prediction of extreme weather events clearly requires rapid and
perhaps the most sophisticated Earth observation instrument of all. The       collaborative efforts to gather and analyse observations. The case of


6 Crafting geoinformation
Typhoon Lupit, which threatened the Philippines in October 2009,             All of the stories featured here confirm the key message that capturing
confirms that space agencies, meteorological offices and analysts are        observations and producing information is a complex and challenging
well practised at sharing data and forecasts. Together they are now          process. It requires heavy investment and long-term planning by
generating more accurate probabilistic forecasts to help communities         governments and organizations, innovative design and construction by
anticipate and prepare for destructive storms.                               engineers and technicians, sophisticated modelling and analysis by
                                                                             scientists and experts, and the coordinated creativity and commitment
Collaboration is also essential for predicting the availability of water     of many individuals, institutions and governments. It is our hope that,
resources for agriculture, energy and domestic use, as well as for           after exploring this book, the reader will gain a better understanding of
forecasting the risk of floods and droughts. Such work requires the          the value of Earth observation and the critical importance of sustaining
engagement of many different teams and systems for gathering wide-           our global monitoring and information systems.
ranging data and analyses on a diverse range of variables, such as
precipitation, soils and topography.

Yet another example looks at the provision of information on forest cover
and, more importantly, deforestation rates. This is vital for estimating
the capacity of forests to store carbon, preserve biodiversity and provide
other ecosystem services.

Environmental information products are also valuable tools for making
longer-term decisions. Examples of how information is generated to
support biodiversity conservation planning in Africa, and of how mapping
is used to evaluate global ecosystems, further demonstrate the power
of Earth observation. An ambitious effort to build a comprehensive global
monitoring system for agriculture and food security offers similar
insights into the increasing potential of geoinformation to promote
human well-being.

Crafting geoinformation concludes with a series of global images of the
Earth that provide snapshots of the state of the planet in 2010. Some of
the parameters shown do not change substantially over time. Other
variables change continuously. These snapshots constitute a baseline                                                                  José Achache
against which we will be able to assess global change over the coming                                                           Secretariat Director
years and decades.                                                                                                      Group on Earth Observations


                                                                                                                                       Introduction 7
THE FOLLOWING AGENCIES AND ORGANIZATIONS ARE THE PROVIDERS OF THE INFORMATION SYSTEMS, SERVICES
AND PRODUCTS DESCRIBED IN THIS BOOK


                  African Center of Meteorological Applications for         Chinese Academy of Sciences
                  Development (ACMAD)


                                                                            Committee on Earth Observation Satellites
                  Argo
                                                                            (CEOS)


                  AsiaFlux
                                                                            Consortium for Small-scale Modelling (COSMO)


                  BirdLife International
                                                                            Disaster Monitoring Constellation (DMC)


                  Brazil National Institute for Space Research
                                                                            EARLINET
                  (INPE)


                                                                            European Civil Protection
                  China Center for Resources Satellite Data and
                  Application (CRESDA)


                                                                            European Commission (EC)

                  China Meteorological Administration (CMA)


                                                                            European Commission Joint Research Centre (JRC)

                  China National Space Administration (CNSA)


8 Crafting geoinformation
European Centre for Medium-range Weather          German Aerospace Center (DLR)
Forecasts (ECMWF)


                                                  German Weather Service (DWD)
European Space Agency (ESA)


                                                  Global Atmosphere Watch (GAW)
e-GEOS


                                                  Global Biodiversity Information Facility (GBIF)
Famine Early Warning System Network (FEWS-NET)


                                                  Global Monitoring for Environment and Security
FluxNet                                           (GMES)


Food and Agriculture Organization of the United   Global Runoff Data Centre (GRDC)
Nations (FAO)


                                                  Global Seismographic Network (GSN)
French Space Agency (CNES)


                                                  Indian Space Research Organisation (ISRO)
GeoEye


                                                  International Charter for Space and Major Disasters
Geo-Wiki


                                                           Contributing agencies and organizations 9
International Institute for Applied Systems Analysis                                      Meningitis Environmental Risk Information
                  (IIASA)                                                                                   Technologies (MERIT) Project


                  Italian Space Agency (ASI)                             OGC                         ®

                                                                         Open Geospatial Consortium, Inc.
                                                                                                            Open Geospatial Consortium, Inc. (OGC)


                  Japan Aerospace Exploration Agency (JAXA)                                                 OneGeology


                  Japan Meteorological Agency (JMA)                                                         Regional Service of Image Treatment and Remote
                                                                                                            Sensing (SERTIT)


                  Japan Ministry of Economy, Trade and Industry
                  (METI)                                                                                    SarVision


                  Japan National Institute of Advanced Industrial                                           South Africa Council for Scientific and Industrial
                  Science and Technology (AIST)                                                             Research (CSIR)


                                                                                                            UK Met Office
                  Japan National Institute of Informatics (NII)


                                                                                                            United Nations Environment Programme World
                  JapanFlux                                                                                 Conservation Monitoring Centre (UNEP-WCMC)


10 Crafting geoinformation
University of Maryland                                    US National Oceanic and Atmospheric Administration (NOAA)


University of Miami                                       Wageningen University


University of Tokyo                                       World Meteorological Organization (WMO)


UNAVCO


United Nations Institute for Training and Research
(UNITAR)


US Department of Agriculture (USDA)


US Environmental Protection Agency (EPA)


US Geological Survey (USGS)


US National Aeronautics and Space Administration (NASA)


                                                                  Contributing agencies and organizations 11
Information for
decision making
THE HAITI EARTHQUAKE

On 12 January 2010, a magnitude 7.0 earthquake struck the Haitian         processed using up-to-date cartographic material to create situation
capital of Port-au-Prince, killing almost 250,000 people, injuring        maps for helping rescuers locate damaged areas and at-risk people.
hundreds of thousands and leaving another million homeless. In the               In parallel, scientists benefited from the rapid availability of
immediate wake of the disaster, the United Nations and various national   satellite images of the Haitian earthquake via the GEO Supersites web
emergency response agencies obtained satellite data via the Inter-        site. This allowed them to analyse the fault that caused the disaster,
national Charter on Space and Major Disasters. These satellite images     predict the potential for further seismic events, and provide advice to
were provided by Canada, China, France, Japan, the United States of       policy makers and relief teams.
America and the European Space Agency. Within 24 hours they were                                                                      Source: UNDP.


                                                                                                   Information for decision making: disasters 15
Haiti: before the earthquake

This multi-spectral image was captured by Landsat, a
series of Earth observation satellites operated by the
United States since 1973. Multi-spectral images consist
of a limited number of specific wavelengths, including
frequencies invisible to the human eye, that are
particularly effective in revealing information about
landforms. The clouds, distortions caused by the camera                     Port-au-Prince
lens and other irregularities have been removed and
corrected to process the present image. The epicentre
(yellow star) and fault line (red line) have been added.

Source: COMET Centre for the Observation and
                                                                     ault
Modelling of Earthquakes, Volcanoes and Tectonics, UK.   Enriquillo F


16 Crafting geoinformation
Port-au-Prince: 12 January 2010

This map uses various symbols and colours to indicate informal Internally   and Research (UNITAR), has produced several such post-earthquake
Displaced Persons (IDP) sites as well as bridges and road obstacles using   maps of Haiti to illustrate damage assessments, pre- and post-disaster
GeoEye-1 satellite imagery from 12 January. The Operational Satellite       comparisons, and much more.
Applications Programme UNOSAT, hosted by the UN Institute for Training


   UPDATE 1: ANALYSIS SUMMARY
   WITHIN PORT-AU-PRINCE:


                                                                                                                                                                                 Republic
                                                                                                                                                             Haiti
  - 123 informal IDP shelters identified;
                                                                                                                                                         Port-au-
  - 77 bridges and culverts were identified:


                                                                                                                                                                              Dominican
                                                                                                                                                          Prince
  four appeared to be partially damaged                                                                                                                        ¬
                                                                                                                                                               ¦
                                                                                                                                                               ¥
  or blocked with building debris;
  - 449 road obstacles were identified,
  almost all resulting from building debris;
  of this total 125 were severe, likely
                                                                                                                                   Airfield
  blocking all vehicle transport, and 231
  were partial road obstructions, restricting                                                                                      Port
  vehicle access.                                                                                                                  Bridge
                                                                                                                                   Culvert
                                                                                                                                   Foot bridge
                                                                                                                                   Primary road
                                                                                                                                   Secondary road
                                                                                                                                   Unpaved/minor road
                                                                                                                                   Railroad
                                                                                                                                   Likely informal IDP site
                                                                                                                                   Likely closed by debris
                                                                                                                                   Likely restricted by debris
                                                                                                                                                                      Metres
                                                                                                                            0    250    500    750   1,000 1,250 1,500


                                                                                                                           Operational Analysis with GeoEYE-1
                                                                                                                           Data Acquired 13 January 2010 and
                                                                                                                           QuickBird data aquired 4 March 2008

                                                                                                                           Map Data © 2009 Google

                                                                                                                           The depiction and use of boundaries, geographic
                                                                                                                           names and related data shown here are not
                                                                                                                           warranted to be error-free nor do they imply official
                                                                                                                           endorsement or acceptance by the United
                                                                                                                           Nations. UNOSAT is a program of the United
                                                                                                                           Nations Institute for Training and Research
                                                                                                                           (UNITAR), providing satellite imagery and related
                                                                                                                           geographic information, research and analysis
                                                                                                                           to UN humanitarian & development agencies &
                                                                                                                           their implementing partners.


                                                                                                                                       Source: UNITAR/UNOSAT.


                                                                                                     Information for decision making: disasters 17
Port-au-Prince: 13 January 2010

This map product classifies the level of building
damage in each 250-metre grid on the basis of an
expert visual interpretation of a satellite image
acquired on 13 January.

Source: GeoEye.


18 Crafting geoinformation
Port-au-Prince: recovery planning and reconstruction

A comprehensive atlas of damage caused in Haiti
has been produced to help recovery planning and recon-
struction measures. The maps, based on the comparison
between pre-disaster satellite imagery and post-disaster
aerial photos, provide an overview of building damage in
the main affected cities. They reveal that almost 60,000
buildings were destroyed or very heavily damaged,
including a number of critical infrastructures such as
government premises, educational buildings and hospitals.

Source: This mapping activity was performed by SERTIT and DLR-ZKI in the
context of the GMES Emergency Response Project SAFER with funding from the
European Community's Seventh Framework Programme.


                                                                             Information for decision making: disasters 19
Port-au-Prince: 48 hours on

The first radar satellite high-resolution images
available for Port-au-Prince were dated 14 January,
only 48 hours after the event. Using these images
along with reference images acquired during
previous campaigns, it was possible to rapidly assess
the effects of the earthquake on the affected area.
The ILU (Interferometric Land Use modified) map of
the Port-au-Prince area produced by the Italian
Space Agency using COSMO-Skymed images reports
areas where there is a big difference in the back-
scattering between the pre- and the post-event
images (red elements), highlighting the zones more
affected by the quake.

Source: ASI/COSMO-Skymed.


20 Crafting geoinformation
Developing elevation maps


                            Digital Elevation Models use optical and radar
                            space observations to map the elevation and
                            contours of the Earth’s surface, highlighting
                            features such as mountains and rivers. They
                            are used for a wide range of purposes, such
                            as creating relief maps, modelling water flow
                            to anticipate flooding impacts, predicting
                            landslides and planning new infrastructure.
                            In this image, the long horizontal line is the
                            earthquake's fault line; Port-au-Prince and its
                            harbour can be seen just above.

                            Source: NASA Shuttle Radar Topography Mission (SRTM).


                            Information for decision making: disasters 21
Port-au-Prince: fault analysis

This image shows the distribution of surface deformation caused by the earthquake derived from interferometric analysis of
radar data acquired by the PALSAR instrument on the Japan Aerospace Exploration Agency’s (JAXA) Advanced Land Observing
Satellite (ALOS). The area of many contours, near the city of Léogâne, shows an area of surface uplift caused by fault motion at
depth. Areas of intense local deformation, mostly in soft soil and perhaps involving landslides, show as incoherent speckle
patterns. This interferogram shows that the main earthquake rupture did not reach the surface on land.

Source: Eric Fielding/JPL/NASA/JAXA.


22 Crafting geoinformation
73.5ºW                             73.0ºW                              72.5ºW                          72.0ºW                             Fault analysis
                20 cm
                                                                                                                                               To model the potential for future
                              GONAVE PLATE                                                                                                     earthquakes, researchers simulated
19.0ºN                                                                                                                                         the coseismic ground motion based on
                                                                                                                                               the finite fault model of Caltech. Black
                                                                                                                                               arrows show expected displacements
                                                                                                                                               at Global Positioning System (GPS)
                                                                                                Port-au-Prince
                                                                                                                                               sites, while the background colour
                                                                                                                                               shows interferometric fringes.
                                                                                                                                                       Through an iterative process,
                                                                                                                                               a model is built and then gradually
18.5ºN
                                                                                                                                               improved until it corresponds more
                                                                                                                                               fully with observations (including both
               Enriquillo fault                                                                                                                aps and interferometric analysis of
                                                                                                                  USGS CMT                     radar images). The model is a vital
                                                                                                                                               aid for understanding and predicting
                                                                                                                                               the probability of future shocks.

                                                                                                                 Harvard CMT
                   GPS site

18.0ºN             Aftershocks
                   (USGS/NEIC)
                                                              CARIBBEAN PLATE


                                                                                                                                          m

         0.0          0.5         1.0            1.5         2.0          2.5          3.0          3.5          4.0      4.5       5.0

                                                   Slip distribution from A. Sladen (Caltech)


                                                                                                                                          cm
    -11.8                                                                0.0                                                       11.8
                                                                                                                                               Source: E. Calais, Purdue University.
                                                                    Range change


                                                                                                                                Information for decision making: disasters 23
Fault analysis                               73.5ºW                          73.0ºW                    72.5ºW                           72.0ºW


                                                       20 cm

In this image scientists have sought                                   GONAVE PLATE


                                                                                                                                                        Dominican Republic
to model the redistribution of          19.0ºN
                                                                                                                 HAITI
stress along the fault line resulting
from the earthquake.
        The model reveals that the
greatest area of concern for a
                                                                                                                         Port-au-Prince
large triggered shock is immed-
iately to the east of the 12 January
2010 rupture of the Enriquillo fault,
where stress is calculated to have
                                        18.5ºN
risen. Typically, stress increases
of this magnitude are associated                      Enriquillo fault
with aftershocks (white dots). The
next most likely site for a sub-
sequent fault rupture lies to the
west of the 12 January rupture
where, interestingly, aftershocks
are observed.
                                        18.0ºN            Aftershocks
                                                          (USGS/NEIC)
                                                                                              CARIBBEAN PLATE


                                                                                                                                                                               MPa

                                             -0.08             -0.06        -0.04     -0.02          0.00         0.02           0.04            0.06                   0.08

Source: E. Calais, Purdue University.
                                                                                                Coulomb stress


24 Crafting geoinformation
MENINGITIS IN AFRICA

Many different factors have been known to contribute to disease out-                 The main image above is of a massive dust storm sweeping across
breaks, and over the past several years the health sector has increasingly     the southern Sahara Desert on 19 March 2010. This image is made up of
recognized that the environment may be one of the factors for climate-         seven separate satellite overpasses acquired by the Moderate Resolution
sensitive illnesses. The Meningitis Environmental Risk Information             Imaging Spectroradiometer (MODIS) on NASA’s Terra and Aqua satellites
Technologies (MERIT) project illustrates how the health and climate            throughout the morning and early afternoon. Grey triangles indicate areas
communities are cooperating to support decision making. MERIT is               where the satellites did not collect data. The image spans more than 10,000
demonstrating how combining data, information and models on                    kilometres (6,000 miles). The smaller picture shows a meningitis victim.
demographics, health resources, past outbreaks, vaccination campaigns,
environmental changes and other variables can support public-health
interventions. The decision by the World Health Organization and the other
MERIT partners to model meningitis disease outbreaks is a step towards
developing an early warning system. It is hoped that they will help to guide
the implementation of a new vaccine campaign under way in 2010.                             Source (main image): MODIS Rapid Response Team at NASA GSFC; (inset) WHO.


                                                                                                              Information for decision making: health 25
Aerosols in the atmosphere

Suspended particles in the atmosphere known as aerosols can affect    operating for limited periods between 1979 and 2004; the data were
weather and climate as well as people. This diagram of the global     validated using ground-based observations. The blue box over Africa
distribution of atmospheric aerosols shows that dust from Northern    highlights the approximate location of the meningitis belt, home to 350
Africa and Asia is a major component of the atmosphere over much of   million people. The very dry air and high levels of suspended dust
the world.                                                            particles observed during the meningitis season are thought to be
       The map was generated by combining data from six satellites    among the factors leading to disease outbreaks.


Aerosol optical depth
(a measurement of particle
density in the air)
    0.0


   0.2


    0.4


    0.6


  Meningitis belt


Source: Kinne, S., "Remote sensing data
combinations-superior global maps for aerosol
optical depth" in Satellite Aerosol Remote Sensing
Over Land, A. Kokhanovsky and G. de Leeuw eds.,
Springer, 2009.


26 Crafting geoinformation
Humidity

 Specific humidity                                                        Meningitis outbreaks
 Jan-Feb 2008                                                             2008
 (kg/kg)
     0.008

                                                                                                       Mali           Niger
                                                                                                                                 Chad
                                                                                                    Burkina
                                                                                                      Faso
                                                                                     Guinea
                                                                                                           Benin
                                                                                             Côte                Nigeria                                        Ethiopia
                                                                                                        Togo
                                                                                            d’Ivoire Ghana                             Central
                                                                                                                                     African Rep.
                                                                                                                          Cameroon
                                                                              Country
                                                                                                                                             Dem. Rep.
                                                                          Attack rate                                                         of Congo
     0.001
                                                                                  No data
                                                                          .......
                                                                          .......
                                                                          .......
                                                                          ....... Acceptable
                                                                          .......
                                                                                                                                         ©Multi Disease Surveillance Centre (MD SC)/
                                                                                  Reached the alarm threshold                            World Health Organization/African Region
 Source: NASA GLDAS.                                                              Reached the epidemic threshold                         Source: Ministries of Health


These two sets of paired map images represent (left) specific humidity   rates during the first 39 weeks of 2008 (above) and 2009 (below). Note the
data for January-February gathered by the NASA Global Land Data          strong correlation between the dark blue areas in the humidity maps and
Assimilation System (GLDAS) and (right) cumulative meningitis attack     the red and yellow areas in the meningitis outbreak maps.

Specific humidity                                                         Meningitis outbreaks
Jan-Feb 2009                                                              2009
(kg/kg)
    0.008

                                                                                                       Mali           Niger
                                                                                                                                  Chad
                                                                                                       Burkina
                                                                                                         Faso
                                                                                        Guinea
                                                                                                              Benin
                                                                                                Côte                Nigeria                                      Ethiopia
                                                                                                           Togo
                                                                                               d’Ivoire Ghana                           Central
                                                                                                                                      African Rep.
                                                                                                                           Cameroon
                                                                              Country
                                                                                                                                             Dem. Rep.
                                                                          Attack rate                                                         of Congo
    0.001
                                                                                  No data
                                                                          .......
                                                                          .......
                                                                          .......
                                                                          ....... Acceptable
                                                                          .......
                                                                                                                                          ©Multi Disease Surveillance Centre (MD SC)/
                                                                                  Reached the alarm threshold                             World Health Organization/African Region
 Source: NASA GLDAS.                                                              Reached the epidemic threshold                          Source: Ministries of Health


                                                                                                                    Information for decision making: health 27
Wind direction

The Inter-Tropical Discontinuity, or ITD, is the demarcation line between                           ITD DEKAD 1 March 2010 MEAN: 07-10 FORECAST
the dry and dusty north/northeasterly winds from the Sahara and the
                                                                                25
moist and humid south/southwesterly winds from the ocean. It moves
gradually northwards from its extreme southern position in January to
                                                                                20
its extreme northern position in August, and southwards again from late
August to early January. The ITD’s position during the year influences
disease risk. When areas to its north experience the dry and dusty              15                     DEKAD 1 March 2010

Harmattan winds, meningitis and acute respiratory diseases tend to                                                                   Forecast: 18-24/03/2010
                                                                                10
increase.
                                                                                       Mean position DEK 1 March: 07-09
                                                                                 5

                                                             Source: ACMAD.
                                                                                 -20          -15      -10     -5       0   5   10     15     20     25        30


Population density

In order to incorporate demographic risk factors as predictors when
modelling epidemic outbreaks, demographic information about relevant
population aspects (such as counts, density, distribution, and age and sex
structure) is combined with climate data. The result is frequently
presented in raster format (a grid of pixels or points). The Center for
International Earth Science Information Network (CIESIN) uses their
Gridded Population of the World (GPW) version 3 and Global Rural Urban
Mapping Project (GRUMP) global population surfaces to integrate demo-
graphic data with remote-sensing products.                                     Predicted probability of
                                                                               meningitis epidemics
                                                                                     Very high risk (p >= 0.80)
                                                                                     High risk (0.60 <= p < 0.80)
                                                                                     Moderate risk (0.40 <= p < 0.60)
                                                                                     Low risk (p < 0.40)
                                                                                     No data

                                                                               Population density
                                                                               (people per km2)                                                       N
                                                                                     High: 140,000
                                                                                                                                                    500 km
                                                             Source: CIESIN.         Low: 0


28 Crafting geoinformation
Precipitation, pressure and dust concentration

            BSC-DREAM8b 12h acc. Precipitation and MSL pressure                                                                     Forecasts of sand and dust and basic meteorological variables for
                     12h forecast for 00z 22 MAR 10                                                                                 periods of 10 days are currently being made available to health
35ºN -                                                                                                                              practitioners. While such Earth observation-based information products
                                                                                                                                    cannot yet be used operationally, they do help increase the health
                                                                                                                            50
30ºN -                                                                                                                              community’s understanding of, and sensitivity to, the role of the
                                                                                                                            30      environment in disease outbreaks.
25ºN -
                                                                                                                            20

20ºN -                                                                                                                      10

                                                                                                                            5
15ºN -
                                                                                                                            2

10ºN -                                                                                                                      1

                                                                                                                            0.5
 5ºN -

         Source: BSC.
   0º - I        I        I       I       I       I         I       I        I       I        I       I         I       I
     20ºW            10ºW             0º              10ºE              20ºE             30ºE             40ºE

                                                                                                          ˘
            BSC-DREAM8b Lowest model level dust conc. (ug / m 3)
                     12h forecast for 00z 22 MAR 10

35ºN -
                                                                                                                                     Meningitis Environmental Risk Information Technologies is a
                                                                                                                            2,650    partnership of international organizations led by the World Health
30ºN -
                                                                                                                            1,280    Organization in collaboration with governments, academia and the
25ºN -                                                                                                                      640      private sector. MERIT website: http://merit.hc-foundation.org/
                                                                                                                            320            Contributors to this section include the World Health
20ºN -
                                                                                                                            160      Organization; International Research Institute for Climate and
                                                                                                                            80
                                                                                                                                     Society, Columbia University; Center for International Earth Science
15ºN -
                                                                                                                            40
                                                                                                                                     Information Network, Columbia University; Health and Climate
10ºN -
                                                                                                                            20
                                                                                                                                     Foundation; African Centre of Meteorological Applications for
                                                                                                                                     Development; World Meteorological Organization; Barcelona
                                                                                                                            10
 5ºN -
                                                                                                                                     Supercomputing Center (BSC); and US National Aeronautics and
         Source: BSC.                                                                                                                Space Administration (NASA) Goddard Institute for Space Studies.
  0º - I     I        I       I       I       I         I       I        I       I        I       I         I       I
    20ºW             10ºW             0º              10ºE              20ºE             30ºE             40ºE


                                                                                                                                                               Information for decision making: health 29
THE DEEPWATER HORIZON OIL SPILL

On 20 April 2010, an explosion occurred on the semi-submersible offshore   satellites, aeroplanes, ships, underwater gliders and scientists on the
drilling rig Deepwater Horizon in the Gulf of Mexico. In the weeks that    ground and on the water to track every aspect of the spill. These data were
followed, approximately 35,000-60,000 barrels (5,600-9,500 cubic metres)   used to derive information and forecasting products that proved invaluable
of crude oil a day leaked into the Gulf.                                   for emergency response teams, coastal communities, wildlife managers
       From day one, US agencies such as the National Oceanic and          and many others affected by the spill.
Atmospheric Administration, the US Geological Survey and the National
Aeronautics and Space Administration used Earth observations from                                                                  Source: US Coast Guard.


30 Crafting geoinformation
Mississippi Delta: 24 May 2010


 The Moderate-Resolution Imaging Spectro-
 radiometer (MODIS) on NASA’s Terra
 satellite captured this image of sunlight
 illuminating the lingering oil slick off the
 Mississippi Delta on 24 May. Oil smoothes
 the ocean surface, making the oil slick
 appear brighter than the surrounding
 water in some places (image centre) and
 darker in others (lower right). A small, dark
 plume along the edge of the slick, not far
 from the original location of the Deepwater
 Horizon rig, indicates a possible controlled
 burn of oil on the ocean surface.
                                  Source: NASA.


Information for decision making: energy 31
Tracking surface oil


                             Gulfport      Mobile   Pensacola


        New Orleans


                                        ★ Deepwater Horizon

                                                                Tampa

      NOAA’s Satellite Analysis Branch obtained data from
      a variety of high-resolution visible and synthetic
      aperture radar satellites from NOAA’s Earth observ-
      ation partners to document the latest extent of the
      surface oil (in red). Satellite data used in this daily
      analysis include NASA's Aqua and Terra MODIS, the
      Canadian Space Agency's RADARSAT-1 and -2 SAR, the
                                                                        Miami
      Italian Space Agency’s COSMO-SkyMed, the German
      Aerospace Center’s TerraSAR-X, the Japan Aerospace
      Exploration Agency’s Advanced Land Observing Satellite,
      Satellite Imaging Corporation's SPOT-5, the Disaster
      Monitoring Constellation’s multispectral imagery and
      the European Space Agency's ENVISAT SAR.

      Source: NOAA.


32 Crafting geoinformation
Surface ocean currents

                              Surface current forecast for 8pm EDT Friday 14 May 2010                                 Space-based and in situ observations of
35ºN                                                                                                                  weather, ocean currents and the state of
       Surface horizontal current (m/s)                                                                               the sea are vital for crafting the forecasts
       120-hour forecast
       valid 00Z 15 May 2010                                                                                          and information products needed for
                                                                                                                      decision making.

                       Strong current headed              Spill location
                       towards Texas
30ºN


25ºN


                                                    Loop
20ºN                                                current


       Max. 2.11 at 29.3ºN 75.1ºW
       Min: 0.00 at 17.1ºN 76.5ºW
       NCEP/EMC/MMAB 10 May 2010
15ºN
    100ºW                 95ºW                   90ºW                  85ºW            80ºW                 75ºW


                 0            0.5          1.0           1.5               2.0   2.5          3.0
                                           Surface horizontal current (m/s)

                                                                                                    Source: NOAA.


                                                                                                                    Information for decision making: energy 33
Trajectory mapping                                             Trajectory Forecast                                                                                            NOAA/NOS/OR&R
                                                                                                                                                      Estimate for: 0600 CDT, Thursday, 5/13/10
                                                               Mississippi Canyon 252                                                            Date Prepared: 1300 CDT, Wednesday, 5/12/10

This forecast of the spill’s future trajectory is                    92°0'0"W                      91°0'0"W                  90°0'0"W                  89°0'0"W               88°0'0"W
based on the US National Weather Service spot
forecast from the morning of 12 May. Currents       31°0'0"N                                                                                                                                         31°0'0"N

were obtained from several models (NOAA Gulf of
                                                                                                                                                                          Mobile
Mexico, West Florida Shelf/USF, Texas A&M/
                                                                                                                                                              Pascagoula                 Pensacola
TGLO, NAVO/NRL) and High Frequency Resistance                                                                                               Gulfport
                                                                                                                                   Bay St Louis
(HFR) measurements. The model was initialized
from a combination of satellite imagery analysis    30°0'0"N                                                                                                                                         30°0'0"N
                                                                                                                                                  Chandeleur
                                                                                                                                                    Sound
(NOAA/NESDIS) and overflight observations.                                                     Morgan City
                                                                                                                                              Breton
                                                                            Atchafalaya                                                       Sound
                                                                               Bay
                                                                                                                                             Venice
                                                                                                                                 Barataria
                                                                                                                                   Bay
                                                    29°0'0"N                                        Isle Denieres                                                                                    29°0'0"N
                                                                                                                Timbalier
                                                                                                                  Bay

                                                                                 Forecast location for oil
                                                                                 on 13 May 10 at 0600 CDT


                                                    28°0'0"N                                                                                                                                         28°0'0"N
                                                                                                                               Mississippi Canyon 252
                                                                                                                                 Incident Location

                                                                 0     20        40        miles   80

                                                                 0    25    50        75    100    km
                                                    27°0'0"N                                                                                                                                         27°0'0"N
                                                                                                                                                                              Trajectory
                                                                 Winds are forecast to be persistently from the SE throughout the week. These                                      Uncertainty
                                                                 moderately-strong onshore winds (up to 15 kts) have the potential to move new                                     Light
                                                                 oil onshore. The Mississippi Delta, Breton Sound, the Chandeleur Islands and areas                                Medium
                                                                 directly north have a potential for shoreline contacts throughout the forecast period.
                                                                                                                                                                                   Heavy
                                                                 Oil observed to the west of the Delta offshore of Timbalier Bay could threaten
                                                                 shorelines as far west as Atchafalaya Bay by Thursday.                                                            Potential
                                                                                                                                                                                   beached oil

                                                                     92°0'0"W                      91°0'0"W                  90°0'0"W                  89°0'0"W               88°0'0"W


                                                                                                                                                                                     Next
                                                                                                                                                                                   Forecast:
                                                                                              This scale bar shows the meaning of the distribution at the current time.
                                                                                                                                                                                   May 13 AM

                                                                                                                                                                                            Source: NOAA.


34 Crafting geoinformation
Developing scenarios

                                                                              As the oil moved towards the coast,
                                                                              there was a clear potential for
                                                                              deposition on sandy beaches and in
Tropical storm
                                                                              marshes. Weather scenarios were
   High tide + surge + waves                                                  used as an input for making inun-
   High tide + surge                                                          dation and overwash predictions.
   High tide                                                                  These scenarios were based on
   Elevations not affected
                                                                              recent and forecasted weather
                                                                              patterns, as well as larger events
                                                                              that could be expected based on
                                                                              historical records. For each sce-
                                                                              nario, representative values for tide,
                                                                              wave height, wave period and surge
                                                                              were obtained from NOAA models.
                                                                              The total water level, including wave
                                                                              runup, was compared to Lidar
                               Grand Isle                                     elevation data collected by USGS
                                                                     N        and the Joint Airborne Lidar
                                                                              Bathymetry Technical Center of
                                                                              Expertise (JALBTCX) to identify
                                                        Kilometres
                                                                              barrier-island locations where oil
                                            0              1          2
                                                                              was most likely to be transported
                                                Miles                         and deposited.
                                   0             1                    2


                                                                              Source: USGS.


                                                                     Information for decision making: energy 35
Providing information to
local communities

The dynamic nature of the Deep-
water Horizon oil spill was a
challenge for local communities,
from hotel operators and fishermen
to local community leaders.
        GeoPlatform.gov established
a customizable and interactive map
providing near real-time infor-
mation about the response effort
(http://www.geoplatform.gov/gulf
response). Developed by NOAA with
the US Environmental Protection
Agency, the US Coast Guard and the
US Department of Interior, the site
integrates the latest data the US
federal responders have about the
oil spill’s trajectory. It also features
information on fishery area clos-
ures and sightings of sea turtles
(dead or alive) and other wildlife.


                           Source: NOAA.


36 Crafting geoinformation
FORESTS AND CARBON

Forests play a vital role in regulating climate, storing carbon and
providing many other ecosystem services. Policy makers and managers
therefore need timely information on changes in the extent and density
of the world’s forests. This information can be provided by combining
optical and radar data from satellites with on-the-ground observations.


                                                                          Information for decision making: climate 37
Coordinating data

                                         Monitoring trends in forest cover requires obtaining data
                                         periodically over many years.
                                               These optical images of deforestation in Rondonia, Brazil
                                         were taken from the US’s Landsat satellite over a period of 26 years.


                                                                                           Source: USGS-Landsat.


June 1975


                             July 1989


                                                  September 2001


38 Crafting geoinformation
Trained observers take in situ measurements to provide “ground truth”
in order to validate and calibrate satellite measurements. They typically
record tree diameter and height; species composition (trees, crops and
other plants); soil and water quality; and indicators of land degradation.
Sample observations taken from each unit of a regular grid make it
possible to extrapolate the results to the entire forest or region.


                                                                             Information for decision making: climate 39
Using satellite radar sensors ...

A time series of processed images showing the removal of a Malaysian
mangrove forest over several years. These images were taken from an
L-band radar sensor on Japan’s Advanced Land Observing Satellite
(ALOS). Radar has the advantage of being able to penetrate clouds as
well as the nighttime dark.


Source: JAXA/METI.


2006                                           2008                    2010


40 Crafting geoinformation
... to monitor mangrove clearance


The three previous images have been combined into this composite
image. The different colours represent the years in which the
forest was cut.


Source: JAXA/METI.


                     Information for decision making: climate 41
Scenes acquired
                                                                                                                               June-September 2009

                                                                                                                                173   Landsat
                                                                                                                                507   ALOS PALSAR

                                                                                                                                161   Radarsat 2


Combining multiple images over Borneo

By coordinating data acquisition from various satellite missions, it is       and building time series from regular observations are essential for
possible to ensure that forests are monitored consistently by a variety of    tracking changes.
radar and optical sensors. Filling gaps in coverage, establishing baselines


42 Crafting geoinformation
7ºN       Land cover and land use
        Tropical lowland forest       High shrub
        Tropical mountain forest      Medium shrub
        Riverine forest               Ferns/grass                                                                 Time series of processed images are
        Swamp forest                  Grassland                                                         6ºN
        Mangrove forest               Cropland (upland)                                                           combined to produce information in the
        Nipah mangrove forest         Cropland (irrigated)                                                        form of a map of land cover and land use.
        Peat swamp (pole) forest      Plantations
        Peat swamp (padang) forest    Tree cover, burnt                                                           The accuracy of the classifications listed
        Riverine shrubland            Water body                                                        5ºN
                                      No data
                                                                                                                  in the legend is improved by using com-
        Forest mosaics/fragmented
        or degraded forest                                                                                        plementary data from different sensors.
                                                                                                                  The map is validated using in situ and
                                                                                                        4ºN
                                                                                                                  airborne observations as well as very
                                                                                                                  high resolution satellite data.

                                                                                                        3ºN


                                                                                                        2ºN


                                                                                                        1ºN


                                                                                                         0º


                                                                                                        1ºS


                                                                                                        2ºS


                                                                                                        3ºS


                                                                                                                  Source: Alos K&C Initiative/Wageningen
109ºE        110ºE        111ºE      112ºE        113ºE      114ºE   115ºE   116ºE   117ºE   118ºE   119ºE        University/SarVision/JAXA.


                                                                                                              Information for decision making: climate 43
Land cover and land use

The Amazon Deforestation Monitoring
Program (PRODES) of Brazil’s National
Institute for Space Research (INPE) is an
operational system for monitoring forest
change. It provides yearly forest/non-
forest maps based on regular satellite
and in situ observations in order to
identify the incremental deforestation
occurring over time.


                                              Deforestation 1997   Deforestation 2003   Deforestation 2007   Residual
                                              Deforestation 2000   Deforestation 2004   Deforestation 2008   Not observed
                                              Deforestation 2001   Deforestation 2005   Non forest           Hydrography
                              Source: INPE.   Deforestation 2002   Deforestation 2006   Forest               Clouds


44 Crafting geoinformation
WATER RESOURCES

Water-flow forecasting systems in individual catchments provide
essential information for managing the water resources needed for
agriculture, industry and households. They also produce and share
information for flood alert systems in order to provide longer lead-times
for warning people about impending disasters.


Source: UNEP.


                                                                            Information for decision making: water 45
Land cover
                                                                                  codes
                                                                                    1    23
                                                                                    2    24
                                                                                    3    25
                                                                                    4    26
                                                                                    5    27
                                                                                    6    28
                                                                                    7    29
                                                                                    8    30
                                                                                    9    31
                                                                                    10   32
                                                                                    11   33
                                                                                    12   34
                                                                                    13   35
                                                                                    14   36
                                                                                    15   37
                                                                                    16   38
                                                                                    17   39
                                                                                    18   40
                                                                                    19   41
                                                                                    20   42
                                                                                    21   43
                                                                                    22   44


Land cover classification

The European Flood Alert System (EFAS) geographic information
system (GIS) land cover layer contains 44 categories, including urban,
agriculture, coniferous/deciduous forest, wetlands and bare soil.
Information on the type of land cover is compiled from space and in situ
observations. It is critical for determining runoff characteristics in the
hydrological model.

                                               Source: European Landcover 2000.


46 Crafting geoinformation
ETN-R
monitoring
stations


             European Terrestrial Network for River Discharge

             The monitoring stations that constitute the European Terrestrial
             Network for River Discharge (ETN-R) gather near real-time river
             discharge and water level data from 30 European national and trans-
             boundary river basins in 35 countries. This network in turn supplies
             EFAS with in situ river observations.

             Source: EFAS.


                                        Information for decision making: water 47
Soil texture classifications

Geographic information system (GIS) layers for topsoil (below left) and
subsoil (right) are each divided into six categories. Soil information is
important for determining percolation, runoff and erosion character-
istics in the hydrological model.                                           Source: EFAS.


                                                                  Topsoil        Subsoil
                                                                       0              0
                                                                       1              1
                                                                       2              2
                                                                       3              3
                                                                       4              4
                                                                       5              5


48 Crafting geoinformation
Elevation
Height in metres
     < -20
     -20-200
     200-500
     500-750
     750-1,000
     1,000-1,500
     1,500-2,000
     2,000-2,500
     2,500-3,000
     3,000-4,536


                   Topography

                   A 1-kilometre resolution Digital Elevation Model (DEM) of Europe
                   derived from the Shuttle Radar Topography Mission (SRTM) is used by
                   the EFAS hydrological model (colours indicate elevation). A DEM
                   is critical for establishing the slope of terrain in river catchments,
                   which in turn has implications for runoff intensity and the potential
                   for erosion.

                   Source: EFAS.


                                              Information for decision making: water 49
Slope and hypsometry

Intermediate landform products derived from the DEM include slope
classification (steepness intensity, below upper) and hypsometry
(elevation categories, below lower). Flood alert systems need these
products in order to determine the channelling of precipitation runoff and
river flow.

                                 Slope
                                 classes
                                     1
                                     2
                                     3
                                     4
                                     5
                                     6
                                     7


             Hypsometry
             classes
                2
                3
                4
                5
                6
                7
                8

                                           Source: GISCO LAEA.


                                                                             Intermediate landform products

                                                                             Intermediate landform products derived from the slope and hyp-
                                                                             sometry classifications include the probability drainage density, the
                                                                             likelihood of water collecting into an area (upper), and ultimately the
                                                                             river channel network (lower), for which the hydrological model
                                                                             computes water flux in the river basins.


50 Crafting geoinformation
Precipitation forecast

Deterministic precipitation forecasts are used as inputs into the                        To increase the robustness of medium-range forecasts, Ensemble
hydrological model. In the case of Europe, forecasts for up to 10 days             Prediction Systems (EPS) are used to provide an average forecast
are supplied by the European Centre for Medium-Range Weather                       computed from several dozen numerical weather model runs. This
Forecasting (ECWMF), and for up to seven days by the German Weather                average forecast is then compared with the deterministic forecasts as
Service (Deutsche Wetter Dienst – DWD).                                            a precipitation input to the hydrological model.

               60ºW                40ºW                 20ºW                  0º                 20ºE                 40ºE                60ºE


                                                                                                                                                          Probability
                                                                                                                                                          of precipitation
                                                                                                                                                          (%)
                                                                                                                                                              100


   60ºN

                                                                                                                                                              95


   50ºN


   40ºN


                                                                                                                                                              65


   30ºN


                                                                                                                                                              35
              60ºW                 40ºW                 20ºW                  0º                 20ºE                40ºE                 60ºE
     Wednesday 21 July 2010 00UTC. Forecast probability t+038-080 VT: Thursday 22 July 2010 12 UTC. Surface: Total precipitation of at least 10 mm.

                                                                                                                                                      Source: ECMWF.


                                                                                                                     Information for decision making: water 51
Annual run-off

The global distribution of mean annual runoff (mm/year) indicates the
maximum available renewable freshwater resource. The amount of
water that is actually usable depends also on consumption and water
pollution, in addition to the infrastructure for supporting stable water
supply.

Source: Oki and Kanae, Science, 2006.


                                                                               Annual runoff (mm/y)
                                   210º       240º   270º   300º        330º          0º      30º     60º         90º           120º   150º    180º


                       60º


                       30º


                        0º


                      -30º


                      -60º


                             0            5          10            50           100           200           500         1,000          2,000          5,000


52 Crafting geoinformation
Water scarcity

                                                                                       The water scarcity index reflects the balance between the annual water
                                                                                       withdrawal and the maximum available renewable freshwater resource.
                                                                                       Water stress is high for regions with a high index.

                                                                                       Source: Oki and Kanae, Science, 2006.


                                                               Water scarcity index
              210º   240º          270º   300º          330º         0º          30º        60º          90º         120º         150º      180º


60º


30º


 0º


-30º


-60º


       0.00                 0.01                 0.10                     0.20                 0.40                      0.60                 1.00


                                                                                                                            Information for decision making: water 53
Geo7 crafting geoinformation

Mais conteúdo relacionado

Destaque

Aula 08 de ciências naturais e suas tecnologias
Aula 08 de ciências naturais e suas tecnologiasAula 08 de ciências naturais e suas tecnologias
Aula 08 de ciências naturais e suas tecnologiasHomero Alves de Lima
 
2012 01 13_r lach, w wapiński, wyniki projektu plan4_all dla wdrażania inspir...
2012 01 13_r lach, w wapiński, wyniki projektu plan4_all dla wdrażania inspir...2012 01 13_r lach, w wapiński, wyniki projektu plan4_all dla wdrażania inspir...
2012 01 13_r lach, w wapiński, wyniki projektu plan4_all dla wdrażania inspir...Robert Jerzy Lach
 
2005 Applications of optical and radar VHR Commercial Observation Satellites ...
2005 Applications of optical and radar VHR Commercial Observation Satellites ...2005 Applications of optical and radar VHR Commercial Observation Satellites ...
2005 Applications of optical and radar VHR Commercial Observation Satellites ...Robert Jerzy Lach
 
Digital agenda scoreboard 2011
Digital agenda scoreboard 2011Digital agenda scoreboard 2011
Digital agenda scoreboard 2011Robert Jerzy Lach
 
Catalan Spatial Data Infrastructure
Catalan Spatial Data InfrastructureCatalan Spatial Data Infrastructure
Catalan Spatial Data InfrastructureRobert Jerzy Lach
 
2012_01_13_R Lach, W Wapiński, Wyniki Projektu PLAN4ALL dla wdrażania INSPIRE...
2012_01_13_R Lach, W Wapiński, Wyniki Projektu PLAN4ALL dla wdrażania INSPIRE...2012_01_13_R Lach, W Wapiński, Wyniki Projektu PLAN4ALL dla wdrażania INSPIRE...
2012_01_13_R Lach, W Wapiński, Wyniki Projektu PLAN4ALL dla wdrażania INSPIRE...Robert Jerzy Lach
 
111202 varsovie francois-salgé
111202 varsovie francois-salgé111202 varsovie francois-salgé
111202 varsovie francois-salgéRobert Jerzy Lach
 

Destaque (9)

Aula 08 de ciências naturais e suas tecnologias
Aula 08 de ciências naturais e suas tecnologiasAula 08 de ciências naturais e suas tecnologias
Aula 08 de ciências naturais e suas tecnologias
 
2012 01 13_r lach, w wapiński, wyniki projektu plan4_all dla wdrażania inspir...
2012 01 13_r lach, w wapiński, wyniki projektu plan4_all dla wdrażania inspir...2012 01 13_r lach, w wapiński, wyniki projektu plan4_all dla wdrażania inspir...
2012 01 13_r lach, w wapiński, wyniki projektu plan4_all dla wdrażania inspir...
 
2005 Applications of optical and radar VHR Commercial Observation Satellites ...
2005 Applications of optical and radar VHR Commercial Observation Satellites ...2005 Applications of optical and radar VHR Commercial Observation Satellites ...
2005 Applications of optical and radar VHR Commercial Observation Satellites ...
 
Digital agenda scoreboard 2011
Digital agenda scoreboard 2011Digital agenda scoreboard 2011
Digital agenda scoreboard 2011
 
Catalan Spatial Data Infrastructure
Catalan Spatial Data InfrastructureCatalan Spatial Data Infrastructure
Catalan Spatial Data Infrastructure
 
2012_01_13_R Lach, W Wapiński, Wyniki Projektu PLAN4ALL dla wdrażania INSPIRE...
2012_01_13_R Lach, W Wapiński, Wyniki Projektu PLAN4ALL dla wdrażania INSPIRE...2012_01_13_R Lach, W Wapiński, Wyniki Projektu PLAN4ALL dla wdrażania INSPIRE...
2012_01_13_R Lach, W Wapiński, Wyniki Projektu PLAN4ALL dla wdrażania INSPIRE...
 
Longhorn cba indicators
Longhorn cba indicatorsLonghorn cba indicators
Longhorn cba indicators
 
111202 varsovie francois-salgé
111202 varsovie francois-salgé111202 varsovie francois-salgé
111202 varsovie francois-salgé
 
A1 06 Earth
A1 06 EarthA1 06 Earth
A1 06 Earth
 

Semelhante a Geo7 crafting geoinformation

geo7_crafting_geoinformation
geo7_crafting_geoinformationgeo7_crafting_geoinformation
geo7_crafting_geoinformationMichael Williams
 
Ligando o nosso futuro com tempo, clima e água
Ligando o nosso futuro com tempo, clima e águaLigando o nosso futuro com tempo, clima e água
Ligando o nosso futuro com tempo, clima e águaRobson Peixoto
 
AI and Satellite Remote Sensing Data for Improved Decision-making in the Afri...
AI and Satellite Remote Sensing Data for Improved Decision-making in the Afri...AI and Satellite Remote Sensing Data for Improved Decision-making in the Afri...
AI and Satellite Remote Sensing Data for Improved Decision-making in the Afri...AKADEMIYA2063
 
C0.5: CEOS and Oceans - Chu Ishida, Alex Held
C0.5: CEOS and Oceans - Chu Ishida, Alex HeldC0.5: CEOS and Oceans - Chu Ishida, Alex Held
C0.5: CEOS and Oceans - Chu Ishida, Alex HeldBlue Planet Symposium
 
Canada; Rainwater Collection System: A Feasibility Study for Dalhousie Univ...
Canada;  Rainwater Collection System:  A Feasibility Study for Dalhousie Univ...Canada;  Rainwater Collection System:  A Feasibility Study for Dalhousie Univ...
Canada; Rainwater Collection System: A Feasibility Study for Dalhousie Univ...D5Z
 
World new climático
World new climáticoWorld new climático
World new climáticoJaume Satorra
 
Water security and ecosystem services
Water security and ecosystem servicesWater security and ecosystem services
Water security and ecosystem servicesChristina Parmionova
 
C0.3: Blue Planet Overview - Sophie Seeyave
C0.3: Blue Planet Overview - Sophie SeeyaveC0.3: Blue Planet Overview - Sophie Seeyave
C0.3: Blue Planet Overview - Sophie SeeyaveBlue Planet Symposium
 
Early Warning Systems
Early Warning SystemsEarly Warning Systems
Early Warning Systemskaakaawaah
 
Locate17 and ISDE10 Keynote_S Ramage GEO April 2017
Locate17 and ISDE10 Keynote_S Ramage GEO April 2017Locate17 and ISDE10 Keynote_S Ramage GEO April 2017
Locate17 and ISDE10 Keynote_S Ramage GEO April 2017Steven Ramage
 
Analysis of the GEF GW Portfolio
Analysis of the GEF GW PortfolioAnalysis of the GEF GW Portfolio
Analysis of the GEF GW Portfoliogroundwatercop
 
Climate Frontline Africa
Climate Frontline AfricaClimate Frontline Africa
Climate Frontline AfricaFARM-Africa
 
Atlas de mortalidad y pérdidas económicas debido al clima OMM
Atlas de mortalidad y pérdidas económicas debido al clima OMMAtlas de mortalidad y pérdidas económicas debido al clima OMM
Atlas de mortalidad y pérdidas económicas debido al clima OMMhidrometeorologiaucv
 
Newsletter 217
Newsletter 217Newsletter 217
Newsletter 217ESTHHUB
 
IPCC Special Report on the Ocean and Cryosphere in a Changing Climate: What's...
IPCC Special Report on the Ocean and Cryosphere in a Changing Climate: What's...IPCC Special Report on the Ocean and Cryosphere in a Changing Climate: What's...
IPCC Special Report on the Ocean and Cryosphere in a Changing Climate: What's...Climate and Development Knowledge Network
 

Semelhante a Geo7 crafting geoinformation (20)

geo7_crafting_geoinformation
geo7_crafting_geoinformationgeo7_crafting_geoinformation
geo7_crafting_geoinformation
 
Ligando o nosso futuro com tempo, clima e água
Ligando o nosso futuro com tempo, clima e águaLigando o nosso futuro com tempo, clima e água
Ligando o nosso futuro com tempo, clima e água
 
Mercator Ocean newsletter 31
Mercator Ocean newsletter 31Mercator Ocean newsletter 31
Mercator Ocean newsletter 31
 
AI and Satellite Remote Sensing Data for Improved Decision-making in the Afri...
AI and Satellite Remote Sensing Data for Improved Decision-making in the Afri...AI and Satellite Remote Sensing Data for Improved Decision-making in the Afri...
AI and Satellite Remote Sensing Data for Improved Decision-making in the Afri...
 
C0.5: CEOS and Oceans - Chu Ishida, Alex Held
C0.5: CEOS and Oceans - Chu Ishida, Alex HeldC0.5: CEOS and Oceans - Chu Ishida, Alex Held
C0.5: CEOS and Oceans - Chu Ishida, Alex Held
 
Canada; Rainwater Collection System: A Feasibility Study for Dalhousie Univ...
Canada;  Rainwater Collection System:  A Feasibility Study for Dalhousie Univ...Canada;  Rainwater Collection System:  A Feasibility Study for Dalhousie Univ...
Canada; Rainwater Collection System: A Feasibility Study for Dalhousie Univ...
 
Wmo1071
Wmo1071Wmo1071
Wmo1071
 
World new climático
World new climáticoWorld new climático
World new climático
 
Water security and ecosystem services
Water security and ecosystem servicesWater security and ecosystem services
Water security and ecosystem services
 
C0.3: Blue Planet Overview - Sophie Seeyave
C0.3: Blue Planet Overview - Sophie SeeyaveC0.3: Blue Planet Overview - Sophie Seeyave
C0.3: Blue Planet Overview - Sophie Seeyave
 
Early Warning Systems
Early Warning SystemsEarly Warning Systems
Early Warning Systems
 
Locate17 and ISDE10 Keynote_S Ramage GEO April 2017
Locate17 and ISDE10 Keynote_S Ramage GEO April 2017Locate17 and ISDE10 Keynote_S Ramage GEO April 2017
Locate17 and ISDE10 Keynote_S Ramage GEO April 2017
 
Analysis of the GEF GW Portfolio
Analysis of the GEF GW PortfolioAnalysis of the GEF GW Portfolio
Analysis of the GEF GW Portfolio
 
NASA Keynote Presentation - Monday Conservation Forum
NASA Keynote Presentation - Monday Conservation ForumNASA Keynote Presentation - Monday Conservation Forum
NASA Keynote Presentation - Monday Conservation Forum
 
Mercator Ocean newsletter 49
Mercator Ocean newsletter 49Mercator Ocean newsletter 49
Mercator Ocean newsletter 49
 
Climate Frontline Africa
Climate Frontline AfricaClimate Frontline Africa
Climate Frontline Africa
 
Atlas de mortalidad y pérdidas económicas debido al clima OMM
Atlas de mortalidad y pérdidas económicas debido al clima OMMAtlas de mortalidad y pérdidas económicas debido al clima OMM
Atlas de mortalidad y pérdidas económicas debido al clima OMM
 
Newsletter 217
Newsletter 217Newsletter 217
Newsletter 217
 
IPCC Special Report on the Ocean and Cryosphere in a Changing Climate: What's...
IPCC Special Report on the Ocean and Cryosphere in a Changing Climate: What's...IPCC Special Report on the Ocean and Cryosphere in a Changing Climate: What's...
IPCC Special Report on the Ocean and Cryosphere in a Changing Climate: What's...
 
IPCC Special Report on the Ocean and Cryosphere in a Changing Climate: What's...
IPCC Special Report on the Ocean and Cryosphere in a Changing Climate: What's...IPCC Special Report on the Ocean and Cryosphere in a Changing Climate: What's...
IPCC Special Report on the Ocean and Cryosphere in a Changing Climate: What's...
 

Mais de Robert Jerzy Lach

FME world tour_2019_robert_lach
FME world tour_2019_robert_lachFME world tour_2019_robert_lach
FME world tour_2019_robert_lachRobert Jerzy Lach
 
2002 technological boundary of orthorectification of ikonos r lach
2002 technological boundary of orthorectification of ikonos r lach2002 technological boundary of orthorectification of ikonos r lach
2002 technological boundary of orthorectification of ikonos r lachRobert Jerzy Lach
 
2002 Technological boundary of accuracy of orthorectification of IKONOS and Q...
2002 Technological boundary of accuracy of orthorectification of IKONOS and Q...2002 Technological boundary of accuracy of orthorectification of IKONOS and Q...
2002 Technological boundary of accuracy of orthorectification of IKONOS and Q...Robert Jerzy Lach
 
URBAN ATLAS PRODUCTION First Results Dr Christophe Sannier
URBAN ATLAS PRODUCTION First Results Dr Christophe SannierURBAN ATLAS PRODUCTION First Results Dr Christophe Sannier
URBAN ATLAS PRODUCTION First Results Dr Christophe SannierRobert Jerzy Lach
 
H lan data-slides-Pierre Laconte
H lan data-slides-Pierre LaconteH lan data-slides-Pierre Laconte
H lan data-slides-Pierre LaconteRobert Jerzy Lach
 
Lach ppt gi2011_cost & benefit factors of regio_sdi
Lach ppt gi2011_cost & benefit factors of regio_sdiLach ppt gi2011_cost & benefit factors of regio_sdi
Lach ppt gi2011_cost & benefit factors of regio_sdiRobert Jerzy Lach
 
R lach wiosna w planowaniu 2010 05 04v3
R lach wiosna w planowaniu 2010 05 04v3R lach wiosna w planowaniu 2010 05 04v3
R lach wiosna w planowaniu 2010 05 04v3Robert Jerzy Lach
 

Mais de Robert Jerzy Lach (9)

FME world tour_2019_robert_lach
FME world tour_2019_robert_lachFME world tour_2019_robert_lach
FME world tour_2019_robert_lach
 
2002 technological boundary of orthorectification of ikonos r lach
2002 technological boundary of orthorectification of ikonos r lach2002 technological boundary of orthorectification of ikonos r lach
2002 technological boundary of orthorectification of ikonos r lach
 
GEOSS - the full picture
GEOSS - the full pictureGEOSS - the full picture
GEOSS - the full picture
 
111202 varsovie f-salgé
111202 varsovie f-salgé111202 varsovie f-salgé
111202 varsovie f-salgé
 
2002 Technological boundary of accuracy of orthorectification of IKONOS and Q...
2002 Technological boundary of accuracy of orthorectification of IKONOS and Q...2002 Technological boundary of accuracy of orthorectification of IKONOS and Q...
2002 Technological boundary of accuracy of orthorectification of IKONOS and Q...
 
URBAN ATLAS PRODUCTION First Results Dr Christophe Sannier
URBAN ATLAS PRODUCTION First Results Dr Christophe SannierURBAN ATLAS PRODUCTION First Results Dr Christophe Sannier
URBAN ATLAS PRODUCTION First Results Dr Christophe Sannier
 
H lan data-slides-Pierre Laconte
H lan data-slides-Pierre LaconteH lan data-slides-Pierre Laconte
H lan data-slides-Pierre Laconte
 
Lach ppt gi2011_cost & benefit factors of regio_sdi
Lach ppt gi2011_cost & benefit factors of regio_sdiLach ppt gi2011_cost & benefit factors of regio_sdi
Lach ppt gi2011_cost & benefit factors of regio_sdi
 
R lach wiosna w planowaniu 2010 05 04v3
R lach wiosna w planowaniu 2010 05 04v3R lach wiosna w planowaniu 2010 05 04v3
R lach wiosna w planowaniu 2010 05 04v3
 

Último

Innovation Conference 5th March 2024.pdf
Innovation Conference 5th March 2024.pdfInnovation Conference 5th March 2024.pdf
Innovation Conference 5th March 2024.pdfrichard876048
 
APRIL2024_UKRAINE_xml_0000000000000 .pdf
APRIL2024_UKRAINE_xml_0000000000000 .pdfAPRIL2024_UKRAINE_xml_0000000000000 .pdf
APRIL2024_UKRAINE_xml_0000000000000 .pdfRbc Rbcua
 
Keppel Ltd. 1Q 2024 Business Update Presentation Slides
Keppel Ltd. 1Q 2024 Business Update  Presentation SlidesKeppel Ltd. 1Q 2024 Business Update  Presentation Slides
Keppel Ltd. 1Q 2024 Business Update Presentation SlidesKeppelCorporation
 
Digital Transformation in the PLM domain - distrib.pdf
Digital Transformation in the PLM domain - distrib.pdfDigital Transformation in the PLM domain - distrib.pdf
Digital Transformation in the PLM domain - distrib.pdfJos Voskuil
 
Pitch Deck Teardown: Geodesic.Life's $500k Pre-seed deck
Pitch Deck Teardown: Geodesic.Life's $500k Pre-seed deckPitch Deck Teardown: Geodesic.Life's $500k Pre-seed deck
Pitch Deck Teardown: Geodesic.Life's $500k Pre-seed deckHajeJanKamps
 
Annual General Meeting Presentation Slides
Annual General Meeting Presentation SlidesAnnual General Meeting Presentation Slides
Annual General Meeting Presentation SlidesKeppelCorporation
 
Cybersecurity Awareness Training Presentation v2024.03
Cybersecurity Awareness Training Presentation v2024.03Cybersecurity Awareness Training Presentation v2024.03
Cybersecurity Awareness Training Presentation v2024.03DallasHaselhorst
 
(Best) ENJOY Call Girls in Faridabad Ex | 8377087607
(Best) ENJOY Call Girls in Faridabad Ex | 8377087607(Best) ENJOY Call Girls in Faridabad Ex | 8377087607
(Best) ENJOY Call Girls in Faridabad Ex | 8377087607dollysharma2066
 
Call Girls In Sikandarpur Gurgaon ❤️8860477959_Russian 100% Genuine Escorts I...
Call Girls In Sikandarpur Gurgaon ❤️8860477959_Russian 100% Genuine Escorts I...Call Girls In Sikandarpur Gurgaon ❤️8860477959_Russian 100% Genuine Escorts I...
Call Girls In Sikandarpur Gurgaon ❤️8860477959_Russian 100% Genuine Escorts I...lizamodels9
 
Kenya Coconut Production Presentation by Dr. Lalith Perera
Kenya Coconut Production Presentation by Dr. Lalith PereraKenya Coconut Production Presentation by Dr. Lalith Perera
Kenya Coconut Production Presentation by Dr. Lalith Pereraictsugar
 
Lowrate Call Girls In Sector 18 Noida ❤️8860477959 Escorts 100% Genuine Servi...
Lowrate Call Girls In Sector 18 Noida ❤️8860477959 Escorts 100% Genuine Servi...Lowrate Call Girls In Sector 18 Noida ❤️8860477959 Escorts 100% Genuine Servi...
Lowrate Call Girls In Sector 18 Noida ❤️8860477959 Escorts 100% Genuine Servi...lizamodels9
 
Marketplace and Quality Assurance Presentation - Vincent Chirchir
Marketplace and Quality Assurance Presentation - Vincent ChirchirMarketplace and Quality Assurance Presentation - Vincent Chirchir
Marketplace and Quality Assurance Presentation - Vincent Chirchirictsugar
 
Case study on tata clothing brand zudio in detail
Case study on tata clothing brand zudio in detailCase study on tata clothing brand zudio in detail
Case study on tata clothing brand zudio in detailAriel592675
 
FULL ENJOY Call girls in Paharganj Delhi | 8377087607
FULL ENJOY Call girls in Paharganj Delhi | 8377087607FULL ENJOY Call girls in Paharganj Delhi | 8377087607
FULL ENJOY Call girls in Paharganj Delhi | 8377087607dollysharma2066
 
/:Call Girls In Indirapuram Ghaziabad ➥9990211544 Independent Best Escorts In...
/:Call Girls In Indirapuram Ghaziabad ➥9990211544 Independent Best Escorts In.../:Call Girls In Indirapuram Ghaziabad ➥9990211544 Independent Best Escorts In...
/:Call Girls In Indirapuram Ghaziabad ➥9990211544 Independent Best Escorts In...lizamodels9
 
International Business Environments and Operations 16th Global Edition test b...
International Business Environments and Operations 16th Global Edition test b...International Business Environments and Operations 16th Global Edition test b...
International Business Environments and Operations 16th Global Edition test b...ssuserf63bd7
 
8447779800, Low rate Call girls in Kotla Mubarakpur Delhi NCR
8447779800, Low rate Call girls in Kotla Mubarakpur Delhi NCR8447779800, Low rate Call girls in Kotla Mubarakpur Delhi NCR
8447779800, Low rate Call girls in Kotla Mubarakpur Delhi NCRashishs7044
 
BEST Call Girls In Old Faridabad ✨ 9773824855 ✨ Escorts Service In Delhi Ncr,
BEST Call Girls In Old Faridabad ✨ 9773824855 ✨ Escorts Service In Delhi Ncr,BEST Call Girls In Old Faridabad ✨ 9773824855 ✨ Escorts Service In Delhi Ncr,
BEST Call Girls In Old Faridabad ✨ 9773824855 ✨ Escorts Service In Delhi Ncr,noida100girls
 
Independent Call Girls Andheri Nightlaila 9967584737
Independent Call Girls Andheri Nightlaila 9967584737Independent Call Girls Andheri Nightlaila 9967584737
Independent Call Girls Andheri Nightlaila 9967584737Riya Pathan
 
Flow Your Strategy at Flight Levels Day 2024
Flow Your Strategy at Flight Levels Day 2024Flow Your Strategy at Flight Levels Day 2024
Flow Your Strategy at Flight Levels Day 2024Kirill Klimov
 

Último (20)

Innovation Conference 5th March 2024.pdf
Innovation Conference 5th March 2024.pdfInnovation Conference 5th March 2024.pdf
Innovation Conference 5th March 2024.pdf
 
APRIL2024_UKRAINE_xml_0000000000000 .pdf
APRIL2024_UKRAINE_xml_0000000000000 .pdfAPRIL2024_UKRAINE_xml_0000000000000 .pdf
APRIL2024_UKRAINE_xml_0000000000000 .pdf
 
Keppel Ltd. 1Q 2024 Business Update Presentation Slides
Keppel Ltd. 1Q 2024 Business Update  Presentation SlidesKeppel Ltd. 1Q 2024 Business Update  Presentation Slides
Keppel Ltd. 1Q 2024 Business Update Presentation Slides
 
Digital Transformation in the PLM domain - distrib.pdf
Digital Transformation in the PLM domain - distrib.pdfDigital Transformation in the PLM domain - distrib.pdf
Digital Transformation in the PLM domain - distrib.pdf
 
Pitch Deck Teardown: Geodesic.Life's $500k Pre-seed deck
Pitch Deck Teardown: Geodesic.Life's $500k Pre-seed deckPitch Deck Teardown: Geodesic.Life's $500k Pre-seed deck
Pitch Deck Teardown: Geodesic.Life's $500k Pre-seed deck
 
Annual General Meeting Presentation Slides
Annual General Meeting Presentation SlidesAnnual General Meeting Presentation Slides
Annual General Meeting Presentation Slides
 
Cybersecurity Awareness Training Presentation v2024.03
Cybersecurity Awareness Training Presentation v2024.03Cybersecurity Awareness Training Presentation v2024.03
Cybersecurity Awareness Training Presentation v2024.03
 
(Best) ENJOY Call Girls in Faridabad Ex | 8377087607
(Best) ENJOY Call Girls in Faridabad Ex | 8377087607(Best) ENJOY Call Girls in Faridabad Ex | 8377087607
(Best) ENJOY Call Girls in Faridabad Ex | 8377087607
 
Call Girls In Sikandarpur Gurgaon ❤️8860477959_Russian 100% Genuine Escorts I...
Call Girls In Sikandarpur Gurgaon ❤️8860477959_Russian 100% Genuine Escorts I...Call Girls In Sikandarpur Gurgaon ❤️8860477959_Russian 100% Genuine Escorts I...
Call Girls In Sikandarpur Gurgaon ❤️8860477959_Russian 100% Genuine Escorts I...
 
Kenya Coconut Production Presentation by Dr. Lalith Perera
Kenya Coconut Production Presentation by Dr. Lalith PereraKenya Coconut Production Presentation by Dr. Lalith Perera
Kenya Coconut Production Presentation by Dr. Lalith Perera
 
Lowrate Call Girls In Sector 18 Noida ❤️8860477959 Escorts 100% Genuine Servi...
Lowrate Call Girls In Sector 18 Noida ❤️8860477959 Escorts 100% Genuine Servi...Lowrate Call Girls In Sector 18 Noida ❤️8860477959 Escorts 100% Genuine Servi...
Lowrate Call Girls In Sector 18 Noida ❤️8860477959 Escorts 100% Genuine Servi...
 
Marketplace and Quality Assurance Presentation - Vincent Chirchir
Marketplace and Quality Assurance Presentation - Vincent ChirchirMarketplace and Quality Assurance Presentation - Vincent Chirchir
Marketplace and Quality Assurance Presentation - Vincent Chirchir
 
Case study on tata clothing brand zudio in detail
Case study on tata clothing brand zudio in detailCase study on tata clothing brand zudio in detail
Case study on tata clothing brand zudio in detail
 
FULL ENJOY Call girls in Paharganj Delhi | 8377087607
FULL ENJOY Call girls in Paharganj Delhi | 8377087607FULL ENJOY Call girls in Paharganj Delhi | 8377087607
FULL ENJOY Call girls in Paharganj Delhi | 8377087607
 
/:Call Girls In Indirapuram Ghaziabad ➥9990211544 Independent Best Escorts In...
/:Call Girls In Indirapuram Ghaziabad ➥9990211544 Independent Best Escorts In.../:Call Girls In Indirapuram Ghaziabad ➥9990211544 Independent Best Escorts In...
/:Call Girls In Indirapuram Ghaziabad ➥9990211544 Independent Best Escorts In...
 
International Business Environments and Operations 16th Global Edition test b...
International Business Environments and Operations 16th Global Edition test b...International Business Environments and Operations 16th Global Edition test b...
International Business Environments and Operations 16th Global Edition test b...
 
8447779800, Low rate Call girls in Kotla Mubarakpur Delhi NCR
8447779800, Low rate Call girls in Kotla Mubarakpur Delhi NCR8447779800, Low rate Call girls in Kotla Mubarakpur Delhi NCR
8447779800, Low rate Call girls in Kotla Mubarakpur Delhi NCR
 
BEST Call Girls In Old Faridabad ✨ 9773824855 ✨ Escorts Service In Delhi Ncr,
BEST Call Girls In Old Faridabad ✨ 9773824855 ✨ Escorts Service In Delhi Ncr,BEST Call Girls In Old Faridabad ✨ 9773824855 ✨ Escorts Service In Delhi Ncr,
BEST Call Girls In Old Faridabad ✨ 9773824855 ✨ Escorts Service In Delhi Ncr,
 
Independent Call Girls Andheri Nightlaila 9967584737
Independent Call Girls Andheri Nightlaila 9967584737Independent Call Girls Andheri Nightlaila 9967584737
Independent Call Girls Andheri Nightlaila 9967584737
 
Flow Your Strategy at Flight Levels Day 2024
Flow Your Strategy at Flight Levels Day 2024Flow Your Strategy at Flight Levels Day 2024
Flow Your Strategy at Flight Levels Day 2024
 

Geo7 crafting geoinformation

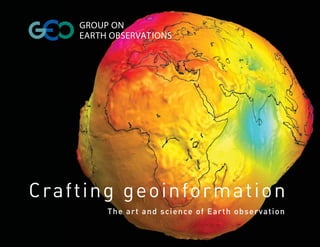
  • 1. GROUP ON EARTH OBSERVATIONS Crafting geoinformation The art and science of Earth observation
  • 2.
  • 3. GROUP ON EARTH OBSERVATIONS Crafting geoinformation The art and science of Earth observation
  • 4. GROUP ON EARTH OBSERVATIONS 7 bis, avenue de la Paix, CP 2300 CH-1211 Geneva 2, Switzerland Tel +41 22 730 8505 www.earthobservations.org The Group on Earth Observations is coordinating efforts to build a Global © Group on Earth Observations, November 2010 Earth Observation System of Systems, or GEOSS. It was launched in response to calls for action by the 2002 World Summit on Sustainable ISBN 978-0-9563387-4-7 Development and by the G8 (Group of Eight) leading industrialized countries. These high-level meetings recognized that international collaboration is Prepared by the GEO Secretariat, Geneva, Switzerland essential for exploiting the growing potential of Earth observations to Coordination: Michael Williams and José Achache support decision making in an increasingly complex and environmentally stressed world. URL: www.earthobservations.org/docs_pub.shtml GEO is a voluntary partnership of governments and international organizations. It provides a framework within which these partners can Cover photo: The EIGEN-CG01C geoid. The NASA/DLR GRACE mission develop new projects and coordinate their strategies and investments. As (Gravity Recovery And Climate Experiment) provides highly accurate data of June 2010, GEO’s members include 81 governments and the European on Earth’s gravity field. Using these data, models such as this ‘EIGEN- Commission. In addition, 58 intergovernmental, international and regional CG01C’ geoid can be created. The geoid is a reference surface in the organizations with a mandate in Earth observation or related issues have gravity field of Earth for the measurement and description of the planet’s been recognized as participating organizations. shape. The data come from both GRACE and the satellite CHAMP. GEO is constructing GEOSS on the basis of a 10-year implementation plan for the period 2005 to 2015. The plan defines a vision statement for A Banson production GEOSS, its purpose and scope, expected benefits, and the nine “Societal Cambridge, UK Benefit Areas” of disasters, health, energy, climate, water, weather, Printed in the UK by the Lavenham Press ecosystems, agriculture and biodiversity. using FSC-certified papers.
  • 5. CONTENTS INTRODUCTION 5 CONTRIBUTING AGENCIES AND ORGANIZATIONS 8 INFORMATION FOR DECISION MAKING 13 DISASTERS: The Haiti earthquake 15 HEALTH: Meningitis in Africa 25 ENERGY: The Deepwater Horizon oil spill 30 CLIMATE: Forests and carbon 37 WATER: Water resources 45 PRODUCING DATA 55 Carbon dioxide: flux towers ................................................................................................................................................................56 Ocean temperature and salinity: Argo buoys .....................................................................................................................58 Volcanic ash clouds: Lidars................................................................................................................................................61 Greenhouse gases: the “IBUKI” satellite...........................................................................................................................66 Topography: radar from satellites ....................................................................................................................................68 Gravity: the GRACE satellites.............................................................................................................................................70 Past climates: ice cores ....................................................................................................................................................72 Rain: radar stations...........................................................................................................................................................74 Mapping the surface: virtual satellite consellations..........................................................................................................76 Earthquakes: the Global Seismographic Network .............................................................................................................78 On-site validation: the GEO-Wiki ......................................................................................................................................79 Interoperability: the Sensor Web.......................................................................................................................................83 In situ observation: people power .....................................................................................................................................84 The art and science of Earth observation 3
  • 6. WEATHER: Typhoon Lupit 85 ECOSYSTEMS: Ecosystem services 92 AGRICULTURE: Food security 99 BIODIVERSITY: Protected areas 108 CONCLUSION: Global change and trends 116 4 Crafting geoinformation
  • 7. Crafting geoinformation: The art and science of Earth observation INTRODUCTION roducing geoinformation is a science, and an art. Like every creative the feast that is GEOSS, the Global Earth Observation System of Systems. P human endeavour, it requires a sense of purpose, plus fortitude, ingenuity, training and talent. They are the individuals standing behind the multitude of observation systems, models, computers and information services that are increasingly essential to helping humanity mitigate natural disasters and Forecasting next week’s weather, next winter’s snow cover, this year’s disease epidemics, predict severe weather events, sustainably manage global soy production, or long-term changes in forest cover all require natural resources and maintain our ecological balance. an impressive combination of technology, hard work and expertise. The production chain for generating such forecasts and assessments, from Crafting geoinformation seeks to inspire greater appreciation of the art the conception of an Earth monitoring instrument for gathering the and science of Earth observation by taking the reader behind the scenes necessary data to the final delivery of useful information, is a long one. and revealing the secrets of the kitchen where geoinformation is made. Compelling photos of the cloud-wreathed Earth from space, or highly OBSERVING OUR PLANET processed, multi-coloured images of its surface, are familiar sights GEOSS interconnects the Earth observation systems that are owned today. What people do not always realize is just how much work goes into and maintained by the member governments and participating making these observations available. Designing, building, launching, organizations of the Group on Earth Observations (GEO). Investments in testing, processing and delivering data from an observation system takes environmental monitoring and forecasting have now reached a critical a minimum of five years, often 10 years for space-based instruments. mass, resulting in a vast and expanding array of observation systems. Even more time, technology, expertise and collaboration are required to These include ocean buoys, meteorological stations and balloons, sonar transform these data into information products and services that can and radar systems, seismic and Global Positioning System (GPS) support decision making. This endeavour can be compared to making stations, more than 60 high-tech environmental satellites and a large fine wine or preparing a great meal: although the diner rarely peeks into number of powerful computerized models. GEO seeks to make these the kitchen to see how the ingredients are being assembled and systems fully interoperable and accessible. processed, he can only enjoy the gourmet dishes and vintage bottles thanks to the intensive labour, technology, creativity and skills of highly Crafting geoinformation describes a small sample of the observing trained teams. instruments and systems that monitor the Earth from space, the atmosphere, the oceans and the land. Each instrument provides a unique This book is dedicated to the engineers, technicians, scientists, computer vantage point on some aspect of the Earth system; together, they offer a geeks and practitioners – the wine makers and chefs who are serving up comprehensive picture of the planet. Introduction 5
  • 8. Many of these instruments are arrayed in regional networks, while Geo-Wiki project provides an innovative example of how the internet can others are contained in global networks maintained by international be used to network people and ensure the in situ validation of remote partnerships. The examples given here are of radars for tracking rain, observations; it invites individuals around the world to share their flux towers for measuring carbon dioxide levels, ocean buoys for personal knowledge and observations to help validate regional and monitoring currents and heat transport, and seismographs for recording global land cover maps. earthquakes. Also featured are the high-powered drills used to obtain ice cores for reconstructing past climates. INFORMING DECISION MAKERS The bulk of this book is dedicated to nine stories that picture GEOSS- In addition to these instruments based on or near the Earth’s surface, based decision making in the nine GEO societal benefit areas, thus more and more instruments are being flown by satellites. The ones illustrating the range of highly topical issues that Earth observation described in this book are used to measure atmospheric levels of carbon helps to address. We have deliberately chosen not to provide the dioxide and methane; to image the Earth’s surface, topography and technical details of how each system works. Instead, the stories simply tectonic deformation; and to monitor the Earth’s gravity field in order to outline the process for gathering data and images, processing and gain insight into the thickness of the polar ice caps and changes in the combining them, and then presenting the resulting information to subsurface water table. decision makers. To date, one of GEO’s greatest accomplishments has been to advance For example, earthquakes were big news in 2010. The days and weeks the full and open sharing of Earth observation data. Several examples following the quake that struck Port-au-Prince in January 2010 revealed are offered that highlight the importance of such openness and that the rapid provision of information was critical in enabling emergency collaboration. The concept of virtual constellations, whereby space responders to take rapid action. agencies coordinate the missions and outputs of their satellites in order to compensate for the long time it takes individual instruments The case study on meningitis epidemics in Africa provides further to revisit the same site, is illustrated by complementary images of evidence of how collaboration amongst data providers and analysts from central Beijing. different communities – in this case health experts and climate researchers – can generate information and answers that can save Lidars (LIght Detection And Ranging) have enormous potential for human lives. measuring forests, polar ice, clouds, aerosols, gases, wind and many other parameters. The need to track the ash cloud that Iceland’s Eyjafjallajökull Also in 2010, observations from satellites, ocean vessels and other volcano emitted in early 2010, causing chaos for air travellers in Europe, carriers were critical to the early and near-real time assessments of, provides a superb example of data sharing and collaboration. and responses to, the Deepwater Horizon oil spill in the Gulf of Mexico. One should not forget human observers with their pens and notebooks, The prediction of extreme weather events clearly requires rapid and perhaps the most sophisticated Earth observation instrument of all. The collaborative efforts to gather and analyse observations. The case of 6 Crafting geoinformation
  • 9. Typhoon Lupit, which threatened the Philippines in October 2009, All of the stories featured here confirm the key message that capturing confirms that space agencies, meteorological offices and analysts are observations and producing information is a complex and challenging well practised at sharing data and forecasts. Together they are now process. It requires heavy investment and long-term planning by generating more accurate probabilistic forecasts to help communities governments and organizations, innovative design and construction by anticipate and prepare for destructive storms. engineers and technicians, sophisticated modelling and analysis by scientists and experts, and the coordinated creativity and commitment Collaboration is also essential for predicting the availability of water of many individuals, institutions and governments. It is our hope that, resources for agriculture, energy and domestic use, as well as for after exploring this book, the reader will gain a better understanding of forecasting the risk of floods and droughts. Such work requires the the value of Earth observation and the critical importance of sustaining engagement of many different teams and systems for gathering wide- our global monitoring and information systems. ranging data and analyses on a diverse range of variables, such as precipitation, soils and topography. Yet another example looks at the provision of information on forest cover and, more importantly, deforestation rates. This is vital for estimating the capacity of forests to store carbon, preserve biodiversity and provide other ecosystem services. Environmental information products are also valuable tools for making longer-term decisions. Examples of how information is generated to support biodiversity conservation planning in Africa, and of how mapping is used to evaluate global ecosystems, further demonstrate the power of Earth observation. An ambitious effort to build a comprehensive global monitoring system for agriculture and food security offers similar insights into the increasing potential of geoinformation to promote human well-being. Crafting geoinformation concludes with a series of global images of the Earth that provide snapshots of the state of the planet in 2010. Some of the parameters shown do not change substantially over time. Other variables change continuously. These snapshots constitute a baseline José Achache against which we will be able to assess global change over the coming Secretariat Director years and decades. Group on Earth Observations Introduction 7
  • 10. THE FOLLOWING AGENCIES AND ORGANIZATIONS ARE THE PROVIDERS OF THE INFORMATION SYSTEMS, SERVICES AND PRODUCTS DESCRIBED IN THIS BOOK African Center of Meteorological Applications for Chinese Academy of Sciences Development (ACMAD) Committee on Earth Observation Satellites Argo (CEOS) AsiaFlux Consortium for Small-scale Modelling (COSMO) BirdLife International Disaster Monitoring Constellation (DMC) Brazil National Institute for Space Research EARLINET (INPE) European Civil Protection China Center for Resources Satellite Data and Application (CRESDA) European Commission (EC) China Meteorological Administration (CMA) European Commission Joint Research Centre (JRC) China National Space Administration (CNSA) 8 Crafting geoinformation
  • 11. European Centre for Medium-range Weather German Aerospace Center (DLR) Forecasts (ECMWF) German Weather Service (DWD) European Space Agency (ESA) Global Atmosphere Watch (GAW) e-GEOS Global Biodiversity Information Facility (GBIF) Famine Early Warning System Network (FEWS-NET) Global Monitoring for Environment and Security FluxNet (GMES) Food and Agriculture Organization of the United Global Runoff Data Centre (GRDC) Nations (FAO) Global Seismographic Network (GSN) French Space Agency (CNES) Indian Space Research Organisation (ISRO) GeoEye International Charter for Space and Major Disasters Geo-Wiki Contributing agencies and organizations 9
  • 12. International Institute for Applied Systems Analysis Meningitis Environmental Risk Information (IIASA) Technologies (MERIT) Project Italian Space Agency (ASI) OGC ® Open Geospatial Consortium, Inc. Open Geospatial Consortium, Inc. (OGC) Japan Aerospace Exploration Agency (JAXA) OneGeology Japan Meteorological Agency (JMA) Regional Service of Image Treatment and Remote Sensing (SERTIT) Japan Ministry of Economy, Trade and Industry (METI) SarVision Japan National Institute of Advanced Industrial South Africa Council for Scientific and Industrial Science and Technology (AIST) Research (CSIR) UK Met Office Japan National Institute of Informatics (NII) United Nations Environment Programme World JapanFlux Conservation Monitoring Centre (UNEP-WCMC) 10 Crafting geoinformation
  • 13. University of Maryland US National Oceanic and Atmospheric Administration (NOAA) University of Miami Wageningen University University of Tokyo World Meteorological Organization (WMO) UNAVCO United Nations Institute for Training and Research (UNITAR) US Department of Agriculture (USDA) US Environmental Protection Agency (EPA) US Geological Survey (USGS) US National Aeronautics and Space Administration (NASA) Contributing agencies and organizations 11
  • 14.
  • 16.
  • 17. THE HAITI EARTHQUAKE On 12 January 2010, a magnitude 7.0 earthquake struck the Haitian processed using up-to-date cartographic material to create situation capital of Port-au-Prince, killing almost 250,000 people, injuring maps for helping rescuers locate damaged areas and at-risk people. hundreds of thousands and leaving another million homeless. In the In parallel, scientists benefited from the rapid availability of immediate wake of the disaster, the United Nations and various national satellite images of the Haitian earthquake via the GEO Supersites web emergency response agencies obtained satellite data via the Inter- site. This allowed them to analyse the fault that caused the disaster, national Charter on Space and Major Disasters. These satellite images predict the potential for further seismic events, and provide advice to were provided by Canada, China, France, Japan, the United States of policy makers and relief teams. America and the European Space Agency. Within 24 hours they were Source: UNDP. Information for decision making: disasters 15
  • 18. Haiti: before the earthquake This multi-spectral image was captured by Landsat, a series of Earth observation satellites operated by the United States since 1973. Multi-spectral images consist of a limited number of specific wavelengths, including frequencies invisible to the human eye, that are particularly effective in revealing information about landforms. The clouds, distortions caused by the camera Port-au-Prince lens and other irregularities have been removed and corrected to process the present image. The epicentre (yellow star) and fault line (red line) have been added. Source: COMET Centre for the Observation and ault Modelling of Earthquakes, Volcanoes and Tectonics, UK. Enriquillo F 16 Crafting geoinformation
  • 19. Port-au-Prince: 12 January 2010 This map uses various symbols and colours to indicate informal Internally and Research (UNITAR), has produced several such post-earthquake Displaced Persons (IDP) sites as well as bridges and road obstacles using maps of Haiti to illustrate damage assessments, pre- and post-disaster GeoEye-1 satellite imagery from 12 January. The Operational Satellite comparisons, and much more. Applications Programme UNOSAT, hosted by the UN Institute for Training UPDATE 1: ANALYSIS SUMMARY WITHIN PORT-AU-PRINCE: Republic Haiti - 123 informal IDP shelters identified; Port-au- - 77 bridges and culverts were identified: Dominican Prince four appeared to be partially damaged ¬ ¦ ¥ or blocked with building debris; - 449 road obstacles were identified, almost all resulting from building debris; of this total 125 were severe, likely Airfield blocking all vehicle transport, and 231 were partial road obstructions, restricting Port vehicle access. Bridge Culvert Foot bridge Primary road Secondary road Unpaved/minor road Railroad Likely informal IDP site Likely closed by debris Likely restricted by debris Metres 0 250 500 750 1,000 1,250 1,500 Operational Analysis with GeoEYE-1 Data Acquired 13 January 2010 and QuickBird data aquired 4 March 2008 Map Data © 2009 Google The depiction and use of boundaries, geographic names and related data shown here are not warranted to be error-free nor do they imply official endorsement or acceptance by the United Nations. UNOSAT is a program of the United Nations Institute for Training and Research (UNITAR), providing satellite imagery and related geographic information, research and analysis to UN humanitarian & development agencies & their implementing partners. Source: UNITAR/UNOSAT. Information for decision making: disasters 17
  • 20. Port-au-Prince: 13 January 2010 This map product classifies the level of building damage in each 250-metre grid on the basis of an expert visual interpretation of a satellite image acquired on 13 January. Source: GeoEye. 18 Crafting geoinformation
  • 21. Port-au-Prince: recovery planning and reconstruction A comprehensive atlas of damage caused in Haiti has been produced to help recovery planning and recon- struction measures. The maps, based on the comparison between pre-disaster satellite imagery and post-disaster aerial photos, provide an overview of building damage in the main affected cities. They reveal that almost 60,000 buildings were destroyed or very heavily damaged, including a number of critical infrastructures such as government premises, educational buildings and hospitals. Source: This mapping activity was performed by SERTIT and DLR-ZKI in the context of the GMES Emergency Response Project SAFER with funding from the European Community's Seventh Framework Programme. Information for decision making: disasters 19
  • 22. Port-au-Prince: 48 hours on The first radar satellite high-resolution images available for Port-au-Prince were dated 14 January, only 48 hours after the event. Using these images along with reference images acquired during previous campaigns, it was possible to rapidly assess the effects of the earthquake on the affected area. The ILU (Interferometric Land Use modified) map of the Port-au-Prince area produced by the Italian Space Agency using COSMO-Skymed images reports areas where there is a big difference in the back- scattering between the pre- and the post-event images (red elements), highlighting the zones more affected by the quake. Source: ASI/COSMO-Skymed. 20 Crafting geoinformation
  • 23. Developing elevation maps Digital Elevation Models use optical and radar space observations to map the elevation and contours of the Earth’s surface, highlighting features such as mountains and rivers. They are used for a wide range of purposes, such as creating relief maps, modelling water flow to anticipate flooding impacts, predicting landslides and planning new infrastructure. In this image, the long horizontal line is the earthquake's fault line; Port-au-Prince and its harbour can be seen just above. Source: NASA Shuttle Radar Topography Mission (SRTM). Information for decision making: disasters 21
  • 24. Port-au-Prince: fault analysis This image shows the distribution of surface deformation caused by the earthquake derived from interferometric analysis of radar data acquired by the PALSAR instrument on the Japan Aerospace Exploration Agency’s (JAXA) Advanced Land Observing Satellite (ALOS). The area of many contours, near the city of Léogâne, shows an area of surface uplift caused by fault motion at depth. Areas of intense local deformation, mostly in soft soil and perhaps involving landslides, show as incoherent speckle patterns. This interferogram shows that the main earthquake rupture did not reach the surface on land. Source: Eric Fielding/JPL/NASA/JAXA. 22 Crafting geoinformation
  • 25. 73.5ºW 73.0ºW 72.5ºW 72.0ºW Fault analysis 20 cm To model the potential for future GONAVE PLATE earthquakes, researchers simulated 19.0ºN the coseismic ground motion based on the finite fault model of Caltech. Black arrows show expected displacements at Global Positioning System (GPS) Port-au-Prince sites, while the background colour shows interferometric fringes. Through an iterative process, a model is built and then gradually 18.5ºN improved until it corresponds more fully with observations (including both Enriquillo fault aps and interferometric analysis of USGS CMT radar images). The model is a vital aid for understanding and predicting the probability of future shocks. Harvard CMT GPS site 18.0ºN Aftershocks (USGS/NEIC) CARIBBEAN PLATE m 0.0 0.5 1.0 1.5 2.0 2.5 3.0 3.5 4.0 4.5 5.0 Slip distribution from A. Sladen (Caltech) cm -11.8 0.0 11.8 Source: E. Calais, Purdue University. Range change Information for decision making: disasters 23
  • 26. Fault analysis 73.5ºW 73.0ºW 72.5ºW 72.0ºW 20 cm In this image scientists have sought GONAVE PLATE Dominican Republic to model the redistribution of 19.0ºN HAITI stress along the fault line resulting from the earthquake. The model reveals that the greatest area of concern for a Port-au-Prince large triggered shock is immed- iately to the east of the 12 January 2010 rupture of the Enriquillo fault, where stress is calculated to have 18.5ºN risen. Typically, stress increases of this magnitude are associated Enriquillo fault with aftershocks (white dots). The next most likely site for a sub- sequent fault rupture lies to the west of the 12 January rupture where, interestingly, aftershocks are observed. 18.0ºN Aftershocks (USGS/NEIC) CARIBBEAN PLATE MPa -0.08 -0.06 -0.04 -0.02 0.00 0.02 0.04 0.06 0.08 Source: E. Calais, Purdue University. Coulomb stress 24 Crafting geoinformation
  • 27. MENINGITIS IN AFRICA Many different factors have been known to contribute to disease out- The main image above is of a massive dust storm sweeping across breaks, and over the past several years the health sector has increasingly the southern Sahara Desert on 19 March 2010. This image is made up of recognized that the environment may be one of the factors for climate- seven separate satellite overpasses acquired by the Moderate Resolution sensitive illnesses. The Meningitis Environmental Risk Information Imaging Spectroradiometer (MODIS) on NASA’s Terra and Aqua satellites Technologies (MERIT) project illustrates how the health and climate throughout the morning and early afternoon. Grey triangles indicate areas communities are cooperating to support decision making. MERIT is where the satellites did not collect data. The image spans more than 10,000 demonstrating how combining data, information and models on kilometres (6,000 miles). The smaller picture shows a meningitis victim. demographics, health resources, past outbreaks, vaccination campaigns, environmental changes and other variables can support public-health interventions. The decision by the World Health Organization and the other MERIT partners to model meningitis disease outbreaks is a step towards developing an early warning system. It is hoped that they will help to guide the implementation of a new vaccine campaign under way in 2010. Source (main image): MODIS Rapid Response Team at NASA GSFC; (inset) WHO. Information for decision making: health 25
  • 28. Aerosols in the atmosphere Suspended particles in the atmosphere known as aerosols can affect operating for limited periods between 1979 and 2004; the data were weather and climate as well as people. This diagram of the global validated using ground-based observations. The blue box over Africa distribution of atmospheric aerosols shows that dust from Northern highlights the approximate location of the meningitis belt, home to 350 Africa and Asia is a major component of the atmosphere over much of million people. The very dry air and high levels of suspended dust the world. particles observed during the meningitis season are thought to be The map was generated by combining data from six satellites among the factors leading to disease outbreaks. Aerosol optical depth (a measurement of particle density in the air) 0.0 0.2 0.4 0.6 Meningitis belt Source: Kinne, S., "Remote sensing data combinations-superior global maps for aerosol optical depth" in Satellite Aerosol Remote Sensing Over Land, A. Kokhanovsky and G. de Leeuw eds., Springer, 2009. 26 Crafting geoinformation
  • 29. Humidity Specific humidity Meningitis outbreaks Jan-Feb 2008 2008 (kg/kg) 0.008 Mali Niger Chad Burkina Faso Guinea Benin Côte Nigeria Ethiopia Togo d’Ivoire Ghana Central African Rep. Cameroon Country Dem. Rep. Attack rate of Congo 0.001 No data ....... ....... ....... ....... Acceptable ....... ©Multi Disease Surveillance Centre (MD SC)/ Reached the alarm threshold World Health Organization/African Region Source: NASA GLDAS. Reached the epidemic threshold Source: Ministries of Health These two sets of paired map images represent (left) specific humidity rates during the first 39 weeks of 2008 (above) and 2009 (below). Note the data for January-February gathered by the NASA Global Land Data strong correlation between the dark blue areas in the humidity maps and Assimilation System (GLDAS) and (right) cumulative meningitis attack the red and yellow areas in the meningitis outbreak maps. Specific humidity Meningitis outbreaks Jan-Feb 2009 2009 (kg/kg) 0.008 Mali Niger Chad Burkina Faso Guinea Benin Côte Nigeria Ethiopia Togo d’Ivoire Ghana Central African Rep. Cameroon Country Dem. Rep. Attack rate of Congo 0.001 No data ....... ....... ....... ....... Acceptable ....... ©Multi Disease Surveillance Centre (MD SC)/ Reached the alarm threshold World Health Organization/African Region Source: NASA GLDAS. Reached the epidemic threshold Source: Ministries of Health Information for decision making: health 27
  • 30. Wind direction The Inter-Tropical Discontinuity, or ITD, is the demarcation line between ITD DEKAD 1 March 2010 MEAN: 07-10 FORECAST the dry and dusty north/northeasterly winds from the Sahara and the 25 moist and humid south/southwesterly winds from the ocean. It moves gradually northwards from its extreme southern position in January to 20 its extreme northern position in August, and southwards again from late August to early January. The ITD’s position during the year influences disease risk. When areas to its north experience the dry and dusty 15 DEKAD 1 March 2010 Harmattan winds, meningitis and acute respiratory diseases tend to Forecast: 18-24/03/2010 10 increase. Mean position DEK 1 March: 07-09 5 Source: ACMAD. -20 -15 -10 -5 0 5 10 15 20 25 30 Population density In order to incorporate demographic risk factors as predictors when modelling epidemic outbreaks, demographic information about relevant population aspects (such as counts, density, distribution, and age and sex structure) is combined with climate data. The result is frequently presented in raster format (a grid of pixels or points). The Center for International Earth Science Information Network (CIESIN) uses their Gridded Population of the World (GPW) version 3 and Global Rural Urban Mapping Project (GRUMP) global population surfaces to integrate demo- graphic data with remote-sensing products. Predicted probability of meningitis epidemics Very high risk (p >= 0.80) High risk (0.60 <= p < 0.80) Moderate risk (0.40 <= p < 0.60) Low risk (p < 0.40) No data Population density (people per km2) N High: 140,000 500 km Source: CIESIN. Low: 0 28 Crafting geoinformation
  • 31. Precipitation, pressure and dust concentration BSC-DREAM8b 12h acc. Precipitation and MSL pressure Forecasts of sand and dust and basic meteorological variables for 12h forecast for 00z 22 MAR 10 periods of 10 days are currently being made available to health 35ºN - practitioners. While such Earth observation-based information products cannot yet be used operationally, they do help increase the health 50 30ºN - community’s understanding of, and sensitivity to, the role of the 30 environment in disease outbreaks. 25ºN - 20 20ºN - 10 5 15ºN - 2 10ºN - 1 0.5 5ºN - Source: BSC. 0º - I I I I I I I I I I I I I I 20ºW 10ºW 0º 10ºE 20ºE 30ºE 40ºE ˘ BSC-DREAM8b Lowest model level dust conc. (ug / m 3) 12h forecast for 00z 22 MAR 10 35ºN - Meningitis Environmental Risk Information Technologies is a 2,650 partnership of international organizations led by the World Health 30ºN - 1,280 Organization in collaboration with governments, academia and the 25ºN - 640 private sector. MERIT website: http://merit.hc-foundation.org/ 320 Contributors to this section include the World Health 20ºN - 160 Organization; International Research Institute for Climate and 80 Society, Columbia University; Center for International Earth Science 15ºN - 40 Information Network, Columbia University; Health and Climate 10ºN - 20 Foundation; African Centre of Meteorological Applications for Development; World Meteorological Organization; Barcelona 10 5ºN - Supercomputing Center (BSC); and US National Aeronautics and Source: BSC. Space Administration (NASA) Goddard Institute for Space Studies. 0º - I I I I I I I I I I I I I I 20ºW 10ºW 0º 10ºE 20ºE 30ºE 40ºE Information for decision making: health 29
  • 32. THE DEEPWATER HORIZON OIL SPILL On 20 April 2010, an explosion occurred on the semi-submersible offshore satellites, aeroplanes, ships, underwater gliders and scientists on the drilling rig Deepwater Horizon in the Gulf of Mexico. In the weeks that ground and on the water to track every aspect of the spill. These data were followed, approximately 35,000-60,000 barrels (5,600-9,500 cubic metres) used to derive information and forecasting products that proved invaluable of crude oil a day leaked into the Gulf. for emergency response teams, coastal communities, wildlife managers From day one, US agencies such as the National Oceanic and and many others affected by the spill. Atmospheric Administration, the US Geological Survey and the National Aeronautics and Space Administration used Earth observations from Source: US Coast Guard. 30 Crafting geoinformation
  • 33. Mississippi Delta: 24 May 2010 The Moderate-Resolution Imaging Spectro- radiometer (MODIS) on NASA’s Terra satellite captured this image of sunlight illuminating the lingering oil slick off the Mississippi Delta on 24 May. Oil smoothes the ocean surface, making the oil slick appear brighter than the surrounding water in some places (image centre) and darker in others (lower right). A small, dark plume along the edge of the slick, not far from the original location of the Deepwater Horizon rig, indicates a possible controlled burn of oil on the ocean surface. Source: NASA. Information for decision making: energy 31
  • 34. Tracking surface oil Gulfport Mobile Pensacola New Orleans ★ Deepwater Horizon Tampa NOAA’s Satellite Analysis Branch obtained data from a variety of high-resolution visible and synthetic aperture radar satellites from NOAA’s Earth observ- ation partners to document the latest extent of the surface oil (in red). Satellite data used in this daily analysis include NASA's Aqua and Terra MODIS, the Canadian Space Agency's RADARSAT-1 and -2 SAR, the Miami Italian Space Agency’s COSMO-SkyMed, the German Aerospace Center’s TerraSAR-X, the Japan Aerospace Exploration Agency’s Advanced Land Observing Satellite, Satellite Imaging Corporation's SPOT-5, the Disaster Monitoring Constellation’s multispectral imagery and the European Space Agency's ENVISAT SAR. Source: NOAA. 32 Crafting geoinformation
  • 35. Surface ocean currents Surface current forecast for 8pm EDT Friday 14 May 2010 Space-based and in situ observations of 35ºN weather, ocean currents and the state of Surface horizontal current (m/s) the sea are vital for crafting the forecasts 120-hour forecast valid 00Z 15 May 2010 and information products needed for decision making. Strong current headed Spill location towards Texas 30ºN 25ºN Loop 20ºN current Max. 2.11 at 29.3ºN 75.1ºW Min: 0.00 at 17.1ºN 76.5ºW NCEP/EMC/MMAB 10 May 2010 15ºN 100ºW 95ºW 90ºW 85ºW 80ºW 75ºW 0 0.5 1.0 1.5 2.0 2.5 3.0 Surface horizontal current (m/s) Source: NOAA. Information for decision making: energy 33
  • 36. Trajectory mapping Trajectory Forecast NOAA/NOS/OR&R Estimate for: 0600 CDT, Thursday, 5/13/10 Mississippi Canyon 252 Date Prepared: 1300 CDT, Wednesday, 5/12/10 This forecast of the spill’s future trajectory is 92°0'0"W 91°0'0"W 90°0'0"W 89°0'0"W 88°0'0"W based on the US National Weather Service spot forecast from the morning of 12 May. Currents 31°0'0"N 31°0'0"N were obtained from several models (NOAA Gulf of Mobile Mexico, West Florida Shelf/USF, Texas A&M/ Pascagoula Pensacola TGLO, NAVO/NRL) and High Frequency Resistance Gulfport Bay St Louis (HFR) measurements. The model was initialized from a combination of satellite imagery analysis 30°0'0"N 30°0'0"N Chandeleur Sound (NOAA/NESDIS) and overflight observations. Morgan City Breton Atchafalaya Sound Bay Venice Barataria Bay 29°0'0"N Isle Denieres 29°0'0"N Timbalier Bay Forecast location for oil on 13 May 10 at 0600 CDT 28°0'0"N 28°0'0"N Mississippi Canyon 252 Incident Location 0 20 40 miles 80 0 25 50 75 100 km 27°0'0"N 27°0'0"N Trajectory Winds are forecast to be persistently from the SE throughout the week. These Uncertainty moderately-strong onshore winds (up to 15 kts) have the potential to move new Light oil onshore. The Mississippi Delta, Breton Sound, the Chandeleur Islands and areas Medium directly north have a potential for shoreline contacts throughout the forecast period. Heavy Oil observed to the west of the Delta offshore of Timbalier Bay could threaten shorelines as far west as Atchafalaya Bay by Thursday. Potential beached oil 92°0'0"W 91°0'0"W 90°0'0"W 89°0'0"W 88°0'0"W Next Forecast: This scale bar shows the meaning of the distribution at the current time. May 13 AM Source: NOAA. 34 Crafting geoinformation
  • 37. Developing scenarios As the oil moved towards the coast, there was a clear potential for deposition on sandy beaches and in Tropical storm marshes. Weather scenarios were High tide + surge + waves used as an input for making inun- High tide + surge dation and overwash predictions. High tide These scenarios were based on Elevations not affected recent and forecasted weather patterns, as well as larger events that could be expected based on historical records. For each sce- nario, representative values for tide, wave height, wave period and surge were obtained from NOAA models. The total water level, including wave runup, was compared to Lidar Grand Isle elevation data collected by USGS N and the Joint Airborne Lidar Bathymetry Technical Center of Expertise (JALBTCX) to identify Kilometres barrier-island locations where oil 0 1 2 was most likely to be transported Miles and deposited. 0 1 2 Source: USGS. Information for decision making: energy 35
  • 38. Providing information to local communities The dynamic nature of the Deep- water Horizon oil spill was a challenge for local communities, from hotel operators and fishermen to local community leaders. GeoPlatform.gov established a customizable and interactive map providing near real-time infor- mation about the response effort (http://www.geoplatform.gov/gulf response). Developed by NOAA with the US Environmental Protection Agency, the US Coast Guard and the US Department of Interior, the site integrates the latest data the US federal responders have about the oil spill’s trajectory. It also features information on fishery area clos- ures and sightings of sea turtles (dead or alive) and other wildlife. Source: NOAA. 36 Crafting geoinformation
  • 39. FORESTS AND CARBON Forests play a vital role in regulating climate, storing carbon and providing many other ecosystem services. Policy makers and managers therefore need timely information on changes in the extent and density of the world’s forests. This information can be provided by combining optical and radar data from satellites with on-the-ground observations. Information for decision making: climate 37
  • 40. Coordinating data Monitoring trends in forest cover requires obtaining data periodically over many years. These optical images of deforestation in Rondonia, Brazil were taken from the US’s Landsat satellite over a period of 26 years. Source: USGS-Landsat. June 1975 July 1989 September 2001 38 Crafting geoinformation
  • 41. Trained observers take in situ measurements to provide “ground truth” in order to validate and calibrate satellite measurements. They typically record tree diameter and height; species composition (trees, crops and other plants); soil and water quality; and indicators of land degradation. Sample observations taken from each unit of a regular grid make it possible to extrapolate the results to the entire forest or region. Information for decision making: climate 39
  • 42. Using satellite radar sensors ... A time series of processed images showing the removal of a Malaysian mangrove forest over several years. These images were taken from an L-band radar sensor on Japan’s Advanced Land Observing Satellite (ALOS). Radar has the advantage of being able to penetrate clouds as well as the nighttime dark. Source: JAXA/METI. 2006 2008 2010 40 Crafting geoinformation
  • 43. ... to monitor mangrove clearance The three previous images have been combined into this composite image. The different colours represent the years in which the forest was cut. Source: JAXA/METI. Information for decision making: climate 41
  • 44. Scenes acquired June-September 2009 173 Landsat 507 ALOS PALSAR 161 Radarsat 2 Combining multiple images over Borneo By coordinating data acquisition from various satellite missions, it is and building time series from regular observations are essential for possible to ensure that forests are monitored consistently by a variety of tracking changes. radar and optical sensors. Filling gaps in coverage, establishing baselines 42 Crafting geoinformation
  • 45. 7ºN Land cover and land use Tropical lowland forest High shrub Tropical mountain forest Medium shrub Riverine forest Ferns/grass Time series of processed images are Swamp forest Grassland 6ºN Mangrove forest Cropland (upland) combined to produce information in the Nipah mangrove forest Cropland (irrigated) form of a map of land cover and land use. Peat swamp (pole) forest Plantations Peat swamp (padang) forest Tree cover, burnt The accuracy of the classifications listed Riverine shrubland Water body 5ºN No data in the legend is improved by using com- Forest mosaics/fragmented or degraded forest plementary data from different sensors. The map is validated using in situ and 4ºN airborne observations as well as very high resolution satellite data. 3ºN 2ºN 1ºN 0º 1ºS 2ºS 3ºS Source: Alos K&C Initiative/Wageningen 109ºE 110ºE 111ºE 112ºE 113ºE 114ºE 115ºE 116ºE 117ºE 118ºE 119ºE University/SarVision/JAXA. Information for decision making: climate 43
  • 46. Land cover and land use The Amazon Deforestation Monitoring Program (PRODES) of Brazil’s National Institute for Space Research (INPE) is an operational system for monitoring forest change. It provides yearly forest/non- forest maps based on regular satellite and in situ observations in order to identify the incremental deforestation occurring over time. Deforestation 1997 Deforestation 2003 Deforestation 2007 Residual Deforestation 2000 Deforestation 2004 Deforestation 2008 Not observed Deforestation 2001 Deforestation 2005 Non forest Hydrography Source: INPE. Deforestation 2002 Deforestation 2006 Forest Clouds 44 Crafting geoinformation
  • 47. WATER RESOURCES Water-flow forecasting systems in individual catchments provide essential information for managing the water resources needed for agriculture, industry and households. They also produce and share information for flood alert systems in order to provide longer lead-times for warning people about impending disasters. Source: UNEP. Information for decision making: water 45
  • 48. Land cover codes 1 23 2 24 3 25 4 26 5 27 6 28 7 29 8 30 9 31 10 32 11 33 12 34 13 35 14 36 15 37 16 38 17 39 18 40 19 41 20 42 21 43 22 44 Land cover classification The European Flood Alert System (EFAS) geographic information system (GIS) land cover layer contains 44 categories, including urban, agriculture, coniferous/deciduous forest, wetlands and bare soil. Information on the type of land cover is compiled from space and in situ observations. It is critical for determining runoff characteristics in the hydrological model. Source: European Landcover 2000. 46 Crafting geoinformation
  • 49. ETN-R monitoring stations European Terrestrial Network for River Discharge The monitoring stations that constitute the European Terrestrial Network for River Discharge (ETN-R) gather near real-time river discharge and water level data from 30 European national and trans- boundary river basins in 35 countries. This network in turn supplies EFAS with in situ river observations. Source: EFAS. Information for decision making: water 47
  • 50. Soil texture classifications Geographic information system (GIS) layers for topsoil (below left) and subsoil (right) are each divided into six categories. Soil information is important for determining percolation, runoff and erosion character- istics in the hydrological model. Source: EFAS. Topsoil Subsoil 0 0 1 1 2 2 3 3 4 4 5 5 48 Crafting geoinformation
  • 51. Elevation Height in metres < -20 -20-200 200-500 500-750 750-1,000 1,000-1,500 1,500-2,000 2,000-2,500 2,500-3,000 3,000-4,536 Topography A 1-kilometre resolution Digital Elevation Model (DEM) of Europe derived from the Shuttle Radar Topography Mission (SRTM) is used by the EFAS hydrological model (colours indicate elevation). A DEM is critical for establishing the slope of terrain in river catchments, which in turn has implications for runoff intensity and the potential for erosion. Source: EFAS. Information for decision making: water 49
  • 52. Slope and hypsometry Intermediate landform products derived from the DEM include slope classification (steepness intensity, below upper) and hypsometry (elevation categories, below lower). Flood alert systems need these products in order to determine the channelling of precipitation runoff and river flow. Slope classes 1 2 3 4 5 6 7 Hypsometry classes 2 3 4 5 6 7 8 Source: GISCO LAEA. Intermediate landform products Intermediate landform products derived from the slope and hyp- sometry classifications include the probability drainage density, the likelihood of water collecting into an area (upper), and ultimately the river channel network (lower), for which the hydrological model computes water flux in the river basins. 50 Crafting geoinformation
  • 53. Precipitation forecast Deterministic precipitation forecasts are used as inputs into the To increase the robustness of medium-range forecasts, Ensemble hydrological model. In the case of Europe, forecasts for up to 10 days Prediction Systems (EPS) are used to provide an average forecast are supplied by the European Centre for Medium-Range Weather computed from several dozen numerical weather model runs. This Forecasting (ECWMF), and for up to seven days by the German Weather average forecast is then compared with the deterministic forecasts as Service (Deutsche Wetter Dienst – DWD). a precipitation input to the hydrological model. 60ºW 40ºW 20ºW 0º 20ºE 40ºE 60ºE Probability of precipitation (%) 100 60ºN 95 50ºN 40ºN 65 30ºN 35 60ºW 40ºW 20ºW 0º 20ºE 40ºE 60ºE Wednesday 21 July 2010 00UTC. Forecast probability t+038-080 VT: Thursday 22 July 2010 12 UTC. Surface: Total precipitation of at least 10 mm. Source: ECMWF. Information for decision making: water 51
  • 54. Annual run-off The global distribution of mean annual runoff (mm/year) indicates the maximum available renewable freshwater resource. The amount of water that is actually usable depends also on consumption and water pollution, in addition to the infrastructure for supporting stable water supply. Source: Oki and Kanae, Science, 2006. Annual runoff (mm/y) 210º 240º 270º 300º 330º 0º 30º 60º 90º 120º 150º 180º 60º 30º 0º -30º -60º 0 5 10 50 100 200 500 1,000 2,000 5,000 52 Crafting geoinformation
  • 55. Water scarcity The water scarcity index reflects the balance between the annual water withdrawal and the maximum available renewable freshwater resource. Water stress is high for regions with a high index. Source: Oki and Kanae, Science, 2006. Water scarcity index 210º 240º 270º 300º 330º 0º 30º 60º 90º 120º 150º 180º 60º 30º 0º -30º -60º 0.00 0.01 0.10 0.20 0.40 0.60 1.00 Information for decision making: water 53