Toronto Real Estate Board's Market Watch for June 2013.

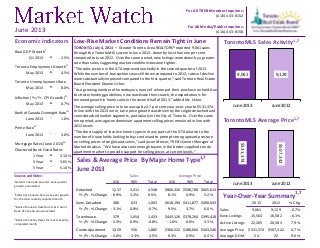
TORONTO, July 4, 2013 – Greater Toronto Area REALTORS® reported 9,061 sales through the TorontoMLS system in June 2013 – down by less than one per cent compared to June 2012. Over the same period, new listings were down by a greater rate than sales, suggesting market conditions became tighter. "The sales picture in the GTA improved markedly in the second quarter of 2013. While the number of transactions was still down compared to 2012, rates of decline were substantially improved compared to the first quarter," said Toronto Real Estate Board President Dianne Usher. "As a growing number of homebuyers, many of whom put their purchase on hold due to stricter lending guidelines, now reactivate their search, the expectation is for renewed growth in home sales in the second half of 2013," added Ms. Usher. The average selling price in June was up by 4.7 per cent year-over-year to $531,374. In line with the 2013 norm, June price growth was driven by the single-detached and semi-detached market segments, particularly in the City of Toronto. Over the same time period, average condominium apartment selling prices remained in line with 2012 levels. "The short supply of low-rise home types in many parts of the GTA relative to the number of households looking to buy continued to prompt strong upward pressure on selling prices of singles and semis," said Jason Mercer, TREB's Senior Manager of Market Analysis. "We have also seen enough buyers in the better-supplied condo apartment market to provide support for selling prices at current levels."

Recomendados
Mais conteúdo relacionado
Destaque
Mais de Richard Silver, Certified International REALTOR®
Mais de Richard Silver, Certified International REALTOR® (20)
Último
Último (20)
Toronto Real Estate Board's Market Watch for June 2013.
- 1. 9,061 9,129 June2013 June2012 $531,374 $507,342 June2013 June2012 For All TREB Member Inquiries: (416) 443-8152 For All Media/Public Inquiries: (416) 443-8158June 2013 Real GDP Growthi Q1 2013 t 2.5% Toronto Employment Growthii May 2013 t 4.5% Toronto Unemployment Rate May 2013 u 8.0% Inflation (Yr./Yr. CPI Growth)ii May 2013 t 0.7% Bank of Canada Overnight Rateiii June 2013 q 1.0% Prime Rate iv June 2013 q 3.0% Mortgage Rates (June 2013) iv Chartered Bank Fixed Rates 1 Year t 3.14% 3 Year t 3.65% 5 Year q 5.14% Sources and Notes: Economic Indicators i Statistics Canada, Quarter-over-quarter growth, annualized ii Statistics Canada, Year-over-year growth for the most recently reported month iii Bank of Canada, Rate from most recent Bank of Canada announcement iv Bank of Canada, Rates for most recently completed month Sales & Average Price By Major Home Type1,7 416 905 Total 416 905 Total Detached 1,137 3,411 4,548 $866,326 $598,708 $665,613 Yr./Yr. % Change -6.9% 3.2% 0.5% 8.1% 4.9% 5.2% Semi-Detached 380 623 1,003 $618,194 $411,877 $490,043 Yr./Yr. % Change -3.1% 0.8% -0.7% 9.5% 3.7% 6.0% Townhouse 379 1,054 1,433 $443,126 $378,264 $395,418 Yr./Yr. % Change -5.3% 0.9% -0.8% -1.6% 6.0% 3.3% Condo Apartment 1,329 556 1,885 $366,532 $288,604 $343,546 Yr./Yr. % Change -4.0% -2.3% -3.5% 0.3% 0.9% 0.4% June 2013 Sales Average Price Low-Rise Market Conditions Remain Tight in June TORONTO, July 4, 2013 – Greater Toronto Area REALTORS® reported 9,061 sales through the TorontoMLS system in June 2013 - down by less than one per cent compared to June 2012. Over the same period, new listings were down by a greater rate than sales, suggesting market conditions became tighter. "The sales picture in the GTA improved markedly in the second quarter of 2013. While the number of transactions was still down compared to 2012, rates of decline were substantially improved compared to the first quarter," said Toronto Real Estate Board President Dianne Usher. "As a growing number of homebuyers, many of whom put their purchase on hold due to stricter lending guidelines, now reactivate their search, the expectation is for renewed growth in home sales in the second half of 2013," added Ms. Usher. The average selling price in June was up by 4.7 per cent year-over-year to $531,374. In line with the 2013 norm, June price growth was driven by the single-detached and semi-detached market segments, particularly in the City of Toronto. Over the same time period, average condominium apartment selling prices remained in line with 2012 levels. "The short supply of low-rise home types in many parts of the GTA relative to the number of households looking to buy continued to prompt strong upward pressure on selling prices of singles and semis," said Jason Mercer, TREB's Senior Manager of Market Analysis. "We have also seen enough buyers in the better-supplied condo apartment market to provide support for selling prices at current levels.” 2013 2012 % Chg. Sales 9,061 9,129 -0.7% New Listings 15,564 16,582 -6.1% Active Listings 22,205 20,583 7.9% Average Price $531,374 $507,342 4.7% Average DOM 24 22 9.6% Year-Over-Year Summary 1,7 TorontoMLS Sales Activity1,7 TorontoMLS Average Price1,7
- 2. Price Range Detached Semi-Detached Att/Row/Twnhouse Condo Townhouse Condo Apt Link Co-op Apt Det Condo Co-ownership Apt Total $0 to $99,999 3 0 0 4 13 0 2 0 0 22 $100,000 to $199,999 44 5 1 45 218 0 4 0 3 320 $200,000 to $299,999 255 65 83 220 638 27 1 2 7 1,298 $300,000 to $399,999 636 246 218 283 568 33 2 3 2 1,991 $400,000 to $499,999 812 347 213 118 241 36 1 2 1 1,771 $500,000 to $599,999 798 170 100 28 112 40 1 3 0 1,252 $600,000 to $699,999 615 63 51 26 47 19 0 0 0 821 $700,000 to $799,999 414 40 11 5 14 2 0 1 0 487 $800,000 to $899,999 304 37 6 6 8 0 0 0 0 361 $900,000 to $999,999 159 7 5 0 8 0 0 0 0 179 $1,000,000 to $1,249,999 200 11 4 2 6 0 0 0 0 223 $1,250,000 to $1,499,999 118 3 1 0 5 0 0 0 0 127 $1,500,000 to $1,749,999 67 5 0 1 1 0 0 0 0 74 $1,750,000 to $1,999,999 44 2 0 0 1 0 0 0 0 47 $2,000,000 + 79 2 1 1 5 0 0 0 0 88 Total Sales 4,548 1,003 694 739 1,885 157 11 11 13 9,061 Share of Total Sales 50.2% 11.1% 7.7% 8.2% 20.8% 1.7% 0.1% 0.1% 0.1% - Average Price $665,613 $490,043 $443,162 $350,582 $343,546 $451,730 $243,682 $440,682 $260,592 $531,374 Price Range Detached Semi-Detached Att/Row/Twnhouse Condo Townhouse Condo Apt Link Co-op Apt Det Condo Co-ownership Apt Total $0 to $99,999 14 0 3 15 86 0 8 0 2 128 $100,000 to $199,999 226 48 10 259 1,264 1 23 0 6 1,837 $200,000 to $299,999 1,351 327 468 1,033 3,309 140 11 8 21 6,668 $300,000 to $399,999 3,115 1,334 1,269 1,319 3,050 173 12 13 7 10,292 $400,000 to $499,999 4,251 1,779 1,113 504 1,254 175 7 10 2 9,095 $500,000 to $599,999 4,102 806 491 141 538 198 5 7 0 6,288 $600,000 to $699,999 2,914 339 242 81 239 67 2 2 0 3,886 $700,000 to $799,999 2,033 177 72 40 117 9 2 1 0 2,451 $800,000 to $899,999 1,416 122 36 28 58 0 0 0 0 1,660 $900,000 to $999,999 810 53 18 11 50 0 1 0 0 943 $1,000,000 to $1,249,999 979 59 15 9 44 0 0 0 0 1,106 $1,250,000 to $1,499,999 629 20 6 0 25 0 1 0 0 681 $1,500,000 to $1,749,999 356 16 1 2 10 0 0 0 0 385 $1,750,000 to $1,999,999 185 7 2 0 5 0 0 0 0 199 $2,000,000 + 403 12 1 2 21 0 0 0 0 439 Total Sales 22,784 5,099 3,747 3,444 10,070 763 72 41 38 46,058 Share of Total Sales 49.5% 11.1% 8.1% 7.5% 21.9% 1.7% 0.2% 0.1% 0.1% - Average Price $657,530 $482,553 $433,361 $345,942 $341,633 $438,349 $302,224 $414,527 $253,329 $522,820 SALES BY PRICE RANGE AND HOUSE TYPE1,7 JUNE 2013 SALES BY PRICE RANGE AND HOUSE TYPE1,7 YEAR-TO-DATE, 2013 Market Watch, June 2013 2 Toronto Real Estate Board
- 3. ALL HOME TYPES, JUNE 2013 ALL TREB AREAS Number of Sales Dollar Volume 1 Average Price 1 Median Price 1 New Listings 2 SNLR (Trend) 8 Active Listings 3 Mos. Inv. (Trend)9 Avg. SP/LP 4 Avg. DOM 5 TREB Total 9,061 $4,814,776,551 $531,374 $445,000 15,564 51.6% 22,205 2.8 98% 24 Halton Region 713 $429,449,830 $602,314 $485,000 1,047 56.4% 1,589 2.7 97% 28 Burlington 124 $64,770,850 $522,346 $441,500 183 59.9% 298 2.8 98% 26 Halton Hills 90 $39,948,166 $443,869 $419,000 144 57.5% 256 2.8 98% 26 Milton 219 $104,555,134 $477,421 $444,500 312 56.9% 366 2.0 98% 22 Oakville 280 $220,175,680 $786,342 $660,500 408 54.2% 669 3.1 97% 33 Peel Region 1,999 $935,361,291 $467,915 $424,500 3,624 49.5% 4,976 2.8 97% 24 Brampton 837 $361,210,595 $431,554 $399,900 1,559 48.0% 2,081 2.7 98% 25 Caledon 91 $52,641,949 $578,483 $529,000 174 48.6% 321 4.2 97% 35 Mississauga 1,071 $521,508,747 $486,936 $439,000 1,891 50.8% 2,574 2.7 98% 23 City of Toronto 3,265 $1,889,047,138 $578,575 $455,000 5,913 49.4% 8,572 3.0 99% 23 York Region 1,699 $1,059,501,097 $623,603 $567,000 3,037 49.5% 4,361 3.0 98% 23 Aurora 94 $55,817,453 $593,803 $537,150 139 55.0% 235 2.8 98% 22 E. Gwillimbury 38 $20,569,100 $541,292 $481,750 67 53.6% 119 3.7 98% 32 Georgina 85 $28,403,783 $334,162 $310,000 113 65.7% 197 2.9 98% 26 King 38 $35,504,699 $934,334 $792,500 65 35.4% 193 7.9 95% 46 Markham 487 $319,812,846 $656,700 $602,000 886 49.6% 1,091 2.7 98% 21 Newmarket 134 $67,694,516 $505,183 $469,500 187 66.8% 211 1.7 99% 20 Richmond Hill 333 $221,743,223 $665,896 $611,000 668 44.5% 959 3.2 97% 24 Vaughan 395 $257,556,317 $652,041 $593,000 756 46.8% 1,093 3.1 98% 21 Whitchurch-Stouffville 95 $52,399,160 $551,570 $500,000 156 46.8% 263 3.8 97% 30 Durham Region 1,093 $394,920,030 $361,318 $330,000 1,505 64.1% 1,782 2.0 98% 22 Ajax 191 $76,513,351 $400,593 $367,000 276 63.3% 263 1.6 99% 19 Brock 23 $5,813,300 $252,752 $232,000 37 45.5% 123 7.4 95% 63 Clarington 185 $59,174,014 $319,860 $300,000 255 67.4% 263 1.9 99% 22 Oshawa 287 $82,723,720 $288,236 $263,000 339 68.5% 326 1.6 98% 21 Pickering 133 $59,938,305 $450,664 $407,000 203 62.0% 237 1.9 98% 22 Scugog 36 $14,630,600 $406,406 $367,000 50 55.9% 117 4.1 97% 41 Uxbridge 42 $20,371,200 $485,029 $445,450 66 54.1% 149 4.3 97% 38 Whitby 196 $75,755,540 $386,508 $359,500 279 64.4% 304 1.6 99% 17 Dufferin County 62 $21,831,915 $352,128 $325,950 97 64.6% 180 2.6 98% 34 Orangeville 62 $21,831,915 $352,128 $325,950 97 64.6% 180 2.6 98% 34 Simcoe County 230 $84,665,250 $368,110 $335,250 341 56.2% 745 3.9 98% 41 Adjala-Tosorontio 14 $6,225,100 $444,650 $422,450 35 50.0% 85 6.3 98% 64 Bradford West Gwillimbury 59 $26,827,199 $454,698 $400,000 92 53.5% 157 3.0 98% 28 Essa 35 $10,251,300 $292,894 $273,000 43 60.2% 102 3.9 97% 40 Innisfil 63 $21,276,052 $337,715 $312,500 92 55.6% 217 4.4 97% 50 New Tecumseth 59 $20,085,599 $340,434 $320,000 79 60.2% 184 3.6 98% 41 SUMMARY OF EXISTING HOME TRANSACTIONS ! TURN PAGE FOR CITY OF TORONTO TABLES OR CLICK HERE: Market Watch, June 2013 3 Toronto Real Estate Board
- 4. Market Watch, June 2013 July 2010Page 3 4 Toronto Real Estate Board ALL HOME TYPES, JUNE 2013 CITY OF TORONTO MUNICIPAL BREAKDOWN Number of Sales Dollar Volume 1 Average Price 1 Median Price 1 New Listings 2 SNLR (Trend) 8 Active Listings 3 Mos. Inv. (Trend)9 Avg. SP/LP 4 Avg. DOM 5 TREB Total 9,061 $4,814,776,551 $531,374 $445,000 15,564 51.6% 22,205 2.8 98% 24 City of Toronto Total 3,265 $1,889,047,138 $578,575 $455,000 5,913 49.4% 8,572 3.0 99% 23 Toronto West 846 $448,861,089 $530,569 $451,500 1,518 52.0% 2,173 2.9 100% 24 Toronto W01 63 $45,835,834 $727,553 $735,000 90 54.5% 111 2.6 102% 18 Toronto W02 101 $64,230,895 $635,949 $631,000 136 65.2% 110 1.5 105% 12 Toronto W03 69 $31,675,250 $459,062 $430,000 97 60.6% 107 2.0 101% 18 Toronto W04 76 $29,654,445 $390,190 $391,750 129 55.7% 189 2.8 98% 22 Toronto W05 102 $36,906,836 $361,832 $381,000 216 53.9% 337 3.1 97% 27 Toronto W06 105 $50,769,154 $483,516 $440,000 266 37.4% 488 4.7 99% 37 Toronto W07 37 $30,109,800 $813,778 $675,000 56 65.1% 45 1.4 101% 20 Toronto W08 161 $110,105,746 $683,887 $523,000 272 51.2% 421 2.9 98% 26 Toronto W09 49 $22,100,989 $451,041 $446,000 80 56.5% 112 2.7 99% 26 Toronto W10 83 $27,472,140 $330,990 $380,000 176 51.2% 253 3.0 98% 28 Toronto Central 1,455 $986,494,519 $678,003 $465,000 2,853 44.4% 4,643 3.5 98% 25 Toronto C01 386 $175,318,998 $454,194 $400,000 858 39.8% 1,435 4.2 99% 25 Toronto C02 71 $79,283,061 $1,116,663 $799,000 134 40.9% 293 4.5 98% 26 Toronto C03 49 $57,218,944 $1,167,734 $819,000 69 54.6% 115 2.6 99% 14 Toronto C04 102 $120,181,207 $1,178,247 $1,116,000 165 49.4% 242 2.8 98% 22 Toronto C06 39 $22,126,800 $567,354 $474,000 73 44.4% 126 3.6 98% 30 Toronto C07 98 $59,638,276 $608,554 $468,150 233 42.4% 364 3.8 98% 29 Toronto C08 160 $73,848,511 $461,553 $389,000 289 46.9% 445 3.1 99% 29 Toronto C09 26 $35,213,390 $1,354,361 $1,350,000 40 52.9% 79 3.1 97% 25 Toronto C10 70 $47,415,087 $677,358 $538,500 93 54.5% 125 2.2 100% 24 Toronto C11 46 $32,400,318 $704,355 $419,000 66 58.0% 78 2.3 98% 25 Toronto C12 36 $70,380,228 $1,955,006 $1,310,000 85 35.5% 190 5.7 92% 29 Toronto C13 93 $59,102,333 $635,509 $482,000 140 56.6% 155 2.3 101% 24 Toronto C14 154 $90,872,039 $590,078 $415,000 367 40.4% 630 3.9 98% 28 Toronto C15 125 $63,495,327 $507,963 $386,000 241 47.0% 366 3.2 99% 22 Toronto East 964 $453,691,530 $470,634 $450,000 1,542 56.6% 1,756 2.2 100% 20 Toronto E01 106 $63,311,419 $597,278 $560,950 154 55.9% 147 1.7 102% 15 Toronto E02 80 $55,016,569 $687,707 $622,882 133 59.4% 123 1.5 101% 13 Toronto E03 103 $57,092,485 $554,296 $539,000 143 60.5% 114 1.6 102% 16 Toronto E04 100 $36,222,504 $362,225 $395,000 188 56.4% 223 2.3 100% 22 Toronto E05 119 $53,246,079 $447,446 $385,000 134 60.4% 157 1.9 99% 21 Toronto E06 36 $19,389,300 $538,592 $493,000 73 55.0% 77 1.8 99% 13 Toronto E07 92 $37,317,688 $405,627 $421,500 182 50.4% 225 2.9 100% 20 Toronto E08 62 $26,097,800 $420,932 $431,250 114 53.3% 143 2.8 99% 28 Toronto E09 107 $39,584,287 $369,947 $380,000 190 57.6% 232 2.5 99% 23 Toronto E10 70 $33,947,099 $484,959 $461,800 120 52.5% 157 2.6 100% 19 Toronto E11 89 $32,466,300 $364,790 $370,000 111 59.2% 158 2.4 99% 23 SUMMARY OF EXISTING HOME TRANSACTIONS
- 5. ALL HOME TYPES, YEAR-TO-DATE 2013 ALL TREB AREAS Number of Sales Dollar Volume 1 Average Price 1 Median Price 1 New Listings 2 Avg. SP/LP 4 Avg. DOM 5 TREB Total 46,058 $24,080,024,557 $522,820 $440,000 89,062 98% 25 Halton Region 3,576 $2,102,829,927 $588,040 $490,000 6,242 98% 28 Burlington 581 $299,487,705 $515,469 $448,000 985 98% 30 Halton Hills 500 $231,963,240 $463,926 $432,500 899 98% 30 Milton 1,118 $522,412,442 $467,274 $437,750 1,855 99% 22 Oakville 1,377 $1,048,966,540 $761,777 $632,526 2,503 97% 31 Peel Region 9,882 $4,561,082,144 $461,555 $418,000 20,011 98% 25 Brampton 4,186 $1,767,361,976 $422,208 $397,250 8,689 98% 26 Caledon 466 $273,542,819 $587,002 $525,000 1,003 97% 33 Mississauga 5,230 $2,520,177,349 $481,869 $430,000 10,319 98% 24 City of Toronto 17,059 $9,719,412,416 $569,753 $449,900 34,070 99% 25 York Region 8,499 $5,201,904,550 $612,061 $556,000 17,115 98% 25 Aurora 467 $267,307,759 $572,393 $523,000 870 98% 22 E. Gwillimbury 179 $92,202,909 $515,100 $455,000 328 97% 32 Georgina 436 $140,408,384 $322,038 $315,000 671 98% 31 King 139 $121,607,164 $874,872 $756,000 408 95% 44 Markham 2,342 $1,463,338,150 $624,824 $573,000 4,597 98% 23 Newmarket 763 $374,862,701 $491,301 $465,000 1,156 99% 21 Richmond Hill 1,687 $1,156,979,402 $685,821 $622,000 3,767 98% 25 Vaughan 2,074 $1,345,842,607 $648,912 $597,800 4,452 98% 25 Whitchurch-Stouffville 412 $239,355,474 $580,960 $503,750 866 97% 33 Durham Region 5,553 $1,964,767,644 $353,821 $329,900 8,953 98% 22 Ajax 959 $372,132,176 $388,042 $365,000 1,570 99% 19 Brock 97 $25,879,605 $266,800 $225,000 232 95% 66 Clarington 894 $276,413,127 $309,187 $289,990 1,394 98% 21 Oshawa 1,416 $400,446,965 $282,802 $268,000 2,095 98% 21 Pickering 677 $284,234,126 $419,844 $387,550 1,170 99% 22 Scugog 161 $63,618,500 $395,146 $365,000 309 98% 43 Uxbridge 179 $87,384,513 $488,182 $440,000 354 97% 38 Whitby 1,170 $454,658,632 $388,597 $365,000 1,829 99% 17 Dufferin County 347 $120,710,088 $347,868 $330,000 600 98% 36 Orangeville 347 $120,710,088 $347,868 $330,000 600 98% 36 Simcoe County 1,142 $409,317,788 $358,422 $332,500 2,071 98% 41 Adjala-Tosorontio 80 $34,530,388 $431,630 $409,000 174 98% 57 Bradford West Gwillimbury 330 $137,511,610 $416,702 $389,450 595 98% 30 Essa 167 $49,230,590 $294,794 $263,000 274 98% 43 Innisfil 260 $88,400,206 $340,001 $315,000 529 97% 47 New Tecumseth 305 $99,644,994 $326,705 $306,900 499 98% 43 ! TURN PAGE FOR CITY OF TORONTO TABLES OR CLICK HERE: SUMMARY OF EXISTING HOME TRANSACTIONS Market Watch, June 2013 July 2010Page 3 5 Toronto Real Estate Board
- 6. Market Watch, June 2013 July 2010Page 3 6 Toronto Real Estate Board ALL HOME TYPES, YEAR-TO-DATE 2013 CITY OF TORONTO MUNICIPAL BREAKDOWN Number of Sales Dollar Volume 1 Average Price 1 Median Price 1 New Listings 2 Avg. SP/LP 4 Avg. DOM 5 TREB Total 46,058 $24,080,024,557 $522,820 $440,000 89,062 98% 25 City of Toronto Total 17,059 $9,719,412,416 $569,753 $449,900 34,070 99% 25 Toronto West 4,353 $2,161,232,929 $496,493 $432,500 8,422 100% 26 Toronto W01 258 $171,789,047 $665,849 $645,500 479 102% 22 Toronto W02 493 $302,564,207 $613,721 $579,000 726 103% 17 Toronto W03 372 $160,418,013 $431,231 $425,000 594 101% 21 Toronto W04 384 $150,874,370 $392,902 $390,000 712 99% 28 Toronto W05 524 $189,999,795 $362,595 $384,750 1,033 97% 31 Toronto W06 600 $276,417,304 $460,696 $425,000 1,676 99% 32 Toronto W07 182 $139,569,008 $766,863 $694,000 283 101% 18 Toronto W08 838 $522,788,173 $623,852 $512,250 1,620 99% 26 Toronto W09 261 $110,207,089 $422,249 $430,000 441 99% 28 Toronto W10 441 $136,605,923 $309,764 $315,000 858 98% 29 Toronto Central 7,713 $5,251,976,288 $680,925 $473,500 17,056 99% 27 Toronto C01 1,982 $922,257,245 $465,316 $395,500 4,947 99% 29 Toronto C02 364 $385,989,286 $1,060,410 $856,000 907 98% 26 Toronto C03 281 $294,114,995 $1,046,673 $751,000 515 99% 21 Toronto C04 563 $635,802,340 $1,129,311 $1,051,000 1,103 99% 22 Toronto C06 180 $108,431,401 $602,397 $627,700 426 98% 29 Toronto C07 548 $329,479,912 $601,241 $450,400 1,263 99% 31 Toronto C08 801 $370,769,450 $462,883 $399,000 1,651 99% 28 Toronto C09 156 $193,569,478 $1,240,830 $915,000 300 99% 27 Toronto C10 350 $229,990,764 $657,116 $556,500 642 101% 20 Toronto C11 280 $200,675,416 $716,698 $451,500 431 100% 27 Toronto C12 207 $378,657,390 $1,829,263 $1,585,000 560 96% 28 Toronto C13 431 $280,172,680 $650,053 $495,000 731 100% 24 Toronto C14 878 $539,008,585 $613,905 $431,000 2,099 97% 30 Toronto C15 692 $383,057,346 $553,551 $438,950 1,481 98% 26 Toronto East 4,993 $2,306,203,199 $461,887 $440,000 8,592 100% 21 Toronto E01 511 $304,439,346 $595,772 $570,000 910 103% 16 Toronto E02 430 $293,499,138 $682,556 $622,750 737 101% 12 Toronto E03 543 $306,251,877 $564,000 $535,000 886 102% 17 Toronto E04 565 $205,991,057 $364,586 $398,000 1,002 99% 24 Toronto E05 526 $221,794,195 $421,662 $360,900 803 99% 22 Toronto E06 223 $123,276,796 $552,811 $490,000 396 99% 16 Toronto E07 474 $194,212,262 $409,731 $414,950 849 100% 27 Toronto E08 313 $131,877,762 $421,335 $420,000 586 99% 25 Toronto E09 609 $208,047,796 $341,622 $335,000 1,057 99% 24 Toronto E10 335 $154,896,248 $462,377 $451,000 631 99% 22 Toronto E11 464 $161,916,722 $348,958 $329,250 735 98% 26 SUMMARY OF EXISTING HOME TRANSACTIONS
- 7. Market Watch, June 2013 Industrial Leasing July 2010Page 3 7 Toronto Real Estate Board ALL TREB AREAS Sales 1 Dollar Volume 1 Average Price 1 Median Price 1 New Listings 2 Active Listings 3 Avg. SP/LP 4 Avg. DOM 5 TREB Total 4,548 $3,027,207,541 $665,613 $562,373 7,727 10,932 98% 24- - - - - - - - Halton Region 431 $314,858,854 $730,531 $610,000 672 1,083 97% 29 Burlington 67 $44,725,200 $667,540 $579,000 97 184 97% 29 Halton Hills 69 $33,080,266 $479,424 $455,000 123 227 97% 27 Milton 112 $63,783,902 $569,499 $520,000 179 232 98% 23 Oakville 183 $173,269,486 $946,828 $735,000 273 440 97% 34- - - - - - - - Peel Region 954 $572,419,910 $600,021 $540,300 1,788 2,523 97% 25 Brampton 475 $240,802,795 $506,953 $467,000 939 1,281 97% 25 Caledon 76 $46,776,149 $615,476 $549,000 144 287 96% 38 Mississauga 403 $284,840,966 $706,801 $630,500 705 955 97% 22- - - - - - - - City of Toronto 1,137 $985,013,015 $866,326 $675,000 1,946 2,361 99% 18 - - - - - - - - York Region 1,019 $755,788,755 $741,697 $682,000 1,857 2,756 97% 24 Aurora 68 $45,130,076 $663,678 $590,750 91 146 98% 25 E. Gwillimbury 33 $18,589,900 $563,330 $525,000 60 115 98% 36 Georgina 74 $25,044,683 $338,442 $308,500 102 187 98% 28 King 35 $33,379,700 $953,706 $840,000 58 164 95% 48 Markham 262 $214,256,557 $817,773 $747,750 456 538 98% 20 Newmarket 82 $47,753,504 $582,360 $545,250 127 160 98% 22 Richmond Hill 185 $156,183,687 $844,236 $770,000 415 594 97% 22 Vaughan 213 $174,249,479 $818,073 $750,000 423 627 98% 20 Whitchurch-Stouffville 67 $41,201,169 $614,943 $545,000 125 225 97% 33- - - - - - - - Durham Region 783 $312,419,242 $399,003 $367,000 1,115 1,427 98% 24 Ajax 132 $58,053,101 $439,796 $405,500 197 196 98% 19 Brock 22 $5,638,300 $256,286 $237,500 34 117 95% 63 Clarington 133 $46,752,574 $351,523 $327,000 194 214 99% 23 Oshawa 212 $67,018,110 $316,123 $295,750 252 250 98% 23 Pickering 81 $44,882,317 $554,103 $473,700 136 170 98% 19 Scugog 35 $14,390,600 $411,160 $370,000 47 115 97% 42 Uxbridge 35 $18,245,800 $521,309 $475,000 53 131 97% 39 Whitby 133 $57,438,440 $431,868 $400,000 202 234 99% 18- - - - - - - - Dufferin County 44 $16,936,615 $384,923 $348,250 67 139 98% 36 Orangeville 44 $16,936,615 $384,923 $348,250 67 139 98% 36- - - - - - - - Simcoe County 180 $69,771,150 $387,618 $355,000 282 643 98% 44 Adjala-Tosorontio 14 $6,225,100 $444,650 $422,450 35 85 98% 64 Bradford West Gwillimbury 41 $20,755,499 $506,232 $450,000 70 134 98% 29 Essa 23 $7,187,800 $312,513 $280,000 36 90 97% 46 Innisfil 58 $19,998,552 $344,803 $313,750 87 213 97% 53 New Tecumseth 44 $15,604,199 $354,641 $327,750 54 121 98% 39 SUMMARY OF EXISTING HOME TRANSACTIONS DETACHED HOUSES, JUNE 2013 ! TURN PAGE FOR CITY OF TORONTO TABLES OR CLICK HERE:
- 8. Market Watch, June 2013 Industrial Leasing July 2010Page 3 8 Toronto Real Estate Board CITY OF TORONTO MUNICIPAL BREAKDOWN Sales1 Dollar Volume1 Average Price1 Median Price1 New Listings2 Active Listings3 Avg. SP/LP4 Avg. DOM5 TREB Total 4,548 $3,027,207,541 $665,613 $562,373 7,727 10,932 98% 24 City of Toronto Total 1,137 $985,013,015 $866,326 $675,000 1,946 2,361 99% 18 Toronto West 368 $268,623,535 $729,955 $611,500 608 691 100% 19 Toronto W01 23 $24,876,913 $1,081,605 $905,000 34 29 101% 11 Toronto W02 40 $31,729,881 $793,247 $797,000 52 38 104% 12 Toronto W03 40 $19,846,250 $496,156 $481,000 55 58 102% 13 Toronto W04 38 $20,581,795 $541,626 $528,500 61 78 98% 18 Toronto W05 22 $12,961,275 $589,149 $539,500 46 76 96% 34 Toronto W06 35 $18,594,547 $531,273 $493,000 64 59 101% 16 Toronto W07 26 $24,136,900 $928,342 $793,050 40 25 102% 17 Toronto W08 78 $81,658,746 $1,046,907 $833,000 141 199 98% 22 Toronto W09 27 $16,300,988 $603,740 $585,000 38 48 99% 20 Toronto W10 39 $17,936,240 $459,904 $442,500 77 81 98% 23 Toronto Central 344 $465,639,919 $1,353,604 $1,122,500 639 982 98% 20 Toronto C01 6 $4,352,800 $725,467 $746,400 20 18 105% 12 Toronto C02 17 $25,092,393 $1,476,023 $1,400,000 26 40 99% 18 Toronto C03 27 $44,920,500 $1,663,722 $1,160,000 40 78 98% 14 Toronto C04 73 $103,061,205 $1,411,797 $1,259,000 116 173 98% 19 Toronto C06 18 $15,414,500 $856,361 $746,000 42 55 98% 17 Toronto C07 38 $37,541,488 $987,934 $856,000 82 133 98% 21 Toronto C08 3 $4,275,000 $1,425,000 $1,500,000 5 5 99% 88 Toronto C09 13 $21,747,390 $1,672,876 $1,501,000 15 37 98% 27 Toronto C10 22 $24,710,500 $1,123,205 $1,007,000 27 23 101% 12 Toronto C11 15 $22,505,318 $1,500,355 $1,530,000 16 17 97% 21 Toronto C12 22 $60,641,028 $2,756,410 $2,230,000 59 135 91% 31 Toronto C13 33 $35,131,797 $1,064,600 $865,000 56 46 102% 13 Toronto C14 31 $41,044,500 $1,324,016 $1,202,000 82 150 97% 26 Toronto C15 26 $25,201,500 $969,288 $885,000 53 72 99% 19 Toronto East 425 $250,749,561 $589,999 $525,000 699 688 100% 16 Toronto E01 21 $16,135,000 $768,333 $685,000 32 29 100% 23 Toronto E02 27 $23,395,300 $866,493 $837,000 44 50 99% 16 Toronto E03 64 $40,936,355 $639,631 $581,500 93 71 102% 14 Toronto E04 43 $20,349,828 $473,252 $458,000 92 84 101% 12 Toronto E05 44 $28,732,980 $653,022 $658,250 55 55 99% 15 Toronto E06 30 $16,302,300 $543,410 $480,000 63 65 99% 14 Toronto E07 29 $16,660,800 $574,510 $538,000 52 55 101% 19 Toronto E08 32 $18,725,500 $585,172 $516,500 65 69 99% 18 Toronto E09 54 $26,393,799 $488,774 $467,750 78 60 100% 16 Toronto E10 47 $25,908,699 $551,249 $550,000 81 99 99% 19 Toronto E11 34 $17,209,000 $506,147 $496,000 44 51 100% 20 DETACHED HOUSES, JUNE 2013 SUMMARY OF EXISTING HOME TRANSACTIONS
- 9. Industrial Leasing Toronto Real Estate Board ALL TREB AREAS Sales 1 Dollar Volume 1 Average Price 1 Median Price 1 New Listings 2 Active Listings 3 Avg. SP/LP 4 Avg. DOM 5 TREB Total 1,003 $491,512,932 $490,043 $445,100 1,492 1,356 101% 17- - - - - - - - Halton Region 46 $20,189,200 $438,896 $419,950 72 64 99% 22 Burlington 4 $1,659,500 $414,875 $383,500 13 10 98% 17 Halton Hills 3 $1,064,500 $354,833 $350,000 6 4 100% 19 Milton 33 $13,869,700 $420,294 $419,900 38 29 99% 22 Oakville 6 $3,595,500 $599,250 $501,750 15 21 101% 25- - - - - - - - Peel Region 352 $144,268,948 $409,855 $405,500 566 564 98% 19 Brampton 175 $64,873,799 $370,707 $367,000 292 324 98% 21 Caledon 10 $4,010,800 $401,080 $396,500 15 12 99% 20 Mississauga 167 $75,384,349 $451,403 $453,000 259 228 99% 16- - - - - - - - City of Toronto 380 $234,913,563 $618,194 $550,000 539 432 103% 14 - - - - - - - - York Region 141 $69,082,211 $489,945 $488,011 218 213 99% 16 Aurora 6 $2,662,600 $443,767 $436,500 12 7 100% 6 E. Gwillimbury 2 $883,700 $441,850 $441,850 4 2 101% 11 Georgina 3 $949,800 $316,600 $319,900 6 4 99% 14 King - - - - - 2 - - Markham 44 $22,414,799 $509,427 $499,000 61 51 99% 17 Newmarket 20 $8,026,312 $401,316 $425,000 24 23 99% 11 Richmond Hill 14 $7,607,400 $543,386 $556,000 31 34 98% 19 Vaughan 43 $22,840,600 $531,177 $525,000 70 80 99% 18 Whitchurch-Stouffville 9 $3,697,000 $410,778 $420,000 10 10 98% 19- - - - - - - - Durham Region 65 $17,475,110 $268,848 $236,000 77 60 99% 15 Ajax 12 $4,137,400 $344,783 $350,250 18 15 98% 19 Brock - - - - - - - - Clarington 3 $568,900 $189,633 $227,900 2 4 95% 40 Oshawa 35 $7,693,510 $219,815 $222,000 37 25 100% 13 Pickering 8 $3,009,400 $376,175 $380,250 13 10 99% 13 Scugog 1 $240,000 $240,000 $240,000 3 2 98% 5 Uxbridge 1 $333,000 $333,000 $333,000 - - 101% 26 Whitby 5 $1,492,900 $298,580 $307,900 4 4 99% 13- - - - - - - - Dufferin County 7 $1,902,400 $271,771 $266,900 10 10 98% 26 Orangeville 7 $1,902,400 $271,771 $266,900 10 10 98% 26- - - - - - - - Simcoe County 12 $3,681,500 $306,792 $292,500 10 13 98% 26 Adjala-Tosorontio - - - - - - - - Bradford West Gwillimbury 7 $2,401,500 $343,071 $335,500 10 9 98% 24 Essa 3 $826,000 $275,333 $276,000 - 2 98% 26 Innisfil - - - - - - - - New Tecumseth 2 $454,000 $227,000 $227,000 - 2 97% 30 ! TURN PAGE FOR CITY OF TORONTO TABLES OR CLICK HERE: SUMMARY OF EXISTING HOME TRANSACTIONS SEMI-DETACHED HOUSES, JUNE 2013 July 2010Page 3 Market Watch, June 2013 9
- 10. Industrial Leasing July 2010Page 3 Toronto Real Estate Board Market Watch, June 2013 CITY OF TORONTO MUNICIPAL BREAKDOWN Sales1 Dollar Volume1 Average Price1 Median Price1 New Listings2 Active Listings3 Avg. SP/LP4 Avg. DOM5 TREB Total 1,003 $491,512,932 $490,043 $445,100 1,492 1,356 101% 17 City of Toronto Total 380 $234,913,563 $618,194 $550,000 539 432 103% 14 Toronto West 119 $63,828,577 $536,375 $479,800 184 173 103% 18 Toronto W01 14 $11,358,115 $811,294 $816,554 9 5 107% 12 Toronto W02 30 $18,830,214 $627,674 $631,900 43 21 110% 10 Toronto W03 22 $9,896,500 $449,841 $436,250 28 30 100% 25 Toronto W04 6 $2,127,500 $354,583 $380,500 8 12 98% 16 Toronto W05 31 $13,344,211 $430,458 $420,000 75 87 98% 18 Toronto W06 8 $4,820,037 $602,505 $606,519 8 8 100% 55 Toronto W07 - - - - 1 1 - - Toronto W08 2 $996,000 $498,000 $498,000 2 1 100% 5 Toronto W09 2 $822,000 $411,000 $411,000 2 - 99% 11 Toronto W10 4 $1,634,000 $408,500 $388,000 8 8 99% 6 Toronto Central 106 $83,827,390 $790,824 $703,750 144 127 103% 14 Toronto C01 20 $15,164,870 $758,244 $693,250 29 25 104% 17 Toronto C02 19 $23,140,500 $1,217,921 $1,080,000 18 23 101% 21 Toronto C03 16 $10,068,944 $629,309 $572,509 17 13 103% 8 Toronto C04 7 $5,899,000 $842,714 $870,000 5 2 104% 9 Toronto C06 - - - - - - - - Toronto C07 4 $2,130,800 $532,700 $513,900 6 7 103% 8 Toronto C08 7 $5,551,389 $793,056 $812,500 9 8 105% 22 Toronto C09 2 $3,445,000 $1,722,500 $1,722,500 3 3 103% 21 Toronto C10 3 $2,393,987 $797,996 $720,987 11 12 106% 5 Toronto C11 6 $4,334,000 $722,333 $755,000 5 2 104% 15 Toronto C12 - - - - - - - - Toronto C13 13 $6,819,900 $524,608 $470,000 16 7 100% 12 Toronto C14 - - - - - - - - Toronto C15 9 $4,879,000 $542,111 $535,000 25 25 103% 8 Toronto East 155 $87,257,596 $562,952 $542,000 211 132 103% 11 Toronto E01 48 $30,045,095 $625,939 $612,650 66 40 104% 10 Toronto E02 37 $23,969,481 $647,824 $622,500 55 32 103% 10 Toronto E03 22 $12,005,130 $545,688 $550,160 31 17 106% 13 Toronto E04 8 $3,606,490 $450,811 $415,000 12 12 101% 14 Toronto E05 7 $3,322,600 $474,657 $485,000 8 4 102% 14 Toronto E06 4 $2,375,000 $593,750 $526,500 3 3 101% 11 Toronto E07 10 $4,631,300 $463,130 $454,750 14 7 101% 7 Toronto E08 1 $457,500 $457,500 $457,500 4 4 95% 11 Toronto E09 2 $733,000 $366,500 $366,500 3 1 99% 17 Toronto E10 6 $2,247,000 $374,500 $364,500 4 4 102% 13 Toronto E11 10 $3,865,000 $386,500 $381,000 11 8 100% 12 SUMMARY OF EXISTING HOME TRANSACTIONS SEMI-DETACHED HOUSES, JUNE 2013 10
- 11. Industrial Leasing July 2010Page 3 Toronto Real Estate Board Market Watch, June 2013 ALL TREB AREAS Sales 1 Dollar Volume 1 Average Price 1 Median Price 1 New Listings 2 Active Listings 3 Avg. SP/LP 4 Avg. DOM 5 TREB Total 739 $259,079,788 $350,582 $330,000 1,073 1,403 99% 24- - - - - - - - Halton Region 63 $21,553,850 $342,125 $309,000 75 104 98% 32 Burlington 25 $8,422,050 $336,882 $327,500 26 33 99% 23 Halton Hills 9 $2,741,400 $304,600 $251,000 7 12 99% 31 Milton 8 $2,346,000 $293,250 $294,500 14 12 98% 26 Oakville 21 $8,044,400 $383,067 $318,500 28 47 98% 45- - - - - - - - Peel Region 266 $88,523,469 $332,795 $320,750 405 490 98% 25 Brampton 65 $16,961,600 $260,948 $252,500 104 133 98% 31 Caledon - - - - 1 1 - - Mississauga 201 $71,561,869 $356,029 $347,900 300 356 98% 23- - - - - - - - City of Toronto 264 $103,208,869 $390,943 $359,000 356 502 99% 23 - - - - - - - - York Region 64 $27,286,300 $426,348 $411,900 153 207 99% 20 Aurora 4 $1,852,500 $463,125 $361,800 8 22 97% 17 E. Gwillimbury - - - - - - - - Georgina - - - - 2 2 - - King - - - - - - - - Markham 20 $8,739,900 $436,995 $414,400 70 94 98% 18 Newmarket 5 $1,602,000 $320,400 $316,000 10 10 101% 23 Richmond Hill 15 $6,144,000 $409,600 $416,000 24 33 99% 21 Vaughan 19 $8,692,900 $457,521 $430,000 38 45 99% 20 Whitchurch-Stouffville 1 $255,000 $255,000 $255,000 1 1 98% 37- - - - - - - - Durham Region 76 $17,026,300 $224,030 $235,250 75 78 99% 22 Ajax 11 $2,795,050 $254,095 $248,000 8 10 100% 23 Brock 1 $175,000 $175,000 $175,000 2 5 92% 59 Clarington 6 $1,415,400 $235,900 $240,000 6 5 99% 22 Oshawa 25 $4,047,600 $161,904 $145,000 24 19 98% 17 Pickering 21 $5,605,850 $266,945 $256,000 20 23 98% 30 Scugog - - - - - - - - Uxbridge 1 $339,900 $339,900 $339,900 5 6 100% 14 Whitby 11 $2,647,500 $240,682 $235,500 10 10 98% 15- - - - - - - - Dufferin County 3 $716,000 $238,667 $237,500 3 12 98% 43 Orangeville 3 $716,000 $238,667 $237,500 3 12 98% 43- - - - - - - - Simcoe County 3 $765,000 $255,000 $246,000 6 10 98% 38 Adjala-Tosorontio - - - - - - - - Bradford West Gwillimbury 1 $246,000 $246,000 $246,000 3 3 99% 13 Essa - - - - - - - - Innisfil - - - - - - - - New Tecumseth 2 $519,000 $259,500 $259,500 3 7 98% 51 ! TURN PAGE FOR CITY OF TORONTO TABLES OR CLICK HERE: SUMMARY OF EXISTING HOME TRANSACTIONS CONDOMINIUM TOWNHOUSES, JUNE 2013 11
- 12. Industrial Leasing July 2010Page 3 Toronto Real Estate Board Market Watch, June 2013 12 CITY OF TORONTO MUNICIPAL BREAKDOWN Sales1 Dollar Volume1 Average Price1 Median Price1 New Listings2 Active Listings3 Avg. SP/LP4 Avg. DOM5 TREB Total 739 $259,079,788 $350,582 $330,000 1,073 1,403 99% 24 City of Toronto Total 264 $103,208,869 $390,943 $359,000 356 502 99% 23 Toronto West 63 $20,154,150 $319,907 $288,000 110 159 98% 25 Toronto W01 3 $1,219,000 $406,333 $372,000 6 8 98% 12 Toronto W02 9 $3,835,000 $426,111 $423,000 7 5 99% 14 Toronto W03 1 $330,000 $330,000 $330,000 5 5 97% 15 Toronto W04 7 $1,887,500 $269,643 $265,000 12 24 99% 28 Toronto W05 22 $5,809,050 $264,048 $259,250 38 52 97% 28 Toronto W06 4 $1,812,300 $453,075 $411,200 13 19 99% 27 Toronto W07 - - - - 2 3 - - Toronto W08 6 $1,947,900 $324,650 $299,950 12 20 98% 24 Toronto W09 3 $1,418,500 $472,833 $368,000 3 3 100% 28 Toronto W10 8 $1,894,900 $236,863 $270,250 12 20 98% 31 Toronto Central 110 $53,501,831 $486,380 $412,250 122 181 99% 21 Toronto C01 32 $14,124,805 $441,400 $419,000 38 41 99% 19 Toronto C02 4 $2,560,000 $640,000 $668,000 3 9 100% 22 Toronto C03 - - - - 1 4 - - Toronto C04 1 $1,132,000 $1,132,000 $1,132,000 2 5 98% 1 Toronto C06 - - - - 3 4 - - Toronto C07 8 $3,293,200 $411,650 $418,250 7 7 100% 25 Toronto C08 10 $4,941,500 $494,150 $450,750 4 13 98% 23 Toronto C09 1 $2,000,000 $2,000,000 $2,000,000 2 3 87% 33 Toronto C10 3 $1,442,000 $480,667 $406,000 3 8 103% 18 Toronto C11 2 $317,500 $158,750 $158,750 2 5 93% 38 Toronto C12 5 $4,141,500 $828,300 $690,000 3 14 98% 31 Toronto C13 4 $1,651,000 $412,750 $364,750 5 5 99% 17 Toronto C14 9 $5,665,338 $629,482 $661,800 13 26 98% 28 Toronto C15 31 $12,232,988 $394,613 $385,000 36 37 100% 17 Toronto East 91 $29,552,888 $324,757 $320,000 124 162 100% 25 Toronto E01 7 $3,194,500 $456,357 $418,000 6 9 101% 23 Toronto E02 5 $2,358,788 $471,758 $457,000 5 6 102% 20 Toronto E03 - - - - 2 3 - - Toronto E04 13 $4,517,800 $347,523 $345,000 17 24 99% 32 Toronto E05 21 $7,129,700 $339,510 $331,500 20 21 101% 19 Toronto E06 - - - - - - - - Toronto E07 10 $3,625,100 $362,510 $344,900 18 19 99% 16 Toronto E08 7 $1,867,900 $266,843 $283,900 9 13 100% 35 Toronto E09 5 $1,138,100 $227,620 $214,000 8 13 100% 41 Toronto E10 6 $1,526,500 $254,417 $260,000 13 19 98% 28 Toronto E11 17 $4,194,500 $246,735 $269,000 26 35 100% 25 SUMMARY OF EXISTING HOME TRANSACTIONS CONDOMINIUM TOWNHOUSES, JUNE 2013
- 13. Industrial Leasing July 2010Page 3 Toronto Real Estate Board Market Watch, June 2013 ALL TREB AREAS Sales 1 Dollar Volume 1 Average Price 1 Median Price 1 New Listings 2 Active Listings 3 Avg. SP/LP 4 Avg. DOM 5 TREB Total 1,885 $647,584,336 $343,546 $310,000 3,991 7,177 98% 31- - - - - - - - Halton Region 38 $12,270,033 $322,896 $305,000 72 164 98% 33 Burlington 15 $4,873,000 $324,867 $268,000 29 44 98% 26 Halton Hills 2 $560,000 $280,000 $280,000 1 1 100% 11 Milton 6 $1,824,500 $304,083 $320,000 9 18 98% 37 Oakville 15 $5,012,533 $334,169 $339,900 33 101 98% 40- - - - - - - - Peel Region 289 $75,605,075 $261,609 $245,000 609 1,109 97% 32 Brampton 37 $7,847,800 $212,103 $211,300 79 166 97% 35 Caledon 1 $420,000 $420,000 $420,000 2 3 100% 20 Mississauga 251 $67,337,275 $268,276 $252,000 528 940 97% 31- - - - - - - - City of Toronto 1,329 $487,120,625 $366,532 $330,000 2,849 5,041 98% 30 - - - - - - - - York Region 187 $62,300,365 $333,157 $310,000 382 744 97% 33 Aurora 6 $1,826,500 $304,417 $286,250 4 34 98% 26 E. Gwillimbury 1 $219,500 $219,500 $219,500 1 1 102% 14 Georgina - - - - 1 2 - - King 1 $775,000 $775,000 $775,000 3 20 93% 43 Markham 61 $20,803,715 $341,045 $304,300 132 241 97% 36 Newmarket 6 $1,557,000 $259,500 $251,000 3 3 97% 26 Richmond Hill 51 $15,915,600 $312,071 $305,000 94 176 97% 32 Vaughan 60 $20,751,050 $345,851 $331,500 142 253 97% 30 Whitchurch-Stouffville 1 $452,000 $452,000 $452,000 2 14 96% 164- - - - - - - - Durham Region 39 $9,525,338 $244,239 $215,000 68 97 98% 26 Ajax 5 $1,729,400 $345,880 $219,900 7 9 98% 28 Brock - - - - 1 1 - - Clarington 10 $1,773,300 $177,330 $174,900 14 17 97% 31 Oshawa 1 $300,000 $300,000 $300,000 8 20 100% 19 Pickering 15 $3,930,238 $262,016 $238,000 22 22 98% 23 Scugog - - - - - - - - Uxbridge 2 $395,500 $197,750 $197,750 6 10 98% 54 Whitby 6 $1,396,900 $232,817 $227,000 10 18 98% 18- - - - - - - - Dufferin County 2 $545,900 $272,950 $272,950 8 8 96% 22 Orangeville 2 $545,900 $272,950 $272,950 8 8 96% 22- - - - - - - - Simcoe County 1 $217,000 $217,000 $217,000 3 14 95% 2 Adjala-Tosorontio - - - - - - - - Bradford West Gwillimbury 1 $217,000 $217,000 $217,000 2 2 95% 2 Essa - - - - - - - - Innisfil - - - - - - - - New Tecumseth - - - - 1 12 - - ! TURN PAGE FOR CITY OF TORONTO TABLES OR CLICK HERE: SUMMARY OF EXISTING HOME TRANSACTIONS CONDOMINIUM APARTMENT, JUNE 2013 13
- 14. Industrial Leasing July 2010Page 3 Toronto Real Estate Board Market Watch, June 2013 14 CITY OF TORONTO MUNICIPAL BREAKDOWN Sales1 Dollar Volume1 Average Price1 Median Price1 New Listings2 Active Listings3 Avg. SP/LP4 Avg. DOM5 TREB Total 1,885 $647,584,336 $343,546 $310,000 3,991 7,177 98% 31 City of Toronto Total 1,329 $487,120,625 $366,532 $330,000 2,849 5,041 98% 30 Toronto West 262 $79,451,327 $303,249 $274,950 560 1,099 97% 34 Toronto W01 22 $7,898,806 $359,037 $347,750 40 69 98% 31 Toronto W02 17 $6,736,900 $396,288 $343,000 29 45 100% 17 Toronto W03 5 $1,303,000 $260,600 $245,000 5 10 96% 24 Toronto W04 22 $3,840,150 $174,552 $166,250 44 70 96% 29 Toronto W05 21 $3,210,800 $152,895 $144,500 53 115 95% 26 Toronto W06 53 $22,574,570 $425,935 $345,000 160 385 97% 51 Toronto W07 5 $2,082,500 $416,500 $392,000 6 10 96% 35 Toronto W08 71 $23,504,100 $331,044 $310,000 112 196 98% 31 Toronto W09 17 $3,559,501 $209,382 $237,000 35 58 97% 36 Toronto W10 29 $4,741,000 $163,483 $172,000 76 141 97% 37 Toronto Central 836 $350,636,625 $419,422 $364,500 1,861 3,244 98% 29 Toronto C01 308 $128,730,023 $417,955 $373,000 748 1,329 98% 28 Toronto C02 27 $26,531,668 $982,654 $525,000 68 200 96% 36 Toronto C03 4 $1,804,500 $451,125 $458,750 10 17 98% 19 Toronto C04 16 $7,904,202 $494,013 $422,500 33 48 98% 33 Toronto C06 20 $6,147,300 $307,365 $294,000 26 66 97% 42 Toronto C07 45 $15,251,288 $338,918 $318,000 136 213 97% 36 Toronto C08 131 $53,597,568 $409,142 $372,800 262 409 98% 28 Toronto C09 9 $7,518,000 $835,333 $601,000 13 24 93% 24 Toronto C10 41 $18,576,600 $453,088 $425,000 48 79 98% 31 Toronto C11 22 $4,683,600 $212,891 $186,000 43 53 98% 30 Toronto C12 9 $5,597,700 $621,967 $544,500 23 40 99% 23 Toronto C13 38 $12,959,936 $341,051 $312,200 61 95 98% 35 Toronto C14 110 $41,544,201 $377,675 $354,500 266 439 98% 28 Toronto C15 56 $19,790,039 $353,394 $303,500 124 232 97% 27 Toronto East 231 $57,032,673 $246,895 $230,000 428 698 98% 29 Toronto E01 22 $8,845,100 $402,050 $388,500 39 61 101% 15 Toronto E02 6 $2,228,000 $371,333 $358,500 23 29 99% 15 Toronto E03 14 $2,939,000 $209,929 $148,250 12 18 97% 25 Toronto E04 32 $5,885,386 $183,918 $165,500 58 92 97% 31 Toronto E05 41 $11,012,799 $268,605 $265,000 47 73 97% 27 Toronto E06 2 $712,000 $356,000 $356,000 6 8 102% 6 Toronto E07 33 $8,121,800 $246,115 $243,000 85 135 98% 29 Toronto E08 19 $3,680,900 $193,732 $183,500 31 52 98% 42 Toronto E09 44 $10,527,388 $239,259 $241,400 97 153 98% 31 Toronto E10 1 $227,000 $227,000 $227,000 9 19 99% 34 Toronto E11 17 $2,853,300 $167,841 $164,000 21 58 96% 40 SUMMARY OF EXISTING HOME TRANSACTIONS CONDOMINIUM APARTMENT, JUNE 2013
- 15. Industrial Leasing July 2010Page 3 Toronto Real Estate Board Market Watch, June 2013 ALL TREB AREAS Sales 1 Dollar Volume 1 Average Price 1 Median Price 1 New Listings 2 Active Listings 3 Avg. SP/LP 4 Avg. DOM 5 TREB Total 157 $70,921,626 $451,730 $459,000 197 165 99% 21- - - - - - - - Halton Region 9 $3,768,400 $418,711 $422,500 13 16 98% 24 Burlington 1 $394,000 $394,000 $394,000 2 4 95% 49 Halton Hills 1 $328,000 $328,000 $328,000 2 2 101% 3 Milton 3 $1,231,400 $410,467 $395,000 5 6 99% 23 Oakville 4 $1,815,000 $453,750 $447,500 4 4 97% 24- - - - - - - - Peel Region 9 $3,797,500 $421,944 $440,000 17 23 97% 24 Brampton 5 $1,926,500 $385,300 $385,000 4 6 97% 31 Caledon - - - - 1 2 - - Mississauga 4 $1,871,000 $467,750 $462,500 12 15 97% 16- - - - - - - - City of Toronto 16 $7,987,100 $499,194 $486,500 19 12 99% 19 - - - - - - - - York Region 72 $39,899,076 $554,154 $554,750 94 72 99% 21 Aurora 1 $551,000 $551,000 $551,000 4 4 106% 7 E. Gwillimbury - - - - - - - - Georgina 1 $334,000 $334,000 $334,000 - - 99% 19 King - - - - - - - - Markham 52 $29,279,800 $563,073 $561,000 71 47 100% 17 Newmarket - - - - - - - - Richmond Hill 10 $5,465,388 $546,539 $546,750 8 10 98% 32 Vaughan 8 $4,268,888 $533,611 $497,500 10 10 99% 32 Whitchurch-Stouffville - - - - 1 1 - -- - - - - - - - Durham Region 36 $10,915,550 $303,210 $297,000 42 23 98% 18 Ajax 5 $1,789,500 $357,900 $368,500 7 3 98% 10 Brock - - - - - - - - Clarington 14 $3,874,650 $276,761 $281,500 20 8 99% 14 Oshawa 5 $1,251,500 $250,300 $249,500 6 5 98% 18 Pickering 2 $609,000 $304,500 $304,500 - 1 95% 83 Scugog - - - - - - - - Uxbridge - - - - - - - - Whitby 10 $3,390,900 $339,090 $344,000 9 6 98% 15- - - - - - - - Dufferin County - - - - 1 1 - - Orangeville - - - - 1 1 - -- - - - - - - - Simcoe County 15 $4,554,000 $303,600 $292,500 11 18 98% 30 Adjala-Tosorontio - - - - - - - - Bradford West Gwillimbury 5 $1,819,500 $363,900 $366,000 7 8 99% 25 Essa 7 $1,807,500 $258,214 $250,000 - 2 98% 34 Innisfil 2 $647,000 $323,500 $323,500 2 3 98% 40 New Tecumseth 1 $280,000 $280,000 $280,000 2 5 100% 9 SUMMARY OF EXISTING HOME TRANSACTIONS LINK, JUNE 2013 ! TURN PAGE FOR CITY OF TORONTO TABLES OR CLICK HERE: 15
- 16. Industrial Leasing July 2010Page 3 Toronto Real Estate Board Market Watch, June 2013 16 CITY OF TORONTO MUNICIPAL BREAKDOWN Sales1 Dollar Volume1 Average Price1 Median Price1 New Listings2 Active Listings3 Avg. SP/LP4 Avg. DOM5 TREB Total 157 $70,921,626 $451,730 $459,000 197 165 99% 21 City of Toronto Total 16 $7,987,100 $499,194 $486,500 19 12 99% 19 Toronto West - - - - 1 1 - - Toronto W01 - - - - - - - - Toronto W02 - - - - - - - - Toronto W03 - - - - - - - - Toronto W04 - - - - - - - - Toronto W05 - - - - - - - - Toronto W06 - - - - - - - - Toronto W07 - - - - - - - - Toronto W08 - - - - - - - - Toronto W09 - - - - - - - - Toronto W10 - - - - 1 1 - - Toronto Central 4 $2,316,800 $579,200 $580,900 4 - 103% 11 Toronto C01 - - - - - - - - Toronto C02 - - - - - - - - Toronto C03 - - - - - - - - Toronto C04 - - - - - - - - Toronto C06 1 $565,000 $565,000 $565,000 1 - 98% 6 Toronto C07 1 $610,000 $610,000 $610,000 1 - 111% 6 Toronto C08 - - - - - - - - Toronto C09 - - - - - - - - Toronto C10 - - - - - - - - Toronto C11 - - - - - - - - Toronto C12 - - - - - - - - Toronto C13 - - - - - - - - Toronto C14 - - - - - - - - Toronto C15 2 $1,141,800 $570,900 $570,900 2 - 102% 15 Toronto East 12 $5,670,300 $472,525 $450,250 14 11 98% 22 Toronto E01 - - - - - - - - Toronto E02 - - - - - - - - Toronto E03 - - - - - - - - Toronto E04 - - - - - - - - Toronto E05 6 $3,048,000 $508,000 $517,750 3 3 97% 33 Toronto E06 - - - - - - - - Toronto E07 6 $2,622,300 $437,050 $441,500 8 5 99% 12 Toronto E08 - - - - 1 1 - - Toronto E09 - - - - 1 1 - - Toronto E10 - - - - - - - - Toronto E11 - - - - 1 1 - - SUMMARY OF EXISTING HOME TRANSACTIONS LINK, JUNE 2013
- 17. Industrial Leasing July 2010Page 3 Toronto Real Estate Board Market Watch, June 2013 ALL TREB AREAS Sales 1 Dollar Volume 1 Average Price 1 Median Price 1 New Listings 2 Active Listings 3 Avg. SP/LP 4 Avg. DOM 5 TREB Total 694 $307,554,628 $443,162 $415,500 1,023 1,078 99% 20- - - - - - - - Halton Region 125 $56,415,493 $451,324 $400,000 142 157 99% 21 Burlington 11 $4,303,100 $391,191 $398,000 15 22 99% 22 Halton Hills 6 $2,174,000 $362,333 $368,250 5 10 100% 26 Milton 57 $21,499,632 $377,187 $379,999 67 69 99% 17 Oakville 51 $28,438,761 $557,623 $462,000 55 56 98% 25- - - - - - - - Peel Region 125 $48,488,389 $387,907 $378,000 229 262 99% 22 Brampton 78 $27,707,101 $355,219 $358,250 137 170 98% 23 Caledon 4 $1,435,000 $358,750 $361,500 10 15 97% 12 Mississauga 43 $19,346,288 $449,914 $448,900 82 77 99% 20- - - - - - - - City of Toronto 115 $64,735,766 $562,920 $545,000 166 168 101% 19 - - - - - - - - York Region 216 $105,144,390 $486,780 $476,139 331 367 99% 19 Aurora 9 $3,794,777 $421,642 $433,500 20 22 99% 13 E. Gwillimbury 2 $876,000 $438,000 $438,000 2 1 100% 10 Georgina 7 $2,075,300 $296,471 $305,000 2 2 99% 10 King 2 $1,349,999 $675,000 $675,000 4 7 99% 19 Markham 48 $24,318,075 $506,627 $486,000 95 119 99% 20 Newmarket 21 $8,755,700 $416,938 $400,000 23 15 100% 16 Richmond Hill 58 $30,427,148 $524,606 $523,000 95 111 99% 24 Vaughan 52 $26,753,400 $514,488 $500,750 73 78 99% 19 Whitchurch-Stouffville 17 $6,793,991 $399,647 $403,000 17 12 99% 17- - - - - - - - Durham Region 92 $27,068,490 $294,223 $289,245 127 96 99% 15 Ajax 24 $7,518,900 $313,288 $319,500 38 30 99% 17 Brock - - - - - - - - Clarington 19 $4,789,190 $252,063 $250,000 19 15 100% 12 Oshawa 9 $2,413,000 $268,111 $280,000 12 7 100% 12 Pickering 6 $1,901,500 $316,917 $309,250 12 10 98% 22 Scugog - - - - - - - - Uxbridge 3 $1,057,000 $352,333 $350,000 2 2 99% 30 Whitby 31 $9,388,900 $302,868 $299,000 44 32 99% 15- - - - - - - - Dufferin County 6 $1,731,000 $288,500 $289,000 8 10 98% 30 Orangeville 6 $1,731,000 $288,500 $289,000 8 10 98% 30- - - - - - - - Simcoe County 15 $3,971,100 $264,740 $252,000 20 18 98% 22 Adjala-Tosorontio - - - - - - - - Bradford West Gwillimbury 4 $1,387,700 $346,925 $365,500 - 1 98% 44 Essa 2 $430,000 $215,000 $215,000 7 8 98% 19 Innisfil 3 $630,500 $210,167 $210,000 3 1 99% 12 New Tecumseth 6 $1,522,900 $253,817 $255,500 10 8 99% 14 ! TURN PAGE FOR CITY OF TORONTO TABLES OR CLICK HERE: SUMMARY OF EXISTING HOME TRANSACTIONS ATTACHED/ROW/TOWNHOUSE, JUNE 2013 17
- 18. Industrial Leasing July 2010Page 3 Toronto Real Estate Board Market Watch, June 2013 18 CITY OF TORONTO MUNICIPAL BREAKDOWN Sales1 Dollar Volume1 Average Price1 Median Price1 New Listings2 Active Listings3 Avg. SP/LP4 Avg. DOM5 TREB Total 694 $307,554,628 $443,162 $415,500 1,023 1,078 99% 20 City of Toronto Total 115 $64,735,766 $562,920 $545,000 166 168 101% 19 Toronto West 29 $15,883,500 $547,707 $571,000 48 40 101% 19 Toronto W01 1 $483,000 $483,000 $483,000 1 - 98% 21 Toronto W02 4 $2,663,900 $665,975 $645,000 5 1 111% 8 Toronto W03 1 $299,500 $299,500 $299,500 4 4 100% 64 Toronto W04 3 $1,217,500 $405,833 $400,000 4 5 98% 27 Toronto W05 3 $1,259,500 $419,833 $422,000 2 5 99% 30 Toronto W06 5 $2,967,700 $593,540 $630,000 18 13 98% 17 Toronto W07 6 $3,890,400 $648,400 $629,000 6 5 99% 18 Toronto W08 3 $1,836,000 $612,000 $613,000 5 5 99% 6 Toronto W09 - - - - 1 1 - - Toronto W10 3 $1,266,000 $422,000 $425,000 2 1 98% 16 Toronto Central 36 $25,423,754 $706,215 $656,500 53 67 100% 19 Toronto C01 19 $12,476,500 $656,658 $650,000 18 18 101% 15 Toronto C02 1 $965,000 $965,000 $965,000 14 13 101% 1 Toronto C03 - - - - - 2 - - Toronto C04 1 $1,300,000 $1,300,000 $1,300,000 5 9 96% 82 Toronto C06 - - - - 1 1 - - Toronto C07 1 $621,500 $621,500 $621,500 - 1 99% 8 Toronto C08 6 $4,740,054 $790,009 $826,500 7 9 99% 34 Toronto C09 - - - - 1 2 - - Toronto C10 - - - - - - - - Toronto C11 1 $559,900 $559,900 $559,900 - 1 100% 14 Toronto C12 - - - - - 1 - - Toronto C13 4 $2,318,800 $579,700 $571,900 1 1 103% 9 Toronto C14 3 $2,442,000 $814,000 $862,000 5 9 98% 19 Toronto C15 - - - - 1 - - - Toronto East 50 $23,428,512 $468,570 $433,000 65 61 101% 18 Toronto E01 8 $5,091,724 $636,466 $650,000 11 8 102% 20 Toronto E02 5 $3,065,000 $613,000 $550,000 6 5 108% 13 Toronto E03 3 $1,212,000 $404,000 $410,000 5 5 100% 19 Toronto E04 4 $1,863,000 $465,750 $465,000 9 10 98% 33 Toronto E05 - - - - 1 1 - - Toronto E06 - - - - 1 1 - - Toronto E07 4 $1,656,388 $414,097 $416,250 5 4 99% 13 Toronto E08 3 $1,366,000 $455,333 $408,000 4 4 99% 25 Toronto E09 2 $792,000 $396,000 $396,000 3 4 100% 8 Toronto E10 10 $4,037,900 $403,790 $404,000 12 14 100% 20 Toronto E11 11 $4,344,500 $394,955 $400,000 8 5 100% 13 SUMMARY OF EXISTING HOME TRANSACTIONS ATTACHED/ROW/TOWNHOUSE, JUNE 2013
- 19. Industrial Leasing July 2010Page 3 Toronto Real Estate Board Market Watch, June 2013 ALL TREB AREAS Sales 1 Dollar Volume 1 Average Price 1 Median Price 1 New Listings 2 Active Listings 3 Avg. SP/LP 4 Avg. DOM 5 TREB Total 11 $2,680,500 $243,682 $163,000 21 28 97% 57- - - - - - - - Halton Region - - - - 1 1 - - Burlington - - - - 1 1 - - Halton Hills - - - - - - - - Milton - - - - - - - - Oakville - - - - - - - -- - - - - - - - Peel Region - - - - 1 1 - - Brampton - - - - - - - - Caledon - - - - - - - - Mississauga - - - - 1 1 - -- - - - - - - - City of Toronto 11 $2,680,500 $243,682 $163,000 18 25 97% 57 - - - - - - - - York Region - - - - 1 1 - - Aurora - - - - - - - - E. Gwillimbury - - - - - - - - Georgina - - - - - - - - King - - - - - - - - Markham - - - - - - - - Newmarket - - - - - - - - Richmond Hill - - - - 1 1 - - Vaughan - - - - - - - - Whitchurch-Stouffville - - - - - - - -- - - - - - - - Durham Region - - - - - - - - Ajax - - - - - - - - Brock - - - - - - - - Clarington - - - - - - - - Oshawa - - - - - - - - Pickering - - - - - - - - Scugog - - - - - - - - Uxbridge - - - - - - - - Whitby - - - - - - - -- - - - - - - - Dufferin County - - - - - - - - Orangeville - - - - - - - -- - - - - - - - Simcoe County - - - - - - - - Adjala-Tosorontio - - - - - - - - Bradford West Gwillimbury - - - - - - - - Essa - - - - - - - - Innisfil - - - - - - - - New Tecumseth - - - - - - - - SUMMARY OF EXISTING HOME TRANSACTIONS CO-OP APARTMENT, JUNE 2013 ! TURN PAGE FOR CITY OF TORONTO TABLES OR CLICK HERE: 19
- 20. Industrial Leasing July 2010Page 3 Toronto Real Estate Board Market Watch, June 2013 20 CITY OF TORONTO MUNICIPAL BREAKDOWN Sales1 Dollar Volume1 Average Price1 Median Price1 New Listings2 Active Listings3 Avg. SP/LP4 Avg. DOM5 TREB Total 11 $2,680,500 $243,682 $163,000 21 28 97% 57 City of Toronto Total 11 $2,680,500 $243,682 $163,000 18 25 97% 57 Toronto West 4 $485,000 $121,250 $117,500 6 7 99% 88 Toronto W01 - - - - - - - - Toronto W02 - - - - - - - - Toronto W03 - - - - - - - - Toronto W04 - - - - - - - - Toronto W05 3 $322,000 $107,333 $95,000 1 - 98% 77 Toronto W06 - - - - 3 4 - - Toronto W07 - - - - 1 1 - - Toronto W08 1 $163,000 $163,000 $163,000 - - 102% 120 Toronto W09 - - - - 1 2 - - Toronto W10 - - - - - - - - Toronto Central 7 $2,195,500 $313,643 $361,500 11 15 97% 40 Toronto C01 1 $470,000 $470,000 $470,000 4 3 98% 1 Toronto C02 2 $743,500 $371,750 $371,750 - - 94% 49 Toronto C03 1 $120,000 $120,000 $120,000 - - 93% 69 Toronto C04 1 $100,000 $100,000 $100,000 1 1 87% 71 Toronto C06 - - - - - - - - Toronto C07 - - - - 1 2 - - Toronto C08 1 $259,000 $259,000 $259,000 - - 100% 33 Toronto C09 1 $503,000 $503,000 $503,000 5 9 104% 7 Toronto C10 - - - - - - - - Toronto C11 - - - - - - - - Toronto C12 - - - - - - - - Toronto C13 - - - - - - - - Toronto C14 - - - - - - - - Toronto C15 - - - - - - - - Toronto East - - - - 1 3 - - Toronto E01 - - - - - - - - Toronto E02 - - - - - 1 - - Toronto E03 - - - - - - - - Toronto E04 - - - - - 1 - - Toronto E05 - - - - - - - - Toronto E06 - - - - - - - - Toronto E07 - - - - - - - - Toronto E08 - - - - - - - - Toronto E09 - - - - - - - - Toronto E10 - - - - 1 1 - - Toronto E11 - - - - - - - - SUMMARY OF EXISTING HOME TRANSACTIONS CO-OP APARTMENT, JUNE 2013
- 21. Industrial Leasing July 2010Page 3 Toronto Real Estate Board Market Watch, June 2013 ALL TREB AREAS Sales 1 Dollar Volume 1 Average Price 1 Median Price 1 New Listings 2 Active Listings 3 Avg. SP/LP 4 Avg. DOM 5 TREB Total 11 $4,847,500 $440,682 $417,000 21 39 99% 51- - - - - - - - Halton Region 1 $394,000 $394,000 $394,000 - - 99% 12 Burlington 1 $394,000 $394,000 $394,000 - - 99% 12 Halton Hills - - - - - - - - Milton - - - - - - - - Oakville - - - - - - - -- - - - - - - - Peel Region 4 $2,258,000 $564,500 $545,500 9 4 100% 14 Brampton 2 $1,091,000 $545,500 $545,500 4 1 101% 7 Caledon - - - - 1 1 - - Mississauga 2 $1,167,000 $583,500 $583,500 4 2 99% 22- - - - - - - - City of Toronto - - - - 1 4 - - - - - - - - - - York Region - - - - 1 1 - - Aurora - - - - - - - - E. Gwillimbury - - - - - - - - Georgina - - - - - - - - King - - - - - - - - Markham - - - - 1 1 - - Newmarket - - - - - - - - Richmond Hill - - - - - - - - Vaughan - - - - - - - - Whitchurch-Stouffville - - - - - - - -- - - - - - - - Durham Region 2 $490,000 $245,000 $245,000 1 1 99% 22 Ajax 2 $490,000 $245,000 $245,000 1 - 99% 22 Brock - - - - - - - - Clarington - - - - - - - - Oshawa - - - - - - - - Pickering - - - - - 1 - - Scugog - - - - - - - - Uxbridge - - - - - - - - Whitby - - - - - - - -- - - - - - - - Dufferin County - - - - - - - - Orangeville - - - - - - - -- - - - - - - - Simcoe County 4 $1,705,500 $426,375 $429,500 9 29 98% 112 Adjala-Tosorontio - - - - - - - - Bradford West Gwillimbury - - - - - - - - Essa - - - - - - - - Innisfil - - - - - - - - New Tecumseth 4 $1,705,500 $426,375 $429,500 9 29 98% 112 ! TURN PAGE FOR CITY OF TORONTO TABLES OR CLICK HERE: SUMMARY OF EXISTING HOME TRANSACTIONS DETACHED CONDOMINIUM, JUNE 2013 21
- 22. Industrial Leasing July 2010Page 3 Toronto Real Estate Board Market Watch, June 2013 22 CITY OF TORONTO MUNICIPAL BREAKDOWN Sales1 Dollar Volume1 Average Price1 Median Price1 New Listings2 Active Listings3 Avg. SP/LP4 Avg. DOM5 TREB Total 11 $4,847,500 $440,682 $417,000 21 39 99% 51 City of Toronto Total - - - - 1 4 - - Toronto West - - - - - 1 - - Toronto W01 - - - - - - - - Toronto W02 - - - - - - - - Toronto W03 - - - - - - - - Toronto W04 - - - - - - - - Toronto W05 - - - - - - - - Toronto W06 - - - - - - - - Toronto W07 - - - - - - - - Toronto W08 - - - - - - - - Toronto W09 - - - - - - - - Toronto W10 - - - - - 1 - - Toronto Central - - - - 1 2 - - Toronto C01 - - - - - - - - Toronto C02 - - - - - - - - Toronto C03 - - - - - - - - Toronto C04 - - - - - - - - Toronto C06 - - - - - - - - Toronto C07 - - - - - 1 - - Toronto C08 - - - - - - - - Toronto C09 - - - - 1 1 - - Toronto C10 - - - - - - - - Toronto C11 - - - - - - - - Toronto C12 - - - - - - - - Toronto C13 - - - - - - - - Toronto C14 - - - - - - - - Toronto C15 - - - - - - - - Toronto East - - - - - 1 - - Toronto E01 - - - - - - - - Toronto E02 - - - - - - - - Toronto E03 - - - - - - - - Toronto E04 - - - - - - - - Toronto E05 - - - - - - - - Toronto E06 - - - - - - - - Toronto E07 - - - - - - - - Toronto E08 - - - - - - - - Toronto E09 - - - - - - - - Toronto E10 - - - - - 1 - - Toronto E11 - - - - - - - - SUMMARY OF EXISTING HOME TRANSACTIONS DETACHED CONDOMINIUM, JUNE 2013
- 23. Industrial Leasing July 2010Page 3 Toronto Real Estate Board Market Watch, June 2013 23 ALL TREB AREAS Sales 1 Dollar Volume 1 Average Price 1 Median Price 1 New Listings 2 Active Listings 3 Avg. SP/LP 4 Avg. DOM 5 TREB Total 13 $3,387,700 $260,592 $250,000 19 27 97% 60- - - - - - - - Halton Region - - - - - - - - Burlington - - - - - - - - Halton Hills - - - - - - - - Milton - - - - - - - - Oakville - - - - - - - -- - - - - - - - Peel Region - - - - - - - - Brampton - - - - - - - - Caledon - - - - - - - - Mississauga - - - - - - - -- - - - - - - - City of Toronto 13 $3,387,700 $260,592 $250,000 19 27 97% 60 - - - - - - - - York Region - - - - - - - - Aurora - - - - - - - - E. Gwillimbury - - - - - - - - Georgina - - - - - - - - King - - - - - - - - Markham - - - - - - - - Newmarket - - - - - - - - Richmond Hill - - - - - - - - Vaughan - - - - - - - - Whitchurch-Stouffville - - - - - - - -- - - - - - - - Durham Region - - - - - - - - Ajax - - - - - - - - Brock - - - - - - - - Clarington - - - - - - - - Oshawa - - - - - - - - Pickering - - - - - - - - Scugog - - - - - - - - Uxbridge - - - - - - - - Whitby - - - - - - - -- - - - - - - - Dufferin County - - - - - - - - Orangeville - - - - - - - -- - - - - - - - Simcoe County - - - - - - - - Adjala-Tosorontio - - - - - - - - Bradford West Gwillimbury - - - - - - - - Essa - - - - - - - - Innisfil - - - - - - - - New Tecumseth - - - - - - - - ! TURN PAGE FOR CITY OF TORONTO TABLES OR CLICK HERE: SUMMARY OF EXISTING HOME TRANSACTIONS CO-OWNERSHIP APARTMENT, JUNE 2013
- 24. Industrial Leasing July 2010Page 3 Toronto Real Estate Board Market Watch, June 2013 24 CITY OF TORONTO MUNICIPAL BREAKDOWN Sales1 Dollar Volume1 Average Price1 Median Price1 New Listings2 Active Listings3 Avg. SP/LP4 Avg. DOM5 TREB Total 13 $3,387,700 $260,592 $250,000 19 27 97% 60 City of Toronto Total 13 $3,387,700 $260,592 $250,000 19 27 97% 60 Toronto West 1 $435,000 $435,000 $435,000 1 2 97% 28 Toronto W01 - - - - - - - - Toronto W02 1 $435,000 $435,000 $435,000 - - 97% 28 Toronto W03 - - - - - - - - Toronto W04 - - - - - - - - Toronto W05 - - - - 1 2 - - Toronto W06 - - - - - - - - Toronto W07 - - - - - - - - Toronto W08 - - - - - - - - Toronto W09 - - - - - - - - Toronto W10 - - - - - - - - Toronto Central 12 $2,952,700 $246,058 $250,000 18 25 97% 62 Toronto C01 - - - - 1 1 - - Toronto C02 1 $250,000 $250,000 $250,000 5 8 97% 20 Toronto C03 1 $305,000 $305,000 $305,000 1 1 97% 35 Toronto C04 3 $784,800 $261,600 $279,900 3 4 99% 37 Toronto C06 - - - - - - - - Toronto C07 1 $190,000 $190,000 $190,000 - - 90% 211 Toronto C08 2 $484,000 $242,000 $242,000 2 1 98% 22 Toronto C09 - - - - - - - - Toronto C10 1 $292,000 $292,000 $292,000 4 3 97% 19 Toronto C11 - - - - - - - - Toronto C12 - - - - - - - - Toronto C13 1 $220,900 $220,900 $220,900 1 1 100% 168 Toronto C14 1 $176,000 $176,000 $176,000 1 6 98% 91 Toronto C15 1 $250,000 $250,000 $250,000 - - 96% 49 Toronto East - - - - - - - - Toronto E01 - - - - - - - - Toronto E02 - - - - - - - - Toronto E03 - - - - - - - - Toronto E04 - - - - - - - - Toronto E05 - - - - - - - - Toronto E06 - - - - - - - - Toronto E07 - - - - - - - - Toronto E08 - - - - - - - - Toronto E09 - - - - - - - - Toronto E10 - - - - - - - - Toronto E11 - - - - - - - - SUMMARY OF EXISTING HOME TRANSACTIONS CO-OWNERSHIP APARTMENT, JUNE 2013
- 25. Industrial Leasing July 2010Page 3 Toronto Real Estate Board Market Watch, June 2013 25 FOCUS ON THE MLS® HOME PRICE INDEX INDEX AND BENCHMARK PRICE, JUNE 2013 ALL TREB AREAS Index Benchmark Yr./Yr. % Chg. Index Benchmark Yr./Yr. % Chg. Index Benchmark Yr./Yr. % Chg. Index Benchmark Yr./Yr. % Chg. Index Benchmark Yr./Yr. % Chg. TREB Total 155.8 $475,300 2.91% 156.3 $581,200 3.37% 161.2 $455,400 3.73% 152.7 $334,400 3.39% 148.9 $299,000 0.81% Halton Region 164.2 $538,600 4.39% 162.2 $601,500 4.58% 163.6 $424,600 3.94% 163.5 $323,600 2.57% - - - Burlington 173.1 $498,900 4.85% 171.8 $587,200 5.01% 166.4 $396,600 4.07% 172.9 $347,200 3.84% - - - Halton Hills 153.5 $446,900 1.52% 152.6 $488,200 1.26% 159.1 $391,800 2.38% 157.8 $284,500 0.90% - - - Milton 154.1 $432,200 2.26% 145.6 $507,200 1.46% 156.9 $391,700 2.48% - - - - - - Oakville 172.8 $637,500 6.27% 171.8 $712,000 6.71% 174.2 $471,500 6.41% 162.8 $359,600 2.78% - - - Peel Region 150.9 $412,800 3.50% 151.9 $514,200 3.19% 153.2 $390,900 3.51% 155.7 $322,200 4.85% 138.0 $237,500 2.45% Brampton 144.7 $369,100 3.80% 145.5 $425,200 3.34% 146.5 $345,100 3.68% 141.7 $263,200 7.92% 122.7 $192,000 3.28% Caledon 145.6 $518,800 2.90% 146.5 $537,700 2.38% 155.3 $384,000 5.00% - - - - - - Mississauga 156.0 $436,000 3.45% 160.4 $597,600 3.22% 160.7 $439,200 3.41% 159.9 $343,400 4.03% 140.7 $246,400 2.63% City of Toronto 159.3 $522,100 1.79% 162.7 $705,300 2.13% 170.4 $565,100 3.59% 155.7 $376,500 1.17% 151.6 $313,000 0.53% York Region 163.6 $561,400 3.35% 164.7 $647,000 3.85% 166.7 $482,900 3.54% 153.8 $392,000 4.63% 149.0 $323,700 -0.53% Aurora 155.9 $502,000 5.55% 154.7 $574,700 6.18% 158.9 $411,300 4.88% 142.1 $359,900 5.18% 146.0 $303,400 1.67% E. Gwillimbury 147.6 $477,200 10.07% 148.3 $487,100 10.75% 153.9 $325,800 7.17% - - - - - - Georgina 155.0 $321,700 11.35% 158.9 $327,300 10.58% 156.6 $308,600 11.70% - - - - - - King 154.5 $655,000 1.78% 155.8 $657,400 2.03% - - - - - - - - - Markham 167.7 $577,700 1.82% 171.5 $705,300 2.51% 170.0 $506,300 2.84% 157.9 $392,300 5.34% 151.0 $349,200 -4.73% Newmarket 149.0 $439,400 4.49% 146.6 $493,500 4.64% 154.8 $364,800 4.45% 159.2 $321,400 5.29% 149.8 $252,300 -0.47% Richmond Hill 171.5 $621,000 3.13% 180.0 $762,600 3.87% 177.4 $537,400 3.99% 144.6 $408,900 1.90% 147.0 $306,200 -1.61% Vaughan 162.1 $585,900 3.71% 158.6 $660,000 3.39% 165.8 $504,700 4.08% 157.3 $429,800 5.57% 148.5 $329,500 5.62% Whitchurch-Stouffville 161.4 $608,500 5.08% 161.3 $619,000 5.77% 145.7 $400,200 1.25% - - - - - - Durham Region 138.0 $324,700 5.67% 137.7 $359,100 5.68% 142.6 $285,600 6.10% 127.5 $209,600 4.85% 127.7 $228,500 3.65% Ajax 142.5 $352,100 4.93% 143.6 $384,600 4.51% 149.3 $321,100 5.14% 129.1 $235,900 6.34% 124.2 $210,900 3.67% Brock 127.4 $241,500 3.92% 127.9 $243,100 3.90% 131.8 $210,000 0.08% - - - - - - Clarington 137.0 $289,900 8.64% 134.5 $323,200 9.62% 141.3 $269,800 8.69% 146.3 $261,900 2.16% 126.6 $179,200 2.93% Oshawa 133.0 $254,500 7.09% 132.3 $281,700 7.30% 137.5 $230,300 7.17% 114.1 $152,700 2.61% 131.5 $157,400 -0.75% Pickering 141.8 $383,600 4.19% 143.0 $447,300 3.10% 146.6 $341,700 3.82% 134.7 $243,000 4.50% 129.3 $253,200 7.66% Scugog 137.8 $357,600 5.76% 141.7 $364,900 5.75% 123.0 $257,400 2.16% - - - - - - Uxbridge 134.8 $412,200 5.07% 136.2 $421,900 4.85% 130.5 $320,200 4.23% - - - - - - Whitby 139.1 $362,900 4.43% 139.2 $399,900 5.06% 140.6 $310,200 6.03% 133.8 $245,300 10.21% 128.1 $249,900 -1.00% Dufferin County 146.2 $335,100 2.96% 149.8 $341,300 2.25% 146.8 $275,200 1.45% - - - - - - Orangeville 146.2 $335,100 2.96% 149.8 $341,300 2.25% 146.8 $275,200 1.45% - - - - - - Simcoe County 143.1 $304,100 5.38% 140.1 $309,000 5.34% 146.5 $281,300 4.05% - - - - - - Adjala-Tosorontio 126.5 $398,400 -2.54% 126.5 $398,900 -2.39% - - - - - - - - - Bradford West Gwillimbury 155.0 $385,200 3.96% 139.8 $428,200 4.10% 160.0 $332,600 3.49% - - - - - - Essa 140.2 $317,900 3.62% 136.9 $338,600 2.09% 142.8 $243,300 4.01% - - - - - - Innisfil 145.0 $268,600 6.77% 146.3 $271,600 7.18% 146.0 $227,100 3.69% - - - - - - New Tecumseth 129.9 $300,000 3.84% 127.1 $327,400 3.17% 135.0 $258,200 4.49% - - - - - - Townhouse Apartment ! TURN PAGE FOR CITY OF TORONTO TABLES OR CLICK HERE: Composite Single-Family Detached Single-Family Attached CLICK HERE FOR MORE BACKGROUND INFORMATION ON THE MLS® HPI
- 26. Industrial Leasing July 2010Page 3 Toronto Real Estate Board Market Watch, June 2013 26 FOCUS ON THE MLS® HOME PRICE INDEX INDEX AND BENCHMARK PRICE, JUNE 2013 CITY OF TORONTO Index Benchmark Yr./Yr. % Chg. Index Benchmark Yr./Yr. % Chg. Index Benchmark Yr./Yr. % Chg. Index Benchmark Yr./Yr. % Chg. Index Benchmark Yr./Yr. % Chg. TREB Total 155.8 $475,300 2.91% 156.3 $581,200 3.37% 161.2 $455,400 3.73% 152.7 $334,400 3.39% 148.9 $299,000 0.81% City of Toronto 159.3 $522,100 1.79% 162.7 $705,300 2.13% 170.4 $565,100 3.59% 155.7 $376,500 1.17% 151.6 $313,000 0.53% Toronto W01 165.3 $674,600 1.41% 163.2 $841,200 2.58% 174.4 $672,900 4.24% 215.4 $443,500 2.62% 145.7 $340,000 -0.95% Toronto W02 183.3 $661,200 4.33% 181.5 $745,000 2.72% 205.1 $628,300 4.86% 143.1 $394,600 5.76% 124.2 $516,200 7.63% Toronto W03 162.4 $419,500 5.18% 165.2 $449,300 6.51% 169.1 $433,200 6.82% - - - 121.7 $225,700 -8.70% Toronto W04 143.0 $374,400 4.53% 150.5 $474,900 4.51% 145.0 $422,200 4.69% 143.6 $349,400 3.31% 125.8 $185,300 3.11% Toronto W05 139.2 $331,400 4.19% 148.2 $494,100 4.66% 139.1 $406,800 3.73% 128.0 $210,700 -0.23% 130.7 $171,700 6.96% Toronto W06 150.3 $436,300 1.76% 173.4 $550,400 4.58% 156.9 $475,700 2.75% 160.1 $471,700 3.02% 128.1 $316,900 -1.76% Toronto W07 155.8 $664,000 4.14% 163.3 $705,800 3.03% 158.7 $650,700 3.93% 123.8 $455,100 -2.75% 101.5 $411,600 -3.61% Toronto W08 141.0 $573,600 0.43% 153.4 $802,400 1.25% 163.0 $612,300 4.35% 137.3 $335,600 1.40% 125.5 $252,600 -1.88% Toronto W09 142.0 $364,900 5.65% 158.2 $591,900 3.47% 144.0 $407,600 5.42% 144.9 $367,600 0.21% 117.0 $150,000 10.07% Toronto W10 138.0 $320,300 3.76% 149.0 $438,400 4.27% 148.0 $402,100 4.67% 115.7 $208,400 2.84% 125.4 $191,500 2.53% Toronto C01 179.1 $444,200 -0.78% 193.9 $684,500 2.43% 199.1 $690,800 5.85% 171.3 $514,100 -2.50% 175.8 $365,900 -1.73% Toronto C02 169.9 $806,700 0.12% 158.7 $1,257,900 1.08% 181.3 $954,000 4.68% 176.4 $824,900 -1.95% 163.4 $455,700 -3.26% Toronto C03 173.5 $893,000 6.25% 168.5 $1,015,500 5.31% 180.1 $666,700 8.10% - - - 180.3 $476,300 6.00% Toronto C04 158.4 $981,400 1.73% 162.8 $1,138,100 3.10% 164.4 $786,000 5.25% 150.1 $560,800 -0.27% 138.3 $328,800 -5.98% Toronto C06 167.5 $662,800 3.78% 170.9 $731,500 3.39% 155.0 $570,000 0.52% 137.4 $374,900 1.18% 164.2 $363,100 5.39% Toronto C07 157.6 $541,300 2.14% 175.8 $804,800 2.09% 158.7 $564,000 -0.44% 131.6 $386,300 2.17% 146.9 $346,000 1.31% Toronto C08 165.5 $426,100 -1.08% 160.7 $499,400 -0.37% 166.5 $689,200 2.71% 181.8 $551,300 6.13% 165.1 $364,200 -1.96% Toronto C09 130.5 $969,100 -4.74% 125.6 $1,577,700 -1.41% 144.3 $1,174,200 -0.48% 160.6 $829,000 -5.47% 130.9 $433,700 -8.53% Toronto C10 181.1 $706,400 4.92% 164.5 $1,009,500 2.88% 172.6 $852,500 2.68% 225.3 $516,700 0.85% 184.8 $442,800 6.70% Toronto C11 144.7 $518,500 7.11% 155.2 $1,039,100 0.00% 174.6 $766,100 5.82% 114.8 $183,100 -0.43% 133.4 $189,900 13.15% Toronto C12 152.1 $1,303,500 0.20% 145.1 $1,559,400 -0.41% 169.1 $730,700 5.89% 149.1 $505,100 1.84% 174.8 $549,800 2.28% Toronto C13 152.0 $560,800 3.12% 160.5 $860,000 1.71% 148.9 $477,700 -3.31% 142.6 $406,100 -13.52% 144.6 $286,100 6.64% Toronto C14 166.5 $565,800 0.24% 183.6 $996,100 1.49% 181.4 $884,900 -1.63% 203.1 $686,300 4.21% 157.5 $396,100 -0.51% Toronto C15 155.3 $519,200 0.52% 174.2 $816,600 -0.46% 162.0 $528,700 -0.61% 165.0 $406,500 -1.20% 133.0 $310,800 2.62% Toronto E01 183.7 $570,500 2.06% 177.6 $598,300 -1.44% 187.7 $588,900 4.39% 211.7 $428,100 15.62% 178.3 $422,900 -4.40% Toronto E02 170.8 $635,300 1.73% 161.5 $711,300 -0.62% 178.1 $594,000 2.53% 170.4 $569,600 4.73% 166.7 $441,100 -0.95% Toronto E03 157.9 $486,400 -2.05% 158.4 $532,100 -4.58% 162.7 $529,800 5.51% - - - 130.0 $194,500 -7.60% Toronto E04 155.7 $390,900 2.64% 160.9 $475,100 1.58% 159.0 $385,800 2.78% 157.6 $340,600 1.35% 152.7 $231,300 6.41% Toronto E05 150.7 $403,000 4.44% 165.7 $585,100 4.02% 163.9 $451,700 4.46% 151.2 $328,700 5.22% 133.8 $262,900 4.04% Toronto E06 170.1 $480,700 1.25% 170.9 $488,400 1.18% 176.0 $416,300 3.47% - - - 152.4 $336,000 -0.13% Toronto E07 157.9 $389,300 4.71% 167.7 $548,900 5.54% 162.7 $425,300 2.52% 159.6 $345,100 4.38% 143.4 $245,500 9.05% Toronto E08 150.7 $369,300 2.17% 162.6 $507,600 0.81% 154.2 $394,700 0.85% 151.9 $307,500 2.01% 124.4 $198,600 3.41% Toronto E09 147.4 $355,900 4.39% 156.6 $445,700 3.43% 149.0 $365,700 1.57% 138.7 $255,600 5.56% 138.3 $259,400 5.25% Toronto E10 153.9 $435,700 2.67% 156.0 $499,400 1.50% 156.4 $406,800 0.77% 151.3 $265,000 9.16% 118.3 $190,700 23.23% Toronto E11 141.5 $312,000 1.22% 160.2 $444,900 4.91% 153.2 $347,600 5.15% 113.2 $222,400 -2.25% 110.9 $165,500 -9.02% ApartmentComposite Single-Family Detached Single-Family Attached Townhouse CLICK HERE FOR MORE BACKGROUND INFORMATION ON THE MLS® HPI
- 27. July 2010Page 3 Toronto Real Estate Board Market Watch, June 2013 27 YEAR SALES AVERAGE PRICE 2002 74,759 $275,231 2003 78,898 $293,067 2004 83,501 $315,231 2005 84,145 $335,907 2006 83,084 $351,941 2007 93,193 $376,236 2008 74,552 $379,347 2009 87,308 $395,460 2010 85,545 $431,276 2011 89,096 $465,014 2012 85,503 $497,143 January 4,431 $462,701 February 6,809 $500,249 March 9,384 $500,895 April 10,021 $515,888 May 10,544 $514,567 June 9,129 $507,342 July 7,338 $475,523 August 6,250 $477,174 September 5,687 $501,326 October 6,713 $502,127 November 5,615 $484,186 December 3,582 $477,756 Annual 85,503 $497,143 January 4,229 $482,080 February 5,616 $509,641 March 7,548 $517,477 April 9,565 $525,574 May 10,039 $541,026 June 9,061 $531,374 July - - August - - September - - October - - November - - December - - Year-to-Date 46,058 $522,820 HISTORIC ANNUAL STATISTICS1,6,7 2013 MONTHLY STATISTICS1,7 2012 MONTHLY STATISTICS1,7 *For historic annual sales and average price data over a longer time frame go to: http://www.torontorealestateboard.com/market_news/market_watch/histori c_stats/pdf/TREB_historic_statistics.pdf NOTES 8 SNLR = Sales-to-New Listings Ratio. Calculated using a 12-month moving average (sales/new listings). 9 Mos. Inv. = Months of Inventory. Calculated using a 12-month moving average (active listings/sales). 7 Past monthly and year-to-date figures are revised on a monthly basis. 1 Sales, dollar volume, average sale prices and median sale prices are based on firm transactions entered into the TorontoMLS® system between the first and last day of the month/period being reported. 2 New listings entered into the TorontoMLS® system between the first and last day of the month/period being reported. 3 Active listings at the end of the last day of the month/period being reported. 4 Ratio of the average selling price to the average listing price for firm transactions entered into the TorontoMLS® system between the first and last day of the month/period being reported. 5 Average number of days on the market for firm transactions entered into the TorontoMLS® system between the first and last day of the month/period being reported. 6 Due to past changes to TREB's service area, caution should be exercised when making historical comparisons.