Toronto Real Estate Market Watch July 2010
•
1 like•417 views

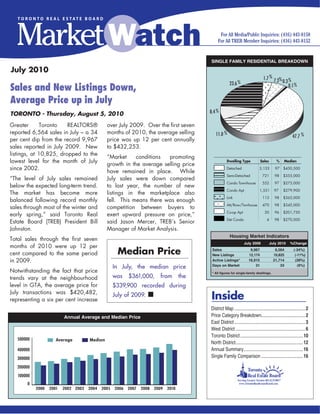
Sales of single family homes were down 34% in July 2010 compared to July 2009. The average selling price increased 6% to $420,482. While sales decreased from the record levels of late 2009 and early 2010, the market has become more balanced as new listings also fell. The median price in July 2010 was $361,000, up from $339,900 in July 2009.

Recommended
More Related Content
What's hot
Viewers also liked
Similar to Toronto Real Estate Market Watch July 2010
Similar to Toronto Real Estate Market Watch July 2010 (20)
More from Richard Silver, Certified International REALTOR®
More from Richard Silver, Certified International REALTOR® (20)
Recently uploaded
Recently uploaded (20)
Toronto Real Estate Market Watch July 2010
- 1. SINGLE FAMILY RESIDENTIAL BREAKDOWN July 2010 1.7 % 7.2% % 23.6 % 0.3 Sales and New Listings Down, 0.1 % Average Price up in July TORONTO - Thursday, August 5, 2010 8.4 % Greater Toronto REALTORS® over July 2009. Over the first seven reported 6,564 sales in July – a 34 months of 2010, the average selling 11.0 % 47.7 % per cent dip from the record 9,967 price was up 12 per cent annually sales reported in July 2009. New to $432,253. listings, at 10,825, dropped to the “Market conditions promoting lowest level for the month of July 2.3 % 7.0 % Dwelling Type Sales % Median growth in21.5 % average selling0.3 % the price since 2002. 0.1 % Single Detached 3,133 Detached 97 $450,500 have remained in place. While Semi Detached Semi-Detached 721 98 $355,000 “The level of July sales remained July sales were down compared Condo T.H. Condo Townhouse 552 97 $275,000 below the expected long-term trend. to last year, the number of new Condo Apt. Condo Apt 1,551 97 $279,900 The market has become more listings in the marketplace also 8.5 % Link Link 113 98 $365,000 balanced following record monthly fell. This means there was enough Attached/Row Att/Row/Twnhouse 470 98 $345,000 sales through most of the winter and competition between buyers to Co-op Apt. Co-op Apt 20 96 $201,750 early spring,” said Toronto Real exert 12.0 % upward pressure on price,” % 48.3 Detached Condo Det Condo 4 98 $270,000 Estate Board (TREB) President Bill said Jason Mercer, TREB’s Senior Johnston. Manager of Market Analysis. Housing Market Indicators Total sales through the first seven July 2009 July 2010 %Change months of 2010 were up 12 per cent compared to the same period Median Price Sales New Listings 9,967 12,174 6,564 10,825 (-34%) (-11%) in 2009. Active Listings* 16,915 21,714 (28%) In July, the median price Days on Market 31 33 (6%) Notwithstanding the fact that price * All figures for single-family dwellings. trends vary at the neighbourhood was $361,000, from the level in GTA, the average price for $339,900 recorded during July transactions was $420,482, representing a six per cent increase July of 2009. n Inside District Map ............................................................. 2 Annual Average and Median Price Price Category Breakdown......................................2 East District ............................................................. 3 West District ............................................................ 6 Toronto District ......................................................10 500000 Average Median North District..........................................................12 400000 Annual Summary ...................................................16 300000 Single Family Comparison ....................................16 200000 100000 0 2000 2001 2002 2003 2004 2005 2006 2007 2008 2009 2010
- 2. District Map Price Category Breakdown - July 2010 Price Range Total S.F.D %S.F.D Condo Apt. %Condo Apt. Condo T.H. %Condo T.H. - - $90,000 27 0.4 16 1.0 6 1.1 $90,001 - $100,000 12 0.2 9 0.6 2 0.4 $100,001 - $110,000 13 0.2 5 0.3 4 0.7 $110,001 - $120,000 14 0.2 6 0.4 3 0.5 $120,001 - $130,000 25 0.4 20 1.3 4 0.7 $130,001 - $140,000 39 0.6 21 1.4 9 1.6 $140,001 - $150,000 41 0.6 21 1.4 10 1.8 $150,001 - $160,000 47 0.7 26 1.7 11 2.0 $160,001 - $170,000 69 1.1 36 2.3 20 3.6 $170,001 - $180,000 79 1.2 44 2.8 12 2.2 $180,001 - $190,000 83 1.3 49 3.2 11 2.0 $190,001 - $200,000 91 1.4 49 3.2 13 2.4 $200,001 - $225,000 251 3.8 112 7.2 50 9.1 $225,001 - $250,000 368 5.6 159 10.3 63 11.4 $250,001 - $300,000 904 13.8 334 21.5 124 22.5 $300,001 - $400,000 1,887 28.7 414 26.7 150 27.2 $400,001 - $500,000 1,120 17.1 130 8.4 31 5.6 $500,001 - $750,000 1,051 16.0 69 4.4 25 4.5 $750,001 - $1,000,000 252 3.8 15 1.0 3 0.5 $1,000,001 - $1,500,000 135 2.1 12 0.8 1 0.2 $1,500,001 - - 56 0.9 4 0.3 - - Total: 6,564 100 1,551 100 552 100 2 TORONTO REAL ESTATE BOARD
- 3. East District Current Month: July 2010 Area Active New Sales $ Volume Avg Price Med Price Avg DOM Avg %List E01 135 102 76 $33,658,516 $442,875 $426,000 21 99 E02 120 72 49 $31,720,500 $647,357 $538,500 26 98 E03 235 136 89 $33,842,898 $380,257 $377,000 24 98 E04 227 116 66 $19,711,500 $298,659 $328,000 31 98 E05 242 143 93 $34,033,100 $365,947 $330,000 26 97 E06 107 68 42 $16,876,400 $401,819 $362,500 30 98 E07 217 104 65 $21,906,138 $337,018 $346,000 31 97 E08 235 116 84 $28,604,250 $340,527 $327,000 31 97 E09 339 164 97 $25,353,006 $261,371 $253,000 37 97 E10 104 61 44 $18,089,600 $411,127 $394,950 32 98 E11 283 128 76 $22,834,300 $300,451 $298,500 36 97 E12 61 28 17 $5,320,250 $312,956 $305,000 28 97 E13 239 121 82 $29,875,850 $364,340 $337,000 33 97 E14 338 222 133 $44,321,288 $333,243 $318,000 29 97 E15 320 190 119 $36,943,850 $310,453 $292,900 30 98 E16 680 339 183 $40,662,098 $222,197 $211,000 39 97 E17 274 144 91 $23,474,705 $257,964 $245,000 35 97 E18 27 8 2 $706,000 $353,000 $353,000 22 97 E19 95 40 27 $10,129,400 $375,163 $349,000 41 97 E20 127 51 27 $9,012,400 $333,793 $300,000 54 97 E21 170 54 26 $8,476,500 $326,019 $310,250 54 97 TOTAL 4,575 2,407 1,488 $495,552,549 $333,033 $306,750 32 97 Year-to-Date: July 2010 Area Listed Sales $ Volume Avg Price Med Price Avg DOM Avg %List E01 1,071 583 $283,032,922 $485,477 $457,000 15 103 E02 953 552 $338,405,817 $613,054 $548,000 14 102 E03 1,513 817 $339,913,201 $416,050 $409,800 18 101 E04 1,154 575 $170,285,516 $296,149 $315,000 24 99 E05 1,231 680 $233,341,411 $343,149 $310,125 21 100 E06 695 363 $148,804,174 $409,929 $360,000 19 101 E07 1,094 589 $199,184,642 $338,174 $345,000 22 99 E08 1,090 562 $179,145,585 $318,764 $327,000 24 98 E09 1,563 862 $235,918,999 $273,688 $264,500 25 98 E10 632 370 $149,078,473 $402,915 $385,000 21 99 E11 1,295 684 $206,095,975 $301,310 $298,950 26 98 E12 298 153 $50,180,883 $327,980 $296,000 24 98 E13 1,249 679 $237,773,673 $350,182 $331,000 23 99 E14 2,075 1,205 $400,411,965 $332,292 $317,000 22 98 E15 1,890 1,061 $335,119,074 $315,852 $302,500 21 99 E16 2,960 1,533 $354,072,315 $230,967 $223,000 30 97 E17 1,374 800 $207,689,918 $259,612 $246,500 29 98 E18 82 32 $18,134,900 $566,716 $432,450 47 96 E19 482 269 $103,271,819 $383,910 $350,000 29 98 E20 403 185 $56,643,050 $306,179 $282,000 50 97 E21 512 242 $81,923,434 $338,527 $309,500 46 96 TOTAL 23,616 12,796 $4,328,427,746 $338,264 $312,700 24 99 TORONTO REAL ESTATE BOARD 3
- 4. SINGLE FAMILY EAST BREAKDOWN - JuLY 2010 East District East District East District 80 Days on Market 80 Sales Active Listing Ratio 60 60 40 40 20 20 0 0 Jul Aug Sep Oct Nov Dec Jan Feb Mar Apr May Jun Jul Jul Aug Sep Oct Nov Dec Jan Fab Mar Apr May Jun Jul 2009 2010 2009 2010 Detached Houses Semi-Detached Houses Area Act Sales Av. Price Med. Price % S-A Av. % List Area Act Sales Av. Price Med. Price % S-A Av. % List E01 26 12 $522,310 $491,000 46.2 97 E01 42 35 $479,511 $480,000 83.3 99 E02 43 21 $836,886 $760,000 48.8 97 E02 50 15 $539,000 $520,000 30.0 98 E03 103 41 $475,090 $439,000 39.8 99 E03 45 14 $424,321 $425,000 31.1 99 E04 86 33 $365,821 $362,000 38.4 98 E04 10 6 $283,250 $278,000 60.0 103 E05 72 32 $543,722 $523,000 44.4 98 E05 11 5 $373,900 $362,000 45.5 96 E06 78 33 $423,921 $365,000 42.3 98 E06 21 1 $313,000 $313,000 4.8 98 E07 76 25 $454,348 $438,000 32.9 97 E07 11 4 $349,975 $338,500 36.4 99 E08 118 49 $432,003 $370,000 41.5 97 E08 5 2 $271,500 $271,500 40.0 98 E09 91 32 $343,994 $344,500 35.2 98 E09 4 5 $266,560 $279,300 125.0 95 E10 75 33 $446,745 $469,900 44.0 98 E10 7 1 $270,000 $270,000 14.3 96 E11 90 31 $398,550 $410,000 34.4 97 E11 29 12 $312,404 $289,500 41.4 96 E12 37 10 $366,600 $342,500 27.0 97 E12 1 2 $263,500 $263,500 200.0 99 E13 147 53 $428,378 $425,000 36.1 97 E13 12 1 $277,000 $277,000 8.3 96 E14 230 95 $362,091 $363,000 41.3 96 E14 19 10 $299,140 $303,950 52.6 98 E15 227 83 $346,532 $326,000 36.6 97 E15 11 4 $230,875 $231,500 36.4 97 E16 508 126 $246,301 $237,500 24.8 98 E16 56 27 $178,370 $177,100 48.2 97 E17 202 63 $281,941 $264,000 31.2 97 E17 8 2 $209,000 $209,000 25.0 97 E18 27 2 $353,000 $353,000 7.4 97 E18 - - - - - - E19 91 23 $395,648 $353,000 25.3 97 E19 - - - - - - E20 106 25 $347,876 $315,000 23.6 97 E20 - - - - - - E21 169 26 $326,019 $310,250 15.4 97 E21 1 - - - - - 4 TORONTO REAL ESTATE BOARD
- 5. SINGLE FAMILY EAST BREAKDOWN - JuLY 2010 East District Condo Apartment Link Area Act Sales Av. Price Med. Price % S-A Av. % List Area Act Sales Av. Price Med. Price % S-A Av. % List E01 33 14 $316,500 $296,500 42.4 99 E01 - - - - - - E02 8 6 $440,417 $355,500 75.0 97 E02 - - - - - - E03 73 23 $190,435 $168,000 31.5 97 E03 - - - - - - E04 95 20 $180,545 $183,500 21.1 97 E04 - - - - - - E05 111 28 $224,396 $232,500 25.2 97 E05 6 6 $394,817 $399,000 100.0 99 E06 5 2 $285,500 $285,500 40.0 97 E06 - - - - - - E07 94 22 $202,466 $205,500 23.4 97 E07 13 7 $369,857 $363,900 53.9 97 E08 87 20 $186,550 $175,000 23.0 97 E08 - - - - - - E09 203 48 $232,047 $235,500 23.7 97 E09 - - - - - - E10 4 - - - - - E10 - 1 $335,000 $335,000 - 99 E11 96 17 $163,024 $163,000 17.7 97 E11 7 3 $322,333 $312,000 42.9 99 E12 2 2 $184,500 $184,500 100.0 97 E12 1 1 $340,000 $340,000 100.0 99 E13 15 4 $250,750 $275,250 26.7 97 E13 3 3 $260,667 $257,000 100.0 97 E14 14 4 $180,250 $174,500 28.6 95 E14 3 2 $231,500 $231,500 66.7 98 E15 30 4 $249,250 $216,250 13.3 98 E15 10 2 $271,000 $271,000 20.0 101 E16 20 2 $195,000 $195,000 10.0 97 E16 2 6 $214,167 $216,000 300.0 94 E17 11 2 $158,750 $158,750 18.2 98 E17 21 11 $211,491 $207,900 52.4 97 E18 - - - - - - E18 - - - - - - E19 - - - - - - E19 2 3 $263,667 $263,000 150.0 97 E20 10 2 $157,750 $157,750 20.0 97 E20 4 - - - - - E21 - - - - - - E21 - - - - - - Condo Townhouse Detached Condo Area Act Sales Av. Price Med. Price % S-A Av. % List Area Act Sales Av. Price Med. Price % S-A Av. % List E01 21 5 $321,400 $325,000 23.8 98 E01 - - - - - - E02 6 3 $517,633 $429,900 50.0 100 E02 - - - - - - E03 3 3 $279,000 $266,000 100.0 102 E03 - - - - - - E04 28 5 $346,400 $360,000 17.9 98 E04 - - - - - - E05 39 19 $268,184 $255,000 48.7 97 E05 - - - - - - E06 1 3 $263,333 $257,000 300.0 99 E06 - - - - - - E07 16 5 $285,760 $284,800 31.3 98 E07 - - - - - - E08 19 12 $236,467 $235,000 63.2 98 E08 - - - - - - E09 35 12 $156,179 $137,000 34.3 96 E09 - - - - - - E10 10 4 $230,750 $238,250 40.0 96 E10 - - - - - - E11 40 7 $202,957 $192,000 17.5 98 E11 1 - - - - - E12 11 2 $209,125 $209,125 18.2 97 E12 - - - - - - E13 37 17 $241,429 $240,000 46.0 98 E13 - - - - - - E14 32 5 $229,560 $235,000 15.6 98 E14 1 - - - - - E15 13 10 $178,730 $171,000 76.9 98 E15 - - - - - - E16 77 18 $134,983 $137,750 23.4 97 E16 - - - - - - E17 16 4 $195,250 $187,000 25.0 96 E17 - - - - - - E18 - - - - - - E18 - - - - - - E19 - - - - - - E19 - - - - - - E20 7 - - - - - E20 - - - - - - E21 - - - - - - E21 - - - - - - TORONTO REAL ESTATE BOARD 5
- 6. SINGLE FAMILY EAST BREAKDOWN - JuLY 2010 East District Co-op Apartment Attached/Row/Townhouse Area Act Sales Av. Price Med. Price % S-A Av. % List Area Act Sales Av. Price Med. Price % S-A Av. % List E01 - - - - - - E01 13 10 $456,990 $444,950 76.9 99 E02 2 1 $442,000 $442,000 50.0 98 E02 11 3 $474,500 $491,000 27.3 97 E03 3 - - - - - E03 8 8 $400,839 $368,000 100.0 99 E04 2 - - - - - E04 6 2 $298,500 $298,500 33.3 98 E05 - - - - - - E05 3 3 $339,000 $339,000 100.0 98 E06 - - - - - - E06 2 3 $404,333 $400,000 150.0 96 E07 - - - - - - E07 7 2 $337,750 $337,750 28.6 96 E08 - - - - - - E08 6 1 $324,500 $324,500 16.7 98 E09 - - - - - - E09 6 - - - - - E10 - - - - - - E10 8 5 $363,800 $364,000 62.5 98 E11 - - - - - - E11 20 6 $261,883 $237,750 30.0 97 E12 - - - - - - E12 9 - - - - - E13 - - - - - - E13 25 4 $251,375 $249,500 16.0 97 E14 - - - - - - E14 39 17 $270,553 $268,500 43.6 98 E15 - - - - - - E15 29 16 $245,744 $241,000 55.2 98 E16 - - - - - - E16 17 4 $176,875 $206,500 23.5 91 E17 - - - - - - E17 16 9 $207,722 $203,000 56.3 99 E18 - - - - - - E18 - - - - - - E19 - - - - - - E19 2 1 $238,500 $238,500 50.0 98 E20 - - - - - - E20 - - - - - - E21 - - - - - - E21 - - - - - - West District Current Month: July 2010 Area Active New Sales $ Volume Avg Price Med Price Avg DOM Avg %List W01 91 62 58 $28,675,100 $494,398 $470,000 20 100 W02 125 87 75 $36,452,488 $486,033 $425,000 23 99 W03 241 115 40 $12,212,250 $305,306 $308,250 33 96 W04 252 87 46 $14,278,800 $310,409 $315,000 40 96 W05 476 169 86 $27,331,600 $317,809 $322,500 45 96 W06 330 122 78 $33,403,140 $428,245 $412,500 32 98 W07 129 70 54 $28,674,216 $531,004 $450,000 29 98 W08 246 110 87 $52,050,118 $598,277 $513,500 34 98 W09 155 66 37 $12,595,450 $340,418 $347,000 42 96 W10 304 136 60 $14,545,050 $242,418 $249,950 41 96 W12 244 111 70 $44,225,900 $631,799 $533,500 34 97 W13 248 130 70 $34,767,700 $496,681 $361,250 29 98 W14 142 73 32 $11,898,500 $371,828 $350,000 26 98 W15 500 257 152 $39,341,162 $258,823 $235,500 35 97 W16 164 102 65 $29,406,144 $452,402 $370,000 33 98 W17 1 1 1 $251,000 $251,000 $251,000 16 100 W18 135 53 37 $10,864,800 $293,643 $302,000 35 97 W19 465 323 198 $74,425,837 $375,888 $360,500 29 98 W20 449 309 238 $94,337,651 $396,377 $385,000 26 98 W21 510 199 129 $70,611,489 $547,376 $471,175 36 97 W22 200 148 101 $41,494,500 $410,837 $381,000 25 98 W23 995 592 331 $116,548,306 $352,110 $332,000 29 97 W24 716 434 259 $93,359,951 $360,463 $349,800 27 98 W25 166 85 52 $19,419,400 $373,450 $341,250 27 98 W26 40 5 2 $910,000 $455,000 $455,000 97 98 W27 215 94 80 $33,929,100 $424,114 $385,000 38 97 W28 268 109 66 $37,666,800 $570,709 $465,000 52 97 W29 165 86 51 $15,655,299 $306,967 $276,000 43 98 TOTAL 7,972 4,135 2,555 $1,029,331,751 $402,870 $355,000 32 98 6 TORONTO REAL ESTATE BOARD
- 7. SINGLE FAMILY WEST BREAKDOWN - JuLY 2010 West District West District West District 80 Days on Market 80 Sales Active Listing Ratio 60 60 40 40 20 20 0 0 Jul Aug Sep Oct Nov Dec Jan Feb Mar Apr May Jun Jul Jul Aug Sep Oct Nov Dec Jan Feb Mar Apr May Jun Jul 2009 2010 2009 2010 Year-to-Date: July 2010 Area Listed Sales $ Volume Avg Price Med Price Avg DOM Avg %List W01 691 430 $226,818,399 $527,485 $471,950 17 103 W02 918 559 $285,646,054 $510,995 $453,000 16 103 W03 1,008 454 $150,329,487 $331,122 $325,500 24 99 W04 1,019 489 $156,182,437 $319,391 $319,000 31 98 W05 1,651 718 $227,483,209 $316,829 $330,000 31 97 W06 1,458 785 $321,201,630 $409,174 $388,000 25 99 W07 790 483 $243,411,211 $503,957 $478,000 19 100 W08 1,356 823 $483,692,214 $587,718 $491,000 23 99 W09 627 312 $119,733,876 $383,762 $399,000 30 98 W10 1,272 590 $155,111,369 $262,901 $259,000 31 98 W12 1,160 617 $332,981,241 $539,678 $436,000 27 98 W13 1,095 547 $324,071,278 $592,452 $445,900 26 98 W14 688 378 $139,565,505 $369,221 $361,000 23 98 W15 2,466 1,386 $369,782,851 $266,799 $244,750 25 98 W16 986 598 $260,688,722 $435,934 $388,000 20 99 W17 4 1 $251,000 $251,000 $251,000 16 100 W18 532 270 $77,038,801 $285,329 $295,850 29 97 W19 2,710 1,503 $600,244,764 $399,364 $387,500 20 99 W20 3,060 1,800 $733,468,255 $407,482 $384,000 18 99 W21 2,226 1,182 $685,844,665 $580,241 $500,000 27 98 W22 1,398 865 $348,116,427 $402,447 $370,000 17 99 W23 5,528 2,959 $1,023,893,056 $346,027 $333,000 21 98 W24 4,070 2,227 $803,481,082 $360,791 $345,000 22 98 W25 635 357 $140,242,801 $392,837 $355,000 27 98 W26 79 36 $23,353,500 $648,708 $577,500 59 96 W27 947 603 $250,414,465 $415,281 $382,000 27 98 W28 941 508 $255,079,706 $502,125 $452,500 34 98 W29 620 387 $121,396,650 $313,686 $286,900 34 98 TOTAL 39,935 21,867 $8,859,524,655 $405,155 $359,500 23 99 TORONTO REAL ESTATE BOARD 7
- 8. SINGLE FAMILY WEST BREAKDOWN - JuLY 2010 West District Detached Houses Semi-Detached Houses Area Act Sales Av. Price Med. Price % S-A Av. % List Area Act Sales Av. Price Med. Price % S-A Av. % List W01 26 13 $752,154 $700,000 50.0 102 W01 17 13 $549,438 $555,900 76.5 100 W02 42 30 $620,416 $635,000 71.4 99 W02 42 27 $398,352 $399,000 64.3 100 W03 146 19 $326,145 $325,000 13.0 95 W03 61 11 $352,368 $322,500 18.0 98 W04 127 28 $387,264 $362,950 22.1 96 W04 13 3 $359,000 $352,000 23.1 99 W05 102 23 $470,739 $448,000 22.6 97 W05 109 28 $363,714 $342,000 25.7 97 W06 91 33 $424,530 $415,000 36.3 99 W06 9 4 $410,425 $395,350 44.4 98 W07 51 26 $721,971 $635,000 51.0 98 W07 1 - - - - - W08 147 46 $846,509 $694,000 31.3 98 W08 - 3 $439,667 $425,000 - 98 W09 60 17 $483,750 $448,000 28.3 98 W09 2 1 $347,000 $347,000 50.0 96 W10 94 22 $353,568 $336,500 23.4 97 W10 6 2 $307,700 $307,700 33.3 98 W12 160 53 $711,140 $575,000 33.1 97 W12 12 4 $387,375 $381,000 33.3 97 W13 184 34 $723,676 $669,750 18.5 98 W13 13 14 $321,986 $318,250 107.7 99 W14 27 12 $547,533 $552,000 44.4 99 W14 16 2 $413,900 $413,900 12.5 99 W15 28 6 $488,833 $498,000 21.4 98 W15 20 2 $404,500 $404,500 10.0 98 W16 79 34 $591,817 $472,500 43.0 97 W16 36 7 $336,429 $345,000 19.4 97 W17 - - - - - - W17 - - - - - - W18 49 12 $331,842 $338,750 24.5 96 W18 43 20 $287,910 $293,500 46.5 97 W19 192 67 $521,328 $518,000 34.9 98 W19 58 31 $386,293 $388,000 53.5 98 W20 186 92 $516,740 $493,150 49.5 98 W20 82 48 $378,958 $382,550 58.5 98 W21 365 78 $667,860 $615,250 21.4 97 W21 11 4 $368,725 $341,000 36.4 98 W22 108 53 $490,487 $460,000 49.1 98 W22 35 15 $350,587 $349,000 42.9 98 W23 645 201 $398,442 $375,000 31.2 97 W23 189 63 $308,510 $313,000 33.3 97 W24 447 141 $434,119 $422,000 31.5 98 W24 92 57 $318,412 $318,500 62.0 98 W25 108 20 $498,700 $496,000 18.5 97 W25 5 8 $356,738 $366,000 160.0 98 W26 39 2 $455,000 $455,000 5.1 98 W26 - - - - - - W27 183 68 $447,603 $431,500 37.2 97 W27 10 1 $300,000 $300,000 10.0 97 W28 249 57 $609,988 $510,000 22.9 96 W28 6 6 $327,917 $331,500 100.0 99 W29 122 36 $340,356 $301,500 29.5 98 W29 12 4 $229,375 $228,750 33.3 98 Condo Apartment Link Area Act Sales Av. Price Med. Price % S-A Av. % List Area Act Sales Av. Price Med. Price % S-A Av. % List W01 35 25 $348,216 $317,000 71.4 98 W01 - - - - - - W02 23 7 $364,229 $324,000 30.4 99 W02 - - - - - - W03 24 8 $200,869 $195,000 33.3 97 W03 - - - - - - W04 74 13 $146,569 $145,500 17.6 96 W04 - - - - - - W05 154 19 $149,763 $151,000 12.3 95 W05 - - - - - - W06 202 28 $410,748 $389,495 13.9 97 W06 - - - - - - W07 65 22 $316,499 $290,500 33.9 98 W07 - - - - - - W08 90 31 $312,410 $250,500 34.4 97 W08 - 1 $487,000 $487,000 - 98 W09 84 16 $195,919 $229,250 19.1 94 W09 - - - - - - W10 153 24 $168,725 $154,000 15.7 96 W10 2 1 $312,000 $312,000 50.0 98 W12 44 8 $326,938 $239,250 18.2 97 W12 - - - - - - W13 15 3 $181,333 $141,000 20.0 96 W13 - - - - - - W14 53 10 $226,880 $206,950 18.9 97 W14 - - - - - - W15 402 124 $240,238 $230,000 30.9 97 W15 2 - - - - - W16 20 3 $242,500 $244,500 15.0 98 W16 4 1 $370,000 $370,000 25.0 97 W17 1 1 $251,000 $251,000 100.0 100 W17 - - - - - - W18 24 2 $165,250 $165,250 8.3 96 W18 - - - - - - W19 112 48 $226,179 $209,500 42.9 98 W19 2 - - - - - W20 56 23 $200,770 $195,000 41.1 97 W20 4 5 $407,900 $411,000 125.0 98 W21 64 13 $309,568 $256,000 20.3 97 W21 7 3 $396,967 $415,000 42.9 99 W22 4 - - - - - W22 4 - - - - - W23 42 6 $206,833 $203,500 14.3 97 W23 7 4 $307,125 $309,251 57.1 100 W24 64 21 $173,276 $166,000 32.8 98 W24 3 1 $365,000 $365,000 33.3 96 W25 21 5 $216,100 $207,000 23.8 98 W25 1 1 $380,000 $380,000 100.0 99 W26 - - - - - - W26 - - - - - - W27 8 1 $249,900 $249,900 12.5 100 W27 1 - - - - - W28 4 1 $305,000 $305,000 25.0 96 W28 1 - - - - - W29 16 4 $207,625 $189,750 25.0 98 W29 - - - - - - 8 TORONTO REAL ESTATE BOARD
- 9. SINGLE FAMILY WEST BREAKDOWN - JuLY 2010 West District Condo Townhouse Detached Condo Area Act Sales Av. Price Med. Price % S-A Av. % List Area Act Sales Av. Price Med. Price % S-A Av. % List W01 9 3 $388,333 $470,000 33.3 97 W01 - - - - - - W02 12 1 $352,500 $352,500 8.3 98 W02 - - - - - - W03 5 - - - - - W03 - - - - - - W04 31 2 $226,500 $226,500 6.5 97 W04 - - - - - - W05 92 16 $217,194 $217,500 17.4 95 W05 - - - - - - W06 13 5 $406,500 $395,000 38.5 98 W06 - - - - - - W07 1 1 $242,000 $242,000 100.0 95 W07 - - - - - - W08 6 4 $318,500 $313,750 66.7 97 W08 - - - - - - W09 2 1 $405,000 $405,000 50.0 95 W09 - - - - - - W10 46 9 $151,417 $186,750 19.6 94 W10 - - - - - - W12 24 5 $474,100 $395,000 20.8 98 W12 2 - - - - - W13 33 15 $232,193 $240,000 45.5 97 W13 1 1 $685,000 $685,000 100.0 98 W14 38 7 $267,071 $317,000 18.4 98 W14 - - - - - - W15 47 19 $296,063 $267,000 40.4 98 W15 - - - - - - W16 23 20 $291,593 $291,000 87.0 98 W16 - - - - - - W17 - - - - - - W17 - - - - - - W18 18 2 $236,000 $236,000 11.1 96 W18 - - - - - - W19 74 35 $299,916 $317,000 47.3 98 W19 - - - - - - W20 82 51 $290,130 $285,000 62.2 98 W20 2 1 $261,000 $261,000 50.0 99 W21 23 14 $347,450 $330,500 60.9 98 W21 - - - - - - W22 2 3 $232,167 $235,000 150.0 99 W22 - - - - - - W23 62 26 $219,612 $216,250 41.9 97 W23 - - - - - - W24 54 14 $190,814 $190,750 25.9 98 W24 4 1 $277,000 $277,000 25.0 99 W25 21 9 $249,889 $239,000 42.9 98 W25 - - - - - - W26 - - - - - - W26 1 - - - - - W27 5 4 $222,450 $219,950 80.0 98 W27 - - - - - - W28 1 1 $295,000 $295,000 100.0 92 W28 - - - - - - W29 9 1 $160,000 $160,000 11.1 98 W29 - - - - - - Co-op Apartment Attached/Row/Townhouse Area Act Sales Av. Price Med. Price % S-A Av. % List Area Act Sales Av. Price Med. Price % S-A Av. % List W01 - - - - - - W01 4 4 $471,000 $477,500 100.0 107 W02 2 - - - - - W02 4 10 $418,240 $382,500 250.0 100 W03 - - - - - - W03 5 2 $266,250 $266,250 40.0 98 W04 - - - - - - W04 7 - - - - - W05 9 - - - - - W05 10 - - - - - W06 4 2 $110,000 $110,000 50.0 96 W06 11 6 $666,417 $542,000 54.6 97 W07 4 1 $152,000 $152,000 25.0 101 W07 7 4 $636,500 $628,000 57.1 99 W08 - 2 $173,000 $173,000 - 95 W08 3 - - - - - W09 5 1 $115,000 $115,000 20.0 92 W09 2 1 $370,000 $370,000 50.0 99 W10 1 1 $40,000 $40,000 100.0 80 W10 2 1 $387,000 $387,000 50.0 99 W12 - - - - - - W12 2 - - - - - W13 - - - - - - W13 2 3 $314,333 $335,000 150.0 99 W14 1 - - - - - W14 7 1 $362,000 $362,000 14.3 99 W15 - 1 $184,500 $184,500 - 94 W15 1 - - - - - W16 - - - - - - W16 2 - - - - - W17 - - - - - - W17 - - - - - - W18 - - - - - - W18 1 1 $322,000 $322,000 100.0 98 W19 1 - - - - - W19 26 17 $362,829 $357,000 65.4 98 W20 - - - - - - W20 37 18 $382,928 $377,250 48.7 98 W21 - - - - - - W21 40 17 $409,641 $360,000 42.5 98 W22 - - - - - - W22 47 30 $318,113 $319,500 63.8 99 W23 - - - - - - W2 3 50 31 $285,355 $281,000 62.0 98 W24 1 - - - - - W24 51 24 $293,646 $297,000 47.1 98 W25 1 - - - - - W25 9 9 $320,222 $317,500 100.0 98 W26 - - - - - - W26 - - - - - - W27 - - - - - - W27 8 6 $342,067 $332,950 75.0 99 W28 - - - - - - W28 7 1 $330,000 $330,000 14.3 100 W29 - - - - - - W29 6 6 $249,083 $256,000 100.0 98 TORONTO REAL ESTATE BOARD 9
- 10. Central District Current Month: July 2010 Area Active New Sales $ Volume Avg Price Med Price Avg DOM Avg%List C01 1,104 602 311 $125,339,939 $403,022 $355,000 32 98 C02 265 103 52 $39,437,000 $758,404 $550,000 29 98 C03 146 64 53 $33,872,650 $639,107 $443,000 30 97 C04 186 100 72 $51,909,375 $720,964 $645,000 30 97 C06 96 48 21 $11,310,500 $538,595 $565,000 42 97 C07 318 148 85 $34,503,115 $405,919 $362,888 33 97 C08 412 212 141 $53,682,570 $380,727 $335,000 28 98 C09 76 30 31 $25,220,200 $813,555 $685,000 38 96 C10 176 94 56 $39,218,822 $700,336 $580,000 28 98 C11 71 45 21 $15,019,781 $715,228 $680,000 32 98 C12 166 49 30 $40,055,100 $1,335,170 $1,105,050 33 97 C13 159 85 57 $24,827,013 $435,562 $360,000 40 97 C14 473 272 151 $63,299,033 $419,199 $345,000 33 97 C15 318 159 99 $43,049,684 $434,845 $380,000 28 98 TOTAL 3,966 2,011 1,180 $600,744,782 $509,106 $385,000 32 98 Central District Central District 80 Days on Market 80 Sales Active Listing Ratio 60 60 40 40 20 20 0 0 Jul Aug Sep Oct Nov Dec Jan Feb Mar Apr May Jun Jul Jul Aug Sep Oct Nov Dec Jan Feb Mar Apr May Jun Jul 2009 2010 2009 2010 Year-to-Date: July 2010 Area Listed Sales $ Volume Avg Price Med Price Avg DOM Avg%List C01 5,415 2,677 $1,105,304,624 $412,889 $364,000 21 100 C02 1,151 559 $428,421,383 $766,407 $575,000 22 100 C03 754 383 $322,150,377 $841,124 $579,000 23 100 C04 1,351 769 $636,783,825 $828,067 $750,000 20 100 C06 433 195 $108,135,997 $554,544 $523,000 24 99 C07 1,616 827 $364,124,603 $440,296 $375,000 22 99 C08 2,194 1,152 $451,336,625 $391,785 $349,000 20 100 C09 420 229 $273,662,458 $1,195,033 $871,250 24 99 C10 1,064 611 $443,458,304 $725,791 $590,600 18 101 C11 402 240 $131,410,252 $547,543 $518,900 21 100 C12 636 288 $413,725,408 $1,436,547 $1,180,000 27 98 C13 901 458 $194,581,709 $424,851 $370,000 23 99 C14 2,358 1,192 $567,514,725 $476,103 $377,500 21 100 C15 1,748 872 $393,155,179 $450,866 $375,000 20 100 TOTAL 20,443 10,452 $5,833,765,469 $558,148 $409,000 21 100 10 TORONTO REAL ESTATE BOARD
- 11. SINGLE FAMILY CENTRAL BREAKDOWN - JuLY 2010 Central District Detached Houses Semi-Detached Houses Area Act Sales Av. Price Med. Price % S-A Av. % List Area Act Sales Av. Price Med. Price % S-A Av.% List C01 17 5 $741,320 $638,000 29.4 100 C01 43 15 $607,940 $615,000 34.9 98 C02 42 10 $1,192,110 $976,050 23.8 98 C02 45 10 $596,400 $540,000 22.2 100 C03 83 33 $747,020 $525,000 39.8 97 C03 13 10 $481,550 $397,500 76.9 98 C04 120 51 $825,380 $721,875 42.5 98 C04 5 7 $646,714 $625,000 140.0 97 C06 58 14 $627,286 $579,000 24.1 97 C06 3 - - - - - C07 104 14 $655,350 $610,000 13.5 97 C07 10 5 $411,300 $405,000 50.0 95 C08 5 4 $681,875 $730,000 80.0 93 C08 10 5 $788,200 $745,000 50.0 98 C09 35 6 $1,358,500 $1,109,500 17.1 94 C09 3 4 $1,264,375 $1,106,250 133.3 96 C10 54 14 $1,199,143 $835,000 25.9 97 C10 12 13 $658,694 $625,000 108.3 100 C11 14 10 $990,170 $980,000 71.4 98 C11 5 5 $645,236 $625,000 100.0 99 C12 130 21 $1,676,410 $1,433,000 16.2 97 C12 2 1 $440,000 $440,000 50.0 98 C13 29 12 $776,543 $650,500 41.4 98 C13 10 7 $414,214 $370,000 70.0 97 C14 92 22 $790,170 $770,000 23.9 96 C14 - - - - - - C15 79 29 $717,317 $638,000 36.7 101 C15 24 10 $435,189 $428,000 41.7 96 Condo Apartment Link Area Act Sales Av. Price Med. Price % S-A Av. % List Area Act Sales Av. Price Med. Price % S-A Av.% List C01 966 254 $381,045 $345,000 26.3 98 C01 - - - - - - C02 139 24 $748,413 $527,500 17.3 97 C02 - - - - - - C03 34 8 $476,063 $406,250 23.5 99 C03 - - - - - - C04 49 12 $396,500 $337,500 24.5 97 C04 - - - - - - C06 31 5 $276,300 $277,500 16.1 98 C06 - - - - - - C07 168 53 $331,590 $322,800 31.6 98 C07 2 1 $413,000 $413,000 50.0 94 C08 368 124 $351,968 $327,125 33.7 98 C08 - - - - - - C09 31 17 $567,753 $519,000 54.8 97 C09 - - - - - - C10 96 25 $471,856 $402,000 26.0 98 C10 - - - - - - C11 42 3 $250,833 $255,000 7.1 98 C11 - - - - - - C12 28 6 $552,083 $493,250 21.4 97 C12 - - - - - - C13 115 35 $321,514 $270,000 30.4 97 C13 - - - - - - C14 346 114 $336,463 $325,250 33.0 98 C14 - - - - - - C15 163 35 $284,711 $272,000 21.5 97 C15 2 2 $453,444 $453,444 100.0 96 Condo Townhouse Detached Condo Area Act Sales Av. Price Med. Price % S-A Av. % List Area Act Sales Av. Price Med. Price % S-A Av.% List C01 46 30 $385,063 $368,500 65.2 98 C01 - - - - - - C02 7 - - - - - C02 - - - - - - C03 3 - - - - - C03 - - - - - - C04 3 1 $258,000 $258,000 33.3 99 C04 - - - - - - C06 2 - - - - - C06 - - - - - - C07 26 8 $383,925 $346,500 30.8 97 C07 - - - - - - C08 12 1 $350,000 $350,000 8.3 99 C08 - - - - - - C09 3 3 $594,967 $570,000 100.0 97 C09 - - - - - - C10 7 3 $603,967 $379,900 42.9 98 C10 1 - - - - - C11 9 1 $131,500 $131,500 11.1 90 C11 - - - - - - C12 6 2 $549,000 $549,000 33.3 99 C12 - - - - - - C13 3 1 $460,000 $460,000 33.3 96 C13 - - - - - - C14 26 10 $477,450 $455,250 38.5 98 C14 - - - - - - C15 50 23 $305,383 $295,500 46.0 97 C15 - - - - - - TORONTO REAL ESTATE BOARD 11
- 12. SINGLE FAMILY CENTRAL BREAKDOWN - JuLY 2010 Central District Co-op Apartment Attached/Row/Townhouse Area Act Sales Av. Price Med. Price % S-A Av. % List Area Act Sales Av. Price Med. Price % S-A Av. % List C01 1 - - - - - C01 31 7 $596,714 $570,000 22.6 101 C02 5 3 $219,667 $245,000 60.0 95 C02 27 5 $586,200 $510,000 18.5 97 C03 11 1 $297,000 $297,000 9.1 99 C03 2 1 $300,000 $300,000 50.0 97 C04 8 1 $272,000 $272,000 12.5 98 C04 1 - - - - - C06 - - - - - - C06 2 2 $573,500 $573,500 100.0 98 C07 - - - - - - C07 8 4 $553,257 $556,514 50.0 98 C08 1 2 $185,750 $185,750 200.0 97 C08 16 5 $529,720 $558,000 31.3 97 C09 4 1 $575,000 $575,000 25.0 96 C09 - - - - - - C10 2 1 $259,500 $259,500 50.0 100 C10 4 - - - - - C11 - - - - - - C11 1 2 $503,950 $503,950 200.0 99 C12 - - - - - - C12 - - - - - - C13 2 1 $360,000 $360,000 50.0 96 C13 - 1 $536,000 $536,000 - 99 C14 2 1 $230,000 $230,000 50.0 100 C14 7 4 $638,500 $674,500 57.1 98 C15 - - - - - - C15 - - - - - - North District Current Month: July 2010 Area Active New Sales $ Volume Avg Price Med Price Avg DOM Avg %List N01 170 88 48 $28,156,344 $586,591 $532,450 36 97 N02 266 131 70 $33,433,249 $477,618 $403,500 31 96 N03 452 243 152 $77,632,978 $510,743 $428,750 34 97 N04 239 127 93 $49,745,226 $534,895 $550,126 31 97 N05 233 115 58 $30,366,488 $523,560 $524,000 31 97 N06 228 95 52 $27,335,377 $525,680 $445,000 34 98 N07 231 147 102 $39,290,572 $385,202 $342,500 33 98 N08 611 283 155 $75,341,623 $486,075 $439,900 29 98 N10 204 114 72 $34,181,900 $474,749 $461,250 33 98 N11 568 306 223 $116,090,740 $520,586 $476,000 31 97 N12 147 60 33 $16,669,900 $505,148 $379,000 32 97 N13 113 25 14 $8,926,900 $637,636 $490,250 55 95 N14 176 42 12 $8,754,300 $729,525 $685,000 29 96 N15 127 51 28 $11,664,440 $416,587 $378,000 53 97 N16 155 49 24 $8,995,500 $374,813 $357,500 62 97 N17 331 105 66 $23,007,200 $348,594 $249,000 46 96 N18 153 50 36 $12,688,300 $352,453 $326,000 36 98 N19 200 67 37 $11,402,300 $308,170 $263,000 47 97 N20 44 20 6 $3,045,000 $507,500 $392,500 81 96 N21 54 17 3 $848,500 $282,833 $335,000 77 95 N22 110 25 7 $2,419,500 $345,643 $285,000 54 96 N23 248 82 36 $10,655,400 $295,983 $288,250 59 96 N24 141 30 14 $3,763,900 $268,850 $239,000 69 95 TOTAL 5,201 2,272 1,341 $634,415,637 $473,091 $420,000 36 97 12 TORONTO REAL ESTATE BOARD
- 13. North District North District North District 80 Days on Market 80 Sales Active Listing Ratio 60 60 40 40 20 20 0 0 Jul Aug Sep Oct Nov Dec Jan Feb Mar Apr May Jun Jul Jul Aug Sep Oct Nov Dec Jan Feb Mar Apr May Jun Jul 2009 2010 2009 2010 Year-to-Date: July 2010 Area Listed Sales $ Volume Avg Price Med Price Avg DOM Avg %List N01 844 447 $255,322,857 $571,192 $520,000 21 99 N02 1,223 615 $304,542,397 $495,191 $435,000 22 99 N03 2,548 1,369 $691,446,263 $505,074 $444,900 21 99 N04 1,440 704 $376,666,128 $535,037 $515,500 20 99 N05 1,132 513 $279,285,224 $544,416 $520,000 23 98 N06 1,009 571 $276,545,653 $484,318 $420,000 26 99 N07 1,428 918 $350,118,153 $381,392 $355,000 22 99 N08 3,077 1,586 $811,964,509 $511,957 $470,000 22 98 N10 1,111 527 $258,741,915 $490,971 $470,000 20 99 N11 3,242 1,766 $922,674,853 $522,466 $474,140 20 99 N12 586 312 $145,189,698 $465,352 $415,000 26 98 N13 237 79 $57,611,542 $729,260 $605,000 73 96 N14 400 168 $115,557,038 $687,840 $577,500 43 96 N15 385 181 $78,859,450 $435,688 $377,900 40 97 N16 448 221 $92,221,530 $417,292 $375,000 47 97 N17 1,008 534 $155,290,367 $290,806 $263,000 38 97 N18 521 288 $96,789,756 $336,076 $315,000 39 98 N19 554 310 $91,730,020 $295,903 $267,000 50 97 N20 102 45 $20,523,600 $456,080 $422,500 62 96 N21 115 53 $17,456,400 $329,366 $335,000 60 97 N22 292 140 $42,363,650 $302,598 $269,500 57 97 N23 635 272 $76,195,749 $280,131 $258,500 53 97 N24 305 95 $25,687,952 $270,399 $235,000 60 96 TOTAL 22,642 11,714 $5,542,784,704 $473,176 $428,000 27 99 TORONTO REAL ESTATE BOARD 13
- 14. SINGLE FAMILY NORTH BREAKDOWN - JuLY 2010 North District Detached Houses Semi-Detached Houses Area Act Sales Av. Price Med. Price % S-A Av. % List Area Act Sales Av. Price Med. Price % S-A Av. % List N01 82 29 $751,270 $608,000 35.4 97 N01 1 1 $577,500 $577,500 100.0 93 N02 115 32 $649,205 $557,500 27.8 96 N02 1 1 $447,000 $447,000 100.0 99 N03 198 65 $736,200 $648,000 32.8 97 N03 7 3 $500,667 $512,000 42.9 97 N04 163 60 $634,214 $615,000 36.8 97 N04 11 6 $382,033 $387,400 54.6 97 N05 194 40 $584,768 $571,750 20.6 97 N05 8 4 $403,500 $407,500 50.0 99 N06 169 29 $681,927 $520,000 17.2 97 N06 16 8 $325,875 $334,500 50.0 99 N07 150 54 $458,491 $412,500 36.0 97 N07 29 13 $324,692 $330,000 44.8 98 N08 422 82 $582,258 $529,500 19.4 97 N08 53 31 $408,706 $405,000 58.5 98 N10 111 37 $551,414 $547,000 33.3 97 N10 5 3 $384,333 $382,000 60.0 98 N11 319 120 $643,662 $587,250 37.6 97 N11 40 24 $413,029 $408,000 60.0 97 N12 127 22 $588,568 $437,000 17.3 97 N12 7 7 $354,300 $357,000 100.0 98 N13 113 14 $637,636 $490,250 12.4 95 N13 - - - - - - N14 163 10 $824,650 $803,750 6.1 95 N14 1 - - - - - N15 113 25 $435,548 $430,000 22.1 97 N15 - - - - - - N16 135 21 $385,190 $374,000 15.6 97 N16 - - - - - - N17 314 60 $361,105 $260,000 19.1 96 N17 7 2 $241,000 $241,000 28.6 99 N18 129 26 $390,746 $355,000 20.2 98 N18 5 2 $268,000 $268,000 40.0 99 N19 119 30 $327,247 $282,250 25.2 97 N19 9 - - - - - N20 44 6 $507,500 $392,500 13.6 96 N20 - - - - - - N21 54 3 $282,833 $335,000 5.6 95 N21 - - - - - - N22 94 5 $406,300 $412,500 5.3 97 N22 - - - - - - N23 238 34 $300,159 $301,500 14.3 96 N23 - - - - - - N24 134 13 $276,146 $250,000 9.7 95 N24 - - - - - - Condo Apartment Link Area Act Sales Av. Price Med. Price % S-A Av. % List Area Act Sales Av. Price Med. Price % S-A Av. % List N01 48 5 $279,100 $257,500 10.4 97 N01 4 2 $435,000 $435,000 50.0 98 N02 124 27 $308,915 $313,000 21.8 97 N02 6 2 $400,000 $400,000 33.3 96 N03 168 50 $284,720 $272,250 29.8 97 N03 8 - - - - - N04 26 11 $234,573 $225,000 42.3 97 N04 2 - - - - - N05 - - - - - - N05 3 1 $384,888 $384,888 33.3 96 N06 3 5 $250,200 $235,000 166.7 97 N06 - - - - - - N07 16 4 $275,750 $247,500 25.0 97 N07 - - - - - - N08 64 9 $276,889 $282,000 14.1 97 N08 3 1 $455,000 $455,000 33.3 96 N10 32 3 $241,667 $235,000 9.4 95 N10 45 25 $421,184 $415,000 55.6 99 N11 94 34 $308,944 $291,000 36.2 97 N11 18 9 $437,967 $400,000 50.0 97 N12 3 - - - - - N12 - - - - - - N13 - - - - - - N13 - - - - - - N14 9 2 $253,900 $253,900 22.2 101 N14 - - - - - - N15 - - - - - - N15 - - - - - - N16 10 - - - - - N16 4 - - - - - N17 1 - - - - - N17 1 1 $204,900 $204,900 100.0 100 N18 2 - - - - - N18 13 4 $289,000 $281,500 30.8 99 N19 11 - - - - - N19 5 1 $222,000 $222,000 20.0 97 N20 - - - - - - N20 - - - - - - N21 - - - - - - N21 - - - - - - N22 - - - - - - N22 6 1 $223,000 $223,000 16.7 97 N23 - - - - - - N23 6 1 $245,000 $245,000 16.7 94 N24 - - - - - - N24 - - - - - - 14 TORONTO REAL ESTATE BOARD
- 15. SINGLE FAMILY NORTH BREAKDOWN - JuLY 2010 North District Condo Townhouse Detached Condo Area Act Sales Av. Price Med. Price % S-A Av. % List Area Act Sales Av. Price Med. Price % S-A Av. % List N01 33 11 $320,591 $329,000 33.3 98 N01 - - - - - - N02 15 7 $388,000 $340,000 46.7 98 N02 1 - - - - - N03 40 10 $360,510 $368,250 25.0 97 N03 - - - - - - N04 6 1 $367,900 $367,900 16.7 98 N04 - - - - - - N05 2 - - - - - N05 - - - - - - N06 13 3 $422,667 $285,000 23.1 99 N06 - - - - - - N07 12 14 $266,613 $249,000 116.7 98 N07 - - - - - - N08 9 2 $265,950 $265,950 22.2 99 N08 - - - - - - N10 6 2 $318,500 $318,500 33.3 95 N10 - - - - - - N11 44 9 $472,278 $432,000 20.5 97 N11 - - - - - - N12 1 - - - - - N12 1 - - - - - N13 - - - - - - N13 - - - - - - N14 3 - - - - - N14 - - - - - - N15 - - - - - - N15 - - - - - - N16 4 1 $295,000 $295,000 25.0 98 N16 - - - - - - N17 1 1 $180,000 $180,000 100.0 97 N17 - - - - - - N18 2 4 $209,225 $203,500 200.0 99 N18 - - - - - - N19 9 1 $168,000 $168,000 11.1 99 N19 26 1 $263,000 $263,000 3.9 94 N20 - - - - - - N20 - - - - - - N21 - - - - - - N21 - - - - - - N22 - - - - - - N22 - - - - - - N23 - - - - - - N23 - - - - - - N24 7 1 $174,000 $174,000 14.3 97 N24 - - - - - - Co-op Apartment Attached/Row/Townhouse Area Act Sales Av. Price Med. Price % S-A Av. % List Area Act Sales Av. Price Med. Price % S-A Av. % List N01 - - - - - - N01 2 - - - - - N02 - - - - - - N02 4 1 $355,000 $355,000 25.0 94 N03 - - - - - - N03 31 24 $434,871 $433,000 77.4 98 N04 1 - - - - - N04 30 15 $430,133 $425,000 50.0 98 N05 - - - - - - N05 26 13 $382,838 $375,000 50.0 98 N06 - - - - - - N06 27 7 $347,643 $345,000 25.9 98 N07 - - - - - - N07 24 17 $322,087 $317,500 70.8 98 N08 - - - - - - N08 60 30 $381,590 $381,000 50.0 98 N10 - - - - - - N10 5 2 $367,500 $367,500 40.0 98 N11 1 - - - - - N11 52 27 $379,344 $388,000 51.9 98 N12 - - - - - - N12 8 4 $310,325 $312,400 50.0 99 N13 - - - - - - N13 - - - - - - N14 - - - - - - N14 - - - - - - N15 - - - - - - N15 14 3 $258,583 $262,000 21.4 98 N16 - - - - - - N16 2 2 $305,750 $305,750 100.0 98 N17 - - - - - - N17 7 2 $237,000 $237,000 28.6 98 N18 - - - - - - N18 2 - - - - - N19 - - - - - - N19 21 4 $232,975 $236,500 19.1 99 N20 - - - - - - N20 - - - - - - N21 - - - - - - N21 - - - - - - N22 - - - - - - N22 10 1 $165,000 $165,000 10.0 89 N23 - - - - - - N23 4 1 $205,000 $205,000 25.0 98 N24 - - - - - - N24 - - - - - - TORONTO REAL ESTATE BOARD 15
- 16. District Totals New Active Listed Sales $ Volume Avg Price Med Price Avg DOM Avg Month Grand Total 10,825 21,714 N/A 6,564 $2,760,044,719 $420,482 $361,000 33 97 Year N/A N/A 106,636 56,829 $24,564,502,574 $432,253 $368,000 24 99 Annual Summary - Single Family Year *Number of Sales *Average Price Year *Number of Sales *Average Price 1976 19,025 $61,389 2009 1977 20,512 $64,559 January 2,670 $343,632 1978 21,184 $67,333 February 4,120 $361,305 1979 23,466 $70,830 March 6,171 $362,050 1980 26,017 $75,694 April 8,107 $385,641 1981 29,625 $90,203 May 9,589 $395,609 1982 25,336 $95,496 June 10,955 $403,972 1983 30,046 $101,626 July 9,967 $395,414 1984 31,905 $102,318 August 8,035 $387,921 1985 45,509 $109,094 September 8,196 $406,877 1986 52,919 $138,925 October 8,476 $423,559 1987 43,475 $189,105 November 7,446 $418,460 1988 49,381 $229,635 December 5,541 $411,931 1989 38,960 $273,698 1990 26,779 $255,020 Total** 87,308 $395,460 1991 38,144 $234,313 1992 41,703 $214,971 2010 1993 38,990 $206,490 January 4,986 $409,058 1994 44,237 $208,921 February 7,291 $431,509 1995 39,273 $203,028 March 10,430 $434,696 1996 55,779 $198,150 April 10,898 $437,600 1997 58,014 $211,307 May 9,470 $446,593 1998 55,344 $216,815 June 8,442 $435,034 1999 58,957 $228,372 July 6,564 $420,482 2000 58,343 $243,255 2001 67,612 $251,508 Year-to-Date** 56,829 $432,253 2002 74,759 $275,231 2003 78,898 $293,067 2004 83,501 $315,231 2005 84,145 $335,907 2006 83,084 $351,941 2007 93,193 $376,236 2008 74,552 $379,347 * Due to District revisions, caution should be exercised when undertaking historical comparisons. Please refer to appropriate maps. **This figure may not equal the sum of all monthly totals, as the year-to-date total reflects sales reported in error and deals that have fallen through since January 1st. Single Family Dwelling Sales Comparison Sales Active Listings Average Price 15000 500000 35000 13500 30000 12000 425000 10500 25000 9000 20000 7500 350000 6000 15000 4500 10000 275000 3000 5000 1500 0 0 200000 Jul Aug Sep Oct Nov Dec Jan Feb Mar Apr May Jun Jul Jul Aug Sep Oct Nov Dec Jan Feb Mar Apr May Jun Jul 2000 2001 2002 2003 2004 2005 2006 2007 2008 2009 2010 2009 2010 2009 2010 16 TORONTO REAL ESTATE BOARD