
Recomendados
Mais conteúdo relacionado
Mais procurados
Mais procurados (12)
Semelhante a Assignment 03
Semelhante a Assignment 03 (20)
Assignment 03
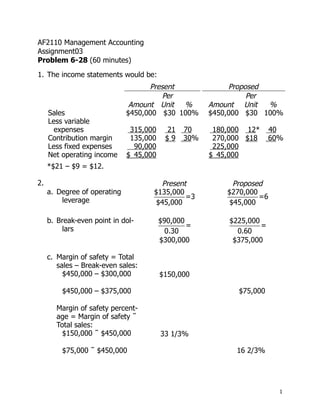
- 1. AF2110 Management Accounting Assignment03 Problem 6-28 (60 minutes) 1. The income statements would be: Present Proposed Per Per Amount Unit % Amount Unit % Sales $450,000 $30 100% $450,000 $30 100% Less variable expenses 315,000 21 70 180,000 12* 40 Contribution margin 135,000 $9 30% 270,000 $18 60% Less fixed expenses 90,000 225,000 Net operating income $ 45,000 $ 45,000 *$21 – $9 = $12. 2. Present Proposed a. Degree of operating $135,000 $270,000 leverage =3 =6 $45,000 $45,000 b. Break-even point in dol- $90,000 $225,000 lars = = 0.30 0.60 $300,000 $375,000 c. Margin of safety = Total sales – Break-even sales: $450,000 – $300,000 $150,000 $450,000 – $375,000 $75,000 Margin of safety percent- age = Margin of safety ÷ Total sales: $150,000 ÷ $450,000 33 1/3% $75,000 ÷ $450,000 16 2/3% 1
- 2. Problem 6-28 (continued) 3. The major factor would be the sensitivity of the company’s operations to cyclical movements in the economy. In years of strong economic activity, the company will be better off with the new equipment. The reason is that the new equipment will increase the CM ratio, permitting profits to rise more rapidly in years that sales are strong. However, in periods of economic recession, the company will be worse off with the new equipment. The greater fixed costs created by the new equipment will cause losses to be deeper and sustained more quickly than at present. Thus, management must decide whether the potential for greater profits in good years is worth the risk of deeper losses in bad years. 4. No information is given in the problem concerning the new variable expenses or the new contribution margin ratio. Both of these items must be determined before the new break-even point can be computed. The computations are: New variable expenses: Sales = Variable expenses + Fixed expenses + Profits $585,000*= Variable expenses + $180,000 + $54,000** $351,000 = Variable expenses *New level of sales: $450,000 × 1.30 = $585,000 **New level of net operating income: $45,000 × 1.2 = $54,000 New CM ratio: Sales $585,000 100% Less variable expenses 351,000 60 Contribution margin $234,000 40% With the above data, the new break-even point can be computed: Break-even point = Fixed expenses = $180,000 =$450,000 in dollar sales CM ratio 0.4 2
- 3. Problem 6-28 (continued) The greatest risk is that the marketing manager’s estimates of increases in sales and net operating income will not materialize and that sales will remain at their present level. Note that the present level of sales is $450,000, which is just equal to the break-even level of sales under the new marketing method. Thus, if the new marketing strategy is adopted and sales remain unchanged, profits will drop from the current level of $45,000 per month to zero. It would be a good idea to compare the new marketing strategy to the current situation more directly. What level of sales would be needed under the new method to generate at least the $45,000 in profits the company is currently earning each month? The computations are: Dollar sales to attain = Fixed expenses + Target profit target profit CM ratio $180,000 + $45,000 = 0.40 = $562,500 in sales each month Thus, sales would have to increase by at least 25% ($562,500 is 25% higher than $450,000) in order to make the company better off with the new marketing strategy than with the current situation. This appears to be extremely risky. 3
- 4. Problem 6-29 (60 minutes) 1. CARBEX, INC. Income Statement For April Standard Deluxe Total Amount % Amount % Amount % Sales............................ $240,000 100 $150,000 100 $390,000 100.0 Less variable expenses: Production................. 60,000 25 60,000 40 120,000 30.8 Sales commission....... 36,000 15 22,500 15 58,500 15.0 Total variable expenses. 96,000 40 82,500 55 178,500 45.8 Contribution margin...... $144,000 60 $ 67,500 45 $211,500 54.2 Less fixed expenses: Advertising................ 105,000 Depreciation.............. 21,700 Administrative............ 63,000 Total fixed expenses..... 189,700 Net operating income.... $ 21,800 CARBEX, INC. Income Statement For May Standard Deluxe Total Amount % Amount % Amount % Sales........................... $60,000 100 $375,000 100 $435,000 100.0 Less variable expenses: Production................ 15,000 25 150,000 40 165,000 37.9 Sales commission...... 9,000 15 56,250 15 65,250 15.0 Total variable expenses.. 24,000 40 206,250 55 230,250 52.9 Contribution margin..... $36,000 60 $168,750 45 204,750 47.1 Less fixed expenses: Advertising............... 105,000 Depreciation............. 21,700 Administrative........... 63,000 Total fixed expenses.... 189,700 Net operating income... $ 15,050 4
- 5. Problem 6-29 (continued) 2. The sales mix has shifted over the last year from Standard sets to Deluxe sets. This shift has caused a decrease in the company’s overall CM ratio from 54.2% in April to 47.1% in May. For this reason, even though total sales (in dollars) are greater, net operating income is lower. 3. Sales commissions could be based on contribution margin, rather than on sales price. A flat rate on total contribution margin, as the text suggests, might encourage the salespersons to emphasize the product with the greatest contribution to the profits of the firm. 4. a. The break-even in dollar sales can be computed as follows: Fixed expenses $189,700 = = $350,000 CM ratio 0.542 b. May’s break-even point is higher than April’s. This is because the company’s overall CM ratio has gone down, i.e., the sales mix has shifted from the more profitable to the less profitable units. 5
- 6. Problem 6-30 (75 minutes) 1. a. Selling price..................... $25 100% Less variable expenses..... 15 60 Contribution margin......... $10 40% Sales = Variable expenses + Fixed expenses + Profits $25Q = $15Q + $210,000 + $0 $10Q = $210,000 Q = $210,000 ÷ $10 per ball Q = 21,000 balls Alternative solution: Break-even point = Fixed expenses in unit sales Unit contribution margin $210,000 = =21,000 balls $10 per ball b. The degree of operating leverage would be: Degree of Contribution margin = operating leverage Net operating income $300,000 = =3.33 (rounded) $90,000 2. The new CM ratio will be: Selling price..................... $25 100% © The McGraw-Hill Companies, Inc., 2006. All rights reserved. 6 Managerial Accounting, 11th Edition
- 7. Less variable expenses..... 18 72 Contribution margin......... $7 28% The new break-even point will be: Sales = Variable expenses + Fixed expenses + Profits $25Q = $18Q + $210,000 + $0 $7Q = $210,000 Q = $210,000 ÷ $7 per ball Q = 30,000 balls 7
- 8. Problem 6-30 (continued) Alternative solution: Break-even point = Fixed expenses in unit sales Unit contribution margin $210,000 = =30,000 balls $7 per ball 3. Sales = Variable expenses + Fixed expenses + Profits $25Q = $18Q + $210,000 + $90,000 $7Q = $300,000 Q = $300,000 ÷ $7 per ball Q = 42,857 balls (rounded) Alternative solution: Unit sales to attain = Fixed expenses +Target profit target profit Unit contribution margin $210,000 + $90,000 = =42,857 balls $7 per ball Thus, sales will have to increase by 12,857 balls (42,857 balls, less 30,000 balls currently being sold) to earn the same amount of net operating income as last year. The computations above and in part (2) show quite clearly the dramatic effect that increases in variable costs can have on an organization. The effects on Northwood Company are summarized below: Present Expected Combination margin ratio................................... 40% 28% © The McGraw-Hill Companies, Inc., 2006. All rights reserved. 8 Managerial Accounting, 11th Edition
- 9. Break-even point (in balls).................................. 21,000 30,000 Sales (in balls) needed to earn a $90,000 profit. . . 30,000 42,857 Note particularly that if variable costs do increase next year, then the company will just break even if it sells the same number of balls (30,000) as it did last year. 9
- 10. Problem 6-30 (continued) 4. The contribution margin ratio last year was 40%. If we let P equal the new selling price, then: P = $18 + 0.40P 0.60P = $18 P = $18 ÷ 0.60 P = $30 To verify: Selling price.................... $30 100% Less variable expenses..... 18 60 Contribution margin......... $12 40% Therefore, to maintain a 40% CM ratio, a $3 increase in variable costs would require a $5 increase in the selling price. 5. The new CM ratio would be: Selling price........................ $25 100% Less variable expenses......... 9* 36 Contribution margin............. $16 64% *$15 – ($15 × 40%) = $9 The new break-even point would be: Sales = Variable expenses + Fixed expenses + Profits $25Q = $9Q + $420,000 + $0 $16Q = $420,000 Q = $420,000 ÷ $16 per ball Q = 26,250 balls Alternative solution: © The McGraw-Hill Companies, Inc., 2006. All rights reserved. 10 Managerial Accounting, 11th Edition
- 11. Break-even point = Fixed expenses in unit sales Unit contribution margin $420,000 = =26,250 balls $16 per ball Although this new break-even is greater than the company’s present break-even of 21,000 balls [see Part (1) above], it is less than the break-even point will be if the company does not automate and variable labor costs rise next year [see Part (2) above]. 11
- 12. Problem 6-30 (continued) 6. a. Sales = Variable expenses + Fixed expenses + Profits $25Q = $9Q + $420,000 + $90,000 $16Q = $510,000 Q = $510,000 ÷ $16 per ball Q = 31,875 balls Alternative solution: Unit sales to attain = Fixed expenses + Target profit target profit Unit contribution margin = $420,000 + $90,000 =31,875 balls $16 per ball Thus, the company will have to sell 1,875 more balls (31,875 – 30,000 = 1,875) than now being sold to earn a profit of $90,000 per year. However, this is still far less than the 42,857 balls that would have to be sold to earn a $90,000 profit if the plant is not automated and variable labor costs rise next year [see Part (3) above]. b. The contribution income statement would be: Sales (30,000 balls × $25 per ball).......................... $750,000 Less variable expenses (30,000 balls × $9 per ball).. 270,000 Contribution margin............................................... 480,000 Less fixed expenses............................................... 420,000 Net operating income............................................. $ 60,000 © The McGraw-Hill Companies, Inc., 2006. All rights reserved. 12 Managerial Accounting, 11th Edition
- 13. Degree of Contribution margin = operating leverage Net operating income $480,000 = =8 $60,000 13
- 14. Problem 6-30 (continued) c. This problem illustrates the difficulty faced by many companies today. Variable costs for labor are rising, yet because of competitive pressures it is often difficult to pass these cost increases along in the form of a higher price for products. Thus, companies are forced to automate (to some degree) resulting in higher operating leverage, often a higher break-even point, and greater risk for the company. There is no clear answer as to whether one should have been in favor of constructing the new plant. However, this question provides an opportunity to bring out points such as in the preceding paragraph and it forces students to think about the issues. © The McGraw-Hill Companies, Inc., 2006. All rights reserved. 14 Managerial Accounting, 11th Edition
- 15. Case 6-35 (90 minutes) 1. a. Before the income statement can be completed, we need to estimate the company’s revenues and expenses for the month. The first step is to compute the sales for the month in both units and dollars. Sales in units would be: 33,000 units (July sales) ÷ 1.10 = 30,000 units sold in June. To determine the sales in dollars, we must integrate the break-even point, the margin of safety in dollars, and the margin of safety percentage. The computations are: Margin of safety in dollars=Total sales - Break-even sales =Total sales - $180,000 Margin of safety = Margin of safety in dollars percentage (20%) Total sales If the margin of safety in dollars is 20% of total sales, then the break-even point in dollars must be 80% of total sales. Therefore, total sales would be: $180,000 =80% Total sales Total sales = $180,000÷ 80% = $225,000 The selling price per unit would be: $225,000 total sales ÷ 30,000 units = $7.50 per unit. The second step is to determine the total contribution margin for the month of June. This can 15
- 16. be done by using the operating leverage concept. Note that a 10% increase in sales has resulted in a 50% increase in net operating income between June and July: July increased net income $40,500 - $27,000 $13,500 = = =50% June net income $27,000 $27,000 © The McGraw-Hill Companies, Inc., 2006. All rights reserved. 16 Managerial Accounting, 11th Edition
- 17. Case 6-35 (continued) Since the net operating income for July increased by 50% when sales increased by 10%, the degree of operating leverage for June must be 5. Therefore, total contribution margin for June must have been: 5 × $27,000 = $135,000. June’s income statement can now be completed by simply inserting known data and computing unknown data: PYRRHIC COMPANY Actual Income Statement For the Month Ended June 30 Total Per Unit Percent Sales (30,000 units)...... $225,000 $7.50 100 Less variable expenses. . 90,000 * 3.00 * 40 * Contribution margin...... 135,000 $4.50 60 * Less fixed expenses....... 108,000 * Net operating income.... $ 27,000 *Computed by working from known data. b. The break-even point: Break-even point = Fixed expenses in unit sales Unit contribution margin $108,000 = = 24,000 $4.50 per unit In dollars: 24,000 units × $7.50 per unit = $180,000 17
- 18. c. Margin of safety in dollars=Total sales - Break-even sales =$225,000 - $180,000 = $45,000 Margin of safety = Margin of safety in dollars percentage Total sales $45,000 = = 20% $225,000 © The McGraw-Hill Companies, Inc., 2006. All rights reserved. 18 Managerial Accounting, 11th Edition
- 19. Case 6-35 (continued) d. The degree of operating leverage: Contribution margin $135,000 = =5 Net income $27,000 2. a. July’s income statement can be completed using data given in the problem and data derived for June’s income statement above: PYRRHIC COMPANY Projected Income Statement For the Month Ended July 31 Per Total Unit Percent Sales (33,000 units) $247,500 $7.50 100 Less variable expenses 99,000 3.00 40 Contribution margin 148,500 $4.50 60 Less fixed expenses 108,000 Net operating income $ 40,500 b. Margin of safety in dollars =Total sales - Break-even sales =$247,500 - $180,000=$67,500 Margin of safety = Margin of safety in dollars percentage Total sales $67,500 = =27.3% (rounded) $247,500 19
- 20. Degree of operating = Contribution margin leverage Net operating income $148,500 = =3.7 (rounded) $40,500 The margin of safety has gone up since the company’s sales will be greater in July than they were in June, thus moving the company farther away from its break-even point. © The McGraw-Hill Companies, Inc., 2006. All rights reserved. 20 Managerial Accounting, 11th Edition
- 21. Case 6-35 (continued) The degree of operating leverage operates in the opposite manner from the margin of safety. As a company moves farther away from its break-even point, the degree of operating leverage decreases. The reason it decreases is that both contribution margin and net operating income are increasing at the same dollar rate as additional units are sold, and, mathematically, dividing one by the other will yield a progressively smaller number. 3. The increased labor cost will be $0.60 per unit, 1/3 of $1.80 per unit. The new variable expense will therefore total $3.60 per unit, and the new contribution margin ratio will be: Sales $7.50 100% Less variable expenses 3.60 48 Contribution margin $3.90 52% The target profit per unit will be: 20% × $7.50 = $1.50. Therefore, Sales = Variable expenses + Fixed expenses + Profits $7.50Q = $3.60Q + $108,000 + $1.50Q $2.40Q = $108,000 Q = $108,000 ÷ $2.40 per unit Q = 45,000 units Alternative solution: Sales = Variable expenses + Fixed expenses + Profits X = 0.48X + $108,000 + 0.20X 0.32X = $108,000 X = $108,000 ÷ 0.32 21
- 22. X = $337,500; or, at $7.50 per unit, 45,000 units © The McGraw-Hill Companies, Inc., 2006. All rights reserved. 22 Managerial Accounting, 11th Edition