SlideShare uma empresa Scribd logo
1 de 24
AUGUST                        2 011
   MID-YEAR REVIEW
                                                Mid-Year Review: US, Germany, Singapore
                                                Lead in Dynamic Marketplace
                                                Global transaction volume in the second                   QUARTERLY TRANSACTION VOLUME
                                                quarter totalled $165.3 representing a 36    $140 Billion
                                                increase from a year earlier and bringing                                    Americas
                                                the total for 2011 at mid-year to approxi- $120                              AsiaPac
                                                mately $350.0 .      e period was marked                                     EMEA
                                                by potential national defaults in Europe, $100
                                                natural disasters in Asia Pac and increas-
                                                ing worries about a double-dip recession
                                                across the globe.     erefore, property in- $80
                                                vestment trends are far more dynamic than
                                                the headline gures imply. e US mar- $60
                                                kets are roaring back to life this year with
                                                property sales soaring 147 year-over-year $40
                                                in Q2. Trading in EMEA was an anemic
                                                10 gain year-over-year in Q2 on $42.5         $20
                                                in transactions, despite robust increases
                                                in Germany and Scandinavia. Japan saw
                                                volumes fall 42 in Q2 while transactions       $0
                                                moderated in China and Hong Kong but                   1 2 3 4 1 2 3 4 1 2 3 4 1 2
                                                surged in Singapore and Australia.                    '08       '09        '10        '11

                                                                                         AUGUST 2011 - REPORT CONTENTS
                                                     IN THIS ISSUE:
                                                     • Overview: Investors Stay the Course                                 • EMEA: Investors Focus on Stable Economies . 5-9
                                                       H1 volume hits $350 billion. . . . . . . . . . 1-4                    Investment Momentum Linked To Risk . . . . 7
                                                                                                                             Market Table . . . . . . . . . . . . . . . . . . 9
                                                         CROSS-BORDER ACQUISITIONS AND
                                                           DISPOSITIONS IN AUSTRALIA                                       • Asia Pacific: China’s Land Sales Drop as CRE
                                                                                                                             Volume Grows . . . . . . . . . . . . . . . . . 10-14
                                                                     acq       disp       net                                Cross-border Buyers Move Australia . . . . . 12
                                                      5,000 Million
                                                                                                                             Market Table . . . . . . . . . . . . . . . . . .14
                                                      4,000
                                                                                                                           • Americas: US Momentum Leads Growth . . 15-19
                                                      3,000                                                                  Pretend and Extend Withers in Q2
                                                                                                                             Brazil: A Growing Institutional Market . . . . 17
                                                      2,000
                                                                                                                             Market Table . . . . . . . . . . . . . . . . . .19
                                                      1,000
                                                                                                                           • Changing Landscape for Agents . . . . . . . . . 20
                                                           0                                                               • Peak-Era Buyers: Where Are They Now? . . . . 21
                                                     (1,000)                                                               • Selected Investment Sales Transactions . . . . 22
                                                     (2,000)                                                               • Notes & Definitions . . . . . . . . . . . . . . . . 23
                                                                      '08          '09          '10         '11
©2011 Real Capital Analytics, Inc. All rights reserved. Data believed to be accurate but not guaranteed; subject to future revision; based on properties & portfolios $10m and greater.
                                                                                                                                                                                          1
AUGUST 2011
                                                                                                                                                                      MID-YEAR REVIEW


                                                 A
                                                        verage yields have continued to trend                                           TRANSACTION SUMMARY
                                                        slightly downward in the Americas                                                         Q2'11         YOY         H1’11          YOY
                                                        and EMEA. In the Americas, the                                                           Vol ($B)       Chg        Vol ($B)        Chg
                                                 wave of capital entering the market this                            Office                          $41.2          29%         $81.9        36%
                                                 year is causing downward pressure, but that                         Retail                           32.7         97%          60.6        61%
                                                 is being partially o set by increased sales of
                                                                                                                     Industrial                       11.6         26%          22.3        41%
                                                 troubled assets in the US. In EMEA, stable
                                                                                                                     All Commercial                 $85.5          48%        $164.8        45%
                                                 cap rates still re ect strong German and
                                                 Nordic volume combined with select UK                               Hotel                             8.8         80%          16.7        66%
                                                 trophy transactions. Higher yields in Asia                          Apartment                        20.4         38%          33.2        37%
 PROPERTY ACQUISITION YIELDS
       IN MAJOR GLOBAL MARKETS                   Pac partly re ect rebounding activity in                            Land                             50.6         14%         134.6        11%
                                                 Australia, where property o ers among the                           Total                         $165.3          36%        $349.3        30%
                      NYC/DC                     highest average cap rates globally, as well as
                      HK/Sing                                                                                        *Totals may not sum due to rounding
                      London/Paris               the severe slide in activity in traditionally
7.5%                                             lower-yielding Japan.                                              had very low cap rates, and without greater economic
                                                    Pricing trends in the world’s global nan-                       certainty, investors are hesitant about becoming even
7.0%
                                                 cial capitals provide more insight. Yields in                      more bullish. In addition, with yields so low in these
6.5%                                             these markets were relatively unchanged                            major markets, secondary cities and other higher yield-
                                                 in Q2 and have moved little since the be-                          ing alternatives are more attractive. e surge of cross-
6.0%
                                                 ginning of the year. ese markets already                           border capital into Australia well illustrates this trend.
5.5%                                                                                  QUARTERLY TRANSACTION SUMMARY BY ZONE
5.0%                                                                                                   OFFICE, RETAIL AND INDUSTRIAL
                                                                       ASIA PAC                                             EMEA                                         AMERICAS
4.5%                                                                    CAP RATES                                        CAP RATES                                        CAP RATES
                                                  9.0%                                             9.0%                                              9.0%
4.0%                                              8.5%                                             8.5%                                              8.5%
                                                  8.0%                                             8.0%                                              8.0%
3.5%
                                                  7.5%                                             7.5%                                              7.5%
3.0%                                              7.0%                                             7.0%                                              7.0%
                                                  6.5%                                             6.5%                                              6.5%
         '07    '08      '09     '10     '11      6.0%                                             6.0%                                              6.0%
                                                  5.5%                                             5.5%                                              5.5%
                                                                                                                        TRANSACTION
                                                    $50 Billion 2 3 4 TRANSACTION 3 4 1 2
                                                              1        1 2 3 4 1 2                   $50 Billion 2 3 4 1 2 3 4 1 2 3 4 1 2
                                                                                                              1                                       $50 Billion 2 3 4 TRANSACTION 3 4 1 2
                                                                                                                                                               1         1 2 3 4 1 2
                                                             '08      '09      '10    '11                    '08       '09      '10    '11                    '08       '09      '10    '11
                                                    $40                                              $40                                              $40

                                                    $30                                              $30                                              $30

                                                    $20                                              $20                                              $20

                                                    $10                                              $10                                              $10

                                                    $0                                                $0                                               $0

                                                  150%      1 2 YOY 4 1 2 3 IN TRANS3 4 1 2
                                                                 3 CHANGE 4 1 2 VOL                150%      1 2 YOY 4 1 2 3 IN TRANS3VOL 1 2
                                                                                                                  3 CHANGE 4 1 2        4            150%     1 2 YOY 4 1 2 3 IN TRANS3 4 1 2
                                                                                                                                                                   3 CHANGE 4 1 2 VOL
                                                           '08        '09       '10     '11                 '08        '09      '10       '11                '08        '09       '10     '11
                                                  100%                                             100%                                              100%

                                                   50%                                              50%                                              50%

                                                    0%                                               0%                                                0%

                                                  -50%                                             -50%                                              -50%

                                                 -100%                                            -100%                                             -100%

                                                            1 2 3 4 1 2 3 4 1 2 3 4 1 2                      1 2 3 4 1 2 3 4 1 2 3 4 1 2                      1 2 3 4 1 2 3 4 1 2 3 4 1 2
                                                           '08      '09     '10     '11                     '08      '09     '10     '11                     '08      '09     '10     '11

 ©2011 Real Capital Analytics, Inc. All rights reserved. Data believed to be accurate but not guaranteed; subject to future revision; based on properties & portfolios $10m and greater.
                                                                                                                                                                                                 2
AUGUST 2011
                                                                                                                                                                        MID-YEAR REVIEW


                                                E
                                                 ach global zone combated pressures                                                  TRANSACTIONS BY COUNTRY
                                                 from within. Sovereign debt fears                                                            ALL PROPERTY TYPES
                                                 in EMEA’s peripheral countries and                                                            Q1’11              Q2’11               H1’11
                                       heavy belt-tightening in the UK restrained                                                           Vol      YOY        Vol      YOY       Vol     YOY
                                       growth, but domestic and cross-border                                                   Country
                                                                                                                                           ($B)      Chg       ($B)      Chg      ($B)     Chg
                                       investors were active in Germany and the                                      1 China                $75.7       8%     $41.8      21% $117.6          12%
                                       stable Scandinavian economies. While                                          2 United States         28.8      93%      49.0     147%       77.8   124%
                                                            Russia struggled, Central
                 VOLUME BY THEATER                          and Eastern Europe at-
                                                                                                                     3 United Kingdom        15.3      62%        9.0     -25%      24.3      14%
                    ALL PROPERTY TYPES                                                                               4 Germany                9.3      42%      11.2      65%       20.5      54%
                                                            tracted yield-seeking in-
                     Q2'11      YOY    H1’11        YOY                                                              5 Japan                 11.4      18%        3.6     -42%      15.0      -5%
                   Vol ($B)      Chg  Vol ($B)      Chg     vestment. In Asia Paci c,
                                                                                                                     6 Singapore              5.4    237%         6.2     68%       11.5   119%
United States          $49.0 147%         $77.8 124%
                                                            the retail and industrial
                                                                                                                     7 Hong Kong              3.5     -29%        6.0     38%        9.5       3%
Canada                    4.5     8%         7.8      5%
                                                            sectors were a counter-
                                                                                                                     8 France                 3.9      32%        5.3     -20%       9.1      -4%
Latin America             2.1    17%         5.6    95%
                                                            weight to slow o ce vol-
                                                            ume and a sharp drop-o                                   9 Sweden                 2.8      23%        5.1     80%        8.0      55%
Americas               $55.6 115%         $91.2 102%
                                                            in Q2 land sales in China.                              10 Canada                 3.3       2%        4.5      8%        7.8       5%
Western Europe          28.8     27%       52.8     27%
United Kingdom            9.0 -25%         24.3     14%     In the US, the intense                                  11 Australia              2.0     -34%        5.6    102%        7.6      32%

Eastern Europe            3.1    17%         7.6    17%     selective focus on major                                12 Brazil                 2.9    399%         1.1     -32%       4.0      85%

MidEast                   0.8 -29%           1.5 -18%       assets in major markets                                 13 Taiwan                 1.7      -8%        1.3     -41%       3.0      -26%

Africa                    0.9 161%           1.1     -8%    began to spread out, as                                 14 South Korea            1.5      71%        1.4     91%        3.0      80%
EMEA                   $42.5     10%      $87.4     21%     yield-conscious investors                               15 Italy                  1.6      87%        0.8     -9%        2.5      37%
East Asia               50.7     21%      133.3     11%     moved into other markets                                16 Spain                  1.3     -31%        1.1     -29%       2.3      -30%
Japan                     3.6 -42%         15.0      -5%    and embraced garden                                     17 Netherlands            1.3      19%        1.0     -5%        2.3       7%
SE Asia                   6.6    41%       13.2     92%     apartments.      e ow of                                18 Russia                 0.2     -91%        1.8     85%        2.0      -34%
Australia - NZ            5.7    96%         8.1    24%     new distress slowed and,                                19 Poland                 1.4      91%        0.5     -22%       1.8      40%
India/Other               0.6 -71%           1.3 -56%       with credit easing and                                  20 Norway                 0.4     -33%        1.1     77%        1.5      22%
Asia Pacific            $67.2     17%    $170.8      12%     prices rming, lenders
                                                                                                                    21 India                  0.8     -29%        0.6     -71%       1.3      -56%
                                                            opted more for liquida-
Global*               $165.3     36%    $349.3      30%                                                             22 Finland                0.3       4%        0.8    182%        1.2      91%
                                                            tions than restructurings
 *Totals may not sum due to rounding                                                                                23 Belgium                0.4      -9%        0.8    105%        1.2      47%
                                                            of troubled assets.
                                                                                                                    24 Czech Republic         0.9    279%         0.2     24%        1.2   168%
                                           Highlighting the choppy and o en local-
                                                                                                                    25 Switzerland            0.5      97%        0.6    280%        1.1   162%
                                       ized activity across the global markets, many
                                       countries saw quarterly           volume trends                              26 Denmark                0.5      38%        0.6     78%        1.1      56%
                                       reverse, in both directions, from Q1 to Q2.                                  27 South Africa           0.2     -79%        0.8 1362%          1.0      12%
                                       Other countries, with the US in the lead, saw                                28 Malaysia               0.6      47%        0.3     -58%       0.9      -23%
                                       strong positive acceleration in growth in Q2.                                29 Israel                  0.2    -48%        0.6     -6%        0.8      -22%
                                            e US had the highest        growth in both                              30 Ukraine                 0.6   446%         0.1     -80%       0.7      40%
                                       Q2 and H1, with its second quarter gain of                                   31 Chile                   0.2   100%         0.6 4453%          0.7   678%
                                       147 outpacing its 124 H1 growth. Ger-                                        32 Austria                 0.6     38%        0.1     -79%       0.7      -19%
                                       many and Sweden were the standout gainers                                    33 Turkey                  0.6     30%        0.1     94%        0.7      38%
                                       in EMEA as France and the UK lost ground.                                    34 New Zealand             0.4    -39%        0.1     -10%       0.5      -33%
                                       China’s land sales turndown slowed the gi-                                   35 Hungary                 0.4     20%        0.1     27%        0.5      22%
                                       ant Asia Pac market to just 12 in H1, one-                                   36 UAE                     0.5     64%        0.0     -95%       0.5      -36%
                                       third below its growth for commercial prop-                                  37 Romania                 0.5   207%         0.0 -100%          0.5      59%
                                       erty only. Australia’s transaction volume                                    38 Croatia                 0.4         -      0.0 -100%          0.4   283%
                                       moved rapidly positive, pushing the country                                  39 Portugal                0.2    -43%        0.2     -68%       0.4      -57%
                                       to a 102 gain. Spectacular Q1 growth in
                                                                                                                    40 Thailand                0.3     61%        0.1     -61%       0.4      -10%
                                       Singapore and Brazil inevitably slowed in
                                                                                                                       All Others              1.4     54%        1.3     69%        2.7      61%
                                       Q2, but both countries turned in solid posi-
                                                                                                                       Grand Total         $184.0      25% $165.3         36% $349.3          30%
                                       tive improvements for H1.

©2011 Real Capital Analytics, Inc. All rights reserved. Data believed to be accurate but not guaranteed; subject to future revision; based on properties & portfolios $10m and greater.
                                                                                                                                                                                                3
AUGUST 2011
                                                                                                                                                                      MID-YEAR REVIEW


                                 Global: Top Deals and Players in H1’11
                                                                                                   TOP 25 PROPERTY SALES
       TOP 20 BUYERS#                                                                                                Price        SF(K)/ PPSF/
                                               Type             Transaction                     Location                                                         Buyer
                                                                                                                     ($M)         Units PPU (K)
                                  Vol        1 RET The Trafford Centre†                  Manchester, GBR              $2,498       1,900 $1,315 Capital Shopping Ctrs Grp PLC
                                 ($M)
                                             2 RET Centr0†                               Oberhausen, DEU                1,913       2,174        880 Canada Pension Plan Investment Board
Blackstone                       $9,008
                                             3 DEV Borrett Road Site, Mid-levels         Hong Kong, HKG                 1,498        113      13,266 Cheung Kong (Holdings) Ltd
CPP Investment Board              3,689
                                             4 OFF 280 Park Avenue†                      New York, NY                   1,100       1,179        941 SL Green JV Vornado
Capital Shopping Ctrs Grp PLC     3,098
China Vanke Co Ltd                3,048      5 RET Northland Shopping Centre†            Preston East, AUS                998        994       1,004 Canada Pension Plan Investment Board
Yunnan Zhonghao Props Co Ltd      2,714      6 DEV Shenzhen 2011-K202-0014               Shenzhen, CHN                    991       7,509        132 China Merchants Property Dev Co Ltd
CA Immo                           2,402      7 DEV CITIC City B,C,D blocks (Prt II)      Beijing, CHN                     929        848       1,095 Financial Street Holding Co Ltd
Tesco Pension Trustees Ltd        2,200      8 OFF Otemachi PAL Bldg                     Tokyo, JPN                       877        301       2,916 Mitsui Fudosan Co Ltd JV Mitsui & Co
Poly Real Estate Group            2,128      9 OFF Deutsche Bank Twin Towers             Frankfurt, DEU                   857        807       1,062 DWS Investments Gmbh
Invesco Real Estate               2,117     10 DEV Changsha 2011-001                     Changsha, CHN                    855        800       1,068 Wharf Holdings
Wheelock & Co                     2,105     11 DEV Punggol Central & Punggol Walk Singapore, SGP                          799        323       2,475 Frasers Centrepoint Ltd‡
Greentown China Hldgs Ltd         2,099     12 DEV Boon Lay Way                          Singapore, SGP                   791         194      4,085 CapitaMalls Asia JV HSBC Bank
Cheung Kong (Holdings) Ltd        2,034
                                            13 OFF Chiswick Park                         London, GBR                      781       1,900        411 Blackstone
CapitaLand Limited                1,929
                                            14 OFF Helmsley Building†                    New York, NY                     763       1,213        629 Invesco Real Estate
JP Morgan                         1,747
                                            15 OFF Capital Square                        Singapore, SGP                   700         387      1,810 Alpha Investment Partners (AIP)‡
China Overseas L & I Ltd          1,650
Mitsubishi Estate                 1,611     16 OFF The Fifth Square†                     Beijing, CHN                     682       1,009        677 China Minmetals Corporation
China Merchants Group             1,517     17 DEV Nanjing 2011G07                       Nanjing, CHN                     681       3,667        186 Shimao Property Holdings Ltd‡
Arminius Funds Mgmt               1,457     18 DEV Toyosu District Site                  Tokyo, JPN                       680       1,132        601 Tokyo Metropolitan Government
DekaBank                          1,429     19 OFF The Centre                            Shanghai, CHN                    666         963        692 China Pacific Insurance (Group) Co Ltd
Far East Organization             1,423     20 RET La Rinascente                         Milan, ITA                       652         566      1,151 First Atlantic Real Estate SGR
                                            21 OFF Market Square East & West             Washington, DC                   615         680        905 Wells Real Estate Funds, Inc
                                            22 HTL Ritz Carlton HTL                      Moscow, RUS                      609         334      1,824 Verny Capital
      TOP 20 SELLERS #                      23 DEV CITIC City B,C,D blocks               Beijing, CHN                     607         848        716 Financial Street Holding Co Ltd
                                  Vol       24 DEV Yiwu 2011017                          Yiwu, CHN                        594         883        672 Guangsha Construction
                                 ($M)
                                            25 IND Interlink†                            Hong Kong, HKG                   589       2,400        245 Canada Pension Plan Investment Board
Centro Properties Group       $8,102
Urban Redevelopment Authority 3,356
Housing & Dev Board               2,821                                                           TOP 15 PORTFOLIO SALES
Volksbank AG                      2,426                                                                              Price       SF(K)/ PPSF/
                                               Type             Transaction                     Location                                                                 Buyer
Tesco plc                         2,223                                                                              ($M)        Units PPU (K)
Beacon Capital Partners           2,215      1 RET Centro United States Portfolio        Multiple, USA                $9,150     99,051   $92 Blackstone
Goldman Sachs                     1,868      2 RET Tesco RET Portfolio 11                Multiple, GBR                  2,200      3,500         629 Tesco Pension Trustees Limited
Deutsche Bank                     1,782      3 MIX Europolis MIX Eastern Euro Ptfl 11 Europe                             2,009     13,011         154 CA Immobilien Anlagen AG
CITIC Group                       1,780      4 OFF Eurocastle Mars Fixed 1 Ptfl 2011† Berlin, DEU                        1,457      4,989         292 Arminius Funds Management
Broadway Partners                 1,715      5 IND Bracor IND Portfolio 11               Multiple, BRA                  1,322     10,764         123 Prosperitas
GE Capital                        1,653      6 RET Metro RET Portfolio 11                Multiple, DEU                  1,215      9,688         125 Cerberus Capital Management
Aberdeen Property Investors       1,541      7 OFF Kokusai Shin-Akasaka Towers           Tokyo, JPN                     1,066        863       1,236 Mitsubishi Estate Company, Limited
Eurocastle                        1,544      8 DEV Greentown China Hldgs Gov't Land Ptfl Taizhou, CHN                   1,011      7,386         137 Greentown China Holdings Limited
Bracor Invtos Imobiliarios        1,297
                                             9 DEV Kunming Guandu KC2010-76              Kunming, CHN                     987     22,158          45 Yunnan Zhonghao Properties Co Ltd
Morgan Stanley                    1,336
                                            10 APT Dombron Intressenter Ptߠ             Multiple, SWE                    948      8,281         115 AMF Fastigheter
Equity Residential                1,345
                                            11 MIX Melrose Arch†                         Melrose North, ZAF               686      1,808         332 Amdec Property Development
Lone Star Partners                1,230
Unibail-Rodamco                   1,242     12 OFF Mapletree Com Trust Ptfl 2011          Singapore, SGP                   625        733         853 Mapletree Commercial Trust
Carlyle Group                     1,097     13 HTL MSREF HTL Portfolio 11                Multiple, Europe                 621      2,537         245 Toufic Aboukhater
Lehman Brothers Hldgs Inc         1,108     14 MIX Capital and Counties Mix Ptfl          Multiple, CA                     600      2,106         253 Equity One‡
                                            15 IND World Market Center Ptfl*              Las Vegas, NV                    600      4,832         124 Bain Capital‡

 # Full credit to each JV partner, 100% valuation given *Estimated † Partial Interest ‡ JV


 ©2011 Real Capital Analytics, Inc. All rights reserved. Data believed to be accurate but not guaranteed; subject to future revision; based on properties & portfolios $10m and greater.
                                                                                                                                                                                             4
AUGUST 2011
                                                                                                                                                                                          MID-YEAR REVIEW


                                                EMEA: Quarter in Review Summary

                                                F
                                                ollowing six consecutive quarters of                                                   QUARTERLY TRANSACTION VOLUME
                                                strong year-over-year gains, EMEA                                                                                 BY PROPERTY TYPE
                                                                                                                  $70 Billion
                                                transaction volumes stalled in Q2.                                                                                Commercial
                                             e slowdown, to $42.5 of signi cant                                   $60                                             Apartment
                                         property sales, was at against a year ear-                                                                               Hotel
                                         lier and re ects widening divergence in in-                              $50                                             Land
                                         vestor outlook across core and peripheral
                                         European markets. Pricing was also gener-                                $40
                                         ally at in Q2 across EMEA and yields on
                                         acquisitions have changed little since the                               $30
                                         beginning of the year.
                                                                                                                  $20
                                            Among property types, retail was the big-
                                         gest gainer in H1’11 with volume up 41
                                                                                                                  $10
                                         boosted by billion-dollar transactions such
                                         as Tra ord Centre in Manchester, Centr0 in                                 $0
                                                                   Oberhausen and a
                 TRANSACTION SUMMARY                                                                                             1 2         3         4     1 2          3         4      1 2      3     4    1 2
                                                                   major Tesco portfo-                                          '08                         '09                           '10                 '11
                         Q2'11      YOY        H1’11       YOY     lio in the UK. e of-
                        Vol ($B)    Chg       Vol ($B)     Chg       ce and hotel sectors                             PERCENT CHANGE IN TRANSACTION VOLUME
Office                       $18.0     40%        $33.7       31%                                                                                           (H1’10 VS H1’11)
                                                                   also recorded healthy                                 <-50%   -
                                                                                                                                 50–0%                     0–20% 20–50% 50–100%                           >100%
Retail                       12.1     26%          29.2      41%
                                                                   gains in transaction                                     DECREASE                                    INCREASE
Industrial                    2.8    -35%           7.1      -1%
All Commercial               32.9     23%          70.0      31%
                                                                   volume while indus-
Hotel                         2.6     47%           5.6      39%   trial and apartment                                                                                        FIN
                                                                                                                                                 NOR
Apartment                     5.3    -33%           8.1     -25%   volume fell     .
Land                          1.8    -20%           3.7     -11%      Germany and the                                                                      SWE
                                                                                                                                        DNK
Total                       $42.5     10%        $87.4       21%   Nordic      countries                                                                                                      RUS

*Totals may not sum due to rounding                                have emerged as fa-                                    IRL
                                                                                                                                        NLD
                            CAN                                                                                                  GBR                              POL
                                         voured investment targets in the current                                                        BEL
                                                                                                                                                   DEU
                                                                                                                                                            CZE
                                         market and all posted robust gains in trans-                                                  FRA
                                                                                                                                                                SVK
                                                                                                                                                           AUT HUN
                                                                                                                                                                                        UKR
                                                                                                                                                 CHE
                                         action activity in each quarter this year.                                                                ITA
                                                                                                                                                              HRV         ROU
                                                                                                                                                                    SRB
                                             is helped o set signi cant Q2’11                                                                MCO
                                                                                                                                                                  MNE BGR


                 USA
                                         declines in the UK and France of 25 and                                   PRT          ESP
                                                                                                                                                                        GRC                TUR
                                         20 , respectively, in addition to continued
                                         weak performance in the peripheral mar-                                                                                                    ISR
                                         kets such as Greece, Portugal, Spain and
              MEX
                                         Ireland. Investors are ocking to Germany                                                                                                                             QAT
                                         and Scandinavia which currently o er the                                                                                                                       SAU    ARE


                                         highest risk adjusted yields (see page 7).
                                         Germany’s Q2’11            growth of 65 was
                                         well ahead of its H1’11 gain of 54 (and the
                                         UK’s 14 ) as domestic and cross-border
                                         demand broadened. Sweden, the hottest
                                         Nordic market, saw           growth of 55 for
                                         H1’11. With the strong exception of Russia’s
                                       PER

                                         34           decline, Eastern European activ-
                                                              BRA
                                         ity remained stable, with core properties in
                                         key markets attracting increased attention
                                         from yield-seeking investors. In the Middle
                                         East, both Israel and the United Arab Emir-
                                          CHL
                                         ates saw a steep fallo in activity in H1.                                                                                      ZAF
                                                          ARG

©2011 Real Capital Analytics, Inc. All rights reserved. Data believed to be accurate but not guaranteed; subject to future revision; based on properties & portfolios $10m and greater.
                                                                                                                                                                                                                     5
AUGUST 2011
                                                                                                                                                                       MID-YEAR REVIEW


                                                A
                                                      mong markets, positive       growth                                        RECENTLY BUILT OR RENOVATED
                                                      has slowed but been maintained in                                                 OFFICE BUILDING SALES IN Q2
                                                      London and Paris indicating the                                                                   Price         PPSF/            Built/
                                                                                                                         Property           City                              Cap Rate
                                                investment trends in secondary markets                                                                  ($M)         PPU ($K)          Renov
                                                in the UK and France continue to under-                            Selmer Building       Oslo               $166.7     1,006     4.5%      2008
                                                perform. However, ve German metros
                                                                                                                   Origami               Paris               124.0     2,421     4.7%     r2010
                                                now occupy the top markets list, with all
                                                showing positive investment growth.                                Guim'arts             Brussels             46.7       620     5.4%     r2010
                                                  Cap rates on commercial properties in
                                                                                                                   DB Twin Towers        Frankfurt           857.4     1,062     5.5%     r2010
                                                Western Europe and the UK are closely
                                                aligned averaging between 6.6 and                                  1 Finsbury Circus     London              236.5     1,183     5.5%     r2009
                                                6.7 . Average cap rates in Eastern Europe
                                                record a decline in Q2, but are skewed by
                                                a higher quality of properties trading as                          ovated o ce buildings in select European markets
                                                investors seek to minimize risk. Recent                            illustrate the premium prices commanded by the
                                                prices and cap rates for new or newly ren-                         highest quality properties.


                                                                                  QUARTERLY TRANSACTION SUMMARY BY THEATER
                                                                                                      OFFICE, RETAIL AND INDUSTRIAL
                                                                 UNITED KINGDOM                                   WESTERN EUROPE                                      EASTERN EUROPE
                                                                      CAP RATES*                                       CAP RATES*                                         CAP RATES*
                                                 9.0%                                             9.0%                                               9.0%
                                                 8.5%                                             8.5%                                               8.5%
                                                 8.0%                                             8.0%                                               8.0%
                                                 7.5%                                             7.5%                                               7.5%
                                                 7.0%                                             7.0%                                               7.0%
                                                 6.5%                                             6.5%                                               6.5%
                                                 6.0%                                             6.0%                                               6.0%
                                                 5.5%                                             5.5%                                               5.5%
                                                                     TRANSACTION                                       TRANSACTION                                        TRANSACTION
                                                  $35 Billion 2 3 4 1 2 3 4 1 2 3 4 1 2
                                                           1                                        $35 Billion 2 3 4 1 2 3 4 1 2 3 4 1 2
                                                                                                             1                                         $35 Billion 2 3 4 1 2 3 4 1 2 3 4 1 2
                                                                                                                                                                1
                                                          '08       '09     '10     '11                     '08       '09     '10     '11                      '08       '09     '10     '11
                                                  $30                                               $30                                                $30
                                                  $25                                               $25                                                $25
                                                  $20                                               $20                                                $20
                                                  $15                                               $15                                                $15
                                                  $10                                               $10                                                $10
                                                   $5                                                $5                                                $5
                                                   $0                                                $0                                                $0

                                                          1 2 YOY4 1 2 3 IN TRANS3VOL 1 2
                                                               3 CHANGE 4 1 2       4                       1 2 YOY4CHANGE IN TRANS3VOL 1 2
                                                                                                                 3    1 2 3 4 1 2    4                          1 2 YOY4 1 2 3 IN TRANS3VOL 1 2
                                                                                                                                                                     3 CHANGE 4 1 2      4
                                                150%                                              150%                                               150%
                                                         '08       '09      '10       '11                  '08       '09      '10      '11                     '08       '09      '10      '11
                                                100%                                              100%                                               100%

                                                 50%                                               50%                                                50%

                                                   0%                                               0%                                                 0%

                                                 -50%                                             -50%                                               -50%

                                                -100%                                            -100%                                               -100%
                                                          1 2 3 4 1 2 3 4 1 2 3 4 1 2                       1 2 3 4 1 2 3 4 1 2 3 4 1 2                         1 2 3 4 1 2 3 4 1 2 3 4 1 2
                                                         '08      '09     '10     '11                      '08      '09     '10     '11                        '08      '09     '10     '11
                                                          *Two quarter rolling average
©2011 Real Capital Analytics, Inc. All rights reserved. Data believed to be accurate but not guaranteed; subject to future revision; based on properties & portfolios $10m and greater.
                                                                                                                                                                                             6
AUGUST 2011
                                                                                                                                                                              MID-YEAR REVIEW


                                                            Europe: Investment Momentum Linked To Risk

                                                           L
                                                                ooking at investment volume increases                                      action volume growth both on a six-month and
                                                                across European markets and comparing                                      quarterly basis. ey include a higher propor-
                                                                spreads between cap rates and relevant                                     tion of non-eurozone countries with more stable
                                                           government bonds, it is clear that the momen-                                   economic conditions. Countries plotted in the
                                                           tum of real estate investment in Europe is ow-                                  lower le quadrant, notably Spain and Portugal,
                                                           ing towards the highest relative yields in the                                  are experiencing negative transaction momen-
                                                           safest markets.                                                                 tum. e UK on a half-year basis         escapes
                                                                e upper right quadrant of the momentum                                     this grouping, but its lower Q2’11 volume
                                                           graph highlights the focus of capital on Ger-                                   re ects a weakening market. Among the outli-
                                                           many and Sweden in response to the attractive                                   ers, Ireland saw already low volume falter in
                                                           cap rate spread over government bonds through                                   Q2’11, while Russia’s good Q2 re ects a major
                                                           Q2’11. Like Germany and the Nordics, the other                                  luxury Moscow hotel acquired by Kazakhstan
                                                           countries in this quadrant display strong trans-                                backed private equity.

      CAP RATE SPREADS                                                                                     INVESTMENT MOMENTUM BY COUNTRY
                                                                                                                             ALL PROPERTY TYPES
     TO SOVEREIGN BONDS
 Cap Rate          Gov't Bond         Spread                                                                                                                                   Switzerland


             0    100 200 300 400
                                                                                                                                                         Finland

                                                                      100%

Sweden
                                                                      80%                                                   Turkey
                                                                                                                                           Belgium


                                                                                                                                Sweden                   Denmark
                                                                      60%
Germany
                                                                                                  Russia
                                                                                                                            Norway
                                                                      40%
                                               Q2’11 vs Q2’10 % Chg


                                                                                                                                         Germany
      UK
                                                                      20%                                                                                                         Czech Republic
                                                                                                                            Hungary

                                                                       0%
                                                                                                       Netherlands
 France
                                                                                                                                          Italy
                                                                                                      France
                                                                      -20%

                                                                                                                                      Poland
    Italy                                                             -40%                          Spain
                                                                                                                     United Kingdom

                                                                                                                                                                    Ireland
                                                                      -60%
                                                                                                                                      Ukraine
                                                                                       Portugal
   Spain
                                                                                                           Austria
                                                                      -80%

                                                                                                                                               Romania                                       Croatia
                                                                             *Greece
            0% 2% 4% 6% 8%
                                                                                -60%        -40%       -20%            0%      20%     40%     60%            80%      100%   120%
                                                                                                                            H1’11 vs H1’10 % Chg
                                                  *No significant transactions recorded for Greece over the last 12 months. Based on percent change in Euros
 ©2011 Real Capital Analytics, Inc. All rights reserved. Data believed to be accurate but not guaranteed; subject to future revision; based on properties & portfolios $10m and greater.
                                                                                                                                                                                                   7
AUGUST 2011
                                                                                                                                                                      MID-YEAR REVIEW


  EMEA: Top Deals and Players in H1’11
                                                                                                     TOP 25 PROPERTY SALES
       TOP 20 BUYERS#                                                                                                Price        SF(K)/ PPSF/
                                               Type              Transaction                      Location                                                       Buyer
                                                                                                                     ($M)         Units PPU (K)
                               Vol            1 RET The Trafford Centre†                  Manchester, GBR             $2,498       1,900 $1,315 Capital Shopping Ctrs Grp PLC (CSC)
                              ($M)
                                              2 RET Centr0†                               Oberhausen, DEU               1,913       2,174        880 Canada Pension Plan Investment Board
Capital Shopping Ctrs Grp PLC $2,498
                                              3 OFF Deutsche Bank Twin Towers             Frankfurt, DEU                  857        807       1,062 DWS Investments Gmbh
CA Immo                        2,402
                                              4 OFF Chiswick Park                         London, GBR                     781       1,900        411 Blackstone
Tesco Pension Trustees Limited       2,200
CPP Investment Board                 1,913    5 RET La Rinascente                         Milan, ITA                      652        566       1,151 First Atlantic Real Estate SGR
Arminius Funds Management            1,457    6 HTL Ritz Carlton HTL                      Moscow, RUS                     609        334       1,824 Verny Capital
Cerberus Capital Management          1,215    7 RET Boulevard Berlin                      Berlin, DEU                     533        753         707 Corio NV
DekaBank                             1,179    8 OFF Rolls Building                        London, GBR                     492        262       1,880 Legal & General Property
Deutsche Bank                        1,160    9 OFF MidCity Place†                        London, GBR                     468        352       1,329 Oxford Properties Group
AMF                                   948    10 OFF Aviva Tower                           London, GBR                     439         315      1,393 Kuok Khoon Hong & Martua Sitorus
AEW Capital Management                788    11 OFF River Court                           London, GBR                     437         425      1,029 Chinese Estates Group
Invesco Real Estate                   786    12 OFF 10 Aldermanbury                       London, GBR                     434         312      1,393 JP Morgan
Blackstone                            781    13 OFF River Ouest                           Bezons, FRA                     400         689        581 ING RE Invt Mgmt France OBO Predica SA‡
Signa Holding                         721
                                             14 OFF 20 Gresham St                         London, GBR                     374         237      1,580 AXA RE Investments Managers (REIM)
Corio NV                              716
                                             15 OFF Park House                            London, GBR                     366         310      1,180 Qatar National Bank
Amdec Property Development            686
First Atlantic Real Estate SGR        652    16 HTL Paris Marriott Champs-Elysees Paris, FRA                              362         192      1,887 Abu Dhabi Investment Authority
Prudential PLC                        640    17 RET Spitalerstrasse 22-26†                Hamburg, DEU                    361          55      6,560 Signa Holding
Legal & General Property              631    18 HTL Le Meridien Montparnasse              Paris, FRA                      350         953        367 Unibail-Rodamco
Real I.S. AG                          612    19 OFF Belgrave House†                       London, GBR                     347         280      1,239 TIAA-CREF (fund)
Verny Capital                         609    20 RET Jubilee & West End Houses             London, GBR                     342         121      2,834 Pontegadea Inversiones SL
                                             21 RET Schloss Arkaden                       Braunschweig, DEU               335         597        561 Deka Immobilien Investment GmbH
                                             22 OFF Defense Plaza                         Puteaux, FRA                    325         335        969 Northwood Investors LLC
       TOP 20 SELLERS #                      23 RET Eden Shopping Centre†                 High Wycombe, GBR               313         850        368 Aldersgate Investments
                                     Vol     24 RET Marmara Park†                         Istanbul, TUR                   302       1,076        281 DWS Investments Gmbh
                                    ($M)
                                             25 RET Wankdorf Shopping Centre              Bern, CHE                       300         678        442 UBS JV Swissreal Investments Ltd
Peel Group                          $2,498
Volksbank AG                         2,426
Tesco plc                            2,223                                                          TOP 15 PORTFOLIO SALES
Stadium Group                        1,913                                                                           Price        SF(K)/ PPSF/
                                               Type              Transaction                      Location                                                       Buyer
Deutsche Bank                        1,782                                                                           ($M)         Units PPU (K)
Aberdeen Property Investors          1,541    1 RET Tesco RET Portfolio 11                Multiple, GBR               $2,200      $3,500   $629 Tesco Pension Trustees Limited
Eurocastle                           1,544    2 MIX Europolis MIX Eastern Euro Ptfl 11 Multiple, Europe                  2,009     13,011         154 CA Immobilien Anlagen AG
Unibail-Rodamco                      1,242    3 OFF Eurocastle Mars Fixed 1 Ptfl 2011† Berlin, DEU                       1,457       4,989        292 Arminius Funds Management
Beacon Capital Partners              1,043    4 RET Metro RET Portfolio 11                Multiple, DEU                 1,215       9,688        125 Cerberus Capital Management
Fourth Swedish Nat'l Pension Fund      948    5 APT Dombron Intressenter ptߠ             Sweden other                    948       8,281        115 AMF Fastigheter
Morgan Stanley                        922     6 MIX Melrose Arch†                         Melrose North, ZAF              686       1,808        332 Amdec Property Development
Pirelli & C. Real Estate SpA          804     7 HTL MSREF HTL Portfolio 11                Multiple, Europe                621       2,537        245 Toufic Aboukhater
ECE Projektmanagement                 817     8 MIX NR Nordic & Russia Props Ltd Mix Ptfl 11 Multiple, Europe             542       8,872         61 Kungsleden AB
Schroders plc                         781
                                              9 APT Genesis Housing APT Ptfl 11†           London, GBR                     464       1,630        284 Grainger plc
Stanhope Plc                          781
                                             10 MIX ECE MIX portfolio 2011†               Hamburg, DEU                    435        665         655 Real I.S. AG
Kuwait Investment Authority           741
                                             11 RET Rubin Moscow RET Ptfl 2011             Moscow, RUS                     428       1,017        421 Yuri and Alexei Hotin
Highstreet Holding                    760
GE Capital                            734    12 IND VGP IND Portfolio 11†                 Prague, CZE                     414       4,629         89 AEW Europe JV Tristan Capital Partners
Hermes                                678    13 RET Unibail RET Portfolio 11              Multiple, SWE                   379       1,002        379 Grosvenor‡
Investitori Associati                 652    14 RET Karstadt Highstreet Ptfl 2011          Multiple, DEU                   370        524         706 Quantum Immobilien AG
                                             15 RET Highstreet Karstadt Ptfl               Munich, DEU                     361        570         632 Signa Holding‡

 # Full credit to each JV partner, 100% valuation given *Estimated † Partial Interest ‡ JV


 ©2011 Real Capital Analytics, Inc. All rights reserved. Data believed to be accurate but not guaranteed; subject to future revision; based on properties & portfolios $10m and greater.
                                                                                                                                                                                            8
AUGUST 2011
                                                                                                                                                                                                                                  MID-YEAR REVIEW

    EMEA: Transactions by Market in H1’11
                                                             APARTMENT                 INDUSTRIAL                   OFFICE                    RETAIL                    HOTEL                    LAND SITE         GRAND TOTAL*         YOY CHANGE
                                                          Vol ($M)      # Props     Vol ($M)     # Props     Vol ($M)      # Props     Vol ($M)     # Props      Vol ($M)     # Props     Vol ($M)      # Props   Vol ($M)   # Props     Vol        Props
                  Austria          Austria, all                 $72           2                                     $72          2          $258          3           $316          5                                 $717      12         -19%       -45%
                  Belgium          Belgium, all                  21           1            92           3           914         20            58          3             88          2                                1,173      29          47%         16%
                  Bulgaria         Bulgaria, all                                                                                              62          3                                                             62       3        -52%        -25%
                  Czech Republic   Czech Republic, all                                    414           7           445          8           304          5                                                          1,163      20        168%          25%
                                   Copenhagen                    43           3            45           2           318          8           347          6             72          1                                  825      20          81%       100%
                  Denmark
                                   Denmark other                 18           1            65           4           151          2             9          1                                                            243       8            7%      100%
                  Baltic States    Baltic States                                                                     25          1           299          7             17           1                                 341       9        994%        350%
                                   Helsinki                      60           4            28          2            552         10           152          3                                                            792      19        226%          58%
                  Finland
                                   Finland other                 29           3            84          5             85          9            86         11                                       101        3         384      31            3%      107%
                                   Paris                        183           4           237          7          4,699         83           378         42          1,080         41                                6,578     177          41%         51%
                  France
                                   France other                 286           8           282         28            519         17         1,260         23            196          5                                2,543      81        -47%        -49%
                                   Berlin-Brandenburg           989          39            27          1          1,813         36           886         12            152          3             200        4       4,068      95          53%        -13%
                                   Hamburg                      341          24           216          8          1,413         24         1,056          6             52          2             125        4       3,203      68        309%        209%
                                   Munich                       286          18           178          3            321          9           501          8             36          3             119        5       1,441      46          10%         59%
                                   Frankfurt/Rhine-Main          79           4            80          1          1,294          8           298          8            221          5             297        6       2,269      32        175%         -14%
                  Germany
                                   Stuttgart                     11           1            38          2            106          4           142          4             21          1             100        1         420      13          23%          -7%
                                   Rhine-Ruhr                   345          27            48          3            704         14         2,348         27             27          1             204        7       3,676      79          12%       -66%
                                   Saxon Triangle               227         103            55          1             45          3           413          7             22          1              13        1         775     116          11%       625%
                                   Germany other                564         216            49          2            315         11         3,293        138            228          5             207        8       4,657     380          37%       222%
                  Greece           Greece, all                                                                                                                                                                                           -100%       -100%
                  Hungary          Hungary, all                                           128           2           169          3           100           1            69          1              35        2         501        9         22%       125%
                  Ireland          Ireland,all                                                                      346          4                                                                                     346        4       111%        -43%
                                   Rome                                                                             263          6           66           1             96          1                                  425        8       -46%            0%


       Europe
                  Italy
                                   Italy other                                             13          1            900         17        1,029           7             87          2                                2,029       27       102%            4%
                  Netherlands      Netherlands, all             274          29           434         19          1,035         32          483          16             41          2              30        2       2,297      100           7%        -3%
                  Norway           Norway, all                   28           2           121          6            950         14          403           6                                        10        1       1,512       29         22%           0%


EMEA
                  Poland           Poland, all                                            220          8            897         11          543           6             42          2             113        5       1,815       32         40%         28%
                  Portugal         Portugal, all                 40           3            55          3                                     59           1             70          3             150        4         373       14       -57%        -60%
                  Romania          Romania, all                                            46          1           201           3           18           2                                       195        2         459        8         59%       -27%
                                   Moscow                                                 165          2           331           3          628           3            639           2                               1,763       10       -20%        -58%
                  Russia
                                   Russia other                   20          1            52          2            18           1          150           2                                        21        1         261        7       -69%         -91%
                                   Madrid                         28          1            21          1           170           3          325         237            189          5              37        1         770      248       -40%        700%
                  Spain
                                   Spain other                                            183          8           187           4          570         248            443         10             187        5       1,569      275        -24%       -40%
                                   Stockholm                    771          45           288         22           716          17          696           7            118          2             182        2       2,769       95         20%         16%
                  Sweden
                                   Sweden other               1,963         134         1,042         69         1,504         119          581          26             47          5              62        3       5,198      356         82%         88%
                  Switzerland      Switzerland, all                                       189          3           483           5          326           2             94          2                                1,092       12       162%          20%
                  Turkey           Turkey, all                                             13          1           132           3          462           2             39          2              24        1         670        9         38%       -25%
                                   London Metro                 958          17           227         16         9,434         108        1,338          21            291         13             196        5      12,444      180         19%         -8%
                                   Manchester Metro                                        39          2            89           4        2,572           4            245          4                                2,945       14       263%        -46%
                  United Kingdom
                                   Scotland                                               166          4            60           3          364          10                                        16        1         606       18       -50%        -67%
                                   UK other                     125           4         1,205         53         1,458          48        5,159          93            319           9             87        4       8,353      211          -7%      -56%
                  Ukraine          Ukraine all                                            499          1            25           1          200           3                                                            724        5         40%       -38%
                  Europe other     Europe                                                                          112           3          295           1           102           2            14         1          523        7         52%       -36%
                  Total                                      $7,763        694         $7,043        303       $33,270         681      $28,517       1,016        $5,459         143        $2,723        79      $84,775    2,916         22%           2%
                  Israel           Israel, all                  306          2                                      62           3          177           3                                     256         5          801       13       -22%        -32%
                                   Dubai                                                                                                                                                        483         6          483        6       -36%        -67%
                  UAE
                                   UAE, all                                                                                                                                                     165         2          165        2             -           -
                  Mid-East other   Saudi Arabia, all                                                                                                                                             67         1           67        1       -16%            0%


       Mid-East
                  Total                                        $306           2                                    $62           3          $177           3                                     $972      14       $1,516      22       -18%        -42%
                  Africa           Africa, all                                             89           1          319           3           546           6            98          3             20         1       1,071      14         -6%          0%
 Africa
                  Total                                                                   $89           1         $319           3          $546           6           $98          3            $20         1      $1,071      14         -6%          0%
       ©2011 Real Capital Analytics, Inc. All rights reserved. Data believed to be accurate but not guaranteed; subject to future revision; based on properties & portfolios $10m and greater.
9
AUGUST 2011
                                                                                                                                                                           MID-YEAR REVIEW


                                                      Asia Pacific: Quarter in Review Summary

                                                      S
                                                             ales of signi cant properties in                            QUARTERLY TRANSACTION VOLUME
                                                             Asia Paci c totaled $67.2 in Q2’11, $120 Billion                      BY PROPERTY TYPE
                                                             bringing the total for the rst half                                     Commercial
                                                    of 2011 to $170.8 . While the region con-                                        Apartment
                                                                                                            $100
                                                    tinues to show solid, steady growth in                                           Hotel
                                                    commercial property investment, some                                             Land
                                                    signi cant changes were noted in Q2 as $80
                                                    investment surged in Australia and plum-
                                                    meted in Japan. Hong Kong recovered $60
                                                    from a relatively poor Q1 with a stronger
                                                    Q2 to be at at the mid-year point while $40
                                                    Singapore’s 119 increase in transactions
                                                    in H1 topped every major economy glob- $20
                                                    ally except the US.
                                                        Also noteworthy, cross-border inves-
                                                                                                              $0
                                                    tors were part of the surge in transactions
                                                                                      in Australia and                1 2 3 4 1 2 3 4 1 2 3 4 1 2
                       TRANSACTION SUMMARY                                            Singapore, and the             '08          '09            '10            '11
                               Q2'11         YOY           H1’11           YOY        buyers included a       PERCENT CHANGE IN TRANSACTION VOLUME
                              Vol ($B)       Chg          Vol ($B)         Chg        healthy mix of Eu-                        (H1’10 VS H1’11)
                                                                       FIN
      Office                        $8.5          -8%
                                                   NOR        $22.2           14%     ropean and North         <-50% -   50–0% 0–20% 20–50% 50–100% >100%
      Retail                         5.1         75%             9.8          15%     American invest-            DECREASE                   INCREASE
                                                         SWE
      Industrial                     2.9         71%             4.9          52%
                                              DNK                                 RUS ment     rms which
      All Commercial               16.5          19%            36.9          18%
                                             NLD                                      have been relatively
      Hotel                       IRL1.6GBR      13%             2.5         -11%
                                                     DEU
                                                               POL                    quiet since 2007.
      Apartment                      2.0         46% CZE 4.0
                                               BEL                            25%
      Land                         47.2                         SVK           UKR       South Korea also
                                            FRA 15%       AUT 127.4
                                                               HUN
                                                                              11%
      Total                       $67.2
                                                   CHE
                                                 17% ITA    $170.8 ROU 12%
                                                            HRV                       posted strong results
                                                                 SRB
      *Totals may not sum due to rounding        MCO
                                                              MNE BGR                 in each quarter this
                             PRT       ESP
                                                                   GRC          TUR   year and its 80 in-
                                                                                                                                                      KOR
                                                    crease in H1 was the second highest in Asia.                                                            JPN
                                                                                                                               CHN
                                                         e only countries in Asia Paci c where in-
                                                                           ISR

                                                    vestment momentum appears waning and
                                                    volume fell in both quarters this year were
                                                                                              QAT
                                                                                               ARE                                                TWN
                                                                                         SAU
                                                    India, Taiwan and New Zealand.                                  IND                      HKG

                                                        Across Asia Paci c, growth accelerated                                 THA
                                                    in the second quarter in every property                                              VNM

                                                    type save o ce, which is largely due to
                                                    curtailed investment in Japan. In China,                                        MYS

                                                    sales of o ce and retail properties nearly                                      SGP

                                                    doubled in H1’11 while sales of develop-
BRA
                                                    able land moderated in Q2 as China’s
                                                    long-running e orts to calm exuber-
                                                    ant sales appear to be bearing fruit. In
                                                    addition, transactions in China’s over-
                                                    heated primary markets dropped as ac-                                                               AUS

                                                    tivity moved to secondary and tertiary
                                                                   ZAF

                                                    cities. Land rights in China accounted for
                                                    $38.7 in Q2, up slightly on a year-over-
                                                    year basis, but half of levels recorded in
                                                    the two most recent quarters.

      ©2011 Real Capital Analytics, Inc. All rights reserved. Data believed to be accurate but not guaranteed; subject to future revision; based on properties & portfolios $10m and greater.
                                                                                                                                                                                                10
Mid-Year Review: US, Germany, Singapore Lead in Dynamic CRE Markets

Mais conteúdo relacionado

Destaque

Как вашей компании работать с блогерами
Как вашей компании работать с блогерами Как вашей компании работать с блогерами
Как вашей компании работать с блогерами Mayya Bogdanova
 
2015 07 23 Telegraaf_Drempel ledbuizen weg
2015 07 23 Telegraaf_Drempel ledbuizen weg2015 07 23 Telegraaf_Drempel ledbuizen weg
2015 07 23 Telegraaf_Drempel ledbuizen wegKevin Ho
 
Ciberdelicuencia vs. ciberseguridad
Ciberdelicuencia vs. ciberseguridadCiberdelicuencia vs. ciberseguridad
Ciberdelicuencia vs. ciberseguridadPaloma LLaneza
 
6月aaee讀書會總整理
6月aaee讀書會總整理6月aaee讀書會總整理
6月aaee讀書會總整理aaee2006
 
Sorina Teleanu
Sorina TeleanuSorina Teleanu
Sorina TeleanuArm Igf
 
Respeto al medio ambiente..
Respeto al medio ambiente..Respeto al medio ambiente..
Respeto al medio ambiente..2C3G
 

Destaque (7)

Как вашей компании работать с блогерами
Как вашей компании работать с блогерами Как вашей компании работать с блогерами
Как вашей компании работать с блогерами
 
2015 07 23 Telegraaf_Drempel ledbuizen weg
2015 07 23 Telegraaf_Drempel ledbuizen weg2015 07 23 Telegraaf_Drempel ledbuizen weg
2015 07 23 Telegraaf_Drempel ledbuizen weg
 
New vocabulary
New vocabularyNew vocabulary
New vocabulary
 
Ciberdelicuencia vs. ciberseguridad
Ciberdelicuencia vs. ciberseguridadCiberdelicuencia vs. ciberseguridad
Ciberdelicuencia vs. ciberseguridad
 
6月aaee讀書會總整理
6月aaee讀書會總整理6月aaee讀書會總整理
6月aaee讀書會總整理
 
Sorina Teleanu
Sorina TeleanuSorina Teleanu
Sorina Teleanu
 
Respeto al medio ambiente..
Respeto al medio ambiente..Respeto al medio ambiente..
Respeto al medio ambiente..
 

Semelhante a Mid-Year Review: US, Germany, Singapore Lead in Dynamic CRE Markets

Equity Insight Issue 480
Equity Insight  Issue 480Equity Insight  Issue 480
Equity Insight Issue 480Charlie1972
 
The Real Estate Tech Insights Report
The Real Estate Tech Insights ReportThe Real Estate Tech Insights Report
The Real Estate Tech Insights ReportMike DelPrete
 
Rebuilding the ipo on ramp-final slide-share
Rebuilding the ipo on ramp-final slide-shareRebuilding the ipo on ramp-final slide-share
Rebuilding the ipo on ramp-final slide-shareMatthew Stotts
 
Looking beyond the obvious - Globalization and new opportunities for growth
Looking beyond the obvious - Globalization and new opportunities for growthLooking beyond the obvious - Globalization and new opportunities for growth
Looking beyond the obvious - Globalization and new opportunities for growthEY
 
lowe's Annual Report1998
lowe's Annual Report1998lowe's Annual Report1998
lowe's Annual Report1998finance5
 
Santander Investor Day 2011
Santander Investor Day 2011Santander Investor Day 2011
Santander Investor Day 2011BANCO SANTANDER
 
338  Chapter 22Analysis of Financial StatementsChapter 22An.docx
338  Chapter 22Analysis of Financial StatementsChapter 22An.docx338  Chapter 22Analysis of Financial StatementsChapter 22An.docx
338  Chapter 22Analysis of Financial StatementsChapter 22An.docxgilbertkpeters11344
 
Resultados 2 q09
Resultados 2 q09Resultados 2 q09
Resultados 2 q09SiteriCR2
 
Resultados 2 Q09
Resultados 2 Q09Resultados 2 Q09
Resultados 2 Q09CR2
 
Resultados 2Q09
Resultados 2Q09Resultados 2Q09
Resultados 2Q09CR2
 
Economic reports and outlooks - Québec City CMA, 2014-2015
Economic reports and outlooks - Québec City CMA, 2014-2015Economic reports and outlooks - Québec City CMA, 2014-2015
Economic reports and outlooks - Québec City CMA, 2014-2015Université Laval
 
090202 Bi Weekly Newsletter
090202 Bi Weekly Newsletter090202 Bi Weekly Newsletter
090202 Bi Weekly Newsletterdbaestaens
 
1 q09 presentation
1 q09 presentation1 q09 presentation
1 q09 presentationSiteriCR2
 
1Q09 Earnings Presentation
1Q09 Earnings Presentation1Q09 Earnings Presentation
1Q09 Earnings PresentationCR2
 

Semelhante a Mid-Year Review: US, Germany, Singapore Lead in Dynamic CRE Markets (20)

Realestatereport2011
Realestatereport2011Realestatereport2011
Realestatereport2011
 
Equity Insight Issue 480
Equity Insight  Issue 480Equity Insight  Issue 480
Equity Insight Issue 480
 
The Real Estate Tech Insights Report
The Real Estate Tech Insights ReportThe Real Estate Tech Insights Report
The Real Estate Tech Insights Report
 
Rebuilding the ipo on ramp-final slide-share
Rebuilding the ipo on ramp-final slide-shareRebuilding the ipo on ramp-final slide-share
Rebuilding the ipo on ramp-final slide-share
 
Looking beyond the obvious - Globalization and new opportunities for growth
Looking beyond the obvious - Globalization and new opportunities for growthLooking beyond the obvious - Globalization and new opportunities for growth
Looking beyond the obvious - Globalization and new opportunities for growth
 
Real Estate Investment : Latin America 2010
Real Estate Investment : Latin America 2010Real Estate Investment : Latin America 2010
Real Estate Investment : Latin America 2010
 
lowe's Annual Report1998
lowe's Annual Report1998lowe's Annual Report1998
lowe's Annual Report1998
 
Market Commentary November 2009
Market Commentary   November 2009Market Commentary   November 2009
Market Commentary November 2009
 
Q1 2009 Earning Report of CNH Global N.V.
Q1 2009 Earning Report of CNH Global N.V.Q1 2009 Earning Report of CNH Global N.V.
Q1 2009 Earning Report of CNH Global N.V.
 
citigroup Financial Supplement
citigroup Financial Supplementcitigroup Financial Supplement
citigroup Financial Supplement
 
Santander Investor Day 2011
Santander Investor Day 2011Santander Investor Day 2011
Santander Investor Day 2011
 
338  Chapter 22Analysis of Financial StatementsChapter 22An.docx
338  Chapter 22Analysis of Financial StatementsChapter 22An.docx338  Chapter 22Analysis of Financial StatementsChapter 22An.docx
338  Chapter 22Analysis of Financial StatementsChapter 22An.docx
 
Resultados 2 q09
Resultados 2 q09Resultados 2 q09
Resultados 2 q09
 
Resultados 2 Q09
Resultados 2 Q09Resultados 2 Q09
Resultados 2 Q09
 
Resultados 2Q09
Resultados 2Q09Resultados 2Q09
Resultados 2Q09
 
Economic reports and outlooks - Québec City CMA, 2014-2015
Economic reports and outlooks - Québec City CMA, 2014-2015Economic reports and outlooks - Québec City CMA, 2014-2015
Economic reports and outlooks - Québec City CMA, 2014-2015
 
090202 Bi Weekly Newsletter
090202 Bi Weekly Newsletter090202 Bi Weekly Newsletter
090202 Bi Weekly Newsletter
 
1 q09 presentation
1 q09 presentation1 q09 presentation
1 q09 presentation
 
1Q09 Earnings Presentation
1Q09 Earnings Presentation1Q09 Earnings Presentation
1Q09 Earnings Presentation
 
cam_2008ar
cam_2008arcam_2008ar
cam_2008ar
 

Último

Partner With the Golden Life Community for Single Women Over 55
Partner With the Golden Life Community for Single Women Over 55Partner With the Golden Life Community for Single Women Over 55
Partner With the Golden Life Community for Single Women Over 55Ron Surz
 
Namrata 7 Plumeria Drive Pimpri Chinchwad Pune Brochure.pdf
Namrata 7 Plumeria Drive Pimpri Chinchwad Pune Brochure.pdfNamrata 7 Plumeria Drive Pimpri Chinchwad Pune Brochure.pdf
Namrata 7 Plumeria Drive Pimpri Chinchwad Pune Brochure.pdfPrachiRudram
 
Call Girls in Sarai Kale Khan Delhi 💯Call Us 🔝8264348440🔝
Call Girls in Sarai Kale Khan Delhi 💯Call Us 🔝8264348440🔝Call Girls in Sarai Kale Khan Delhi 💯Call Us 🔝8264348440🔝
Call Girls in Sarai Kale Khan Delhi 💯Call Us 🔝8264348440🔝soniya singh
 
9990771857 Call Girls in Noida Sector 10 Noida (Call Girls) Delhi
9990771857 Call Girls in Noida Sector 10 Noida (Call Girls) Delhi9990771857 Call Girls in Noida Sector 10 Noida (Call Girls) Delhi
9990771857 Call Girls in Noida Sector 10 Noida (Call Girls) Delhidelhimodel235
 
Prestige Rainbow Waters Raidurgam, Gachibowli Hyderabad E- Brochure.pdf
Prestige Rainbow Waters Raidurgam, Gachibowli Hyderabad E- Brochure.pdfPrestige Rainbow Waters Raidurgam, Gachibowli Hyderabad E- Brochure.pdf
Prestige Rainbow Waters Raidurgam, Gachibowli Hyderabad E- Brochure.pdffaheemali990101
 
The Omaxe State Dwarka Delhi-broucher.pdf.pdf
The Omaxe State Dwarka Delhi-broucher.pdf.pdfThe Omaxe State Dwarka Delhi-broucher.pdf.pdf
The Omaxe State Dwarka Delhi-broucher.pdf.pdfkratirudram
 
Ryan Mahoney - How Property Technology Is Altering the Real Estate Market
Ryan Mahoney - How Property Technology Is Altering the Real Estate MarketRyan Mahoney - How Property Technology Is Altering the Real Estate Market
Ryan Mahoney - How Property Technology Is Altering the Real Estate MarketRyan Mahoney
 
DLF Plots Sriperumbudur in Chennai E Brochure Pdf
DLF Plots Sriperumbudur in Chennai E Brochure PdfDLF Plots Sriperumbudur in Chennai E Brochure Pdf
DLF Plots Sriperumbudur in Chennai E Brochure Pdfashiyadav24
 
Managed Farmland Brochures to get more in
Managed Farmland Brochures to get more inManaged Farmland Brochures to get more in
Managed Farmland Brochures to get more inknoxdigital1
 
Low Rate Call Girls in Triveni Complex Delhi Call 9990771857
Low Rate Call Girls in Triveni Complex Delhi Call 9990771857Low Rate Call Girls in Triveni Complex Delhi Call 9990771857
Low Rate Call Girls in Triveni Complex Delhi Call 9990771857delhimodel235
 
Call Girls in Kashmiri Gate Delhi 💯Call Us 🔝8264348440🔝
Call Girls in Kashmiri Gate Delhi 💯Call Us 🔝8264348440🔝Call Girls in Kashmiri Gate Delhi 💯Call Us 🔝8264348440🔝
Call Girls in Kashmiri Gate Delhi 💯Call Us 🔝8264348440🔝soniya singh
 
A Brief History of Intangibles in Ad Valorem Taxation.pdf
A Brief History of Intangibles in Ad Valorem Taxation.pdfA Brief History of Intangibles in Ad Valorem Taxation.pdf
A Brief History of Intangibles in Ad Valorem Taxation.pdfTim Wilmath
 
Brigade Neopolis Kokapet, Hyderabad E- Brochure
Brigade Neopolis Kokapet, Hyderabad E- BrochureBrigade Neopolis Kokapet, Hyderabad E- Brochure
Brigade Neopolis Kokapet, Hyderabad E- Brochurefaheemali990101
 
Rustomjee The Panorama At Pali Hill, Bandra West, Mumbai - Brochure.pdf
Rustomjee The Panorama At Pali Hill, Bandra West, Mumbai - Brochure.pdfRustomjee The Panorama At Pali Hill, Bandra West, Mumbai - Brochure.pdf
Rustomjee The Panorama At Pali Hill, Bandra West, Mumbai - Brochure.pdfmonikasharma630
 
Call Girls In The Lalit New Delhi ❤️8860477959 Good Looking Escorts In 24/7 D...
Call Girls In The Lalit New Delhi ❤️8860477959 Good Looking Escorts In 24/7 D...Call Girls In The Lalit New Delhi ❤️8860477959 Good Looking Escorts In 24/7 D...
Call Girls In The Lalit New Delhi ❤️8860477959 Good Looking Escorts In 24/7 D...lizamodels9
 
Call Girls in Pitampura Delhi 💯Call Us 🔝8264348440🔝
Call Girls in Pitampura Delhi 💯Call Us 🔝8264348440🔝Call Girls in Pitampura Delhi 💯Call Us 🔝8264348440🔝
Call Girls in Pitampura Delhi 💯Call Us 🔝8264348440🔝soniya singh
 
Dynamic Netsoft A leader In Property management Software
Dynamic Netsoft A leader In Property management SoftwareDynamic Netsoft A leader In Property management Software
Dynamic Netsoft A leader In Property management SoftwareDynamic Netsoft
 

Último (20)

Partner With the Golden Life Community for Single Women Over 55
Partner With the Golden Life Community for Single Women Over 55Partner With the Golden Life Community for Single Women Over 55
Partner With the Golden Life Community for Single Women Over 55
 
Namrata 7 Plumeria Drive Pimpri Chinchwad Pune Brochure.pdf
Namrata 7 Plumeria Drive Pimpri Chinchwad Pune Brochure.pdfNamrata 7 Plumeria Drive Pimpri Chinchwad Pune Brochure.pdf
Namrata 7 Plumeria Drive Pimpri Chinchwad Pune Brochure.pdf
 
Call Girls in Sarai Kale Khan Delhi 💯Call Us 🔝8264348440🔝
Call Girls in Sarai Kale Khan Delhi 💯Call Us 🔝8264348440🔝Call Girls in Sarai Kale Khan Delhi 💯Call Us 🔝8264348440🔝
Call Girls in Sarai Kale Khan Delhi 💯Call Us 🔝8264348440🔝
 
9953056974 Low Rate Call Girls In Saket, Delhi NCR
9953056974 Low Rate Call Girls In Saket, Delhi NCR9953056974 Low Rate Call Girls In Saket, Delhi NCR
9953056974 Low Rate Call Girls In Saket, Delhi NCR
 
9990771857 Call Girls in Noida Sector 10 Noida (Call Girls) Delhi
9990771857 Call Girls in Noida Sector 10 Noida (Call Girls) Delhi9990771857 Call Girls in Noida Sector 10 Noida (Call Girls) Delhi
9990771857 Call Girls in Noida Sector 10 Noida (Call Girls) Delhi
 
Prestige Rainbow Waters Raidurgam, Gachibowli Hyderabad E- Brochure.pdf
Prestige Rainbow Waters Raidurgam, Gachibowli Hyderabad E- Brochure.pdfPrestige Rainbow Waters Raidurgam, Gachibowli Hyderabad E- Brochure.pdf
Prestige Rainbow Waters Raidurgam, Gachibowli Hyderabad E- Brochure.pdf
 
The Omaxe State Dwarka Delhi-broucher.pdf.pdf
The Omaxe State Dwarka Delhi-broucher.pdf.pdfThe Omaxe State Dwarka Delhi-broucher.pdf.pdf
The Omaxe State Dwarka Delhi-broucher.pdf.pdf
 
Ryan Mahoney - How Property Technology Is Altering the Real Estate Market
Ryan Mahoney - How Property Technology Is Altering the Real Estate MarketRyan Mahoney - How Property Technology Is Altering the Real Estate Market
Ryan Mahoney - How Property Technology Is Altering the Real Estate Market
 
DLF Plots Sriperumbudur in Chennai E Brochure Pdf
DLF Plots Sriperumbudur in Chennai E Brochure PdfDLF Plots Sriperumbudur in Chennai E Brochure Pdf
DLF Plots Sriperumbudur in Chennai E Brochure Pdf
 
Managed Farmland Brochures to get more in
Managed Farmland Brochures to get more inManaged Farmland Brochures to get more in
Managed Farmland Brochures to get more in
 
Low Rate Call Girls in Triveni Complex Delhi Call 9990771857
Low Rate Call Girls in Triveni Complex Delhi Call 9990771857Low Rate Call Girls in Triveni Complex Delhi Call 9990771857
Low Rate Call Girls in Triveni Complex Delhi Call 9990771857
 
Call Girls in Kashmiri Gate Delhi 💯Call Us 🔝8264348440🔝
Call Girls in Kashmiri Gate Delhi 💯Call Us 🔝8264348440🔝Call Girls in Kashmiri Gate Delhi 💯Call Us 🔝8264348440🔝
Call Girls in Kashmiri Gate Delhi 💯Call Us 🔝8264348440🔝
 
A Brief History of Intangibles in Ad Valorem Taxation.pdf
A Brief History of Intangibles in Ad Valorem Taxation.pdfA Brief History of Intangibles in Ad Valorem Taxation.pdf
A Brief History of Intangibles in Ad Valorem Taxation.pdf
 
Brigade Neopolis Kokapet, Hyderabad E- Brochure
Brigade Neopolis Kokapet, Hyderabad E- BrochureBrigade Neopolis Kokapet, Hyderabad E- Brochure
Brigade Neopolis Kokapet, Hyderabad E- Brochure
 
Rustomjee The Panorama At Pali Hill, Bandra West, Mumbai - Brochure.pdf
Rustomjee The Panorama At Pali Hill, Bandra West, Mumbai - Brochure.pdfRustomjee The Panorama At Pali Hill, Bandra West, Mumbai - Brochure.pdf
Rustomjee The Panorama At Pali Hill, Bandra West, Mumbai - Brochure.pdf
 
Call Girls In The Lalit New Delhi ❤️8860477959 Good Looking Escorts In 24/7 D...
Call Girls In The Lalit New Delhi ❤️8860477959 Good Looking Escorts In 24/7 D...Call Girls In The Lalit New Delhi ❤️8860477959 Good Looking Escorts In 24/7 D...
Call Girls In The Lalit New Delhi ❤️8860477959 Good Looking Escorts In 24/7 D...
 
Low Rate Call Girls in Triveni Complex Delhi Call 9873940964
Low Rate Call Girls in Triveni Complex Delhi Call 9873940964Low Rate Call Girls in Triveni Complex Delhi Call 9873940964
Low Rate Call Girls in Triveni Complex Delhi Call 9873940964
 
Call Girls in Pitampura Delhi 💯Call Us 🔝8264348440🔝
Call Girls in Pitampura Delhi 💯Call Us 🔝8264348440🔝Call Girls in Pitampura Delhi 💯Call Us 🔝8264348440🔝
Call Girls in Pitampura Delhi 💯Call Us 🔝8264348440🔝
 
young call girls in Lajpat Nagar,🔝 9953056974 🔝 escort Service
young call girls in Lajpat Nagar,🔝 9953056974 🔝 escort Serviceyoung call girls in Lajpat Nagar,🔝 9953056974 🔝 escort Service
young call girls in Lajpat Nagar,🔝 9953056974 🔝 escort Service
 
Dynamic Netsoft A leader In Property management Software
Dynamic Netsoft A leader In Property management SoftwareDynamic Netsoft A leader In Property management Software
Dynamic Netsoft A leader In Property management Software
 

Mid-Year Review: US, Germany, Singapore Lead in Dynamic CRE Markets

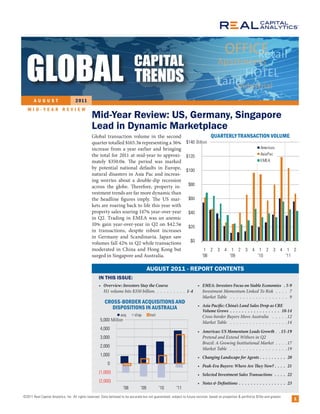
  • 1. AUGUST 2 011 MID-YEAR REVIEW Mid-Year Review: US, Germany, Singapore Lead in Dynamic Marketplace Global transaction volume in the second QUARTERLY TRANSACTION VOLUME quarter totalled $165.3 representing a 36 $140 Billion increase from a year earlier and bringing Americas the total for 2011 at mid-year to approxi- $120 AsiaPac mately $350.0 . e period was marked EMEA by potential national defaults in Europe, $100 natural disasters in Asia Pac and increas- ing worries about a double-dip recession across the globe. erefore, property in- $80 vestment trends are far more dynamic than the headline gures imply. e US mar- $60 kets are roaring back to life this year with property sales soaring 147 year-over-year $40 in Q2. Trading in EMEA was an anemic 10 gain year-over-year in Q2 on $42.5 $20 in transactions, despite robust increases in Germany and Scandinavia. Japan saw volumes fall 42 in Q2 while transactions $0 moderated in China and Hong Kong but 1 2 3 4 1 2 3 4 1 2 3 4 1 2 surged in Singapore and Australia. '08 '09 '10 '11 AUGUST 2011 - REPORT CONTENTS IN THIS ISSUE: • Overview: Investors Stay the Course • EMEA: Investors Focus on Stable Economies . 5-9 H1 volume hits $350 billion. . . . . . . . . . 1-4 Investment Momentum Linked To Risk . . . . 7 Market Table . . . . . . . . . . . . . . . . . . 9 CROSS-BORDER ACQUISITIONS AND DISPOSITIONS IN AUSTRALIA • Asia Pacific: China’s Land Sales Drop as CRE Volume Grows . . . . . . . . . . . . . . . . . 10-14 acq disp net Cross-border Buyers Move Australia . . . . . 12 5,000 Million Market Table . . . . . . . . . . . . . . . . . .14 4,000 • Americas: US Momentum Leads Growth . . 15-19 3,000 Pretend and Extend Withers in Q2 Brazil: A Growing Institutional Market . . . . 17 2,000 Market Table . . . . . . . . . . . . . . . . . .19 1,000 • Changing Landscape for Agents . . . . . . . . . 20 0 • Peak-Era Buyers: Where Are They Now? . . . . 21 (1,000) • Selected Investment Sales Transactions . . . . 22 (2,000) • Notes & Definitions . . . . . . . . . . . . . . . . 23 '08 '09 '10 '11 ©2011 Real Capital Analytics, Inc. All rights reserved. Data believed to be accurate but not guaranteed; subject to future revision; based on properties & portfolios $10m and greater. 1
  • 2. AUGUST 2011 MID-YEAR REVIEW A verage yields have continued to trend TRANSACTION SUMMARY slightly downward in the Americas Q2'11 YOY H1’11 YOY and EMEA. In the Americas, the Vol ($B) Chg Vol ($B) Chg wave of capital entering the market this Office $41.2 29% $81.9 36% year is causing downward pressure, but that Retail 32.7 97% 60.6 61% is being partially o set by increased sales of Industrial 11.6 26% 22.3 41% troubled assets in the US. In EMEA, stable All Commercial $85.5 48% $164.8 45% cap rates still re ect strong German and Nordic volume combined with select UK Hotel 8.8 80% 16.7 66% trophy transactions. Higher yields in Asia Apartment 20.4 38% 33.2 37% PROPERTY ACQUISITION YIELDS IN MAJOR GLOBAL MARKETS Pac partly re ect rebounding activity in Land 50.6 14% 134.6 11% Australia, where property o ers among the Total $165.3 36% $349.3 30% NYC/DC highest average cap rates globally, as well as HK/Sing *Totals may not sum due to rounding London/Paris the severe slide in activity in traditionally 7.5% lower-yielding Japan. had very low cap rates, and without greater economic Pricing trends in the world’s global nan- certainty, investors are hesitant about becoming even 7.0% cial capitals provide more insight. Yields in more bullish. In addition, with yields so low in these 6.5% these markets were relatively unchanged major markets, secondary cities and other higher yield- in Q2 and have moved little since the be- ing alternatives are more attractive. e surge of cross- 6.0% ginning of the year. ese markets already border capital into Australia well illustrates this trend. 5.5% QUARTERLY TRANSACTION SUMMARY BY ZONE 5.0% OFFICE, RETAIL AND INDUSTRIAL ASIA PAC EMEA AMERICAS 4.5% CAP RATES CAP RATES CAP RATES 9.0% 9.0% 9.0% 4.0% 8.5% 8.5% 8.5% 8.0% 8.0% 8.0% 3.5% 7.5% 7.5% 7.5% 3.0% 7.0% 7.0% 7.0% 6.5% 6.5% 6.5% '07 '08 '09 '10 '11 6.0% 6.0% 6.0% 5.5% 5.5% 5.5% TRANSACTION $50 Billion 2 3 4 TRANSACTION 3 4 1 2 1 1 2 3 4 1 2 $50 Billion 2 3 4 1 2 3 4 1 2 3 4 1 2 1 $50 Billion 2 3 4 TRANSACTION 3 4 1 2 1 1 2 3 4 1 2 '08 '09 '10 '11 '08 '09 '10 '11 '08 '09 '10 '11 $40 $40 $40 $30 $30 $30 $20 $20 $20 $10 $10 $10 $0 $0 $0 150% 1 2 YOY 4 1 2 3 IN TRANS3 4 1 2 3 CHANGE 4 1 2 VOL 150% 1 2 YOY 4 1 2 3 IN TRANS3VOL 1 2 3 CHANGE 4 1 2 4 150% 1 2 YOY 4 1 2 3 IN TRANS3 4 1 2 3 CHANGE 4 1 2 VOL '08 '09 '10 '11 '08 '09 '10 '11 '08 '09 '10 '11 100% 100% 100% 50% 50% 50% 0% 0% 0% -50% -50% -50% -100% -100% -100% 1 2 3 4 1 2 3 4 1 2 3 4 1 2 1 2 3 4 1 2 3 4 1 2 3 4 1 2 1 2 3 4 1 2 3 4 1 2 3 4 1 2 '08 '09 '10 '11 '08 '09 '10 '11 '08 '09 '10 '11 ©2011 Real Capital Analytics, Inc. All rights reserved. Data believed to be accurate but not guaranteed; subject to future revision; based on properties & portfolios $10m and greater. 2
  • 3. AUGUST 2011 MID-YEAR REVIEW E ach global zone combated pressures TRANSACTIONS BY COUNTRY from within. Sovereign debt fears ALL PROPERTY TYPES in EMEA’s peripheral countries and Q1’11 Q2’11 H1’11 heavy belt-tightening in the UK restrained Vol YOY Vol YOY Vol YOY growth, but domestic and cross-border Country ($B) Chg ($B) Chg ($B) Chg investors were active in Germany and the 1 China $75.7 8% $41.8 21% $117.6 12% stable Scandinavian economies. While 2 United States 28.8 93% 49.0 147% 77.8 124% Russia struggled, Central VOLUME BY THEATER and Eastern Europe at- 3 United Kingdom 15.3 62% 9.0 -25% 24.3 14% ALL PROPERTY TYPES 4 Germany 9.3 42% 11.2 65% 20.5 54% tracted yield-seeking in- Q2'11 YOY H1’11 YOY 5 Japan 11.4 18% 3.6 -42% 15.0 -5% Vol ($B) Chg Vol ($B) Chg vestment. In Asia Paci c, 6 Singapore 5.4 237% 6.2 68% 11.5 119% United States $49.0 147% $77.8 124% the retail and industrial 7 Hong Kong 3.5 -29% 6.0 38% 9.5 3% Canada 4.5 8% 7.8 5% sectors were a counter- 8 France 3.9 32% 5.3 -20% 9.1 -4% Latin America 2.1 17% 5.6 95% weight to slow o ce vol- ume and a sharp drop-o 9 Sweden 2.8 23% 5.1 80% 8.0 55% Americas $55.6 115% $91.2 102% in Q2 land sales in China. 10 Canada 3.3 2% 4.5 8% 7.8 5% Western Europe 28.8 27% 52.8 27% United Kingdom 9.0 -25% 24.3 14% In the US, the intense 11 Australia 2.0 -34% 5.6 102% 7.6 32% Eastern Europe 3.1 17% 7.6 17% selective focus on major 12 Brazil 2.9 399% 1.1 -32% 4.0 85% MidEast 0.8 -29% 1.5 -18% assets in major markets 13 Taiwan 1.7 -8% 1.3 -41% 3.0 -26% Africa 0.9 161% 1.1 -8% began to spread out, as 14 South Korea 1.5 71% 1.4 91% 3.0 80% EMEA $42.5 10% $87.4 21% yield-conscious investors 15 Italy 1.6 87% 0.8 -9% 2.5 37% East Asia 50.7 21% 133.3 11% moved into other markets 16 Spain 1.3 -31% 1.1 -29% 2.3 -30% Japan 3.6 -42% 15.0 -5% and embraced garden 17 Netherlands 1.3 19% 1.0 -5% 2.3 7% SE Asia 6.6 41% 13.2 92% apartments. e ow of 18 Russia 0.2 -91% 1.8 85% 2.0 -34% Australia - NZ 5.7 96% 8.1 24% new distress slowed and, 19 Poland 1.4 91% 0.5 -22% 1.8 40% India/Other 0.6 -71% 1.3 -56% with credit easing and 20 Norway 0.4 -33% 1.1 77% 1.5 22% Asia Pacific $67.2 17% $170.8 12% prices rming, lenders 21 India 0.8 -29% 0.6 -71% 1.3 -56% opted more for liquida- Global* $165.3 36% $349.3 30% 22 Finland 0.3 4% 0.8 182% 1.2 91% tions than restructurings *Totals may not sum due to rounding 23 Belgium 0.4 -9% 0.8 105% 1.2 47% of troubled assets. 24 Czech Republic 0.9 279% 0.2 24% 1.2 168% Highlighting the choppy and o en local- 25 Switzerland 0.5 97% 0.6 280% 1.1 162% ized activity across the global markets, many countries saw quarterly volume trends 26 Denmark 0.5 38% 0.6 78% 1.1 56% reverse, in both directions, from Q1 to Q2. 27 South Africa 0.2 -79% 0.8 1362% 1.0 12% Other countries, with the US in the lead, saw 28 Malaysia 0.6 47% 0.3 -58% 0.9 -23% strong positive acceleration in growth in Q2. 29 Israel 0.2 -48% 0.6 -6% 0.8 -22% e US had the highest growth in both 30 Ukraine 0.6 446% 0.1 -80% 0.7 40% Q2 and H1, with its second quarter gain of 31 Chile 0.2 100% 0.6 4453% 0.7 678% 147 outpacing its 124 H1 growth. Ger- 32 Austria 0.6 38% 0.1 -79% 0.7 -19% many and Sweden were the standout gainers 33 Turkey 0.6 30% 0.1 94% 0.7 38% in EMEA as France and the UK lost ground. 34 New Zealand 0.4 -39% 0.1 -10% 0.5 -33% China’s land sales turndown slowed the gi- 35 Hungary 0.4 20% 0.1 27% 0.5 22% ant Asia Pac market to just 12 in H1, one- 36 UAE 0.5 64% 0.0 -95% 0.5 -36% third below its growth for commercial prop- 37 Romania 0.5 207% 0.0 -100% 0.5 59% erty only. Australia’s transaction volume 38 Croatia 0.4 - 0.0 -100% 0.4 283% moved rapidly positive, pushing the country 39 Portugal 0.2 -43% 0.2 -68% 0.4 -57% to a 102 gain. Spectacular Q1 growth in 40 Thailand 0.3 61% 0.1 -61% 0.4 -10% Singapore and Brazil inevitably slowed in All Others 1.4 54% 1.3 69% 2.7 61% Q2, but both countries turned in solid posi- Grand Total $184.0 25% $165.3 36% $349.3 30% tive improvements for H1. ©2011 Real Capital Analytics, Inc. All rights reserved. Data believed to be accurate but not guaranteed; subject to future revision; based on properties & portfolios $10m and greater. 3
  • 4. AUGUST 2011 MID-YEAR REVIEW Global: Top Deals and Players in H1’11 TOP 25 PROPERTY SALES TOP 20 BUYERS# Price SF(K)/ PPSF/ Type Transaction Location Buyer ($M) Units PPU (K) Vol 1 RET The Trafford Centre† Manchester, GBR $2,498 1,900 $1,315 Capital Shopping Ctrs Grp PLC ($M) 2 RET Centr0† Oberhausen, DEU 1,913 2,174 880 Canada Pension Plan Investment Board Blackstone $9,008 3 DEV Borrett Road Site, Mid-levels Hong Kong, HKG 1,498 113 13,266 Cheung Kong (Holdings) Ltd CPP Investment Board 3,689 4 OFF 280 Park Avenue† New York, NY 1,100 1,179 941 SL Green JV Vornado Capital Shopping Ctrs Grp PLC 3,098 China Vanke Co Ltd 3,048 5 RET Northland Shopping Centre† Preston East, AUS 998 994 1,004 Canada Pension Plan Investment Board Yunnan Zhonghao Props Co Ltd 2,714 6 DEV Shenzhen 2011-K202-0014 Shenzhen, CHN 991 7,509 132 China Merchants Property Dev Co Ltd CA Immo 2,402 7 DEV CITIC City B,C,D blocks (Prt II) Beijing, CHN 929 848 1,095 Financial Street Holding Co Ltd Tesco Pension Trustees Ltd 2,200 8 OFF Otemachi PAL Bldg Tokyo, JPN 877 301 2,916 Mitsui Fudosan Co Ltd JV Mitsui & Co Poly Real Estate Group 2,128 9 OFF Deutsche Bank Twin Towers Frankfurt, DEU 857 807 1,062 DWS Investments Gmbh Invesco Real Estate 2,117 10 DEV Changsha 2011-001 Changsha, CHN 855 800 1,068 Wharf Holdings Wheelock & Co 2,105 11 DEV Punggol Central & Punggol Walk Singapore, SGP 799 323 2,475 Frasers Centrepoint Ltd‡ Greentown China Hldgs Ltd 2,099 12 DEV Boon Lay Way Singapore, SGP 791 194 4,085 CapitaMalls Asia JV HSBC Bank Cheung Kong (Holdings) Ltd 2,034 13 OFF Chiswick Park London, GBR 781 1,900 411 Blackstone CapitaLand Limited 1,929 14 OFF Helmsley Building† New York, NY 763 1,213 629 Invesco Real Estate JP Morgan 1,747 15 OFF Capital Square Singapore, SGP 700 387 1,810 Alpha Investment Partners (AIP)‡ China Overseas L & I Ltd 1,650 Mitsubishi Estate 1,611 16 OFF The Fifth Square† Beijing, CHN 682 1,009 677 China Minmetals Corporation China Merchants Group 1,517 17 DEV Nanjing 2011G07 Nanjing, CHN 681 3,667 186 Shimao Property Holdings Ltd‡ Arminius Funds Mgmt 1,457 18 DEV Toyosu District Site Tokyo, JPN 680 1,132 601 Tokyo Metropolitan Government DekaBank 1,429 19 OFF The Centre Shanghai, CHN 666 963 692 China Pacific Insurance (Group) Co Ltd Far East Organization 1,423 20 RET La Rinascente Milan, ITA 652 566 1,151 First Atlantic Real Estate SGR 21 OFF Market Square East & West Washington, DC 615 680 905 Wells Real Estate Funds, Inc 22 HTL Ritz Carlton HTL Moscow, RUS 609 334 1,824 Verny Capital TOP 20 SELLERS # 23 DEV CITIC City B,C,D blocks Beijing, CHN 607 848 716 Financial Street Holding Co Ltd Vol 24 DEV Yiwu 2011017 Yiwu, CHN 594 883 672 Guangsha Construction ($M) 25 IND Interlink† Hong Kong, HKG 589 2,400 245 Canada Pension Plan Investment Board Centro Properties Group $8,102 Urban Redevelopment Authority 3,356 Housing & Dev Board 2,821 TOP 15 PORTFOLIO SALES Volksbank AG 2,426 Price SF(K)/ PPSF/ Type Transaction Location Buyer Tesco plc 2,223 ($M) Units PPU (K) Beacon Capital Partners 2,215 1 RET Centro United States Portfolio Multiple, USA $9,150 99,051 $92 Blackstone Goldman Sachs 1,868 2 RET Tesco RET Portfolio 11 Multiple, GBR 2,200 3,500 629 Tesco Pension Trustees Limited Deutsche Bank 1,782 3 MIX Europolis MIX Eastern Euro Ptfl 11 Europe 2,009 13,011 154 CA Immobilien Anlagen AG CITIC Group 1,780 4 OFF Eurocastle Mars Fixed 1 Ptfl 2011† Berlin, DEU 1,457 4,989 292 Arminius Funds Management Broadway Partners 1,715 5 IND Bracor IND Portfolio 11 Multiple, BRA 1,322 10,764 123 Prosperitas GE Capital 1,653 6 RET Metro RET Portfolio 11 Multiple, DEU 1,215 9,688 125 Cerberus Capital Management Aberdeen Property Investors 1,541 7 OFF Kokusai Shin-Akasaka Towers Tokyo, JPN 1,066 863 1,236 Mitsubishi Estate Company, Limited Eurocastle 1,544 8 DEV Greentown China Hldgs Gov't Land Ptfl Taizhou, CHN 1,011 7,386 137 Greentown China Holdings Limited Bracor Invtos Imobiliarios 1,297 9 DEV Kunming Guandu KC2010-76 Kunming, CHN 987 22,158 45 Yunnan Zhonghao Properties Co Ltd Morgan Stanley 1,336 10 APT Dombron Intressenter Ptfl† Multiple, SWE 948 8,281 115 AMF Fastigheter Equity Residential 1,345 11 MIX Melrose Arch† Melrose North, ZAF 686 1,808 332 Amdec Property Development Lone Star Partners 1,230 Unibail-Rodamco 1,242 12 OFF Mapletree Com Trust Ptfl 2011 Singapore, SGP 625 733 853 Mapletree Commercial Trust Carlyle Group 1,097 13 HTL MSREF HTL Portfolio 11 Multiple, Europe 621 2,537 245 Toufic Aboukhater Lehman Brothers Hldgs Inc 1,108 14 MIX Capital and Counties Mix Ptfl Multiple, CA 600 2,106 253 Equity One‡ 15 IND World Market Center Ptfl* Las Vegas, NV 600 4,832 124 Bain Capital‡ # Full credit to each JV partner, 100% valuation given *Estimated † Partial Interest ‡ JV ©2011 Real Capital Analytics, Inc. All rights reserved. Data believed to be accurate but not guaranteed; subject to future revision; based on properties & portfolios $10m and greater. 4
  • 5. AUGUST 2011 MID-YEAR REVIEW EMEA: Quarter in Review Summary F ollowing six consecutive quarters of QUARTERLY TRANSACTION VOLUME strong year-over-year gains, EMEA BY PROPERTY TYPE $70 Billion transaction volumes stalled in Q2. Commercial e slowdown, to $42.5 of signi cant $60 Apartment property sales, was at against a year ear- Hotel lier and re ects widening divergence in in- $50 Land vestor outlook across core and peripheral European markets. Pricing was also gener- $40 ally at in Q2 across EMEA and yields on acquisitions have changed little since the $30 beginning of the year. $20 Among property types, retail was the big- gest gainer in H1’11 with volume up 41 $10 boosted by billion-dollar transactions such as Tra ord Centre in Manchester, Centr0 in $0 Oberhausen and a TRANSACTION SUMMARY 1 2 3 4 1 2 3 4 1 2 3 4 1 2 major Tesco portfo- '08 '09 '10 '11 Q2'11 YOY H1’11 YOY lio in the UK. e of- Vol ($B) Chg Vol ($B) Chg ce and hotel sectors PERCENT CHANGE IN TRANSACTION VOLUME Office $18.0 40% $33.7 31% (H1’10 VS H1’11) also recorded healthy <-50% - 50–0% 0–20% 20–50% 50–100% >100% Retail 12.1 26% 29.2 41% gains in transaction DECREASE INCREASE Industrial 2.8 -35% 7.1 -1% All Commercial 32.9 23% 70.0 31% volume while indus- Hotel 2.6 47% 5.6 39% trial and apartment FIN NOR Apartment 5.3 -33% 8.1 -25% volume fell . Land 1.8 -20% 3.7 -11% Germany and the SWE DNK Total $42.5 10% $87.4 21% Nordic countries RUS *Totals may not sum due to rounding have emerged as fa- IRL NLD CAN GBR POL voured investment targets in the current BEL DEU CZE market and all posted robust gains in trans- FRA SVK AUT HUN UKR CHE action activity in each quarter this year. ITA HRV ROU SRB is helped o set signi cant Q2’11 MCO MNE BGR USA declines in the UK and France of 25 and PRT ESP GRC TUR 20 , respectively, in addition to continued weak performance in the peripheral mar- ISR kets such as Greece, Portugal, Spain and MEX Ireland. Investors are ocking to Germany QAT and Scandinavia which currently o er the SAU ARE highest risk adjusted yields (see page 7). Germany’s Q2’11 growth of 65 was well ahead of its H1’11 gain of 54 (and the UK’s 14 ) as domestic and cross-border demand broadened. Sweden, the hottest Nordic market, saw growth of 55 for H1’11. With the strong exception of Russia’s PER 34 decline, Eastern European activ- BRA ity remained stable, with core properties in key markets attracting increased attention from yield-seeking investors. In the Middle East, both Israel and the United Arab Emir- CHL ates saw a steep fallo in activity in H1. ZAF ARG ©2011 Real Capital Analytics, Inc. All rights reserved. Data believed to be accurate but not guaranteed; subject to future revision; based on properties & portfolios $10m and greater. 5
  • 6. AUGUST 2011 MID-YEAR REVIEW A mong markets, positive growth RECENTLY BUILT OR RENOVATED has slowed but been maintained in OFFICE BUILDING SALES IN Q2 London and Paris indicating the Price PPSF/ Built/ Property City Cap Rate investment trends in secondary markets ($M) PPU ($K) Renov in the UK and France continue to under- Selmer Building Oslo $166.7 1,006 4.5% 2008 perform. However, ve German metros Origami Paris 124.0 2,421 4.7% r2010 now occupy the top markets list, with all showing positive investment growth. Guim'arts Brussels 46.7 620 5.4% r2010 Cap rates on commercial properties in DB Twin Towers Frankfurt 857.4 1,062 5.5% r2010 Western Europe and the UK are closely aligned averaging between 6.6 and 1 Finsbury Circus London 236.5 1,183 5.5% r2009 6.7 . Average cap rates in Eastern Europe record a decline in Q2, but are skewed by a higher quality of properties trading as ovated o ce buildings in select European markets investors seek to minimize risk. Recent illustrate the premium prices commanded by the prices and cap rates for new or newly ren- highest quality properties. QUARTERLY TRANSACTION SUMMARY BY THEATER OFFICE, RETAIL AND INDUSTRIAL UNITED KINGDOM WESTERN EUROPE EASTERN EUROPE CAP RATES* CAP RATES* CAP RATES* 9.0% 9.0% 9.0% 8.5% 8.5% 8.5% 8.0% 8.0% 8.0% 7.5% 7.5% 7.5% 7.0% 7.0% 7.0% 6.5% 6.5% 6.5% 6.0% 6.0% 6.0% 5.5% 5.5% 5.5% TRANSACTION TRANSACTION TRANSACTION $35 Billion 2 3 4 1 2 3 4 1 2 3 4 1 2 1 $35 Billion 2 3 4 1 2 3 4 1 2 3 4 1 2 1 $35 Billion 2 3 4 1 2 3 4 1 2 3 4 1 2 1 '08 '09 '10 '11 '08 '09 '10 '11 '08 '09 '10 '11 $30 $30 $30 $25 $25 $25 $20 $20 $20 $15 $15 $15 $10 $10 $10 $5 $5 $5 $0 $0 $0 1 2 YOY4 1 2 3 IN TRANS3VOL 1 2 3 CHANGE 4 1 2 4 1 2 YOY4CHANGE IN TRANS3VOL 1 2 3 1 2 3 4 1 2 4 1 2 YOY4 1 2 3 IN TRANS3VOL 1 2 3 CHANGE 4 1 2 4 150% 150% 150% '08 '09 '10 '11 '08 '09 '10 '11 '08 '09 '10 '11 100% 100% 100% 50% 50% 50% 0% 0% 0% -50% -50% -50% -100% -100% -100% 1 2 3 4 1 2 3 4 1 2 3 4 1 2 1 2 3 4 1 2 3 4 1 2 3 4 1 2 1 2 3 4 1 2 3 4 1 2 3 4 1 2 '08 '09 '10 '11 '08 '09 '10 '11 '08 '09 '10 '11 *Two quarter rolling average ©2011 Real Capital Analytics, Inc. All rights reserved. Data believed to be accurate but not guaranteed; subject to future revision; based on properties & portfolios $10m and greater. 6
  • 7. AUGUST 2011 MID-YEAR REVIEW Europe: Investment Momentum Linked To Risk L ooking at investment volume increases action volume growth both on a six-month and across European markets and comparing quarterly basis. ey include a higher propor- spreads between cap rates and relevant tion of non-eurozone countries with more stable government bonds, it is clear that the momen- economic conditions. Countries plotted in the tum of real estate investment in Europe is ow- lower le quadrant, notably Spain and Portugal, ing towards the highest relative yields in the are experiencing negative transaction momen- safest markets. tum. e UK on a half-year basis escapes e upper right quadrant of the momentum this grouping, but its lower Q2’11 volume graph highlights the focus of capital on Ger- re ects a weakening market. Among the outli- many and Sweden in response to the attractive ers, Ireland saw already low volume falter in cap rate spread over government bonds through Q2’11, while Russia’s good Q2 re ects a major Q2’11. Like Germany and the Nordics, the other luxury Moscow hotel acquired by Kazakhstan countries in this quadrant display strong trans- backed private equity. CAP RATE SPREADS INVESTMENT MOMENTUM BY COUNTRY ALL PROPERTY TYPES TO SOVEREIGN BONDS Cap Rate Gov't Bond Spread Switzerland 0 100 200 300 400 Finland 100% Sweden 80% Turkey Belgium Sweden Denmark 60% Germany Russia Norway 40% Q2’11 vs Q2’10 % Chg Germany UK 20% Czech Republic Hungary 0% Netherlands France Italy France -20% Poland Italy -40% Spain United Kingdom Ireland -60% Ukraine Portugal Spain Austria -80% Romania Croatia *Greece 0% 2% 4% 6% 8% -60% -40% -20% 0% 20% 40% 60% 80% 100% 120% H1’11 vs H1’10 % Chg *No significant transactions recorded for Greece over the last 12 months. Based on percent change in Euros ©2011 Real Capital Analytics, Inc. All rights reserved. Data believed to be accurate but not guaranteed; subject to future revision; based on properties & portfolios $10m and greater. 7
  • 8. AUGUST 2011 MID-YEAR REVIEW EMEA: Top Deals and Players in H1’11 TOP 25 PROPERTY SALES TOP 20 BUYERS# Price SF(K)/ PPSF/ Type Transaction Location Buyer ($M) Units PPU (K) Vol 1 RET The Trafford Centre† Manchester, GBR $2,498 1,900 $1,315 Capital Shopping Ctrs Grp PLC (CSC) ($M) 2 RET Centr0† Oberhausen, DEU 1,913 2,174 880 Canada Pension Plan Investment Board Capital Shopping Ctrs Grp PLC $2,498 3 OFF Deutsche Bank Twin Towers Frankfurt, DEU 857 807 1,062 DWS Investments Gmbh CA Immo 2,402 4 OFF Chiswick Park London, GBR 781 1,900 411 Blackstone Tesco Pension Trustees Limited 2,200 CPP Investment Board 1,913 5 RET La Rinascente Milan, ITA 652 566 1,151 First Atlantic Real Estate SGR Arminius Funds Management 1,457 6 HTL Ritz Carlton HTL Moscow, RUS 609 334 1,824 Verny Capital Cerberus Capital Management 1,215 7 RET Boulevard Berlin Berlin, DEU 533 753 707 Corio NV DekaBank 1,179 8 OFF Rolls Building London, GBR 492 262 1,880 Legal & General Property Deutsche Bank 1,160 9 OFF MidCity Place† London, GBR 468 352 1,329 Oxford Properties Group AMF 948 10 OFF Aviva Tower London, GBR 439 315 1,393 Kuok Khoon Hong & Martua Sitorus AEW Capital Management 788 11 OFF River Court London, GBR 437 425 1,029 Chinese Estates Group Invesco Real Estate 786 12 OFF 10 Aldermanbury London, GBR 434 312 1,393 JP Morgan Blackstone 781 13 OFF River Ouest Bezons, FRA 400 689 581 ING RE Invt Mgmt France OBO Predica SA‡ Signa Holding 721 14 OFF 20 Gresham St London, GBR 374 237 1,580 AXA RE Investments Managers (REIM) Corio NV 716 15 OFF Park House London, GBR 366 310 1,180 Qatar National Bank Amdec Property Development 686 First Atlantic Real Estate SGR 652 16 HTL Paris Marriott Champs-Elysees Paris, FRA 362 192 1,887 Abu Dhabi Investment Authority Prudential PLC 640 17 RET Spitalerstrasse 22-26† Hamburg, DEU 361 55 6,560 Signa Holding Legal & General Property 631 18 HTL Le Meridien Montparnasse Paris, FRA 350 953 367 Unibail-Rodamco Real I.S. AG 612 19 OFF Belgrave House† London, GBR 347 280 1,239 TIAA-CREF (fund) Verny Capital 609 20 RET Jubilee & West End Houses London, GBR 342 121 2,834 Pontegadea Inversiones SL 21 RET Schloss Arkaden Braunschweig, DEU 335 597 561 Deka Immobilien Investment GmbH 22 OFF Defense Plaza Puteaux, FRA 325 335 969 Northwood Investors LLC TOP 20 SELLERS # 23 RET Eden Shopping Centre† High Wycombe, GBR 313 850 368 Aldersgate Investments Vol 24 RET Marmara Park† Istanbul, TUR 302 1,076 281 DWS Investments Gmbh ($M) 25 RET Wankdorf Shopping Centre Bern, CHE 300 678 442 UBS JV Swissreal Investments Ltd Peel Group $2,498 Volksbank AG 2,426 Tesco plc 2,223 TOP 15 PORTFOLIO SALES Stadium Group 1,913 Price SF(K)/ PPSF/ Type Transaction Location Buyer Deutsche Bank 1,782 ($M) Units PPU (K) Aberdeen Property Investors 1,541 1 RET Tesco RET Portfolio 11 Multiple, GBR $2,200 $3,500 $629 Tesco Pension Trustees Limited Eurocastle 1,544 2 MIX Europolis MIX Eastern Euro Ptfl 11 Multiple, Europe 2,009 13,011 154 CA Immobilien Anlagen AG Unibail-Rodamco 1,242 3 OFF Eurocastle Mars Fixed 1 Ptfl 2011† Berlin, DEU 1,457 4,989 292 Arminius Funds Management Beacon Capital Partners 1,043 4 RET Metro RET Portfolio 11 Multiple, DEU 1,215 9,688 125 Cerberus Capital Management Fourth Swedish Nat'l Pension Fund 948 5 APT Dombron Intressenter ptfl† Sweden other 948 8,281 115 AMF Fastigheter Morgan Stanley 922 6 MIX Melrose Arch† Melrose North, ZAF 686 1,808 332 Amdec Property Development Pirelli & C. Real Estate SpA 804 7 HTL MSREF HTL Portfolio 11 Multiple, Europe 621 2,537 245 Toufic Aboukhater ECE Projektmanagement 817 8 MIX NR Nordic & Russia Props Ltd Mix Ptfl 11 Multiple, Europe 542 8,872 61 Kungsleden AB Schroders plc 781 9 APT Genesis Housing APT Ptfl 11† London, GBR 464 1,630 284 Grainger plc Stanhope Plc 781 10 MIX ECE MIX portfolio 2011† Hamburg, DEU 435 665 655 Real I.S. AG Kuwait Investment Authority 741 11 RET Rubin Moscow RET Ptfl 2011 Moscow, RUS 428 1,017 421 Yuri and Alexei Hotin Highstreet Holding 760 GE Capital 734 12 IND VGP IND Portfolio 11† Prague, CZE 414 4,629 89 AEW Europe JV Tristan Capital Partners Hermes 678 13 RET Unibail RET Portfolio 11 Multiple, SWE 379 1,002 379 Grosvenor‡ Investitori Associati 652 14 RET Karstadt Highstreet Ptfl 2011 Multiple, DEU 370 524 706 Quantum Immobilien AG 15 RET Highstreet Karstadt Ptfl Munich, DEU 361 570 632 Signa Holding‡ # Full credit to each JV partner, 100% valuation given *Estimated † Partial Interest ‡ JV ©2011 Real Capital Analytics, Inc. All rights reserved. Data believed to be accurate but not guaranteed; subject to future revision; based on properties & portfolios $10m and greater. 8
  • 9. AUGUST 2011 MID-YEAR REVIEW EMEA: Transactions by Market in H1’11 APARTMENT INDUSTRIAL OFFICE RETAIL HOTEL LAND SITE GRAND TOTAL* YOY CHANGE Vol ($M) # Props Vol ($M) # Props Vol ($M) # Props Vol ($M) # Props Vol ($M) # Props Vol ($M) # Props Vol ($M) # Props Vol Props Austria Austria, all $72 2 $72 2 $258 3 $316 5 $717 12 -19% -45% Belgium Belgium, all 21 1 92 3 914 20 58 3 88 2 1,173 29 47% 16% Bulgaria Bulgaria, all 62 3 62 3 -52% -25% Czech Republic Czech Republic, all 414 7 445 8 304 5 1,163 20 168% 25% Copenhagen 43 3 45 2 318 8 347 6 72 1 825 20 81% 100% Denmark Denmark other 18 1 65 4 151 2 9 1 243 8 7% 100% Baltic States Baltic States 25 1 299 7 17 1 341 9 994% 350% Helsinki 60 4 28 2 552 10 152 3 792 19 226% 58% Finland Finland other 29 3 84 5 85 9 86 11 101 3 384 31 3% 107% Paris 183 4 237 7 4,699 83 378 42 1,080 41 6,578 177 41% 51% France France other 286 8 282 28 519 17 1,260 23 196 5 2,543 81 -47% -49% Berlin-Brandenburg 989 39 27 1 1,813 36 886 12 152 3 200 4 4,068 95 53% -13% Hamburg 341 24 216 8 1,413 24 1,056 6 52 2 125 4 3,203 68 309% 209% Munich 286 18 178 3 321 9 501 8 36 3 119 5 1,441 46 10% 59% Frankfurt/Rhine-Main 79 4 80 1 1,294 8 298 8 221 5 297 6 2,269 32 175% -14% Germany Stuttgart 11 1 38 2 106 4 142 4 21 1 100 1 420 13 23% -7% Rhine-Ruhr 345 27 48 3 704 14 2,348 27 27 1 204 7 3,676 79 12% -66% Saxon Triangle 227 103 55 1 45 3 413 7 22 1 13 1 775 116 11% 625% Germany other 564 216 49 2 315 11 3,293 138 228 5 207 8 4,657 380 37% 222% Greece Greece, all -100% -100% Hungary Hungary, all 128 2 169 3 100 1 69 1 35 2 501 9 22% 125% Ireland Ireland,all 346 4 346 4 111% -43% Rome 263 6 66 1 96 1 425 8 -46% 0% Europe Italy Italy other 13 1 900 17 1,029 7 87 2 2,029 27 102% 4% Netherlands Netherlands, all 274 29 434 19 1,035 32 483 16 41 2 30 2 2,297 100 7% -3% Norway Norway, all 28 2 121 6 950 14 403 6 10 1 1,512 29 22% 0% EMEA Poland Poland, all 220 8 897 11 543 6 42 2 113 5 1,815 32 40% 28% Portugal Portugal, all 40 3 55 3 59 1 70 3 150 4 373 14 -57% -60% Romania Romania, all 46 1 201 3 18 2 195 2 459 8 59% -27% Moscow 165 2 331 3 628 3 639 2 1,763 10 -20% -58% Russia Russia other 20 1 52 2 18 1 150 2 21 1 261 7 -69% -91% Madrid 28 1 21 1 170 3 325 237 189 5 37 1 770 248 -40% 700% Spain Spain other 183 8 187 4 570 248 443 10 187 5 1,569 275 -24% -40% Stockholm 771 45 288 22 716 17 696 7 118 2 182 2 2,769 95 20% 16% Sweden Sweden other 1,963 134 1,042 69 1,504 119 581 26 47 5 62 3 5,198 356 82% 88% Switzerland Switzerland, all 189 3 483 5 326 2 94 2 1,092 12 162% 20% Turkey Turkey, all 13 1 132 3 462 2 39 2 24 1 670 9 38% -25% London Metro 958 17 227 16 9,434 108 1,338 21 291 13 196 5 12,444 180 19% -8% Manchester Metro 39 2 89 4 2,572 4 245 4 2,945 14 263% -46% United Kingdom Scotland 166 4 60 3 364 10 16 1 606 18 -50% -67% UK other 125 4 1,205 53 1,458 48 5,159 93 319 9 87 4 8,353 211 -7% -56% Ukraine Ukraine all 499 1 25 1 200 3 724 5 40% -38% Europe other Europe 112 3 295 1 102 2 14 1 523 7 52% -36% Total $7,763 694 $7,043 303 $33,270 681 $28,517 1,016 $5,459 143 $2,723 79 $84,775 2,916 22% 2% Israel Israel, all 306 2 62 3 177 3 256 5 801 13 -22% -32% Dubai 483 6 483 6 -36% -67% UAE UAE, all 165 2 165 2 - - Mid-East other Saudi Arabia, all 67 1 67 1 -16% 0% Mid-East Total $306 2 $62 3 $177 3 $972 14 $1,516 22 -18% -42% Africa Africa, all 89 1 319 3 546 6 98 3 20 1 1,071 14 -6% 0% Africa Total $89 1 $319 3 $546 6 $98 3 $20 1 $1,071 14 -6% 0% ©2011 Real Capital Analytics, Inc. All rights reserved. Data believed to be accurate but not guaranteed; subject to future revision; based on properties & portfolios $10m and greater. 9
  • 10. AUGUST 2011 MID-YEAR REVIEW Asia Pacific: Quarter in Review Summary S ales of signi cant properties in QUARTERLY TRANSACTION VOLUME Asia Paci c totaled $67.2 in Q2’11, $120 Billion BY PROPERTY TYPE bringing the total for the rst half Commercial of 2011 to $170.8 . While the region con- Apartment $100 tinues to show solid, steady growth in Hotel commercial property investment, some Land signi cant changes were noted in Q2 as $80 investment surged in Australia and plum- meted in Japan. Hong Kong recovered $60 from a relatively poor Q1 with a stronger Q2 to be at at the mid-year point while $40 Singapore’s 119 increase in transactions in H1 topped every major economy glob- $20 ally except the US. Also noteworthy, cross-border inves- $0 tors were part of the surge in transactions in Australia and 1 2 3 4 1 2 3 4 1 2 3 4 1 2 TRANSACTION SUMMARY Singapore, and the '08 '09 '10 '11 Q2'11 YOY H1’11 YOY buyers included a PERCENT CHANGE IN TRANSACTION VOLUME Vol ($B) Chg Vol ($B) Chg healthy mix of Eu- (H1’10 VS H1’11) FIN Office $8.5 -8% NOR $22.2 14% ropean and North <-50% - 50–0% 0–20% 20–50% 50–100% >100% Retail 5.1 75% 9.8 15% American invest- DECREASE INCREASE SWE Industrial 2.9 71% 4.9 52% DNK RUS ment rms which All Commercial 16.5 19% 36.9 18% NLD have been relatively Hotel IRL1.6GBR 13% 2.5 -11% DEU POL quiet since 2007. Apartment 2.0 46% CZE 4.0 BEL 25% Land 47.2 SVK UKR South Korea also FRA 15% AUT 127.4 HUN 11% Total $67.2 CHE 17% ITA $170.8 ROU 12% HRV posted strong results SRB *Totals may not sum due to rounding MCO MNE BGR in each quarter this PRT ESP GRC TUR year and its 80 in- KOR crease in H1 was the second highest in Asia. JPN CHN e only countries in Asia Paci c where in- ISR vestment momentum appears waning and volume fell in both quarters this year were QAT ARE TWN SAU India, Taiwan and New Zealand. IND HKG Across Asia Paci c, growth accelerated THA in the second quarter in every property VNM type save o ce, which is largely due to curtailed investment in Japan. In China, MYS sales of o ce and retail properties nearly SGP doubled in H1’11 while sales of develop- BRA able land moderated in Q2 as China’s long-running e orts to calm exuber- ant sales appear to be bearing fruit. In addition, transactions in China’s over- heated primary markets dropped as ac- AUS tivity moved to secondary and tertiary ZAF cities. Land rights in China accounted for $38.7 in Q2, up slightly on a year-over- year basis, but half of levels recorded in the two most recent quarters. ©2011 Real Capital Analytics, Inc. All rights reserved. Data believed to be accurate but not guaranteed; subject to future revision; based on properties & portfolios $10m and greater. 10