SlideShare uma empresa Scribd logo
1 de 20
Baixar para ler offline
VOLUME IV - ISSUE III SEPTEMBER - NOVEMBER 2010 EDITION PRICE: $595
NATIONAL ECONOMIC SUMMARY NATIONAL HOTEL MARKET SUMMARY
NATIONAL FORECAST SUMMARY
Year Occ ! Occ ADR !"ADR RevPAR !"RevPAR
NATIONAL SNAPSHOT: NEXT FOUR QUARTERS 2005 63.0% 2.9% $91.05 5.6% $57.35 8.6%
2006 63.1% 0.2% $97.95 7.6% $61.85 7.9%
2007 62.8% -0.5% $104.22 6.4% $65.49 5.9%
2008 59.9% -4.6% $107.19 2.9% $64.23 -1.9%
Occupancy 2009 54.6% -8.8% $97.89 -8.7% $53.48 -16.7%
2010F 57.5% 5.2% $97.33 -0.6% $55.93 4.6%
2011F 58.7% 2.1% $100.98 3.8% $59.23 5.9%
2012F 61.0% 4.0% $107.33 6.3% $65.49 10.6%
Average Daily Rate 2013F 62.7% 2.7% $115.77 7.9% $72.54 10.8%
2014F 62.3% -0.6% $122.22 5.6% $76.10 4.9%
Long Run Averages - 1988 to 2009
Revenue Per Available Room Source: Colliers PKF Hospitality Research, Smith Travel Research
** See Appendix for exhibit descriptions
Supply* * Dark blue indicates above long-term average
Demand
Source: Colliers PKF Hospitality Research Source: Colliers PKF Hospitality Research, Smith Travel Research
RevPAR: 2.3%ADR: 2.9%Occupancy: 62.1%
NATIONAL PLUS Edition
-4.0
-3.0
-2.0
-1.0
0.0
1.0
2.0
3.0
2005 2006 2007 2008 2009 2010F 2011F 2012F 2013F 2014F
NumberofStandardDeviations
NATIONAL ECONOMIC SUMMARY NATIONAL HOTEL MARKET SUMMARY
NATIONAL SNAPSHOT: NEXT FOUR QUARTERS
Exhibit 1**: Performance Grade vs. Long Run Average
The arrows show the forecast direction of change over the next 4
quarters vs. the previous 4 quarters. Light blue indicates above the
long run average, and dark blue indicates below.
∆ ∆
www.pkfc.com Next 4 Quarter Forecast
RevPAR Snapshot
-6.8%
6.6%
Last 4 Next 4
VOLUME IV - ISSUE III PRICE: $595SEPTEMBER - NOVEMBER 2010 EDITION
American
Hotel & Lodging
Association
COMPLIMENTARY COPY for NEW and RENEWING AH&LA MEMBERS
Colliers PKF Hospitality Research (PKF-HR) relies on Moody’s
Economy.com for guidance on macroeconomic variable movements.
Their forecasts are translated into future lodging industry performance
through a set of proprietary econometric models. The demand model
relies heavily on the movements of Total Employment and Real
Personal Income, along with ADR, to predict future room sales.
Both employment and income reached their cyclical low point in the
fourth quarter of 2009. The initial quarter of 2010 was the first period
of positive growth for the two economic variables, and while that
growth was modest, hotel demand reacted strongly. The price
elasticity of demand to fundamental economic drivers changes over the
course of a cycle. It is somewhat inelastic during times of normal
economic growth and highly elastic during times of economic decline
and recovery. A high level of price elasticity exists today following a
dramatic decline in ADR and translates into large levels of demand
movement. This pricing environment is expected to persist into 2011,
and then economic fundamentals will likely take over to elevate
demand.
Moody’s Economy.com expects income to reach its historical peak
again by the second quarter of 2011, and employment to fully recover
by the first quarter of 2013. The lag between these two variables can
be attributed to the severity of the loss each experienced during the
downturn. The US lost 6% of its entire employment base (8.3m), while
income only declined 3%, suggesting the jobs eliminated were low
income in nature.
As the outlook for the U.S. economy improves, so does our Hotel
Horizons® lodging forecast. Colliers PKF Hospitality Research (PKF-
HR) is forecasting a 4.6 percent increase in RevPAR for 2010. This
is a significant improvement over the 1.7 percent increase we
forecast back in June of this year.
The primary factor driving the improved forecast is the growth in
lodging demand. According to Smith Travel Research (STR), rooms
sold at U.S. hotels was 7.0 percent greater during the first half of
2010 as compared to the same period in 2009. Supported by our
econometric analysis, we believe demand for hotel rooms was
stimulated by the steep decline in room rates over the past six
quarters. Accordingly, PKF-HR has increased its forecast of lodging
demand growth for the year from 4.7 percent to 7.3 percent.
Despite the strong increase in demand, operators continue to struggle
to raise room rates. STR data shows that the ADR for U.S. hotels
declined 2.0 percent from the first half of 2009. Pricing power will
return to a limited degree during the second half of 2010, room rates
are still forecast to decline by 0.6 percent on an annual basis.
Alas, a quicker recovery in 2010 will lead to a more modest year in
2011. PKF-HR is forecasting RevPAR to increase 5.9 percent next
year. The interesting question we have been pondering is, “How
much will the demand for rooms suffer as room rates rise in 2011?"
Occupancy will increase to 58.2%, better than the previous 4
quarters' rate of 55.8%, but below the long run average of 62.1%
ADR growth expectations are increasing, positive 2.2% vs. the past
4 quarters' rate of negative 5.6%, but are below the long run
average of positive 2.9%
RevPAR growth projections for the next 4 quarters are climbing to
6.6% as compared to the past 4 quarters' rate of negative 6.8%,
and are greater than the long run average of positive 2.3%
Supply growth is less active, 1.4% vs. the past 4 quarters' rate of
2.8%, and under the long run average of 2.0%
Forecast demand growth is climbing, 5.8% vs. the past 4 quarters'
rate of 1.5%, and is greater than the long run average of 1.3%
SEPTEMBER - NOVEMBER 2010 EDITION NATIONAL PLUS
National Economic Summary
*See Appendix for exhibit descriptions *See Appendix for exhibit descriptions
*See Appendix for exhibit descriptions
P. 2 | COLLIERS PKF HOSPITALITY RESEARCH
Below are a select number of variables that drive the Colliers PKF-HR econometric forecasts contained in this report. Income and employment are
important barometers of economic health and are used in every Hotel Horizons® forecast model. The lodging market is part of the larger economy,
and the forces that affect us nationally also affect lodging, but in different magnitudes and time periods (see Exhibits 4 and 5 below). Exhibits 2 - 6
provide an overview of current economic history and forecast, and provide explanation of what to expect in the future, and how that affects the lodging
industry.
-4%
-3%
-2%
-1%
0%
1%
2%
3%
4%
5%
6%
7%
8%
1988
1990
1992
1994
1996
1998
2000
2002
2004
2006
2008
2010F
2012F
Real Personal Income
-6%
-5%
-4%
-3%
-2%
-1%
0%
1%
2%
3%
4%
1988
1990
1992
1994
1996
1998
2000
2002
2004
2006
2008
2010F
2012F
Total Payroll Employment
1.2%
2.9%
2.7% 2.7%
1.8%
2.3%
3.6%
3.3%
0.0%
1.0%
2.0%
3.0%
4.0%
Change in Total Employment Change in Consumer Price Index Change in Gross Metro Product Change in Real Personal Income
US 1988 to 2009 US 2010 to 2014
-6%
-5%
-4%
-3%
-2%
-1%
0%
1%
2%
3%
2009.1
2009.2
2009.3
2009.4
2010.1
2010.2
2010.3
2010.4
2011.1
2011.2
2011.3
2011.4
-10%
-8%
-6%
-4%
-2%
0%
2%
4%
6%
8%
10%
Employment (Left) Demand (Right)
Source: Moody's Economy.com
Source: Moody's Economy.com Source: Moody's Economy.com
-3%
-2%
-1%
0%
1%
2%
3%
4%
5%
2009.1
2009.2
2009.3
2009.4
2010.1
2010.2
2010.3
2010.4
2011.1
2011.2
2011.3
2011.4
-25%
-20%
-15%
-10%
-5%
0%
5%
10%
Income (Left) RevPAR (Right)
Source: Moody's Economy.com, Colliers PKF-HR, Smith Travel Research Source: Moody's Economy.com, Colliers PKF-HR, Smith Travel Research
See graph below See graph below
HOTEL HORIZONS® SEPTEMBER - NOVEMBER 2010 EDITION NATIONAL PLUS
Exhibit 2*: Income Change Exhibit 3*: Employment Change
Exhibit 4*: Quarterly Income vs. RevPAR Change Exhibit 5*: Quarterly Employment vs. Demand Change
Exhibit 6*: Average Annual Growth Rates
SEPTEMBER - NOVEMBER 2010 EDITION NATIONAL PLUS
National Hotel Summary
Exhibit 7*: Compound Average Annual ADR Change 2005 to 2009 Exhibit 8*: Compound Average Annual RevPAR Change 2005
*See Appendix for exhibit descriptions *See Appendix for exhibit descriptions
Exhibit 9*: Compound Average Annual ADR Change 2010 to 2014 Forecast Exhibit 10*: Compound Average Annual RevPAR Change 201
*See Appendix for exhibit descriptions *See Appendix for exhibit descriptions
*See Appendix for exhibit descriptions
P. 3 | COLLIERS PKF HOSPITALITY RESEARCH
The graphs on the left illustrate the magnitude of change in performance during the historical and forecasted period 2005 to 2014. Used as a relative
benchmark, each market segment is plotted against a common index value of 2005 = 100. This method provides clear insight of how each market
segment performed and is expected to perform in relation to others in the specified period. The charts on the right compare near-term historical
compound annual growth rates (CAGR) to the CAGRs for the forecast period.
0.6%
3.2%
1.8%
1.2%
0.3%
-0.3%
-1.0% 0.0% 1.0% 2.0% 3.0% 4.0%
Economy
Midscale w/o F&B
Midscale W/ F&B
Upscale
Upper Upscale
Luxury
-3.3%
-0.9%
-2.8%
-2.2%
-2.3%
-3.5%
-4.0% -3.0% -2.0% -1.0% 0.0%
Economy
Midscale w/o F&B
Midscale W/ F&B
Upscale
Upper Upscale
Luxury
2.3%
6.6%
2.1%
5.3%
5.0%
7.8%
0.0% 3.0% 6.0% 9.0%
Economy
Midscale w/o F&B
Midscale W/ F&B
Upscale
Upper Upscale
Luxury
1.7%
8.5%
1.0%
7.0%
7.4%
9.5%
0.0% 2.0% 4.0% 6.0% 8.0% 10.0% 12.0%
Economy
Midscale w/o F&B
Midscale W/ F&B
Upscale
Upper Upscale
Luxury
1.3%
8.4%
-2.1%
6.2%
2.0%
3.7%
-2.8%
0.7%
-6.5%
1.7%
0.1%
2.0%1.8%
5.2%
-2.1%
4.6%
3.3%
2.2%
-8%
-6%
-4%
-2%
0%
2%
4%
6%
8%
10%
Economy Midscale w/o F&B Midscale W/ F&B Upscale Upper Upscale Luxury
Historical Demand Change 1988-2009
Historical Demand Change 2005-2009
Forecast Demand Change 2010-2014
Source: Colliers PKF Hospitality Research, Smith Travel Research
Exhibit 9*: Compound Average Annual ADR Change
2010 to 2014 Forecast
Exhibit 8*: Compound Average Annual RevPAR Change
2005 to 2009
Exhibit 10*: Compound Average Annual RevPAR Change
2010 to 2014 Forecast
Exhibit 7*: Compound Average Annual ADR Change
2005 to 2009
Exhibit 11*: Historical vs. Forecast Compound Average Annual Demand Change
HOTEL HORIZONS® SEPTEMBER - NOVEMBER 2010 EDITION NATIONAL PLUS
SEPTEMBER - NOVEMBER 2010 EDITION NATIONAL PLUS
National Hotel Summary
*See Appendix for exhibit descriptions *See Appendix for exhibit descriptions
P. 4 | COLLIERS PKF HOSPITALITY RESEARCH
The graphs on the left illustrate the magnitude of change in performance during the historical and forecasted period 2005 to 2014. Used as a relative
benchmark, each market segment is plotted against a common index value of 2005 = 100. This method provides clear insight of how each market
segment performed and is expected to perform in relation to others in the specified period.
80
90
100
110
120
130
140
150
2005 2006 2007 2008 2009 2010F 2011F 2012F 2013F 2014F
All Luxury
Upper Upscale Upscale
Midscale W/ F&B
80
90
100
110
120
130
140
150
2005 2006 2007 2008 2009 2010F 2011F 2012F 2013F 2014F
All Midscale w/o F&B
Economy
90
100
110
120
130
2005 2006 2007 2008 2009 2010F 2011F 2012F 2013F 2014F
All Luxury
Upper Upscale Upscale
Midscale W/ F&B
90
100
110
120
130
140
150
2005 2006 2007 2008 2009 2010F 2011F 2012F 2013F 2014F
All Midscale w/o F&B
Economy
80
85
90
95
100
105
2005 2006 2007 2008 2009 2010F 2011F 2012F 2013F 2014F
All Midscale w/o F&B Economy
80
85
90
95
100
105
110
2005 2006 2007 2008 2009 2010F 2011F 2012F 2013F 2014F
All Luxury
Upper Upscale Upscale
Midscale W/ F&B
Source: Colliers PKF Hospitality Research, Smith Travel Research
HOTEL HORIZONS® SEPTEMBER - NOVEMBER 2010 EDITION NATIONAL PLUS
Exhibit 14*: Lower-Priced Average Daily Rate (ADR)
Exhibit 12*: Lower-Priced Hotel Occupancy Exhibit 13*: Upper-Priced Hotel Occupancy
Exhibit 15*: Upper-Priced Average Daily Rate (ADR)
Exhibit 16*: Lower-Priced RevPAR Exhibit 17*: Upper-Priced RevPAR
SEPTEMBER - NOVEMBER 2010 EDITION NATIONAL PLUS
National Forecast - All Hotels
Year Period Occ !"Occ ADR !"ADR RevPAR !"RevPAR !"Supply !"Demand
2005 Annual 63.0% 2.9% $91.05 5.6% $57.35 8.6% -0.1% 2.8%
2006 Annual 63.1% 0.2% $97.95 7.6% $61.85 7.9% 0.2% 0.5%
2007 Annual 62.8% -0.5% $104.22 6.4% $65.49 5.9% 1.3% 0.8%
2008 1 57.2% -3.3% $108.78 5.2% $62.24 1.7% 2.0% -1.4%
2008 2 64.3% -3.2% $108.15 4.4% $69.51 1.0% 2.3% -1.0%
2008 3 65.5% -4.0% $107.55 3.1% $70.40 -1.0% 2.6% -1.5%
2008 4 52.7% -8.3% $103.92 -1.6% $54.74 -9.8% 3.0% -5.6%
2008 Annual 59.9% -4.6% $107.19 2.9% $64.23 -1.9% 2.5% -2.3%
2009 1 50.8% -11.3% $100.64 -7.5% $51.10 -17.9% 3.1% -8.5%
2009 2 57.2% -11.1% $97.89 -9.5% $55.96 -19.5% 3.0% -8.4%
2009 3 60.2% -8.0% $97.13 -9.7% $58.48 -16.9% 3.1% -5.2%
2009 4 50.3% -4.5% $96.09 -7.5% $48.34 -11.7% 3.0% -1.6%
2009 Annual 54.6% -8.8% $97.89 -8.7% $53.48 -16.7% 3.0% -6.0%
2010 1 52.0% 2.3% $96.34 -4.3% $50.05 -2.0% 2.7% 5.1%
2010 2 60.7% 6.2% $97.87 0.0% $59.44 6.2% 2.3% 8.7%
2010F 3 64.2% 6.7% $98.00 0.9% $62.94 7.6% 1.8% 8.6%
2010F 4 52.8% 5.0% $96.83 0.8% $51.15 5.8% 1.4% 6.4%
2010F Annual 57.5% 5.2% $97.33 -0.6% $55.93 4.6% 2.0% 7.3%
2011F 1 53.6% 3.1% $100.51 4.3% $53.84 7.6% 1.7% 4.8%
2011F 2 62.3% 2.5% $100.65 2.8% $62.67 5.4% 0.7% 3.3%
2011F 3 64.9% 1.0% $101.82 3.9% $66.05 4.9% 0.5% 1.5%
2011F 4 53.9% 2.1% $100.80 4.1% $54.36 6.3% 1.6% 3.7%
2011F Annual 58.7% 2.1% $100.98 3.8% $59.23 5.9% 1.1% 3.2%
2012F Annual 61.0% 4.0% $107.33 6.3% $65.49 10.6% 0.8% 4.9%
2013F Annual 62.7% 2.7% $115.77 7.9% $72.54 10.8% 1.2% 3.9%
2014F Annual 62.3% -0.6% $122.22 5.6% $76.10 4.9% 2.3% 1.7%
Source: Colliers PKF Hospitality Research, Smith Travel Research
National Financial Benchmarks* - All Hotels
Average Room Count
Average Occupancy
Average Daily Rate
Average RevPAR
Financial Line Item
Rooms Revenue
Food and Beverage Revenue
Total Departmental Costs
Total Departmental Income
Undistributed Operating Expenses
Gross Operating Profit
Management Fees, Property Taxes, and Insurance
Net Operating Income**
*Data from 2010 "Trends® in the Hotel Industry" report Source: Colliers PKF Hospitality Research
**Before deductions for capital reserves, rent, interest, income taxes, depreciation, and amortization.
92
2010 Estimate2009 Actual
92
2008 Actual
92
59.9% 57.5%
$97.33$107.19 $97.89
54.6%
77.0%
20.1%
$64.25
19.5%
$53.48
2009 Actual
Percent of Total Revenue
2008 Actual 2010 Estimate
$55.93
41.3%
19.4%
77.8%
25.2%
33.5%
17.5%
7.9%
21.6%
58.7%
8.4%
21.3%
12.9% 13.4%
8.2%
P. 5 | COLLIERS PKF HOSPITALITY RESEARCH
37.1%
57.2%
42.8%
58.4%
35.6%
77.6%
41.6%
For a more comparable and detailed financial comparison, we recommend a Colliers PKF Benchmarker report. Please contact Claude Vargo at
(404) 842-1150, ext. 237 for more information.
National Financial Benchmarks* - All Hotels
HOTEL HORIZONS® SEPTEMBER - NOVEMBER 2010 EDITION NATIONAL PLUS
SEPTEMBER - NOVEMBER 2010 EDITION NATIONAL PLUS
National Forecast - Luxury Hotels
Year Period Occ !"Occ ADR !"ADR RevPAR !"RevPAR !"Supply !"Demand
2005 Annual 70.1% 4.1% $246.08 6.9% $172.60 11.3% -0.4% 3.7%
2006 Annual 71.5% 1.9% $269.60 9.6% $192.73 11.7% 4.5% 6.6%
2007 Annual 71.4% -0.2% $290.62 7.8% $207.43 7.6% 3.8% 3.6%
2008 1 68.0% -3.8% $303.64 3.9% $206.40 0.0% 4.2% 0.2%
2008 2 72.0% -2.5% $290.50 1.2% $209.22 -1.4% 4.4% 1.8%
2008 3 69.6% -4.6% $278.65 0.5% $193.81 -4.1% 4.7% -0.1%
2008 4 59.7% -12.2% $289.96 -5.6% $173.17 -17.1% 5.9% -7.0%
2008 Annual 67.3% -5.8% $290.53 0.0% $195.41 -5.8% 4.8% -1.2%
2009 1 57.1% -16.1% $264.55 -12.9% $150.97 -26.9% 9.1% -8.5%
2009 2 62.7% -13.0% $236.94 -18.4% $148.54 -29.0% 9.1% -5.1%
2009 3 65.3% -6.2% $225.21 -19.2% $146.99 -24.2% 8.8% 2.1%
2009 4 60.5% 1.3% $250.10 -13.7% $151.24 -12.7% 7.8% 9.1%
2009 Annual 61.4% -8.7% $243.37 -16.2% $149.43 -23.5% 8.7% -0.8%
2010 1 63.1% 10.6% $247.06 -6.6% $155.95 3.3% 5.1% 16.2%
2010 2 69.1% 10.2% $242.12 2.2% $167.27 12.6% 1.8% 12.1%
2010F 3 70.8% 8.5% $237.69 5.5% $168.32 14.5% 1.6% 10.2%
2010F 4 63.6% 5.2% $262.78 5.1% $167.18 10.5% 1.0% 6.2%
2010F Annual 66.6% 8.5% $247.07 1.5% $164.67 10.2% 2.3% 11.1%
2011F 1 67.0% 6.2% $262.97 6.4% $176.21 13.0% 0.7% 6.9%
2011F 2 71.6% 3.6% $256.48 5.9% $183.56 9.7% 1.1% 4.7%
2011F 3 73.5% 3.8% $253.57 6.7% $186.42 10.8% 1.3% 5.2%
2011F 4 65.1% 2.3% $279.65 6.4% $181.98 8.9% 1.2% 3.5%
2011F Annual 69.3% 4.0% $262.75 6.3% $182.04 10.5% 1.1% 5.1%
2012F Annual 70.5% 1.8% $287.35 9.4% $202.57 11.3% 0.7% 2.5%
2013F Annual 71.2% 0.9% $313.18 9.0% $222.84 10.0% 0.3% 1.2%
2014F Annual 71.0% -0.2% $333.96 6.6% $237.14 6.4% 0.5% 0.3%
Source: Colliers PKF Hospitality Research, Smith Travel Research
National Financial Benchmarks* - Luxury Hotels
Average Room Count
Average Occupancy
Average Daily Rate
Average RevPAR
Financial Line Item
Rooms Revenue
Food and Beverage Revenue
Total Departmental Costs
Total Departmental Income
Undistributed Operating Expenses
Gross Operating Profit
Management Fees, Property Taxes, and Insurance
Net Operating Income**
*Data from 2010 "Trends® in the Hotel Industry" report Source: Colliers PKF Hospitality Research
**Before deductions for capital reserves, rent, interest, income taxes, depreciation, and amortization.
18.6% 9.1% 14.5%
26.0% 17.4% 22.1%
7.3% 8.3% 7.6%
50.6% 46.6% 48.2%
24.7% 29.2% 26.1%
33.0% 35.7% 34.6%
49.4% 53.4% 51.8%
2008 Actual 2009 Actual 2010 Estimate
56.8% 53.3% 54.7%
$195.41 $149.43 $164.67
Percent of Total Revenue
61.4% 66.6%
$290.53 $243.37 $247.07
P. 6 | COLLIERS PKF HOSPITALITY RESEARCH
For a more comparable and detailed financial comparison, we recommend a Colliers PKF Benchmarker report. Please contact Claude Vargo at
(404) 842-1150, ext. 237 for more information.
2008 Actual 2009 Actual 2010 Estimate
304 304 304
67.3%
National Financial Benchmarks* - Luxury Hotels
HOTEL HORIZONS® SEPTEMBER - NOVEMBER 2010 EDITION NATIONAL PLUS
SEPTEMBER - NOVEMBER 2010 EDITION NATIONAL PLUS
National Forecast - Upper Upscale Hotels
Year Period Occ !"Occ ADR !"ADR RevPAR !"RevPAR !"Supply !"Demand
2005 Annual 70.8% 2.6% $140.17 6.8% $99.17 9.5% 1.4% 3.9%
2006 Annual 71.0% 0.4% $149.67 6.8% $106.27 7.2% 0.9% 1.3%
2007 Annual 71.0% 0.0% $158.07 5.6% $112.26 5.6% 1.6% 1.6%
2008 1 67.6% -2.5% $164.08 3.6% $110.88 0.9% 3.2% 0.6%
2008 2 73.9% -1.3% $163.97 3.1% $121.10 1.8% 4.1% 2.7%
2008 3 71.6% -2.5% $156.02 2.0% $111.69 -0.6% 4.0% 1.3%
2008 4 61.1% -8.1% $157.28 -3.1% $96.13 -10.9% 4.1% -4.3%
2008 Annual 68.5% -3.5% $160.40 1.5% $109.90 -2.1% 3.8% 0.2%
2009 1 59.5% -11.9% $150.47 -8.3% $89.58 -19.2% 5.9% -6.7%
2009 2 66.5% -9.9% $142.84 -12.9% $95.03 -21.5% 4.5% -5.9%
2009 3 67.7% -5.5% $134.63 -13.7% $91.08 -18.5% 4.4% -1.3%
2009 4 61.1% -0.1% $141.10 -10.3% $86.19 -10.3% 4.5% 4.4%
2009 Annual 63.7% -7.0% $142.00 -11.5% $90.46 -17.7% 4.8% -2.6%
2010 1 63.7% 7.0% $139.42 -7.3% $88.78 -0.9% 2.5% 9.7%
2010 2 72.0% 8.2% $142.47 -0.3% $102.53 7.9% 2.1% 10.5%
2010F 3 71.7% 5.9% $136.11 1.1% $97.53 7.1% 1.8% 7.8%
2010F 4 64.1% 4.9% $141.63 0.4% $90.77 5.3% 1.3% 6.3%
2010F Annual 67.8% 6.5% $139.88 -1.5% $94.90 4.9% 1.9% 8.6%
2011F 1 66.2% 4.0% $146.81 5.3% $97.23 9.5% 1.0% 5.1%
2011F 2 72.5% 0.8% $146.03 2.5% $105.94 3.3% 1.1% 1.9%
2011F 3 72.6% 1.3% $142.10 4.4% $103.15 5.8% 0.9% 2.3%
2011F 4 66.0% 3.0% $149.99 5.9% $99.01 9.1% 0.7% 3.7%
2011F Annual 69.3% 2.2% $146.13 4.5% $101.33 6.8% 0.9% 3.2%
2012F Annual 71.5% 3.1% $154.70 5.9% $110.57 9.1% 0.6% 3.7%
2013F Annual 73.3% 2.6% $164.55 6.4% $120.62 9.1% 0.8% 3.4%
2014F Annual 74.3% 1.4% $169.89 3.2% $126.27 4.7% 1.5% 2.9%
Source: Colliers PKF Hospitality Research, Smith Travel Research
National Financial Benchmarks* - Upper Upscale Hotels
Average Room Count
Average Occupancy
Average Daily Rate
Average RevPAR
Financial Line Item
Rooms Revenue
Food and Beverage Revenue
Total Departmental Costs
Total Departmental Income
Undistributed Operating Expenses
Gross Operating Profit
Management Fees, Property Taxes, and Insurance
Net Operating Income**
*Data from 2010 "Trends® in the Hotel Industry" report Source: Colliers PKF Hospitality Research
**Before deductions for capital reserves, rent, interest, income taxes, depreciation, and amortization.
29.5% 23.2% 26.5%
37.0% 31.3% 34.3%
7.5% 8.1% 7.7%
62.6% 60.5% 61.2%
25.6% 29.2% 26.9%
28.5% 30.2% 29.6%
37.4% 39.5% 38.8%
2008 Actual 2009 Actual 2010 Estimate
64.7% 62.7% 63.3%
$109.20 $90.46 $94.90
Percent of Total Revenue
63.7% 67.8%
$160.40 $142.00 $139.88
P. 7 | COLLIERS PKF HOSPITALITY RESEARCH
For a more comparable and detailed financial comparison, we recommend a Colliers PKF Benchmarker report. Please contact Claude Vargo at
(404) 842-1150, ext. 237 for more information.
2008 Actual 2009 Actual 2010 Estimate
367 367 367
68.5%
National Financial Benchmarks* - Upper Upscale Hotels
HOTEL HORIZONS® SEPTEMBER - NOVEMBER 2010 EDITION NATIONAL PLUS
SEPTEMBER - NOVEMBER 2010 EDITION NATIONAL PLUS
National Forecast - Upscale Hotels
Year Period Occ !"Occ ADR !"ADR RevPAR !"RevPAR !"Supply !"Demand
2005 Annual 70.0% 2.4% $102.56 7.5% $71.80 10.1% 1.5% 3.9%
2006 Annual 69.9% -0.2% $111.23 8.5% $77.75 8.3% 1.7% 1.6%
2007 Annual 69.0% -1.3% $118.17 6.2% $81.56 4.9% 3.9% 2.6%
2008 1 64.7% -2.9% $122.41 3.8% $79.21 0.8% 5.6% 2.5%
2008 2 71.8% -1.7% $121.26 2.5% $87.11 0.8% 5.8% 4.0%
2008 3 70.4% -2.8% $119.44 1.5% $84.08 -1.3% 6.2% 3.3%
2008 4 59.4% -7.2% $115.70 -2.7% $68.74 -9.7% 6.5% -1.2%
2008 Annual 66.5% -3.6% $119.77 1.3% $79.69 -2.3% 6.0% 2.2%
2009 1 57.3% -11.4% $112.84 -7.8% $64.71 -18.3% 7.9% -4.4%
2009 2 63.9% -11.1% $108.17 -10.8% $69.12 -20.7% 9.4% -2.7%
2009 3 65.2% -7.3% $105.49 -11.7% $68.83 -18.1% 10.3% 2.2%
2009 4 57.5% -3.2% $103.99 -10.1% $59.82 -13.0% 10.2% 6.7%
2009 Annual 61.0% -8.3% $107.48 -10.3% $65.57 -17.7% 9.5% 0.4%
2010 1 60.8% 6.1% $104.49 -7.4% $63.58 -1.7% 8.8% 15.4%
2010 2 69.2% 8.4% $106.75 -1.3% $73.90 6.9% 7.4% 16.4%
2010F 3 68.5% 5.0% $107.69 2.1% $73.77 7.2% 4.2% 9.4%
2010F 4 59.8% 3.9% $105.48 1.4% $63.05 5.4% 3.8% 7.8%
2010F Annual 64.6% 5.9% $106.17 -1.2% $68.57 4.6% 6.0% 12.2%
2011F 1 61.5% 1.1% $108.74 4.1% $66.90 5.2% 3.0% 4.1%
2011F 2 70.2% 1.4% $109.01 2.1% $76.53 3.6% 2.2% 3.6%
2011F 3 69.5% 1.5% $110.29 2.4% $76.65 3.9% 2.6% 4.1%
2011F 4 60.7% 1.5% $108.47 2.8% $65.80 4.4% 2.7% 4.3%
2011F Annual 65.5% 1.4% $109.16 2.8% $71.45 4.2% 2.6% 4.0%
2012F Annual 67.4% 3.0% $117.70 7.8% $79.36 11.1% 2.1% 5.2%
2013F Annual 68.3% 1.4% $127.11 8.0% $86.88 9.5% 2.2% 3.6%
2014F Annual 68.9% 0.9% $130.58 2.7% $90.01 3.6% 4.6% 5.4%
Source: Colliers PKF Hospitality Research, Smith Travel Research
National Financial Benchmarks* - Upscale Hotels
Average Room Count
Average Occupancy
Average Daily Rate
Average RevPAR
Financial Line Item
Rooms Revenue
Food and Beverage Revenue
Total Departmental Costs
Total Departmental Income
Undistributed Operating Expenses
Gross Operating Profit
Management Fees, Property Taxes, and Insurance
Net Operating Income**
*Data from 2010 "Trends® in the Hotel Industry" report Source: Colliers PKF Hospitality Research
**Before deductions for capital reserves, rent, interest, income taxes, depreciation, and amortization.
31.7% 26.7% 28.4%
41.1% 36.8% 38.2%
9.4% 10.1% 9.8%
69.8% 69.0% 68.8%
28.7% 32.2% 30.6%
9.2% 9.5% 9.5%
30.2% 31.0% 31.2%
2008 Actual 2009 Actual 2010 Estimate
88.5% 88.1% 88.1%
$79.69 $65.57 $68.57
Percent of Total Revenue
64.6%
$119.77 $107.48 $106.17
P. 8 | COLLIERS PKF HOSPITALITY RESEARCH
For a more comparable and detailed financial comparison, we recommend a Colliers PKF Benchmarker report. Please contact Claude Vargo at
(404) 842-1150, ext. 237 for more information.
2008 Actual 2009 Actual 2010 Estimate
146 146 146
66.5% 61.0%
National Financial Benchmarks* - Upscale Hotels
HOTEL HORIZONS® SEPTEMBER - NOVEMBER 2010 EDITION NATIONAL PLUS
SEPTEMBER - NOVEMBER 2010 EDITION NATIONAL PLUS
National Forecast - Midscale W/ F&B Hotels
Year Period Occ !"Occ ADR !"ADR RevPAR !"RevPAR !"Supply !"Demand
2005 Annual 58.8% 3.4% $77.69 5.2% $45.66 8.7% -3.0% 0.2%
2006 Annual 59.2% 0.7% $82.09 5.7% $48.59 6.4% -3.0% -2.3%
2007 Annual 58.5% -1.1% $85.89 4.6% $50.28 3.5% -2.5% -3.6%
2008 1 51.5% -4.8% $85.58 4.5% $44.05 -0.5% -2.5% -7.3%
2008 2 59.8% -4.7% $89.55 3.9% $53.52 -0.9% -2.5% -7.0%
2008 3 61.8% -5.2% $93.05 3.5% $57.47 -1.9% -1.1% -6.3%
2008 4 47.1% -9.8% $84.70 -0.1% $39.85 -9.8% -1.0% -10.7%
2008 Annual 55.0% -6.0% $88.58 3.1% $48.76 -3.0% -1.8% -7.7%
2009 1 45.1% -12.3% $81.76 -4.5% $36.91 -16.2% -1.6% -13.7%
2009 2 52.2% -12.6% $84.21 -6.0% $43.98 -17.8% -1.5% -13.9%
2009 3 55.5% -10.2% $86.72 -6.8% $48.09 -16.3% -1.3% -11.3%
2009 4 43.0% -8.6% $79.41 -6.2% $34.14 -14.3% -0.2% -8.8%
2009 Annual 49.0% -11.0% $83.31 -6.0% $40.79 -16.3% -1.1% -12.1%
2010 1 44.3% -1.8% $78.45 -4.1% $34.77 -5.8% 0.1% -1.7%
2010 2 54.2% 3.9% $83.10 -1.3% $45.08 2.5% 0.3% 4.2%
2010F 3 58.4% 5.4% $87.31 0.7% $51.02 6.1% -0.2% 5.1%
2010F 4 44.1% 2.5% $80.68 1.6% $35.57 4.2% 0.7% 3.2%
2010F Annual 50.3% 2.7% $82.77 -0.6% $41.61 2.0% 0.2% 2.9%
2011F 1 43.6% -1.5% $80.35 2.4% $35.06 0.9% 0.4% -1.2%
2011F 2 53.5% -1.4% $85.24 2.6% $45.61 1.2% 0.2% -1.1%
2011F 3 57.3% -1.9% $89.27 2.2% $51.19 0.3% 0.3% -1.6%
2011F 4 44.0% -0.1% $82.75 2.6% $36.45 2.5% -1.0% -1.1%
2011F Annual 49.7% -1.2% $84.79 2.4% $42.10 1.2% 0.0% -1.3%
2012F Annual 49.3% -0.7% $87.32 3.0% $43.06 2.3% -1.2% -1.9%
2013F Annual 48.7% -1.3% $89.28 2.2% $43.47 1.0% -1.3% -2.5%
2014F Annual 48.0% -1.4% $90.11 0.9% $43.24 -0.5% -1.2% -2.6%
Source: Colliers PKF Hospitality Research, Smith Travel Research
National Financial Benchmarks* - Midscale W/ F&B Hotels
Average Room Count
Average Occupancy
Average Daily Rate
Average RevPAR
Financial Line Item
Rooms Revenue
Food and Beverage Revenue
Total Departmental Costs
Total Departmental Income
Undistributed Operating Expenses
Gross Operating Profit
Management Fees, Property Taxes, and Insurance
Net Operating Income**
*Data from 2010 "Trends® in the Hotel Industry" report Source: Colliers PKF Hospitality Research
**Before deductions for capital reserves, rent, interest, income taxes, depreciation, and amortization.
15.9% 7.7% 8.5%
25.2% 18.0% 18.7%
9.3% 10.3% 10.2%
57.9% 56.2% 56.0%
32.7% 38.2% 37.3%
19.9% 20.7% 20.7%
42.1% 43.8% 44.0%
2008 Actual 2009 Actual 2010 Estimate
76.3% 75.3% 75.2%
$48.76 $40.79 $41.61
Percent of Total Revenue
49.0% 50.3%
$88.58 $83.31 $82.77
P. 9 | COLLIERS PKF HOSPITALITY RESEARCH
For a more comparable and detailed financial comparison, we recommend a Colliers PKF Benchmarker report. Please contact Claude Vargo at
(404) 842-1150, ext. 237 for more information.
2008 Actual 2009 Actual 2010 Estimate
112 112 112
55.0%
National Financial Benchmarks* - Midscale W/ F&B Hotels
HOTEL HORIZONS® SEPTEMBER - NOVEMBER 2010 EDITION NATIONAL PLUS
SEPTEMBER - NOVEMBER 2010 EDITION NATIONAL PLUS
National Forecast - Midscale w/o F&B Hotels
Year Period Occ !"Occ ADR !"ADR RevPAR !"RevPAR !"Supply !"Demand
2005 Annual 65.4% 3.8% $75.33 7.5% $49.28 11.5% 0.9% 4.7%
2006 Annual 66.0% 0.9% $81.38 8.0% $53.71 9.0% 3.0% 3.9%
2007 Annual 65.0% -1.5% $87.41 7.4% $56.83 5.8% 4.1% 2.5%
2008 1 59.0% -3.5% $89.06 5.2% $52.52 1.5% 4.9% 1.2%
2008 2 66.9% -3.4% $91.15 4.1% $61.02 0.6% 5.2% 1.7%
2008 3 67.1% -4.7% $93.21 3.6% $62.55 -1.3% 5.9% 0.9%
2008 4 53.9% -9.1% $87.73 0.9% $47.27 -8.3% 6.3% -3.4%
2008 Annual 61.7% -5.1% $90.46 3.5% $55.80 -1.8% 5.6% 0.2%
2009 1 52.2% -11.5% $86.21 -3.2% $45.01 -14.3% 6.7% -5.5%
2009 2 59.0% -11.8% $86.36 -5.3% $50.97 -16.5% 7.2% -5.5%
2009 3 60.6% -9.7% $86.98 -6.7% $52.74 -15.7% 7.5% -2.9%
2009 4 50.3% -6.7% $82.01 -6.5% $41.22 -12.8% 6.7% -0.5%
2009 Annual 55.5% -10.0% $85.49 -5.5% $47.47 -14.9% 7.0% -3.7%
2010 1 52.2% 0.0% $82.23 -4.6% $42.92 -4.6% 5.9% 5.8%
2010 2 62.2% 5.4% $85.24 -1.3% $53.04 4.1% 4.7% 10.4%
2010F 3 64.7% 6.7% $88.39 1.6% $57.19 8.4% 3.6% 10.6%
2010F 4 51.9% 3.3% $82.85 1.0% $43.02 4.4% 3.2% 6.6%
2010F Annual 57.8% 4.0% $84.91 -0.7% $49.05 3.3% 4.3% 8.5%
2011F 1 53.0% 1.6% $86.13 4.7% $45.67 6.4% 2.9% 4.6%
2011F 2 63.2% 1.5% $88.62 4.0% $55.99 5.6% 2.9% 4.5%
2011F 3 64.9% 0.3% $92.48 4.6% $60.03 5.0% 2.7% 3.0%
2011F 4 52.9% 1.8% $87.18 5.2% $46.08 7.1% 2.5% 4.3%
2011F Annual 58.5% 1.3% $88.81 4.6% $51.95 5.9% 2.7% 4.0%
2012F Annual 61.1% 4.5% $95.37 7.4% $58.29 12.2% 2.3% 6.9%
2013F Annual 62.6% 2.4% $103.34 8.4% $64.66 10.9% 3.3% 5.7%
2014F Annual 62.2% -0.7% $109.46 5.9% $68.05 5.2% 4.8% 4.1%
Source: Colliers PKF Hospitality Research, Smith Travel Research
National Financial Benchmarks* - Midscale w/o F&B Hotels
Average Room Count
Average Occupancy
Average Daily Rate
Average RevPAR
Financial Line Item
Rooms Revenue
Food and Beverage Revenue
Total Departmental Costs
Total Departmental Income
Undistributed Operating Expenses
Gross Operating Profit
Management Fees, Property Taxes, and Insurance
Net Operating Income**
*Data from 2010 "Trends® in the Hotel Industry" report Source: Colliers PKF Hospitality Research
**Before deductions for capital reserves, rent, interest, income taxes, depreciation, and amortization.
29.4% 22.9% 24.2%
37.9% 32.2% 33.3%
8.5% 9.3% 9.1%
70.7% 69.8% 69.6%
32.8% 37.6% 36.3%
0.0% 0.0% 0.0%
29.3% 30.2% 30.4%
2008 Actual 2009 Actual 2010 Estimate
98.3% 98.3% 98.2%
$55.80 $47.47 $49.05
Percent of Total Revenue
55.5% 57.8%
$90.46 $85.49 $84.91
P. 10 | COLLIERS PKF HOSPITALITY RESEARCH
For a more comparable and detailed financial comparison, we recommend a Colliers PKF Benchmarker report. Please contact Claude Vargo at
(404) 842-1150, ext. 237 for more information.
2008 Actual 2009 Actual 2010 Estimate
87 87 87
61.7%
National Financial Benchmarks* - Midscale w/o F&B Hotels
HOTEL HORIZONS® SEPTEMBER - NOVEMBER 2010 EDITION NATIONAL PLUS
SEPTEMBER - NOVEMBER 2010 EDITION NATIONAL PLUS
National Forecast - Economy Hotels
Year Period Occ !"Occ ADR !"ADR RevPAR !"RevPAR !"Supply !"Demand
2005 Annual 57.4% 3.3% $49.65 4.2% $28.48 7.6% 0.1% 3.4%
2006 Annual 57.1% -0.4% $52.34 5.4% $29.90 5.0% -0.6% -1.0%
2007 Annual 56.8% -0.6% $53.84 2.9% $30.56 2.2% 2.1% 1.4%
2008 1 50.4% -4.2% $52.45 2.4% $26.41 -1.9% 2.1% -2.1%
2008 2 57.7% -4.2% $55.09 2.0% $31.81 -2.3% 1.9% -2.4%
2008 3 59.9% -4.6% $57.49 0.9% $34.42 -3.8% 1.7% -3.0%
2008 4 47.8% -7.1% $51.97 -0.9% $24.82 -7.9% 1.5% -5.7%
2008 Annual 53.9% -5.0% $54.45 1.1% $29.37 -3.9% 1.8% -3.3%
2009 1 45.6% -9.5% $50.26 -4.2% $22.90 -13.3% 1.4% -8.2%
2009 2 51.3% -11.2% $51.79 -6.0% $26.55 -16.5% 1.2% -10.1%
2009 3 54.4% -9.2% $53.22 -7.4% $28.95 -15.9% 1.0% -8.3%
2009 4 44.7% -6.4% $47.31 -9.0% $21.16 -14.7% 1.0% -5.4%
2009 Annual 49.0% -9.2% $50.81 -6.7% $24.89 -15.2% 1.1% -8.1%
2010 1 45.6% 0.0% $46.48 -7.5% $21.18 -7.5% 0.9% 0.9%
2010 2 53.9% 5.0% $49.65 -4.1% $26.74 0.7% 0.8% 5.9%
2010F 3 58.0% 6.7% $52.37 -1.6% $30.39 5.0% 0.4% 7.1%
2010F 4 47.5% 6.3% $47.31 0.0% $22.49 6.3% 0.4% 6.7%
2010F Annual 51.2% 4.6% $49.17 -3.2% $25.20 1.2% 0.6% 5.3%
2011F 1 46.1% 1.2% $47.84 2.9% $22.06 4.2% 0.6% 1.8%
2011F 2 54.1% 0.4% $50.94 2.6% $27.54 3.0% 1.0% 1.4%
2011F 3 58.6% 1.1% $53.94 3.0% $31.63 4.1% 1.4% 2.5%
2011F 4 48.0% 0.9% $48.72 3.0% $23.37 3.9% 1.7% 2.6%
2011F Annual 51.7% 0.9% $50.59 2.9% $26.16 3.8% 1.2% 2.1%
2012F Annual 51.6% -0.3% $52.18 3.1% $26.90 2.9% 2.1% 1.8%
2013F Annual 51.2% -0.6% $53.49 2.5% $27.41 1.9% 2.8% 2.2%
2014F Annual 49.9% -2.6% $53.96 0.9% $26.94 -1.7% 3.7% 1.0%
Source: Colliers PKF Hospitality Research, Smith Travel Research
National Financial Benchmarks* - Economy Hotels
Average Room Count
Average Occupancy
Average Daily Rate
Average RevPAR
Financial Line Item
Rooms Revenue
Food and Beverage Revenue
Total Departmental Costs
Total Departmental Income
Undistributed Operating Expenses
Gross Operating Profit
Management Fees, Property Taxes, and Insurance
Net Operating Income**
*Data from 2010 "Trends® in the Hotel Industry" report Source: Colliers PKF Hospitality Research
**Before deductions for capital reserves, rent, interest, income taxes, depreciation, and amortization.
27.5% 15.5% 15.7%
37.4% 26.7% 26.8%
9.8% 11.2% 11.1%
70.3% 67.4% 66.6%
32.9% 40.7% 39.9%
0.0% 0.0% 0.0%
29.7% 32.6% 33.4%
2008 Actual 2009 Actual 2010 Estimate
99.0% 98.9% 98.8%
$29.37 $24.89 $25.20
Percent of Total Revenue
49.0% 51.2%
$54.45 $50.81 $49.17
P. 11 | COLLIERS PKF HOSPITALITY RESEARCH
For a more comparable and detailed financial comparison, we recommend a Colliers PKF Benchmarker report. Please contact Claude Vargo at
(404) 842-1150, ext. 237 for more information.
2008 Actual 2009 Actual 2010 Estimate
76 76 76
53.9%
National Financial Benchmarks* - Economy Hotels
HOTEL HORIZONS® SEPTEMBER - NOVEMBER 2010 EDITION NATIONAL PLUS
SEPTEMBER - NOVEMBER 2010 EDITION NATIONAL PLUS
National Forecasts by Location Classification
Urban Hotels Hotels located in densely populated areas, as in large metropolitan areas.
Year Period Occ !"Occ ADR !"ADR RevPAR !"RevPAR !"Supply !"Demand
2005 Annual 68.0% 4.0% $125.74 7.3% $85.50 11.6% -1.0% 3.0%
2006 Annual 68.3% 0.4% $138.18 9.9% $94.35 10.3% -0.9% -0.5%
2007 Annual 68.4% 0.1% $149.69 8.3% $102.33 8.5% 1.0% 1.2%
2008 Annual 66.4% -2.9% $154.87 3.5% $102.83 0.5% 2.0% -0.9%
2009 1 56.1% -11.2% $133.82 -8.5% $75.08 -18.8% 2.8% -8.7%
2009 2 64.8% -9.4% $136.76 -14.6% $88.55 -22.6% 2.7% -6.9%
2009 3 67.1% -5.8% $130.97 -14.7% $87.84 -19.7% 3.0% -3.0%
2009 4 59.5% -0.5% $143.87 -9.5% $85.59 -10.0% 2.9% 2.3%
2009 Annual 61.9% -6.8% $136.25 -12.0% $84.29 -18.0% 2.8% -4.2%
2010 1 59.4% 5.9% $127.68 -4.6% $75.87 1.0% 2.2% 8.3%
2010 2 69.9% 7.9% $141.61 3.6% $98.98 11.8% 2.2% 10.3%
2010F 3 70.8% 5.5% $134.34 2.6% $95.06 8.2% 1.8% 7.4%
2010F 4 61.1% 2.6% $145.66 1.2% $88.95 3.9% 1.4% 4.1%
2010F Annual 65.3% 5.5% $137.44 0.9% $89.74 6.5% 1.9% 7.5%
2011F 1 59.9% 0.8% $133.92 4.9% $80.17 5.7% 1.2% 1.9%
2011F 2 70.6% 0.9% $146.78 3.6% $103.56 4.6% 1.0% 1.9%
2011F 3 70.9% 0.1% $139.13 3.6% $98.58 3.7% 0.6% 0.8%
2011F 4 62.1% 1.7% $150.30 3.2% $93.30 4.9% 1.0% 2.7%
2011F Annual 65.8% 0.8% $142.65 3.8% $93.92 4.7% 0.9% 1.8%
2012F Annual 68.7% 4.4% $149.53 4.8% $102.74 9.4% 0.7% 5.1%
2013F Annual 70.2% 2.1% $162.06 8.4% $113.70 10.7% 0.5% 2.6%
2014F Annual 69.6% -0.8% $171.24 5.7% $119.14 4.8% 1.4% 0.5%
Source: Colliers PKF Hospitality Research, Smith Travel Research
Suburban Hotels Hotels located in the suburbs of metropolitan markets.
Year Period Occ !"Occ ADR !"ADR RevPAR !"RevPAR !"Supply !"Demand
2005 Annual 63.8% 3.8% $79.18 5.6% $50.51 9.6% 0.7% 4.5%
2006 Annual 63.8% 0.0% $85.39 7.8% $54.45 7.8% 0.9% 0.8%
2007 Annual 63.0% -1.2% $90.49 6.0% $57.03 4.7% 1.5% 0.4%
2008 Annual 59.8% -5.1% $92.84 2.6% $55.53 -2.6% 3.0% -2.2%
2009 1 50.6% -12.1% $87.74 -6.2% $44.41 -17.5% 3.6% -8.9%
2009 2 56.2% -13.0% $85.73 -8.8% $48.18 -20.7% 3.6% -9.8%
2009 3 58.3% -9.7% $84.52 -9.9% $49.27 -18.6% 3.6% -6.4%
2009 4 50.1% -4.8% $81.23 -9.2% $40.70 -13.6% 3.6% -1.4%
2009 Annual 53.8% -10.0% $84.80 -8.7% $45.63 -17.8% 3.6% -6.8%
2010 1 52.3% 3.4% $82.35 -6.1% $43.09 -3.0% 3.4% 6.9%
2010 2 60.5% 7.7% $84.08 -1.9% $50.90 5.6% 3.0% 11.0%
2010F 3 62.5% 7.3% $85.03 0.6% $53.19 8.0% 2.8% 10.3%
2010F 4 53.2% 6.2% $82.05 1.0% $43.67 7.3% 1.6% 7.9%
2010F Annual 57.2% 6.3% $83.48 -1.6% $47.73 4.6% 2.7% 9.1%
2011F 1 54.1% 3.3% $86.52 5.1% $46.79 8.6% 1.5% 4.9%
2011F 2 61.7% 2.0% $87.96 4.6% $54.29 6.7% 1.1% 3.0%
2011F 3 63.1% 1.0% $89.17 4.9% $56.30 5.9% 0.5% 1.5%
2011F 4 54.2% 1.9% $86.18 5.0% $46.75 7.0% 1.6% 3.6%
2011F Annual 58.3% 2.0% $87.54 4.9% $51.03 6.9% 1.2% 3.2%
2012F Annual 60.7% 4.2% $93.12 6.4% $56.54 10.8% 0.9% 5.1%
2013F Annual 62.8% 3.4% $100.35 7.8% $63.00 11.4% 1.3% 4.8%
2014F Annual 62.7% -0.1% $106.11 5.7% $66.52 5.6% 2.9% 2.7%
Source: Colliers PKF Hospitality Research, Smith Travel Research
P. 12 | COLLIERS PKF HOSPITALITY RESEARCH
Location segments are hotel classifications driven by physical location. Chain management has provided STR with location classifications for a
significant number of hotels. Location segments include Urban, Suburban, Airport, Interstate, Resort, and Small Metro/Small Town.
HOTEL HORIZONS® SEPTEMBER - NOVEMBER 2010 EDITION NATIONAL PLUS
SEPTEMBER - NOVEMBER 2010 EDITION NATIONAL PLUS
National Forecast by Location Classification (cont'd)
Airport Hotels
Hotels in close proximity of an airport that primarily serve demand from airport traffic. Distance may vary.
Year Period Occ !"Occ ADR !"ADR RevPAR !"RevPAR !"Supply !"Demand
2005 Annual 68.7% 3.1% $84.74 7.9% $58.19 11.3% 0.0% 3.1%
2006 Annual 69.2% 0.7% $92.84 9.6% $64.20 10.3% 0.3% 1.0%
2007 Annual 69.2% 0.0% $98.94 6.6% $68.46 6.6% 1.3% 1.4%
2008 Annual 66.0% -4.7% $101.13 2.2% $66.70 -2.6% 2.3% -2.4%
2009 1 58.6% -11.6% $96.98 -6.9% $56.85 -17.7% 3.1% -8.8%
2009 2 61.9% -11.7% $90.85 -11.5% $56.27 -21.9% 3.2% -9.0%
2009 3 62.2% -8.7% $87.25 -12.7% $54.27 -20.4% 3.2% -5.9%
2009 4 56.5% -4.6% $86.33 -11.3% $48.82 -15.4% 3.1% -1.6%
2009 Annual 59.8% -9.3% $90.31 -10.7% $54.03 -19.0% 3.1% -6.5%
2010 1 61.4% 4.8% $89.25 -8.0% $54.83 -3.6% 2.7% 7.6%
2010 2 66.4% 7.2% $88.72 -2.3% $58.93 4.7% 2.3% 9.7%
2010F 3 66.5% 6.9% $87.82 0.6% $58.38 7.6% 2.1% 9.1%
2010F 4 58.8% 3.9% $86.79 0.5% $50.99 4.5% 1.4% 5.3%
2010F Annual 63.3% 5.8% $88.16 -2.4% $55.78 3.2% 2.1% 8.0%
2011F 1 63.4% 3.2% $91.38 2.4% $57.95 5.7% 1.4% 4.6%
2011F 2 67.8% 2.1% $89.79 1.2% $60.91 3.4% 1.2% 3.4%
2011F 3 67.2% 1.0% $89.69 2.1% $60.24 3.2% 0.9% 1.9%
2011F 4 60.8% 3.4% $89.49 3.1% $54.38 6.6% 1.5% 5.0%
2011F Annual 64.8% 2.4% $90.08 2.2% $58.36 4.6% 1.2% 3.7%
2012F Annual 67.3% 3.9% $95.99 6.6% $64.64 10.8% 0.7% 4.7%
2013F Annual 69.0% 2.4% $103.38 7.7% $71.30 10.3% 0.8% 3.2%
2014F Annual 68.3% -0.9% $108.12 4.6% $73.90 3.7% 2.3% 1.3%
Source: Colliers PKF Hospitality Research, Smith Travel Research
Interstate Hotels
Hotels near major highways whose primary source of business is through passerby travel. Excludes suburban.
Year Period Occ !"Occ ADR !"ADR RevPAR !"RevPAR !"Supply !"Demand
2005 Annual 56.8% 1.7% $60.01 3.9% $34.08 5.7% 1.0% 2.7%
2006 Annual 57.7% 1.7% $63.43 5.7% $36.63 7.5% 1.0% 2.7%
2007 Annual 57.7% -0.1% $66.98 5.6% $38.63 5.5% 1.7% 1.5%
2008 Annual 54.7% -5.2% $70.09 4.6% $38.31 -0.8% 3.0% -2.4%
2009 1 45.2% -9.1% $66.83 0.4% $30.18 -8.8% 3.7% -5.8%
2009 2 53.1% -10.2% $69.65 -1.1% $36.95 -11.1% 3.6% -7.0%
2009 3 56.1% -8.7% $71.98 -2.4% $40.37 -10.9% 3.4% -5.6%
2009 4 44.3% -8.5% $67.24 -2.0% $29.79 -10.3% 3.2% -5.6%
2009 Annual 49.7% -9.1% $69.14 -1.4% $34.34 -10.4% 3.5% -6.0%
2010 1 43.8% -3.1% $66.60 -0.4% $29.15 -3.4% 3.1% -0.1%
2010 2 54.8% 3.4% $69.76 0.2% $38.25 3.5% 2.6% 6.1%
2010F 3 59.6% 6.3% $72.62 0.9% $43.30 7.2% 2.3% 8.7%
2010F 4 45.7% 3.2% $67.73 0.7% $30.98 4.0% 1.5% 4.7%
2010F Annual 51.0% 2.7% $69.47 0.5% $35.44 3.2% 2.4% 5.1%
2011F 1 44.7% 2.0% $67.79 1.8% $30.28 3.9% 1.2% 3.3%
2011F 2 55.7% 1.6% $70.82 1.5% $39.47 3.2% 0.8% 2.4%
2011F 3 60.2% 0.9% $74.22 2.2% $44.67 3.2% 0.4% 1.4%
2011F 4 46.3% 1.3% $69.99 3.3% $32.44 4.7% 1.3% 2.6%
2011F Annual 51.7% 1.4% $70.97 2.2% $36.71 3.6% 0.9% 2.3%
2012F Annual 53.8% 3.9% $75.42 6.3% $40.55 10.5% 0.8% 4.8%
2013F Annual 54.7% 1.7% $81.77 8.4% $44.72 10.3% 1.2% 2.9%
2014F Annual 54.8% 0.3% $86.90 6.3% $47.65 6.6% 2.6% 2.9%
P. 13 | COLLIERS PKF HOSPITALITY RESEARCH
HOTEL HORIZONS® SEPTEMBER - NOVEMBER 2010 EDITION NATIONAL PLUS
SEPTEMBER - NOVEMBER 2010 EDITION NATIONAL PLUS
National Forecast by Location Classification (cont'd)
Resort Hotels
Hotels located in resort areas where the primary source of business is from leisure destination travel.
Year Period Occ !"Occ ADR !"ADR RevPAR !"RevPAR !"Supply !"Demand
2005 Annual 66.3% 1.0% $126.50 6.0% $83.87 7.1% -2.4% -1.4%
2006 Annual 65.9% -0.6% $136.41 7.8% $89.90 7.2% -1.6% -2.2%
2007 Annual 65.5% -0.5% $144.38 5.8% $94.63 5.3% 0.1% -0.4%
2008 Annual 61.6% -6.1% $146.82 1.7% $90.38 -4.5% 1.2% -5.0%
2009 1 55.4% -13.0% $147.35 -11.8% $81.66 -23.3% 1.7% -11.5%
2009 2 59.4% -9.2% $127.10 -12.1% $75.45 -20.2% 1.6% -7.7%
2009 3 61.4% -5.0% $123.33 -11.7% $75.75 -16.1% 1.5% -3.5%
2009 4 51.7% -1.7% $121.56 -9.4% $62.81 -10.9% 1.8% 0.1%
2009 Annual 57.0% -7.4% $129.68 -11.7% $73.89 -18.2% 1.7% -5.9%
2010 1 57.1% 3.1% $140.62 -4.6% $80.31 -1.7% 1.5% 4.6%
2010 2 61.9% 4.4% $125.96 -0.9% $78.04 3.4% 0.8% 5.2%
2010F 3 66.2% 7.8% $123.48 0.1% $81.79 8.0% 0.6% 8.4%
2010F 4 55.7% 7.8% $122.40 0.7% $68.17 8.5% 0.3% 8.1%
2010F Annual 60.3% 5.8% $127.91 -1.4% $77.08 4.3% 0.8% 6.6%
2011F 1 61.6% 7.8% $146.61 4.3% $90.29 12.4% 0.8% 8.7%
2011F 2 66.8% 7.9% $130.17 3.3% $86.98 11.5% 0.3% 8.2%
2011F 3 68.3% 3.1% $130.76 5.9% $89.25 9.1% 0.3% 3.3%
2011F 4 57.7% 3.7% $129.95 6.2% $75.03 10.1% 1.4% 5.1%
2011F Annual 63.6% 5.5% $134.24 4.9% $85.37 10.8% 0.7% 6.2%
2012F Annual 65.9% 3.6% $145.89 8.7% $96.14 12.6% 0.7% 4.3%
2013F Annual 67.8% 2.9% $157.33 7.8% $106.70 11.0% 1.2% 4.1%
2014F Annual 66.6% -1.8% $166.97 6.1% $111.18 4.2% 1.8% -0.1%
Source: Colliers PKF Hospitality Research, Smith Travel Research
Small Metro/Town Hotels
Year Period Occ !"Occ ADR !"ADR RevPAR !"RevPAR !"Supply !"Demand
2005 Annual 56.5% 2.2% $71.44 3.7% $40.37 6.0% 0.4% 2.6%
2006 Annual 56.9% 0.6% $75.18 5.2% $42.75 5.9% 0.7% 1.4%
2007 Annual 56.9% 0.0% $79.37 5.6% $45.15 5.6% 1.5% 1.5%
2008 Annual 54.7% -3.9% $82.48 3.9% $45.09 -0.1% 2.5% -1.5%
2009 1 44.0% -8.9% $75.43 -1.3% $33.20 -10.1% 2.9% -6.3%
2009 2 52.2% -10.3% $80.12 -1.7% $41.79 -11.9% 2.8% -7.8%
2009 3 59.1% -8.2% $88.12 -3.3% $52.05 -11.2% 2.8% -5.6%
2009 4 43.5% -7.8% $75.67 -2.4% $32.95 -10.0% 2.6% -5.4%
2009 Annual 49.8% -8.8% $80.60 -2.3% $40.16 -10.9% 2.8% -6.3%
2010 1 43.0% -2.3% $74.62 -1.1% $32.09 -3.3% 2.4% 0.1%
2010 2 54.3% 4.2% $79.92 -0.2% $43.42 3.9% 1.9% 6.1%
2010F 3 62.7% 6.1% $88.65 0.6% $55.54 6.7% 0.5% 6.6%
2010F 4 45.4% 4.3% $76.12 0.6% $34.58 5.0% 1.7% 6.1%
2010F Annual 51.5% 3.3% $80.72 0.1% $41.56 3.5% 1.6% 5.0%
2011F 1 44.0% 2.2% $76.69 2.8% $33.71 5.1% 3.5% 5.8%
2011F 2 55.3% 1.9% $80.90 1.2% $44.78 3.1% 0.2% 2.0%
2011F 3 62.9% 0.4% $90.22 1.8% $56.77 2.2% 0.2% 0.6%
2011F 4 46.3% 2.0% $78.10 2.6% $36.18 4.6% 2.4% 4.4%
2011F Annual 52.2% 1.3% $82.22 1.9% $42.90 3.2% 1.5% 2.9%
2012F Annual 54.1% 3.8% $86.89 5.7% $47.04 9.7% 1.0% 4.8%
2013F Annual 55.5% 2.5% $93.70 7.8% $51.97 10.5% 1.7% 4.2%
2014F Annual 55.1% -0.7% $98.91 5.6% $54.47 4.8% 2.3% 1.6%
Source: Colliers PKF Hospitality Research, Smith Travel Research
P. 14 | COLLIERS PKF HOSPITALITY RESEARCH
HOTEL HORIZONS® SEPTEMBER - NOVEMBER 2010 EDITION NATIONAL PLUS
SEPTEMBER - NOVEMBER 2010 EDITION NATIONAL PLUS
National Horizon Profile
Year When Nominal RevPAR Returns to Previous Peak - Market Comparison
3 Albuquerque 5 Detroit 4 Nashville 5 Sacramento
4 Anaheim 4 Fort Lauderdale 4 New Orleans 3 Saint Louis
4 Atlanta 5 Fort Worth 4 New York 4 Salt Lake City
4 Austin 4 Hartford 5 Newark 5 San Antonio
3 Baltimore 5 Houston 4 Oahu 4 San Diego
4 Boston 4 Indianapolis 5 Oakland 5 San Francisco
4 Charlotte 4 Jacksonville 5 Orlando 4 Seattle
5 Chicago 3 Kansas City 4 Philadelphia 4 Tampa
3 Cincinnati 4 Long Island 5 Phoenix 5 Tucson
3 Cleveland 3 Los Angeles 3 Pittsburgh 3 Washington DC
3 Columbus 3 Memphis 4 Portland 5 West Palm Beach
4 Dallas 5 Miami 5 Raleigh-Durham
4 Denver 4 Minneapolis 5 Richmond
2012 2013 2014
Source: Colliers PKF Hospitality Research
This page showcases the Colliers PKF Hospitality Research Hotel Horizons® forecasting universe. The map below displays the year in which nominal
RevPAR levels are forecast to once again achieve their previous peak: 11 markets in 2012, 23 markets in 2013, and 16 markets in 2014 or later.
Quarterly Hotel Horizons® reports are available for the nation and all the markets shown below.
P. 15 | COLLIERS PKF HOSPITALITY RESEARCH
HOTEL HORIZONS® SEPTEMBER - NOVEMBER 2010 EDITION NATIONAL PLUS
Fairmont Embassy Suites Courtyard by Marriott Best Western Comfort Inn Days Inn
Four Seasons Hilton Crowne Plaza Doubletree Club Fairfield Inn EconoLodge
Loews Hyatt Hyatt Place Holiday Inn Hampton Inn Microtel
Ritz Carlton Marriott Radisson Quality La Quinta Red Roof
W Hotels Westin Residence Inn Red Lion TownPlace Suites Super 8
Wikipedia defines ‘forecasting’ as:
1. The variables included in the models follow from economic theory.
2. The relationships between economic variables are estimated with advanced statistical methods.
3. The forecasts developed with econometric models are more objective than forecasts purely based on judgmental approaches
Econometric forecasting represents one of the most sophisticated approaches to gaining insights about future economic activity. Unlike some
forecasting methods used in business practice, the models that underlie econometric forecasts rely on historical relationships, similar to statistical
correlations, between economic variables. The data for measuring these variables come from actual market transactions involving individuals and
firms interacting in the economy. Moreover, these economic variables allowed to enter econometric models have conceptual linkages to economic
theory.
P. 10 | COLLIERS PKF HOSPITALITY RESEARCH
UPPER PRICED LOWER PRICED
The financial benchmarks come from the 2010 edition (2009 data) of Trends ® in the Hotel Industry . Trends ® is Colliers PKF Consulting’s annual
analysis of hotel financial statements from thousands of properties located across the nation. These data provide mean performance measurements
for hotels that are similar in size, location, and ADR for an average upper priced or lower priced property located in the market. For a more in-depth
report with a custom comparable set designed for your individual property, see our Colliers PKF-HR Benchmarker service.
Consistent with this definition, Colliers PKF Hospitality Research prepares forecasts of the hotel markets in the U.S. based on generally accepted
econometric procedures and sound judgment regarding fundamental relationships between the economic and behavioral market indicators and hotel
financial performance, relationships that PKF has tracked for over 70 years.
HOTEL HORIZONS® FORECAST APPENDIX
Exhibit Definitions
Financial Benchmarks
Forecasting Method
The Econometric Component
Positive Features of an Econometric Model
Market Segments - Representative Brands
"the process of estimation in unknown situations. Prediction is a similar, but more general term, and usually refers to estimation of time series, cross-
sectional or longitudinal data. In more recent years, forecasting has evolved into the practice of demand planning in every day business forecasting
for manufacturing companies. The discipline of demand planning, also sometimes referred to as supply chain forecasting, embraces both statistical
forecasting and consensus process...(emphasis added)"
Occupancy levels, ADR change and RevPAR change are plotted on a fixed "grade" scale. Measured as current value minus the
mean, divided by the series' standard deviation. Grades: A: Very strong, greater than one standard deviation above long run
average. B: Strong, within one standard deviation above long run average C: Somewhat weak, within one standard deviation
below long run average. D: Weak, below one standard deviation of the long run average.
Year over year change in Income, Employment, RevPAR and Demand, displayed as annual (Exhibits 2 and 3) and quarterly
(Exhibits 4 and 5).
Index based change charts with base year 2005 = 100. These exhibits illustrate the magnitude of change.
Compound average annual RevPAR, Demand and Supply change for Upper Priced, Lower Priced, and combined (All) hotels
withing the MSA.
Real RevPAR change (inflation adjusted, CPI) of the current period minus the historical mean of Real RevPAR change, divided by
the historical standard deviation of Real RevPAR change.
Exhibits 2 - 5
Exhibit 1
Exhibits 7 - 9
Exhibits 10 - 12
Exhibit 13
1.
2.
3.
1. The Supply Change is added to the previous period number of rooms available to produce a rooms available level in future periods.
2. Number of rooms sold is divided by number of rooms available to obtain occupancy percent in each future period.
Finally, a committee of hotel experts from Colliers PKF Hospitality Research performs a thorough review of each model prediction. In the spirit
of forecasting described above in the Wikipedia definition, this committee modifies predictions from the model when there is compelling
evidence that factors have come into play in a market which the model could not possibly foresee. In the extreme case, a Katrina-style event
causes the Committee’s forecast to differ noticeable from the model prediction In most instances, however, the committee either defers to the
model prediction or makes modest adjustments.
Economic Data from July 2010 Hotel Data from June 2010
P.11 | COLLIERS PKF HOSPITALITY RESEARCH
Gaining insight to the future of complicated economic environments requires the introduction of multidimensional forecasting models. Thus,
several equations often need to be identified and estimated to model complex economic conditions, as in the national economy. Multi-equation
models have considerable appeal for economic forecasting because they explicitly recognize the interdependence of relationships commonly
encountered in business and economics. The best examples of this type of model are demand and supply models, in which prices of goods are
set by the interaction of buyers and sellers in the market. Thus, price appears as a variable in both the demand and supply equations.
The Hotel Horizons ® econometric forecasting models, because they represent an entire sector of the national and MSA economies, fall into
the category of multi-equation, demand and supply models. These models have a general structure as defined below, but vary in their form for
particular market applications:
Demand (the number of rooms occupied - accommodated demand) is the dependent variable in this equation, and equals either
Gross Domestic (Metropolitan) Product, Real Personal Income, or Total Employment, which serve as the main independent
variable, along with the lagged changes in any of these variables and the lagged demand from the prior year (different numbers of
lags are used for independent variables based upon statistical significance).
Supply Change (change in the number of rooms available) is the dependent variable, equals ADR and Occupancy, which serve as
the main independent variables along with the change in supply from the prior period (different numbers of lags are used for
independent variables based upon statistical significance).
ADR (Real) is the dependent variable, equals Occupancy, which is the main independent variable along with ADR from the prior
period (different numbers of lags are used for independent variables based upon statistical significance). ADR is represented as
nominal in the preceding report.
These equations are estimated with ordinary least squares in a non-simultaneous fashion using data from Smith Travel Research and Moody's
Economy.com. dating back to the late 1980s. The parameters (coefficients on each variable) then are used to forecast demand, supply change,
and ADR by multiplying the parameters with Moody's Economy.com forecast of the economic variables and relevant previously estimated
values (lagged variables). Two additional calculations are made with these results as follows:
The econometric model predicts future room supply in small increments (e.g., 100 rooms per quarter). In reality, rooms enter the market in
large blocks (e.g., 1000 rooms) as new hotels are placed in service. When it becomes apparent that a new hotel (s) will be placed in service
within the next 18 months, the modeled supply change will be manually adjusted to account for the opening of the new hotel (s). The reverse
also is true when it become apparent that a hotel (s) will be taken out of service (e.g., demolished or converted to an alternative use).
HOTEL HORIZONS® FORECAST APPENDIX
The Judgmental Component
The Equations
SEPTEMBER - NOVEMBER 2010 EDITION NATIONAL PLUS
2010 2011
1st Qtr 2nd Qtr 3rd Qtr F 4th Qtr F Year End 1st Qtr F 2nd Qtr F 3rd Qtr F 4th Qtr F Year End
This Report 0.0% -0.2% 1.2% 1.7% 0.6% 1.7% 2.4% 3.1% 4.0% 2.8%
Last Report -0.6% -0.1% 0.9% 1.8% 0.5% 2.5% 3.2% 3.5% 4.0% 3.3%
This Report -2.3% -0.6% 0.3% 0.9% -0.4% 1.2% 1.1% 1.5% 1.9% 1.4%
Last Report -2.4% -1.5% -0.6% 0.1% -1.1% 0.9% 1.8% 2.5% 3.0% 2.1%
This Report 2.7% 2.3% 1.8% 1.4% 2.0% 1.7% 0.7% 0.5% 1.6% 1.1%
Last Report 2.9% 1.2% 0.3% 0.6% 1.2% 0.3% 0.3% 0.3% 0.5% 0.3%
This Report 5.1% 8.7% 8.6% 6.4% 7.3% 4.8% 3.3% 1.5% 3.7% 3.2%
Last Report 5.3% 5.8% 4.3% 3.2% 4.7% 3.5% 2.9% 3.1% 4.2% 3.4%
This Report 2.3% 6.2% 6.7% 5.0% 5.2% 3.1% 2.5% 1.0% 2.1% 2.1%
Last Report 2.3% 4.6% 4.0% 2.6% 3.4% 3.3% 2.6% 2.8% 3.7% 3.1%
This Report -4.3% 0.0% 0.9% 0.8% -0.6% 4.3% 2.8% 3.9% 4.1% 3.8%
Last Report -4.3% -1.1% -1.5% 0.5% -1.6% 3.1% 4.5% 4.7% 5.9% 4.6%
This Report -2.0% 6.2% 7.6% 5.8% 4.6% 7.6% 5.4% 4.9% 6.3% 5.9%
Last Report -2.1% 3.4% 2.4% 3.1% 1.7% 6.5% 7.2% 7.7% 9.8% 7.8%
* Economic data (history and forecast) are from Moody's Economy.com
** Hotel performance data: History supplied by Smith Travel Research; Forecast developed by Colliers PKF Hospitality Research
In January of 2010 Smith Travel Research, our source for historical lodging data, changed their policy regarding the handling of available
room counts. Accordingly, some historical hotel performance data may differ from that presented in previous editions of Hotel Horizons®.
What Has Changed Since The Last Report?
2010 and 2011 Year End Forecast Change in RevPAR
2010 Change in Occupancy** 2011 Change in Occupancy**
2010 Change in ADR** 2011 Change in ADR**
2010 Change in RevPAR** 2011 Change in RevPAR**
P. 18 | COLLIERS PKF HOSPITALITY RESEARCH
Forecasts are valuable tools for developing expectations of key variables. Changes to forecasts occur for two primary reasons. The first is
adjustments to historical series made by the data provider, causing future periods to vary due to changes in their base. The second is that
economic expectations tend to shift as more information becomes available, thus moving the hotel variables according to their underlying
relationships. We are constantly re-evaluating the performance of Hotel Horizons® forecasts, and presented below is a view on how the
world has changed since the June - August 2010 issue, presented in same period, prior year change format. All data under "This Report" are
actual as of 2nd Quarter 2010. Data marked as "Last Report" are actual as of 1st Quarter 2010, with 2nd Quarter 2010 being the first
forecast period for that report. As noted on earlier pages, all of the hotel variables below are modeled using data from Moody's Economy.com.
It is important to note that all historical data are subject to revision.
2010 Change in Real Personal Income* 2011 Change in Real Personal Income*
2010 Change in Total Payroll Employment* 2011 Change in Total Payroll Employment*
2010 Change in Supply** 2011 Change in Supply**
2010 Change in Demand** 2011 Change in Demand**
4.6%
5.9%
1.7%
7.8%
2010 2011
This Report Last Report
HOTEL HORIZONS® SEPTEMBER - NOVEMBER 2010 EDITION NATIONAL PLUS
SEPTEMBER - NOVEMBER 2010 EDITION NATIONAL PLUS
P. 19 | COLLIERS PKF HOSPITALITY RESEARCH
Hotel Horizons® myShare!
Hotel Horizons® myShare! is an informed way to estimate the future performance of any submarket, competitive set, or subject property
based on the behavior of the overall market.! Seventy five to eighty percent of all occupancy and rate movements experienced by a property,
or group of properties, can be explained through movements in the larger market.! The remaining twenty to twenty-five percent is endemic to
the property or submarket itself, and those individuals who deal with the day to day operations of these properties are best suited to
understand and account for these differences.
myShare! utilizes historical penetration rates of the submarket, competitive set, and subject property to the larger market to produce informed
micro-forecasts. myShare! gives the user the tools necessary to understand the historic movements of their subset, and apply that
knowledge to future periods in time. myShare! is being introduced on a complimentary basis in time for budget season, and is included with
every Hotel Horizons single market report, including this one. Check your original download or email hotelhorizonssupport@pkfc.com.
View the video tutorial online at:
www.pkfmyshare.com
HOTEL HORIZONS® NATIONAL PLUS
The Penetration Rate
SEPTEMBER - NOVEMBER 2010 EDITION NATIONAL PLUS
ADR Average Daily Rate - rooms revenue divided by paid rooms occupied.
Occupancy Paid rooms occupied divided by available rooms.
RevPAR Revenue per Available Room - rooms revenue divided by available rooms.
Supply Average daily room nights available per quarter, represented as a change over previous year, same quarter except
where noted annually.
Demand (Accommodated Demand) Average daily room nights occupied per quarter, represented as a change over previous year,
same quarter except where noted annually.
LRA Long Run Average - Annual average from 1988 to 2009
Penetration Market area (or sub-market area) measurement as a percent of national (or market area) measurement.
Standard Deviation The plotting of a normal data series and how far each individual data point lies from the mean: 68.2% of the series will fall
within 1 standard deviation, 95.4% of all data points will fall within 2 standard deviations, and 99.7%
falling within 3 standard deviations of the mean.
For more reports visit our website at
www.hotelhorizons.com
HOTEL HORIZONS® NATIONAL PLUS
Hotel Horizons ®
is compiled and produced by Colliers PKF Hospitality Research, the research affiliate of Colliers PKF Consulting USA. Readers are advised that
neither Colliers PKF Consulting USA nor Colliers PKF Hospitality Research represent the data herein to be definitive, neither should the contents be construed as a
recommendation on policies or actions. Quotation, reproduction, and distribution are prohibited without the written permission of Colliers PKF Hospitality Research.
Please address inquiries to Hotel Horizons ®
, 3475 Lenox Road, Suite 720, Atlanta GA 30326. Phone: (866) 842 8754
Glossary of Terms
mark.eble@pkfc.com
hank.staley@pkfc.com
bruce.baltin@pkfc.com
jeff.lugosi@pkfc.com
rachel.falkner@pkfc.com
dave.arnold@pkfc.com
Indianapolis
Jacksonville
Los Angeles
Orlando
Philadelphia
New York
john.fox@pkfc.com
Contact: Mark Eble
Contact: Hank Staley
Contact: Bruce Baltin
Contact: Jeff Lugosi
Contact: Rachel Falkner
Contact: David E. Arnold
Contact: John A. Fox
Asheville
Chicago
tony.jenkins@pkfc.com
mark.eble@pkfc.com
Atlanta
Boston
Bozeman
mark.woodworth@pkfc.com
scott.smith@pkfc.com
reed.woodworth@pkfc.com
chris.kraus@pkfc.com
Dallas / Houston
randy.mccaslin@pkfc.com
Contact: Tony Jenkins
Contact: Mark Eble
Contact: Mark Woodworth
Contact: Scott Smith
Contact: Reed Woodworth
Contact: Christopher Kraus
Contact: Randy McCaslin
tom.blake@pkfc.com
thomas.callahan@pkfc.com
chuck.ross@pkfc.com
kannan.sankaran@pkfc.com
Portland
San Francisco
Tampa
Washington, D.C.
Contact: Tom Blake
Contact: Tom Callahan
Contact: Chuck Ross
Contact: Kannan Sankaran
Dallas / Houston
hank.wolpert@pkfc.com
rs.patel@pkfc.com
bob.kaplan@pkfc.com
rod.apodaca@pkfc.com
Los Angeles
Miami
Sacramento
Seattle
rich.lillis@pkfc.com
kent.schwarz@pkfc.com
dan.hayward@pkfc.com
chris.burdett@pkfc.com
Contact: Hank Wolpert
Contact: R. S. Patel
Contact: Bob Kaplan
Contact: Rod Apodaca
Contact: Rich Lillis
Contact: Kent Schwarz
Contact: Dan Hayward
Contact: Chris Burdett
San Francisco
bob.eaton@pkfc.com
mark.mcdermott@pkfc.com
henry.bose@pkfc.com
Contact: Bob Eaton
Contact: Mark McDermott
Contact: Henry Bose
Hotel Brokerage ServicesAdvisory & Consulting Services
CONSULTING
USA
Atlanta
mark.woodworth@pkfc.com
Contact: Mark Woodworth
Industry Research & Publications
HOSPITALITY
RESEARCH

Mais conteúdo relacionado

Mais procurados

Retail Food Group Valuation
Retail Food Group ValuationRetail Food Group Valuation
Retail Food Group ValuationAayush Bengani
 
MSFCap2016FP_Group6
MSFCap2016FP_Group6MSFCap2016FP_Group6
MSFCap2016FP_Group6Gavin Yeh
 
Retail Food Group - Analysis Report - Group 5
Retail Food Group - Analysis Report - Group 5Retail Food Group - Analysis Report - Group 5
Retail Food Group - Analysis Report - Group 5Giang Nguyen
 
C&W MARKETBEAT- CAPITAL MARKETS Q4 2016 – #CRE #REALESTATE #CCIM #SIOR @YOURT...
C&W MARKETBEAT- CAPITAL MARKETS Q4 2016 – #CRE #REALESTATE #CCIM #SIOR @YOURT...C&W MARKETBEAT- CAPITAL MARKETS Q4 2016 – #CRE #REALESTATE #CCIM #SIOR @YOURT...
C&W MARKETBEAT- CAPITAL MARKETS Q4 2016 – #CRE #REALESTATE #CCIM #SIOR @YOURT...Guy Masse
 
Prepare For The Coming Stock Price Invasion
Prepare For The Coming Stock Price InvasionPrepare For The Coming Stock Price Invasion
Prepare For The Coming Stock Price InvasionEcon Matters
 
2012 pia planning_guide
2012 pia planning_guide2012 pia planning_guide
2012 pia planning_guideJaeyoon Lee
 
How strong a comeback for inflation?
How strong a comeback for inflation?How strong a comeback for inflation?
How strong a comeback for inflation?Jurgen Vluijmans
 
Lattice Energy LLC-Larsen Memo re Stock Indexes vs Gold Price Ratios-August 1...
Lattice Energy LLC-Larsen Memo re Stock Indexes vs Gold Price Ratios-August 1...Lattice Energy LLC-Larsen Memo re Stock Indexes vs Gold Price Ratios-August 1...
Lattice Energy LLC-Larsen Memo re Stock Indexes vs Gold Price Ratios-August 1...Lewis Larsen
 
Dow jones prediction
Dow jones predictionDow jones prediction
Dow jones predictionnidhisss
 
Macro Strategy Review Summary Jan 2014-Aug 2015
Macro Strategy Review Summary Jan 2014-Aug 2015Macro Strategy Review Summary Jan 2014-Aug 2015
Macro Strategy Review Summary Jan 2014-Aug 2015Jim Welsh
 
Building Blocks Investment Strategy Deck
Building Blocks Investment Strategy DeckBuilding Blocks Investment Strategy Deck
Building Blocks Investment Strategy DeckAniket Matharasi
 
Prosperity in a Changing World – Structural change and economic growth
Prosperity in a Changing World – Structural change and economic growthProsperity in a Changing World – Structural change and economic growth
Prosperity in a Changing World – Structural change and economic growthI W
 
Presentation for web1 4
Presentation for web1 4Presentation for web1 4
Presentation for web1 4richwalker84
 
Summary slides: London's labour market in the recessions
Summary slides: London's labour market in the recessionsSummary slides: London's labour market in the recessions
Summary slides: London's labour market in the recessionsMelisaWickham
 
Economy and equity markets: are they disconnected?
Economy and equity markets: are they disconnected?Economy and equity markets: are they disconnected?
Economy and equity markets: are they disconnected?Markets Beyond
 
Hong Kong Investment Forum
Hong Kong Investment ForumHong Kong Investment Forum
Hong Kong Investment ForumEric Leininger
 
Olivier Desbarres: Global growth, Down but Not Out
Olivier Desbarres: Global growth, Down but Not OutOlivier Desbarres: Global growth, Down but Not Out
Olivier Desbarres: Global growth, Down but Not OutOlivier Desbarres
 
The magnificent 7 review 9
The magnificent 7   review 9The magnificent 7   review 9
The magnificent 7 review 9Markets Beyond
 

Mais procurados (19)

Retail Food Group Valuation
Retail Food Group ValuationRetail Food Group Valuation
Retail Food Group Valuation
 
MSFCap2016FP_Group6
MSFCap2016FP_Group6MSFCap2016FP_Group6
MSFCap2016FP_Group6
 
Retail Food Group - Analysis Report - Group 5
Retail Food Group - Analysis Report - Group 5Retail Food Group - Analysis Report - Group 5
Retail Food Group - Analysis Report - Group 5
 
C&W MARKETBEAT- CAPITAL MARKETS Q4 2016 – #CRE #REALESTATE #CCIM #SIOR @YOURT...
C&W MARKETBEAT- CAPITAL MARKETS Q4 2016 – #CRE #REALESTATE #CCIM #SIOR @YOURT...C&W MARKETBEAT- CAPITAL MARKETS Q4 2016 – #CRE #REALESTATE #CCIM #SIOR @YOURT...
C&W MARKETBEAT- CAPITAL MARKETS Q4 2016 – #CRE #REALESTATE #CCIM #SIOR @YOURT...
 
Prepare For The Coming Stock Price Invasion
Prepare For The Coming Stock Price InvasionPrepare For The Coming Stock Price Invasion
Prepare For The Coming Stock Price Invasion
 
2012 pia planning_guide
2012 pia planning_guide2012 pia planning_guide
2012 pia planning_guide
 
How strong a comeback for inflation?
How strong a comeback for inflation?How strong a comeback for inflation?
How strong a comeback for inflation?
 
Lattice Energy LLC-Larsen Memo re Stock Indexes vs Gold Price Ratios-August 1...
Lattice Energy LLC-Larsen Memo re Stock Indexes vs Gold Price Ratios-August 1...Lattice Energy LLC-Larsen Memo re Stock Indexes vs Gold Price Ratios-August 1...
Lattice Energy LLC-Larsen Memo re Stock Indexes vs Gold Price Ratios-August 1...
 
Dow jones prediction
Dow jones predictionDow jones prediction
Dow jones prediction
 
Macro Strategy Review Summary Jan 2014-Aug 2015
Macro Strategy Review Summary Jan 2014-Aug 2015Macro Strategy Review Summary Jan 2014-Aug 2015
Macro Strategy Review Summary Jan 2014-Aug 2015
 
Building Blocks Investment Strategy Deck
Building Blocks Investment Strategy DeckBuilding Blocks Investment Strategy Deck
Building Blocks Investment Strategy Deck
 
Prosperity in a Changing World – Structural change and economic growth
Prosperity in a Changing World – Structural change and economic growthProsperity in a Changing World – Structural change and economic growth
Prosperity in a Changing World – Structural change and economic growth
 
Presentation for web1 4
Presentation for web1 4Presentation for web1 4
Presentation for web1 4
 
Summary slides: London's labour market in the recessions
Summary slides: London's labour market in the recessionsSummary slides: London's labour market in the recessions
Summary slides: London's labour market in the recessions
 
Economy and equity markets: are they disconnected?
Economy and equity markets: are they disconnected?Economy and equity markets: are they disconnected?
Economy and equity markets: are they disconnected?
 
Hong Kong Investment Forum
Hong Kong Investment ForumHong Kong Investment Forum
Hong Kong Investment Forum
 
LPL Market Insights Chart Book 2nd Qtr 2011
LPL Market Insights Chart Book 2nd Qtr 2011LPL Market Insights Chart Book 2nd Qtr 2011
LPL Market Insights Chart Book 2nd Qtr 2011
 
Olivier Desbarres: Global growth, Down but Not Out
Olivier Desbarres: Global growth, Down but Not OutOlivier Desbarres: Global growth, Down but Not Out
Olivier Desbarres: Global growth, Down but Not Out
 
The magnificent 7 review 9
The magnificent 7   review 9The magnificent 7   review 9
The magnificent 7 review 9
 

Destaque

Allen School Career Connection- March 2012 Newsletter
Allen School Career Connection- March 2012 NewsletterAllen School Career Connection- March 2012 Newsletter
Allen School Career Connection- March 2012 NewsletterAllen School
 
Adecco Jobmarket 2010 (2)
Adecco Jobmarket 2010 (2)Adecco Jobmarket 2010 (2)
Adecco Jobmarket 2010 (2)staceyjj
 
Things i am thankful for
Things i am thankful forThings i am thankful for
Things i am thankful forMrsLOnlineA2011
 
Report JAZUG activities 2010.08-2011.09
Report JAZUG activities 2010.08-2011.09Report JAZUG activities 2010.08-2011.09
Report JAZUG activities 2010.08-2011.09Saori Ando
 
April 2013 Monthly Multi-family Housing Activity Report – Boston Real Estate
April 2013 Monthly Multi-family Housing Activity Report – Boston Real Estate April 2013 Monthly Multi-family Housing Activity Report – Boston Real Estate
April 2013 Monthly Multi-family Housing Activity Report – Boston Real Estate Unit Realty Group
 
20150806_IntroJAZUG
20150806_IntroJAZUG20150806_IntroJAZUG
20150806_IntroJAZUGSaori Ando
 

Destaque (7)

Allen School Career Connection- March 2012 Newsletter
Allen School Career Connection- March 2012 NewsletterAllen School Career Connection- March 2012 Newsletter
Allen School Career Connection- March 2012 Newsletter
 
CareerToolboxUSA Back-2-Work Program Presentation Flyer
CareerToolboxUSA Back-2-Work Program Presentation FlyerCareerToolboxUSA Back-2-Work Program Presentation Flyer
CareerToolboxUSA Back-2-Work Program Presentation Flyer
 
Adecco Jobmarket 2010 (2)
Adecco Jobmarket 2010 (2)Adecco Jobmarket 2010 (2)
Adecco Jobmarket 2010 (2)
 
Things i am thankful for
Things i am thankful forThings i am thankful for
Things i am thankful for
 
Report JAZUG activities 2010.08-2011.09
Report JAZUG activities 2010.08-2011.09Report JAZUG activities 2010.08-2011.09
Report JAZUG activities 2010.08-2011.09
 
April 2013 Monthly Multi-family Housing Activity Report – Boston Real Estate
April 2013 Monthly Multi-family Housing Activity Report – Boston Real Estate April 2013 Monthly Multi-family Housing Activity Report – Boston Real Estate
April 2013 Monthly Multi-family Housing Activity Report – Boston Real Estate
 
20150806_IntroJAZUG
20150806_IntroJAZUG20150806_IntroJAZUG
20150806_IntroJAZUG
 

Semelhante a Hh National Ahla3 Q10

31002261 Mark Woodworth Pkf Consulting What Better Time
31002261 Mark Woodworth Pkf Consulting What Better Time31002261 Mark Woodworth Pkf Consulting What Better Time
31002261 Mark Woodworth Pkf Consulting What Better TimeDanilo Papaleo
 
Today’s Economic Landscape and What’s on the Other Side
Today’s Economic Landscape and What’s on the Other SideToday’s Economic Landscape and What’s on the Other Side
Today’s Economic Landscape and What’s on the Other SideSavannah Whaley
 
Capital Market 1st Quarter 2010
Capital Market 1st Quarter 2010Capital Market 1st Quarter 2010
Capital Market 1st Quarter 2010pospime
 
Today’s Economic Landscape and What’s on the Other Side
Today’s Economic Landscape and What’s on the Other SideToday’s Economic Landscape and What’s on the Other Side
Today’s Economic Landscape and What’s on the Other SideSavannah Whaley
 
An overview of the indian economy
An overview of the indian economyAn overview of the indian economy
An overview of the indian economyShavetakohli
 
Today’s Economic Landscape and What’s on the Other Side
Today’s Economic Landscape and What’s on the Other SideToday’s Economic Landscape and What’s on the Other Side
Today’s Economic Landscape and What’s on the Other SideSavannah Whaley
 
HVS 2010 South America
HVS 2010 South AmericaHVS 2010 South America
HVS 2010 South AmericaAdeline CH
 
Money & Banking
Money & BankingMoney & Banking
Money & BankingBrad
 
4Q_2015_RetailReport_email
4Q_2015_RetailReport_email4Q_2015_RetailReport_email
4Q_2015_RetailReport_emailPatrick Anthon
 
Today’s Economic Landscape and What’s on the Other Side
Today’s Economic Landscape and What’s on the Other SideToday’s Economic Landscape and What’s on the Other Side
Today’s Economic Landscape and What’s on the Other SideSavannah Whaley
 
APPENDIX A--Background The Hotel Industry In The United St.docx
APPENDIX A--Background The Hotel Industry In The United St.docxAPPENDIX A--Background The Hotel Industry In The United St.docx
APPENDIX A--Background The Hotel Industry In The United St.docxfestockton
 
Mercer Capital's Value Focus: Auto Dealer Industry | Year-End 2014
Mercer Capital's Value Focus: Auto Dealer Industry | Year-End 2014Mercer Capital's Value Focus: Auto Dealer Industry | Year-End 2014
Mercer Capital's Value Focus: Auto Dealer Industry | Year-End 2014Mercer Capital
 
Mercer Capital's Value Focus: Auto Dealer Industry | Mid-Year 2014
Mercer Capital's Value Focus: Auto Dealer Industry | Mid-Year 2014Mercer Capital's Value Focus: Auto Dealer Industry | Mid-Year 2014
Mercer Capital's Value Focus: Auto Dealer Industry | Mid-Year 2014Mercer Capital
 

Semelhante a Hh National Ahla3 Q10 (20)

31002261 Mark Woodworth Pkf Consulting What Better Time
31002261 Mark Woodworth Pkf Consulting What Better Time31002261 Mark Woodworth Pkf Consulting What Better Time
31002261 Mark Woodworth Pkf Consulting What Better Time
 
Polish Economic Outlook 01/2010
Polish Economic Outlook 01/2010Polish Economic Outlook 01/2010
Polish Economic Outlook 01/2010
 
Today’s Economic Landscape and What’s on the Other Side
Today’s Economic Landscape and What’s on the Other SideToday’s Economic Landscape and What’s on the Other Side
Today’s Economic Landscape and What’s on the Other Side
 
Capital Market 1st Quarter 2010
Capital Market 1st Quarter 2010Capital Market 1st Quarter 2010
Capital Market 1st Quarter 2010
 
Today’s Economic Landscape and What’s on the Other Side
Today’s Economic Landscape and What’s on the Other SideToday’s Economic Landscape and What’s on the Other Side
Today’s Economic Landscape and What’s on the Other Side
 
Saxo Bank Q3.pdf
Saxo Bank Q3.pdfSaxo Bank Q3.pdf
Saxo Bank Q3.pdf
 
An overview of the indian economy
An overview of the indian economyAn overview of the indian economy
An overview of the indian economy
 
Polish economic outlook 1/2010 (44)
Polish economic outlook 1/2010 (44)Polish economic outlook 1/2010 (44)
Polish economic outlook 1/2010 (44)
 
Economic Presentation
Economic PresentationEconomic Presentation
Economic Presentation
 
Today’s Economic Landscape and What’s on the Other Side
Today’s Economic Landscape and What’s on the Other SideToday’s Economic Landscape and What’s on the Other Side
Today’s Economic Landscape and What’s on the Other Side
 
HVS 2010 South America
HVS 2010 South AmericaHVS 2010 South America
HVS 2010 South America
 
Employment Trends Survey 2012
Employment Trends Survey 2012Employment Trends Survey 2012
Employment Trends Survey 2012
 
c
cc
c
 
Money & Banking
Money & BankingMoney & Banking
Money & Banking
 
4Q_2015_RetailReport_email
4Q_2015_RetailReport_email4Q_2015_RetailReport_email
4Q_2015_RetailReport_email
 
Today’s Economic Landscape and What’s on the Other Side
Today’s Economic Landscape and What’s on the Other SideToday’s Economic Landscape and What’s on the Other Side
Today’s Economic Landscape and What’s on the Other Side
 
Monetary Policy
Monetary PolicyMonetary Policy
Monetary Policy
 
APPENDIX A--Background The Hotel Industry In The United St.docx
APPENDIX A--Background The Hotel Industry In The United St.docxAPPENDIX A--Background The Hotel Industry In The United St.docx
APPENDIX A--Background The Hotel Industry In The United St.docx
 
Mercer Capital's Value Focus: Auto Dealer Industry | Year-End 2014
Mercer Capital's Value Focus: Auto Dealer Industry | Year-End 2014Mercer Capital's Value Focus: Auto Dealer Industry | Year-End 2014
Mercer Capital's Value Focus: Auto Dealer Industry | Year-End 2014
 
Mercer Capital's Value Focus: Auto Dealer Industry | Mid-Year 2014
Mercer Capital's Value Focus: Auto Dealer Industry | Mid-Year 2014Mercer Capital's Value Focus: Auto Dealer Industry | Mid-Year 2014
Mercer Capital's Value Focus: Auto Dealer Industry | Mid-Year 2014
 

Hh National Ahla3 Q10

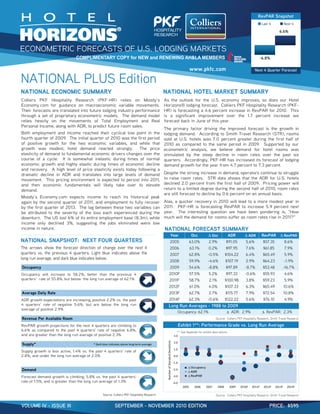
  • 1. VOLUME IV - ISSUE III SEPTEMBER - NOVEMBER 2010 EDITION PRICE: $595 NATIONAL ECONOMIC SUMMARY NATIONAL HOTEL MARKET SUMMARY NATIONAL FORECAST SUMMARY Year Occ ! Occ ADR !"ADR RevPAR !"RevPAR NATIONAL SNAPSHOT: NEXT FOUR QUARTERS 2005 63.0% 2.9% $91.05 5.6% $57.35 8.6% 2006 63.1% 0.2% $97.95 7.6% $61.85 7.9% 2007 62.8% -0.5% $104.22 6.4% $65.49 5.9% 2008 59.9% -4.6% $107.19 2.9% $64.23 -1.9% Occupancy 2009 54.6% -8.8% $97.89 -8.7% $53.48 -16.7% 2010F 57.5% 5.2% $97.33 -0.6% $55.93 4.6% 2011F 58.7% 2.1% $100.98 3.8% $59.23 5.9% 2012F 61.0% 4.0% $107.33 6.3% $65.49 10.6% Average Daily Rate 2013F 62.7% 2.7% $115.77 7.9% $72.54 10.8% 2014F 62.3% -0.6% $122.22 5.6% $76.10 4.9% Long Run Averages - 1988 to 2009 Revenue Per Available Room Source: Colliers PKF Hospitality Research, Smith Travel Research ** See Appendix for exhibit descriptions Supply* * Dark blue indicates above long-term average Demand Source: Colliers PKF Hospitality Research Source: Colliers PKF Hospitality Research, Smith Travel Research RevPAR: 2.3%ADR: 2.9%Occupancy: 62.1% NATIONAL PLUS Edition -4.0 -3.0 -2.0 -1.0 0.0 1.0 2.0 3.0 2005 2006 2007 2008 2009 2010F 2011F 2012F 2013F 2014F NumberofStandardDeviations NATIONAL ECONOMIC SUMMARY NATIONAL HOTEL MARKET SUMMARY NATIONAL SNAPSHOT: NEXT FOUR QUARTERS Exhibit 1**: Performance Grade vs. Long Run Average The arrows show the forecast direction of change over the next 4 quarters vs. the previous 4 quarters. Light blue indicates above the long run average, and dark blue indicates below. ∆ ∆ www.pkfc.com Next 4 Quarter Forecast RevPAR Snapshot -6.8% 6.6% Last 4 Next 4 VOLUME IV - ISSUE III PRICE: $595SEPTEMBER - NOVEMBER 2010 EDITION American Hotel & Lodging Association COMPLIMENTARY COPY for NEW and RENEWING AH&LA MEMBERS Colliers PKF Hospitality Research (PKF-HR) relies on Moody’s Economy.com for guidance on macroeconomic variable movements. Their forecasts are translated into future lodging industry performance through a set of proprietary econometric models. The demand model relies heavily on the movements of Total Employment and Real Personal Income, along with ADR, to predict future room sales. Both employment and income reached their cyclical low point in the fourth quarter of 2009. The initial quarter of 2010 was the first period of positive growth for the two economic variables, and while that growth was modest, hotel demand reacted strongly. The price elasticity of demand to fundamental economic drivers changes over the course of a cycle. It is somewhat inelastic during times of normal economic growth and highly elastic during times of economic decline and recovery. A high level of price elasticity exists today following a dramatic decline in ADR and translates into large levels of demand movement. This pricing environment is expected to persist into 2011, and then economic fundamentals will likely take over to elevate demand. Moody’s Economy.com expects income to reach its historical peak again by the second quarter of 2011, and employment to fully recover by the first quarter of 2013. The lag between these two variables can be attributed to the severity of the loss each experienced during the downturn. The US lost 6% of its entire employment base (8.3m), while income only declined 3%, suggesting the jobs eliminated were low income in nature. As the outlook for the U.S. economy improves, so does our Hotel Horizons® lodging forecast. Colliers PKF Hospitality Research (PKF- HR) is forecasting a 4.6 percent increase in RevPAR for 2010. This is a significant improvement over the 1.7 percent increase we forecast back in June of this year. The primary factor driving the improved forecast is the growth in lodging demand. According to Smith Travel Research (STR), rooms sold at U.S. hotels was 7.0 percent greater during the first half of 2010 as compared to the same period in 2009. Supported by our econometric analysis, we believe demand for hotel rooms was stimulated by the steep decline in room rates over the past six quarters. Accordingly, PKF-HR has increased its forecast of lodging demand growth for the year from 4.7 percent to 7.3 percent. Despite the strong increase in demand, operators continue to struggle to raise room rates. STR data shows that the ADR for U.S. hotels declined 2.0 percent from the first half of 2009. Pricing power will return to a limited degree during the second half of 2010, room rates are still forecast to decline by 0.6 percent on an annual basis. Alas, a quicker recovery in 2010 will lead to a more modest year in 2011. PKF-HR is forecasting RevPAR to increase 5.9 percent next year. The interesting question we have been pondering is, “How much will the demand for rooms suffer as room rates rise in 2011?" Occupancy will increase to 58.2%, better than the previous 4 quarters' rate of 55.8%, but below the long run average of 62.1% ADR growth expectations are increasing, positive 2.2% vs. the past 4 quarters' rate of negative 5.6%, but are below the long run average of positive 2.9% RevPAR growth projections for the next 4 quarters are climbing to 6.6% as compared to the past 4 quarters' rate of negative 6.8%, and are greater than the long run average of positive 2.3% Supply growth is less active, 1.4% vs. the past 4 quarters' rate of 2.8%, and under the long run average of 2.0% Forecast demand growth is climbing, 5.8% vs. the past 4 quarters' rate of 1.5%, and is greater than the long run average of 1.3%
  • 2. SEPTEMBER - NOVEMBER 2010 EDITION NATIONAL PLUS National Economic Summary *See Appendix for exhibit descriptions *See Appendix for exhibit descriptions *See Appendix for exhibit descriptions *See Appendix for exhibit descriptions *See Appendix for exhibit descriptions P. 2 | COLLIERS PKF HOSPITALITY RESEARCH Below are a select number of variables that drive the Colliers PKF-HR econometric forecasts contained in this report. Income and employment are important barometers of economic health and are used in every Hotel Horizons® forecast model. The lodging market is part of the larger economy, and the forces that affect us nationally also affect lodging, but in different magnitudes and time periods (see Exhibits 4 and 5 below). Exhibits 2 - 6 provide an overview of current economic history and forecast, and provide explanation of what to expect in the future, and how that affects the lodging industry. -4% -3% -2% -1% 0% 1% 2% 3% 4% 5% 6% 7% 8% 1988 1990 1992 1994 1996 1998 2000 2002 2004 2006 2008 2010F 2012F Real Personal Income -6% -5% -4% -3% -2% -1% 0% 1% 2% 3% 4% 1988 1990 1992 1994 1996 1998 2000 2002 2004 2006 2008 2010F 2012F Total Payroll Employment 1.2% 2.9% 2.7% 2.7% 1.8% 2.3% 3.6% 3.3% 0.0% 1.0% 2.0% 3.0% 4.0% Change in Total Employment Change in Consumer Price Index Change in Gross Metro Product Change in Real Personal Income US 1988 to 2009 US 2010 to 2014 -6% -5% -4% -3% -2% -1% 0% 1% 2% 3% 2009.1 2009.2 2009.3 2009.4 2010.1 2010.2 2010.3 2010.4 2011.1 2011.2 2011.3 2011.4 -10% -8% -6% -4% -2% 0% 2% 4% 6% 8% 10% Employment (Left) Demand (Right) Source: Moody's Economy.com Source: Moody's Economy.com Source: Moody's Economy.com -3% -2% -1% 0% 1% 2% 3% 4% 5% 2009.1 2009.2 2009.3 2009.4 2010.1 2010.2 2010.3 2010.4 2011.1 2011.2 2011.3 2011.4 -25% -20% -15% -10% -5% 0% 5% 10% Income (Left) RevPAR (Right) Source: Moody's Economy.com, Colliers PKF-HR, Smith Travel Research Source: Moody's Economy.com, Colliers PKF-HR, Smith Travel Research See graph below See graph below HOTEL HORIZONS® SEPTEMBER - NOVEMBER 2010 EDITION NATIONAL PLUS Exhibit 2*: Income Change Exhibit 3*: Employment Change Exhibit 4*: Quarterly Income vs. RevPAR Change Exhibit 5*: Quarterly Employment vs. Demand Change Exhibit 6*: Average Annual Growth Rates
  • 3. SEPTEMBER - NOVEMBER 2010 EDITION NATIONAL PLUS National Hotel Summary Exhibit 7*: Compound Average Annual ADR Change 2005 to 2009 Exhibit 8*: Compound Average Annual RevPAR Change 2005 *See Appendix for exhibit descriptions *See Appendix for exhibit descriptions Exhibit 9*: Compound Average Annual ADR Change 2010 to 2014 Forecast Exhibit 10*: Compound Average Annual RevPAR Change 201 *See Appendix for exhibit descriptions *See Appendix for exhibit descriptions *See Appendix for exhibit descriptions P. 3 | COLLIERS PKF HOSPITALITY RESEARCH The graphs on the left illustrate the magnitude of change in performance during the historical and forecasted period 2005 to 2014. Used as a relative benchmark, each market segment is plotted against a common index value of 2005 = 100. This method provides clear insight of how each market segment performed and is expected to perform in relation to others in the specified period. The charts on the right compare near-term historical compound annual growth rates (CAGR) to the CAGRs for the forecast period. 0.6% 3.2% 1.8% 1.2% 0.3% -0.3% -1.0% 0.0% 1.0% 2.0% 3.0% 4.0% Economy Midscale w/o F&B Midscale W/ F&B Upscale Upper Upscale Luxury -3.3% -0.9% -2.8% -2.2% -2.3% -3.5% -4.0% -3.0% -2.0% -1.0% 0.0% Economy Midscale w/o F&B Midscale W/ F&B Upscale Upper Upscale Luxury 2.3% 6.6% 2.1% 5.3% 5.0% 7.8% 0.0% 3.0% 6.0% 9.0% Economy Midscale w/o F&B Midscale W/ F&B Upscale Upper Upscale Luxury 1.7% 8.5% 1.0% 7.0% 7.4% 9.5% 0.0% 2.0% 4.0% 6.0% 8.0% 10.0% 12.0% Economy Midscale w/o F&B Midscale W/ F&B Upscale Upper Upscale Luxury 1.3% 8.4% -2.1% 6.2% 2.0% 3.7% -2.8% 0.7% -6.5% 1.7% 0.1% 2.0%1.8% 5.2% -2.1% 4.6% 3.3% 2.2% -8% -6% -4% -2% 0% 2% 4% 6% 8% 10% Economy Midscale w/o F&B Midscale W/ F&B Upscale Upper Upscale Luxury Historical Demand Change 1988-2009 Historical Demand Change 2005-2009 Forecast Demand Change 2010-2014 Source: Colliers PKF Hospitality Research, Smith Travel Research Source: Colliers PKF Hospitality Research, Smith Travel Research Source: Colliers PKF Hospitality Research, Smith Travel Research Source: Colliers PKF Hospitality Research, Smith Travel Research Source: Colliers PKF Hospitality Research, Smith Travel Research Exhibit 9*: Compound Average Annual ADR Change 2010 to 2014 Forecast Exhibit 8*: Compound Average Annual RevPAR Change 2005 to 2009 Exhibit 10*: Compound Average Annual RevPAR Change 2010 to 2014 Forecast Exhibit 7*: Compound Average Annual ADR Change 2005 to 2009 Exhibit 11*: Historical vs. Forecast Compound Average Annual Demand Change HOTEL HORIZONS® SEPTEMBER - NOVEMBER 2010 EDITION NATIONAL PLUS
  • 4. SEPTEMBER - NOVEMBER 2010 EDITION NATIONAL PLUS National Hotel Summary *See Appendix for exhibit descriptions *See Appendix for exhibit descriptions *See Appendix for exhibit descriptions *See Appendix for exhibit descriptions *See Appendix for exhibit descriptions *See Appendix for exhibit descriptions P. 4 | COLLIERS PKF HOSPITALITY RESEARCH The graphs on the left illustrate the magnitude of change in performance during the historical and forecasted period 2005 to 2014. Used as a relative benchmark, each market segment is plotted against a common index value of 2005 = 100. This method provides clear insight of how each market segment performed and is expected to perform in relation to others in the specified period. 80 90 100 110 120 130 140 150 2005 2006 2007 2008 2009 2010F 2011F 2012F 2013F 2014F All Luxury Upper Upscale Upscale Midscale W/ F&B 80 90 100 110 120 130 140 150 2005 2006 2007 2008 2009 2010F 2011F 2012F 2013F 2014F All Midscale w/o F&B Economy 90 100 110 120 130 2005 2006 2007 2008 2009 2010F 2011F 2012F 2013F 2014F All Luxury Upper Upscale Upscale Midscale W/ F&B 90 100 110 120 130 140 150 2005 2006 2007 2008 2009 2010F 2011F 2012F 2013F 2014F All Midscale w/o F&B Economy 80 85 90 95 100 105 2005 2006 2007 2008 2009 2010F 2011F 2012F 2013F 2014F All Midscale w/o F&B Economy 80 85 90 95 100 105 110 2005 2006 2007 2008 2009 2010F 2011F 2012F 2013F 2014F All Luxury Upper Upscale Upscale Midscale W/ F&B Source: Colliers PKF Hospitality Research, Smith Travel Research Source: Colliers PKF Hospitality Research, Smith Travel Research Source: Colliers PKF Hospitality Research, Smith Travel Research Source: Colliers PKF Hospitality Research, Smith Travel Research Source: Colliers PKF Hospitality Research, Smith Travel Research Source: Colliers PKF Hospitality Research, Smith Travel Research HOTEL HORIZONS® SEPTEMBER - NOVEMBER 2010 EDITION NATIONAL PLUS Exhibit 14*: Lower-Priced Average Daily Rate (ADR) Exhibit 12*: Lower-Priced Hotel Occupancy Exhibit 13*: Upper-Priced Hotel Occupancy Exhibit 15*: Upper-Priced Average Daily Rate (ADR) Exhibit 16*: Lower-Priced RevPAR Exhibit 17*: Upper-Priced RevPAR
  • 5. SEPTEMBER - NOVEMBER 2010 EDITION NATIONAL PLUS National Forecast - All Hotels Year Period Occ !"Occ ADR !"ADR RevPAR !"RevPAR !"Supply !"Demand 2005 Annual 63.0% 2.9% $91.05 5.6% $57.35 8.6% -0.1% 2.8% 2006 Annual 63.1% 0.2% $97.95 7.6% $61.85 7.9% 0.2% 0.5% 2007 Annual 62.8% -0.5% $104.22 6.4% $65.49 5.9% 1.3% 0.8% 2008 1 57.2% -3.3% $108.78 5.2% $62.24 1.7% 2.0% -1.4% 2008 2 64.3% -3.2% $108.15 4.4% $69.51 1.0% 2.3% -1.0% 2008 3 65.5% -4.0% $107.55 3.1% $70.40 -1.0% 2.6% -1.5% 2008 4 52.7% -8.3% $103.92 -1.6% $54.74 -9.8% 3.0% -5.6% 2008 Annual 59.9% -4.6% $107.19 2.9% $64.23 -1.9% 2.5% -2.3% 2009 1 50.8% -11.3% $100.64 -7.5% $51.10 -17.9% 3.1% -8.5% 2009 2 57.2% -11.1% $97.89 -9.5% $55.96 -19.5% 3.0% -8.4% 2009 3 60.2% -8.0% $97.13 -9.7% $58.48 -16.9% 3.1% -5.2% 2009 4 50.3% -4.5% $96.09 -7.5% $48.34 -11.7% 3.0% -1.6% 2009 Annual 54.6% -8.8% $97.89 -8.7% $53.48 -16.7% 3.0% -6.0% 2010 1 52.0% 2.3% $96.34 -4.3% $50.05 -2.0% 2.7% 5.1% 2010 2 60.7% 6.2% $97.87 0.0% $59.44 6.2% 2.3% 8.7% 2010F 3 64.2% 6.7% $98.00 0.9% $62.94 7.6% 1.8% 8.6% 2010F 4 52.8% 5.0% $96.83 0.8% $51.15 5.8% 1.4% 6.4% 2010F Annual 57.5% 5.2% $97.33 -0.6% $55.93 4.6% 2.0% 7.3% 2011F 1 53.6% 3.1% $100.51 4.3% $53.84 7.6% 1.7% 4.8% 2011F 2 62.3% 2.5% $100.65 2.8% $62.67 5.4% 0.7% 3.3% 2011F 3 64.9% 1.0% $101.82 3.9% $66.05 4.9% 0.5% 1.5% 2011F 4 53.9% 2.1% $100.80 4.1% $54.36 6.3% 1.6% 3.7% 2011F Annual 58.7% 2.1% $100.98 3.8% $59.23 5.9% 1.1% 3.2% 2012F Annual 61.0% 4.0% $107.33 6.3% $65.49 10.6% 0.8% 4.9% 2013F Annual 62.7% 2.7% $115.77 7.9% $72.54 10.8% 1.2% 3.9% 2014F Annual 62.3% -0.6% $122.22 5.6% $76.10 4.9% 2.3% 1.7% Source: Colliers PKF Hospitality Research, Smith Travel Research National Financial Benchmarks* - All Hotels Average Room Count Average Occupancy Average Daily Rate Average RevPAR Financial Line Item Rooms Revenue Food and Beverage Revenue Total Departmental Costs Total Departmental Income Undistributed Operating Expenses Gross Operating Profit Management Fees, Property Taxes, and Insurance Net Operating Income** *Data from 2010 "Trends® in the Hotel Industry" report Source: Colliers PKF Hospitality Research **Before deductions for capital reserves, rent, interest, income taxes, depreciation, and amortization. 92 2010 Estimate2009 Actual 92 2008 Actual 92 59.9% 57.5% $97.33$107.19 $97.89 54.6% 77.0% 20.1% $64.25 19.5% $53.48 2009 Actual Percent of Total Revenue 2008 Actual 2010 Estimate $55.93 41.3% 19.4% 77.8% 25.2% 33.5% 17.5% 7.9% 21.6% 58.7% 8.4% 21.3% 12.9% 13.4% 8.2% P. 5 | COLLIERS PKF HOSPITALITY RESEARCH 37.1% 57.2% 42.8% 58.4% 35.6% 77.6% 41.6% For a more comparable and detailed financial comparison, we recommend a Colliers PKF Benchmarker report. Please contact Claude Vargo at (404) 842-1150, ext. 237 for more information. National Financial Benchmarks* - All Hotels HOTEL HORIZONS® SEPTEMBER - NOVEMBER 2010 EDITION NATIONAL PLUS
  • 6. SEPTEMBER - NOVEMBER 2010 EDITION NATIONAL PLUS National Forecast - Luxury Hotels Year Period Occ !"Occ ADR !"ADR RevPAR !"RevPAR !"Supply !"Demand 2005 Annual 70.1% 4.1% $246.08 6.9% $172.60 11.3% -0.4% 3.7% 2006 Annual 71.5% 1.9% $269.60 9.6% $192.73 11.7% 4.5% 6.6% 2007 Annual 71.4% -0.2% $290.62 7.8% $207.43 7.6% 3.8% 3.6% 2008 1 68.0% -3.8% $303.64 3.9% $206.40 0.0% 4.2% 0.2% 2008 2 72.0% -2.5% $290.50 1.2% $209.22 -1.4% 4.4% 1.8% 2008 3 69.6% -4.6% $278.65 0.5% $193.81 -4.1% 4.7% -0.1% 2008 4 59.7% -12.2% $289.96 -5.6% $173.17 -17.1% 5.9% -7.0% 2008 Annual 67.3% -5.8% $290.53 0.0% $195.41 -5.8% 4.8% -1.2% 2009 1 57.1% -16.1% $264.55 -12.9% $150.97 -26.9% 9.1% -8.5% 2009 2 62.7% -13.0% $236.94 -18.4% $148.54 -29.0% 9.1% -5.1% 2009 3 65.3% -6.2% $225.21 -19.2% $146.99 -24.2% 8.8% 2.1% 2009 4 60.5% 1.3% $250.10 -13.7% $151.24 -12.7% 7.8% 9.1% 2009 Annual 61.4% -8.7% $243.37 -16.2% $149.43 -23.5% 8.7% -0.8% 2010 1 63.1% 10.6% $247.06 -6.6% $155.95 3.3% 5.1% 16.2% 2010 2 69.1% 10.2% $242.12 2.2% $167.27 12.6% 1.8% 12.1% 2010F 3 70.8% 8.5% $237.69 5.5% $168.32 14.5% 1.6% 10.2% 2010F 4 63.6% 5.2% $262.78 5.1% $167.18 10.5% 1.0% 6.2% 2010F Annual 66.6% 8.5% $247.07 1.5% $164.67 10.2% 2.3% 11.1% 2011F 1 67.0% 6.2% $262.97 6.4% $176.21 13.0% 0.7% 6.9% 2011F 2 71.6% 3.6% $256.48 5.9% $183.56 9.7% 1.1% 4.7% 2011F 3 73.5% 3.8% $253.57 6.7% $186.42 10.8% 1.3% 5.2% 2011F 4 65.1% 2.3% $279.65 6.4% $181.98 8.9% 1.2% 3.5% 2011F Annual 69.3% 4.0% $262.75 6.3% $182.04 10.5% 1.1% 5.1% 2012F Annual 70.5% 1.8% $287.35 9.4% $202.57 11.3% 0.7% 2.5% 2013F Annual 71.2% 0.9% $313.18 9.0% $222.84 10.0% 0.3% 1.2% 2014F Annual 71.0% -0.2% $333.96 6.6% $237.14 6.4% 0.5% 0.3% Source: Colliers PKF Hospitality Research, Smith Travel Research National Financial Benchmarks* - Luxury Hotels Average Room Count Average Occupancy Average Daily Rate Average RevPAR Financial Line Item Rooms Revenue Food and Beverage Revenue Total Departmental Costs Total Departmental Income Undistributed Operating Expenses Gross Operating Profit Management Fees, Property Taxes, and Insurance Net Operating Income** *Data from 2010 "Trends® in the Hotel Industry" report Source: Colliers PKF Hospitality Research **Before deductions for capital reserves, rent, interest, income taxes, depreciation, and amortization. 18.6% 9.1% 14.5% 26.0% 17.4% 22.1% 7.3% 8.3% 7.6% 50.6% 46.6% 48.2% 24.7% 29.2% 26.1% 33.0% 35.7% 34.6% 49.4% 53.4% 51.8% 2008 Actual 2009 Actual 2010 Estimate 56.8% 53.3% 54.7% $195.41 $149.43 $164.67 Percent of Total Revenue 61.4% 66.6% $290.53 $243.37 $247.07 P. 6 | COLLIERS PKF HOSPITALITY RESEARCH For a more comparable and detailed financial comparison, we recommend a Colliers PKF Benchmarker report. Please contact Claude Vargo at (404) 842-1150, ext. 237 for more information. 2008 Actual 2009 Actual 2010 Estimate 304 304 304 67.3% National Financial Benchmarks* - Luxury Hotels HOTEL HORIZONS® SEPTEMBER - NOVEMBER 2010 EDITION NATIONAL PLUS
  • 7. SEPTEMBER - NOVEMBER 2010 EDITION NATIONAL PLUS National Forecast - Upper Upscale Hotels Year Period Occ !"Occ ADR !"ADR RevPAR !"RevPAR !"Supply !"Demand 2005 Annual 70.8% 2.6% $140.17 6.8% $99.17 9.5% 1.4% 3.9% 2006 Annual 71.0% 0.4% $149.67 6.8% $106.27 7.2% 0.9% 1.3% 2007 Annual 71.0% 0.0% $158.07 5.6% $112.26 5.6% 1.6% 1.6% 2008 1 67.6% -2.5% $164.08 3.6% $110.88 0.9% 3.2% 0.6% 2008 2 73.9% -1.3% $163.97 3.1% $121.10 1.8% 4.1% 2.7% 2008 3 71.6% -2.5% $156.02 2.0% $111.69 -0.6% 4.0% 1.3% 2008 4 61.1% -8.1% $157.28 -3.1% $96.13 -10.9% 4.1% -4.3% 2008 Annual 68.5% -3.5% $160.40 1.5% $109.90 -2.1% 3.8% 0.2% 2009 1 59.5% -11.9% $150.47 -8.3% $89.58 -19.2% 5.9% -6.7% 2009 2 66.5% -9.9% $142.84 -12.9% $95.03 -21.5% 4.5% -5.9% 2009 3 67.7% -5.5% $134.63 -13.7% $91.08 -18.5% 4.4% -1.3% 2009 4 61.1% -0.1% $141.10 -10.3% $86.19 -10.3% 4.5% 4.4% 2009 Annual 63.7% -7.0% $142.00 -11.5% $90.46 -17.7% 4.8% -2.6% 2010 1 63.7% 7.0% $139.42 -7.3% $88.78 -0.9% 2.5% 9.7% 2010 2 72.0% 8.2% $142.47 -0.3% $102.53 7.9% 2.1% 10.5% 2010F 3 71.7% 5.9% $136.11 1.1% $97.53 7.1% 1.8% 7.8% 2010F 4 64.1% 4.9% $141.63 0.4% $90.77 5.3% 1.3% 6.3% 2010F Annual 67.8% 6.5% $139.88 -1.5% $94.90 4.9% 1.9% 8.6% 2011F 1 66.2% 4.0% $146.81 5.3% $97.23 9.5% 1.0% 5.1% 2011F 2 72.5% 0.8% $146.03 2.5% $105.94 3.3% 1.1% 1.9% 2011F 3 72.6% 1.3% $142.10 4.4% $103.15 5.8% 0.9% 2.3% 2011F 4 66.0% 3.0% $149.99 5.9% $99.01 9.1% 0.7% 3.7% 2011F Annual 69.3% 2.2% $146.13 4.5% $101.33 6.8% 0.9% 3.2% 2012F Annual 71.5% 3.1% $154.70 5.9% $110.57 9.1% 0.6% 3.7% 2013F Annual 73.3% 2.6% $164.55 6.4% $120.62 9.1% 0.8% 3.4% 2014F Annual 74.3% 1.4% $169.89 3.2% $126.27 4.7% 1.5% 2.9% Source: Colliers PKF Hospitality Research, Smith Travel Research National Financial Benchmarks* - Upper Upscale Hotels Average Room Count Average Occupancy Average Daily Rate Average RevPAR Financial Line Item Rooms Revenue Food and Beverage Revenue Total Departmental Costs Total Departmental Income Undistributed Operating Expenses Gross Operating Profit Management Fees, Property Taxes, and Insurance Net Operating Income** *Data from 2010 "Trends® in the Hotel Industry" report Source: Colliers PKF Hospitality Research **Before deductions for capital reserves, rent, interest, income taxes, depreciation, and amortization. 29.5% 23.2% 26.5% 37.0% 31.3% 34.3% 7.5% 8.1% 7.7% 62.6% 60.5% 61.2% 25.6% 29.2% 26.9% 28.5% 30.2% 29.6% 37.4% 39.5% 38.8% 2008 Actual 2009 Actual 2010 Estimate 64.7% 62.7% 63.3% $109.20 $90.46 $94.90 Percent of Total Revenue 63.7% 67.8% $160.40 $142.00 $139.88 P. 7 | COLLIERS PKF HOSPITALITY RESEARCH For a more comparable and detailed financial comparison, we recommend a Colliers PKF Benchmarker report. Please contact Claude Vargo at (404) 842-1150, ext. 237 for more information. 2008 Actual 2009 Actual 2010 Estimate 367 367 367 68.5% National Financial Benchmarks* - Upper Upscale Hotels HOTEL HORIZONS® SEPTEMBER - NOVEMBER 2010 EDITION NATIONAL PLUS
  • 8. SEPTEMBER - NOVEMBER 2010 EDITION NATIONAL PLUS National Forecast - Upscale Hotels Year Period Occ !"Occ ADR !"ADR RevPAR !"RevPAR !"Supply !"Demand 2005 Annual 70.0% 2.4% $102.56 7.5% $71.80 10.1% 1.5% 3.9% 2006 Annual 69.9% -0.2% $111.23 8.5% $77.75 8.3% 1.7% 1.6% 2007 Annual 69.0% -1.3% $118.17 6.2% $81.56 4.9% 3.9% 2.6% 2008 1 64.7% -2.9% $122.41 3.8% $79.21 0.8% 5.6% 2.5% 2008 2 71.8% -1.7% $121.26 2.5% $87.11 0.8% 5.8% 4.0% 2008 3 70.4% -2.8% $119.44 1.5% $84.08 -1.3% 6.2% 3.3% 2008 4 59.4% -7.2% $115.70 -2.7% $68.74 -9.7% 6.5% -1.2% 2008 Annual 66.5% -3.6% $119.77 1.3% $79.69 -2.3% 6.0% 2.2% 2009 1 57.3% -11.4% $112.84 -7.8% $64.71 -18.3% 7.9% -4.4% 2009 2 63.9% -11.1% $108.17 -10.8% $69.12 -20.7% 9.4% -2.7% 2009 3 65.2% -7.3% $105.49 -11.7% $68.83 -18.1% 10.3% 2.2% 2009 4 57.5% -3.2% $103.99 -10.1% $59.82 -13.0% 10.2% 6.7% 2009 Annual 61.0% -8.3% $107.48 -10.3% $65.57 -17.7% 9.5% 0.4% 2010 1 60.8% 6.1% $104.49 -7.4% $63.58 -1.7% 8.8% 15.4% 2010 2 69.2% 8.4% $106.75 -1.3% $73.90 6.9% 7.4% 16.4% 2010F 3 68.5% 5.0% $107.69 2.1% $73.77 7.2% 4.2% 9.4% 2010F 4 59.8% 3.9% $105.48 1.4% $63.05 5.4% 3.8% 7.8% 2010F Annual 64.6% 5.9% $106.17 -1.2% $68.57 4.6% 6.0% 12.2% 2011F 1 61.5% 1.1% $108.74 4.1% $66.90 5.2% 3.0% 4.1% 2011F 2 70.2% 1.4% $109.01 2.1% $76.53 3.6% 2.2% 3.6% 2011F 3 69.5% 1.5% $110.29 2.4% $76.65 3.9% 2.6% 4.1% 2011F 4 60.7% 1.5% $108.47 2.8% $65.80 4.4% 2.7% 4.3% 2011F Annual 65.5% 1.4% $109.16 2.8% $71.45 4.2% 2.6% 4.0% 2012F Annual 67.4% 3.0% $117.70 7.8% $79.36 11.1% 2.1% 5.2% 2013F Annual 68.3% 1.4% $127.11 8.0% $86.88 9.5% 2.2% 3.6% 2014F Annual 68.9% 0.9% $130.58 2.7% $90.01 3.6% 4.6% 5.4% Source: Colliers PKF Hospitality Research, Smith Travel Research National Financial Benchmarks* - Upscale Hotels Average Room Count Average Occupancy Average Daily Rate Average RevPAR Financial Line Item Rooms Revenue Food and Beverage Revenue Total Departmental Costs Total Departmental Income Undistributed Operating Expenses Gross Operating Profit Management Fees, Property Taxes, and Insurance Net Operating Income** *Data from 2010 "Trends® in the Hotel Industry" report Source: Colliers PKF Hospitality Research **Before deductions for capital reserves, rent, interest, income taxes, depreciation, and amortization. 31.7% 26.7% 28.4% 41.1% 36.8% 38.2% 9.4% 10.1% 9.8% 69.8% 69.0% 68.8% 28.7% 32.2% 30.6% 9.2% 9.5% 9.5% 30.2% 31.0% 31.2% 2008 Actual 2009 Actual 2010 Estimate 88.5% 88.1% 88.1% $79.69 $65.57 $68.57 Percent of Total Revenue 64.6% $119.77 $107.48 $106.17 P. 8 | COLLIERS PKF HOSPITALITY RESEARCH For a more comparable and detailed financial comparison, we recommend a Colliers PKF Benchmarker report. Please contact Claude Vargo at (404) 842-1150, ext. 237 for more information. 2008 Actual 2009 Actual 2010 Estimate 146 146 146 66.5% 61.0% National Financial Benchmarks* - Upscale Hotels HOTEL HORIZONS® SEPTEMBER - NOVEMBER 2010 EDITION NATIONAL PLUS
  • 9. SEPTEMBER - NOVEMBER 2010 EDITION NATIONAL PLUS National Forecast - Midscale W/ F&B Hotels Year Period Occ !"Occ ADR !"ADR RevPAR !"RevPAR !"Supply !"Demand 2005 Annual 58.8% 3.4% $77.69 5.2% $45.66 8.7% -3.0% 0.2% 2006 Annual 59.2% 0.7% $82.09 5.7% $48.59 6.4% -3.0% -2.3% 2007 Annual 58.5% -1.1% $85.89 4.6% $50.28 3.5% -2.5% -3.6% 2008 1 51.5% -4.8% $85.58 4.5% $44.05 -0.5% -2.5% -7.3% 2008 2 59.8% -4.7% $89.55 3.9% $53.52 -0.9% -2.5% -7.0% 2008 3 61.8% -5.2% $93.05 3.5% $57.47 -1.9% -1.1% -6.3% 2008 4 47.1% -9.8% $84.70 -0.1% $39.85 -9.8% -1.0% -10.7% 2008 Annual 55.0% -6.0% $88.58 3.1% $48.76 -3.0% -1.8% -7.7% 2009 1 45.1% -12.3% $81.76 -4.5% $36.91 -16.2% -1.6% -13.7% 2009 2 52.2% -12.6% $84.21 -6.0% $43.98 -17.8% -1.5% -13.9% 2009 3 55.5% -10.2% $86.72 -6.8% $48.09 -16.3% -1.3% -11.3% 2009 4 43.0% -8.6% $79.41 -6.2% $34.14 -14.3% -0.2% -8.8% 2009 Annual 49.0% -11.0% $83.31 -6.0% $40.79 -16.3% -1.1% -12.1% 2010 1 44.3% -1.8% $78.45 -4.1% $34.77 -5.8% 0.1% -1.7% 2010 2 54.2% 3.9% $83.10 -1.3% $45.08 2.5% 0.3% 4.2% 2010F 3 58.4% 5.4% $87.31 0.7% $51.02 6.1% -0.2% 5.1% 2010F 4 44.1% 2.5% $80.68 1.6% $35.57 4.2% 0.7% 3.2% 2010F Annual 50.3% 2.7% $82.77 -0.6% $41.61 2.0% 0.2% 2.9% 2011F 1 43.6% -1.5% $80.35 2.4% $35.06 0.9% 0.4% -1.2% 2011F 2 53.5% -1.4% $85.24 2.6% $45.61 1.2% 0.2% -1.1% 2011F 3 57.3% -1.9% $89.27 2.2% $51.19 0.3% 0.3% -1.6% 2011F 4 44.0% -0.1% $82.75 2.6% $36.45 2.5% -1.0% -1.1% 2011F Annual 49.7% -1.2% $84.79 2.4% $42.10 1.2% 0.0% -1.3% 2012F Annual 49.3% -0.7% $87.32 3.0% $43.06 2.3% -1.2% -1.9% 2013F Annual 48.7% -1.3% $89.28 2.2% $43.47 1.0% -1.3% -2.5% 2014F Annual 48.0% -1.4% $90.11 0.9% $43.24 -0.5% -1.2% -2.6% Source: Colliers PKF Hospitality Research, Smith Travel Research National Financial Benchmarks* - Midscale W/ F&B Hotels Average Room Count Average Occupancy Average Daily Rate Average RevPAR Financial Line Item Rooms Revenue Food and Beverage Revenue Total Departmental Costs Total Departmental Income Undistributed Operating Expenses Gross Operating Profit Management Fees, Property Taxes, and Insurance Net Operating Income** *Data from 2010 "Trends® in the Hotel Industry" report Source: Colliers PKF Hospitality Research **Before deductions for capital reserves, rent, interest, income taxes, depreciation, and amortization. 15.9% 7.7% 8.5% 25.2% 18.0% 18.7% 9.3% 10.3% 10.2% 57.9% 56.2% 56.0% 32.7% 38.2% 37.3% 19.9% 20.7% 20.7% 42.1% 43.8% 44.0% 2008 Actual 2009 Actual 2010 Estimate 76.3% 75.3% 75.2% $48.76 $40.79 $41.61 Percent of Total Revenue 49.0% 50.3% $88.58 $83.31 $82.77 P. 9 | COLLIERS PKF HOSPITALITY RESEARCH For a more comparable and detailed financial comparison, we recommend a Colliers PKF Benchmarker report. Please contact Claude Vargo at (404) 842-1150, ext. 237 for more information. 2008 Actual 2009 Actual 2010 Estimate 112 112 112 55.0% National Financial Benchmarks* - Midscale W/ F&B Hotels HOTEL HORIZONS® SEPTEMBER - NOVEMBER 2010 EDITION NATIONAL PLUS
  • 10. SEPTEMBER - NOVEMBER 2010 EDITION NATIONAL PLUS National Forecast - Midscale w/o F&B Hotels Year Period Occ !"Occ ADR !"ADR RevPAR !"RevPAR !"Supply !"Demand 2005 Annual 65.4% 3.8% $75.33 7.5% $49.28 11.5% 0.9% 4.7% 2006 Annual 66.0% 0.9% $81.38 8.0% $53.71 9.0% 3.0% 3.9% 2007 Annual 65.0% -1.5% $87.41 7.4% $56.83 5.8% 4.1% 2.5% 2008 1 59.0% -3.5% $89.06 5.2% $52.52 1.5% 4.9% 1.2% 2008 2 66.9% -3.4% $91.15 4.1% $61.02 0.6% 5.2% 1.7% 2008 3 67.1% -4.7% $93.21 3.6% $62.55 -1.3% 5.9% 0.9% 2008 4 53.9% -9.1% $87.73 0.9% $47.27 -8.3% 6.3% -3.4% 2008 Annual 61.7% -5.1% $90.46 3.5% $55.80 -1.8% 5.6% 0.2% 2009 1 52.2% -11.5% $86.21 -3.2% $45.01 -14.3% 6.7% -5.5% 2009 2 59.0% -11.8% $86.36 -5.3% $50.97 -16.5% 7.2% -5.5% 2009 3 60.6% -9.7% $86.98 -6.7% $52.74 -15.7% 7.5% -2.9% 2009 4 50.3% -6.7% $82.01 -6.5% $41.22 -12.8% 6.7% -0.5% 2009 Annual 55.5% -10.0% $85.49 -5.5% $47.47 -14.9% 7.0% -3.7% 2010 1 52.2% 0.0% $82.23 -4.6% $42.92 -4.6% 5.9% 5.8% 2010 2 62.2% 5.4% $85.24 -1.3% $53.04 4.1% 4.7% 10.4% 2010F 3 64.7% 6.7% $88.39 1.6% $57.19 8.4% 3.6% 10.6% 2010F 4 51.9% 3.3% $82.85 1.0% $43.02 4.4% 3.2% 6.6% 2010F Annual 57.8% 4.0% $84.91 -0.7% $49.05 3.3% 4.3% 8.5% 2011F 1 53.0% 1.6% $86.13 4.7% $45.67 6.4% 2.9% 4.6% 2011F 2 63.2% 1.5% $88.62 4.0% $55.99 5.6% 2.9% 4.5% 2011F 3 64.9% 0.3% $92.48 4.6% $60.03 5.0% 2.7% 3.0% 2011F 4 52.9% 1.8% $87.18 5.2% $46.08 7.1% 2.5% 4.3% 2011F Annual 58.5% 1.3% $88.81 4.6% $51.95 5.9% 2.7% 4.0% 2012F Annual 61.1% 4.5% $95.37 7.4% $58.29 12.2% 2.3% 6.9% 2013F Annual 62.6% 2.4% $103.34 8.4% $64.66 10.9% 3.3% 5.7% 2014F Annual 62.2% -0.7% $109.46 5.9% $68.05 5.2% 4.8% 4.1% Source: Colliers PKF Hospitality Research, Smith Travel Research National Financial Benchmarks* - Midscale w/o F&B Hotels Average Room Count Average Occupancy Average Daily Rate Average RevPAR Financial Line Item Rooms Revenue Food and Beverage Revenue Total Departmental Costs Total Departmental Income Undistributed Operating Expenses Gross Operating Profit Management Fees, Property Taxes, and Insurance Net Operating Income** *Data from 2010 "Trends® in the Hotel Industry" report Source: Colliers PKF Hospitality Research **Before deductions for capital reserves, rent, interest, income taxes, depreciation, and amortization. 29.4% 22.9% 24.2% 37.9% 32.2% 33.3% 8.5% 9.3% 9.1% 70.7% 69.8% 69.6% 32.8% 37.6% 36.3% 0.0% 0.0% 0.0% 29.3% 30.2% 30.4% 2008 Actual 2009 Actual 2010 Estimate 98.3% 98.3% 98.2% $55.80 $47.47 $49.05 Percent of Total Revenue 55.5% 57.8% $90.46 $85.49 $84.91 P. 10 | COLLIERS PKF HOSPITALITY RESEARCH For a more comparable and detailed financial comparison, we recommend a Colliers PKF Benchmarker report. Please contact Claude Vargo at (404) 842-1150, ext. 237 for more information. 2008 Actual 2009 Actual 2010 Estimate 87 87 87 61.7% National Financial Benchmarks* - Midscale w/o F&B Hotels HOTEL HORIZONS® SEPTEMBER - NOVEMBER 2010 EDITION NATIONAL PLUS
  • 11. SEPTEMBER - NOVEMBER 2010 EDITION NATIONAL PLUS National Forecast - Economy Hotels Year Period Occ !"Occ ADR !"ADR RevPAR !"RevPAR !"Supply !"Demand 2005 Annual 57.4% 3.3% $49.65 4.2% $28.48 7.6% 0.1% 3.4% 2006 Annual 57.1% -0.4% $52.34 5.4% $29.90 5.0% -0.6% -1.0% 2007 Annual 56.8% -0.6% $53.84 2.9% $30.56 2.2% 2.1% 1.4% 2008 1 50.4% -4.2% $52.45 2.4% $26.41 -1.9% 2.1% -2.1% 2008 2 57.7% -4.2% $55.09 2.0% $31.81 -2.3% 1.9% -2.4% 2008 3 59.9% -4.6% $57.49 0.9% $34.42 -3.8% 1.7% -3.0% 2008 4 47.8% -7.1% $51.97 -0.9% $24.82 -7.9% 1.5% -5.7% 2008 Annual 53.9% -5.0% $54.45 1.1% $29.37 -3.9% 1.8% -3.3% 2009 1 45.6% -9.5% $50.26 -4.2% $22.90 -13.3% 1.4% -8.2% 2009 2 51.3% -11.2% $51.79 -6.0% $26.55 -16.5% 1.2% -10.1% 2009 3 54.4% -9.2% $53.22 -7.4% $28.95 -15.9% 1.0% -8.3% 2009 4 44.7% -6.4% $47.31 -9.0% $21.16 -14.7% 1.0% -5.4% 2009 Annual 49.0% -9.2% $50.81 -6.7% $24.89 -15.2% 1.1% -8.1% 2010 1 45.6% 0.0% $46.48 -7.5% $21.18 -7.5% 0.9% 0.9% 2010 2 53.9% 5.0% $49.65 -4.1% $26.74 0.7% 0.8% 5.9% 2010F 3 58.0% 6.7% $52.37 -1.6% $30.39 5.0% 0.4% 7.1% 2010F 4 47.5% 6.3% $47.31 0.0% $22.49 6.3% 0.4% 6.7% 2010F Annual 51.2% 4.6% $49.17 -3.2% $25.20 1.2% 0.6% 5.3% 2011F 1 46.1% 1.2% $47.84 2.9% $22.06 4.2% 0.6% 1.8% 2011F 2 54.1% 0.4% $50.94 2.6% $27.54 3.0% 1.0% 1.4% 2011F 3 58.6% 1.1% $53.94 3.0% $31.63 4.1% 1.4% 2.5% 2011F 4 48.0% 0.9% $48.72 3.0% $23.37 3.9% 1.7% 2.6% 2011F Annual 51.7% 0.9% $50.59 2.9% $26.16 3.8% 1.2% 2.1% 2012F Annual 51.6% -0.3% $52.18 3.1% $26.90 2.9% 2.1% 1.8% 2013F Annual 51.2% -0.6% $53.49 2.5% $27.41 1.9% 2.8% 2.2% 2014F Annual 49.9% -2.6% $53.96 0.9% $26.94 -1.7% 3.7% 1.0% Source: Colliers PKF Hospitality Research, Smith Travel Research National Financial Benchmarks* - Economy Hotels Average Room Count Average Occupancy Average Daily Rate Average RevPAR Financial Line Item Rooms Revenue Food and Beverage Revenue Total Departmental Costs Total Departmental Income Undistributed Operating Expenses Gross Operating Profit Management Fees, Property Taxes, and Insurance Net Operating Income** *Data from 2010 "Trends® in the Hotel Industry" report Source: Colliers PKF Hospitality Research **Before deductions for capital reserves, rent, interest, income taxes, depreciation, and amortization. 27.5% 15.5% 15.7% 37.4% 26.7% 26.8% 9.8% 11.2% 11.1% 70.3% 67.4% 66.6% 32.9% 40.7% 39.9% 0.0% 0.0% 0.0% 29.7% 32.6% 33.4% 2008 Actual 2009 Actual 2010 Estimate 99.0% 98.9% 98.8% $29.37 $24.89 $25.20 Percent of Total Revenue 49.0% 51.2% $54.45 $50.81 $49.17 P. 11 | COLLIERS PKF HOSPITALITY RESEARCH For a more comparable and detailed financial comparison, we recommend a Colliers PKF Benchmarker report. Please contact Claude Vargo at (404) 842-1150, ext. 237 for more information. 2008 Actual 2009 Actual 2010 Estimate 76 76 76 53.9% National Financial Benchmarks* - Economy Hotels HOTEL HORIZONS® SEPTEMBER - NOVEMBER 2010 EDITION NATIONAL PLUS
  • 12. SEPTEMBER - NOVEMBER 2010 EDITION NATIONAL PLUS National Forecasts by Location Classification Urban Hotels Hotels located in densely populated areas, as in large metropolitan areas. Year Period Occ !"Occ ADR !"ADR RevPAR !"RevPAR !"Supply !"Demand 2005 Annual 68.0% 4.0% $125.74 7.3% $85.50 11.6% -1.0% 3.0% 2006 Annual 68.3% 0.4% $138.18 9.9% $94.35 10.3% -0.9% -0.5% 2007 Annual 68.4% 0.1% $149.69 8.3% $102.33 8.5% 1.0% 1.2% 2008 Annual 66.4% -2.9% $154.87 3.5% $102.83 0.5% 2.0% -0.9% 2009 1 56.1% -11.2% $133.82 -8.5% $75.08 -18.8% 2.8% -8.7% 2009 2 64.8% -9.4% $136.76 -14.6% $88.55 -22.6% 2.7% -6.9% 2009 3 67.1% -5.8% $130.97 -14.7% $87.84 -19.7% 3.0% -3.0% 2009 4 59.5% -0.5% $143.87 -9.5% $85.59 -10.0% 2.9% 2.3% 2009 Annual 61.9% -6.8% $136.25 -12.0% $84.29 -18.0% 2.8% -4.2% 2010 1 59.4% 5.9% $127.68 -4.6% $75.87 1.0% 2.2% 8.3% 2010 2 69.9% 7.9% $141.61 3.6% $98.98 11.8% 2.2% 10.3% 2010F 3 70.8% 5.5% $134.34 2.6% $95.06 8.2% 1.8% 7.4% 2010F 4 61.1% 2.6% $145.66 1.2% $88.95 3.9% 1.4% 4.1% 2010F Annual 65.3% 5.5% $137.44 0.9% $89.74 6.5% 1.9% 7.5% 2011F 1 59.9% 0.8% $133.92 4.9% $80.17 5.7% 1.2% 1.9% 2011F 2 70.6% 0.9% $146.78 3.6% $103.56 4.6% 1.0% 1.9% 2011F 3 70.9% 0.1% $139.13 3.6% $98.58 3.7% 0.6% 0.8% 2011F 4 62.1% 1.7% $150.30 3.2% $93.30 4.9% 1.0% 2.7% 2011F Annual 65.8% 0.8% $142.65 3.8% $93.92 4.7% 0.9% 1.8% 2012F Annual 68.7% 4.4% $149.53 4.8% $102.74 9.4% 0.7% 5.1% 2013F Annual 70.2% 2.1% $162.06 8.4% $113.70 10.7% 0.5% 2.6% 2014F Annual 69.6% -0.8% $171.24 5.7% $119.14 4.8% 1.4% 0.5% Source: Colliers PKF Hospitality Research, Smith Travel Research Suburban Hotels Hotels located in the suburbs of metropolitan markets. Year Period Occ !"Occ ADR !"ADR RevPAR !"RevPAR !"Supply !"Demand 2005 Annual 63.8% 3.8% $79.18 5.6% $50.51 9.6% 0.7% 4.5% 2006 Annual 63.8% 0.0% $85.39 7.8% $54.45 7.8% 0.9% 0.8% 2007 Annual 63.0% -1.2% $90.49 6.0% $57.03 4.7% 1.5% 0.4% 2008 Annual 59.8% -5.1% $92.84 2.6% $55.53 -2.6% 3.0% -2.2% 2009 1 50.6% -12.1% $87.74 -6.2% $44.41 -17.5% 3.6% -8.9% 2009 2 56.2% -13.0% $85.73 -8.8% $48.18 -20.7% 3.6% -9.8% 2009 3 58.3% -9.7% $84.52 -9.9% $49.27 -18.6% 3.6% -6.4% 2009 4 50.1% -4.8% $81.23 -9.2% $40.70 -13.6% 3.6% -1.4% 2009 Annual 53.8% -10.0% $84.80 -8.7% $45.63 -17.8% 3.6% -6.8% 2010 1 52.3% 3.4% $82.35 -6.1% $43.09 -3.0% 3.4% 6.9% 2010 2 60.5% 7.7% $84.08 -1.9% $50.90 5.6% 3.0% 11.0% 2010F 3 62.5% 7.3% $85.03 0.6% $53.19 8.0% 2.8% 10.3% 2010F 4 53.2% 6.2% $82.05 1.0% $43.67 7.3% 1.6% 7.9% 2010F Annual 57.2% 6.3% $83.48 -1.6% $47.73 4.6% 2.7% 9.1% 2011F 1 54.1% 3.3% $86.52 5.1% $46.79 8.6% 1.5% 4.9% 2011F 2 61.7% 2.0% $87.96 4.6% $54.29 6.7% 1.1% 3.0% 2011F 3 63.1% 1.0% $89.17 4.9% $56.30 5.9% 0.5% 1.5% 2011F 4 54.2% 1.9% $86.18 5.0% $46.75 7.0% 1.6% 3.6% 2011F Annual 58.3% 2.0% $87.54 4.9% $51.03 6.9% 1.2% 3.2% 2012F Annual 60.7% 4.2% $93.12 6.4% $56.54 10.8% 0.9% 5.1% 2013F Annual 62.8% 3.4% $100.35 7.8% $63.00 11.4% 1.3% 4.8% 2014F Annual 62.7% -0.1% $106.11 5.7% $66.52 5.6% 2.9% 2.7% Source: Colliers PKF Hospitality Research, Smith Travel Research P. 12 | COLLIERS PKF HOSPITALITY RESEARCH Location segments are hotel classifications driven by physical location. Chain management has provided STR with location classifications for a significant number of hotels. Location segments include Urban, Suburban, Airport, Interstate, Resort, and Small Metro/Small Town. HOTEL HORIZONS® SEPTEMBER - NOVEMBER 2010 EDITION NATIONAL PLUS
  • 13. SEPTEMBER - NOVEMBER 2010 EDITION NATIONAL PLUS National Forecast by Location Classification (cont'd) Airport Hotels Hotels in close proximity of an airport that primarily serve demand from airport traffic. Distance may vary. Year Period Occ !"Occ ADR !"ADR RevPAR !"RevPAR !"Supply !"Demand 2005 Annual 68.7% 3.1% $84.74 7.9% $58.19 11.3% 0.0% 3.1% 2006 Annual 69.2% 0.7% $92.84 9.6% $64.20 10.3% 0.3% 1.0% 2007 Annual 69.2% 0.0% $98.94 6.6% $68.46 6.6% 1.3% 1.4% 2008 Annual 66.0% -4.7% $101.13 2.2% $66.70 -2.6% 2.3% -2.4% 2009 1 58.6% -11.6% $96.98 -6.9% $56.85 -17.7% 3.1% -8.8% 2009 2 61.9% -11.7% $90.85 -11.5% $56.27 -21.9% 3.2% -9.0% 2009 3 62.2% -8.7% $87.25 -12.7% $54.27 -20.4% 3.2% -5.9% 2009 4 56.5% -4.6% $86.33 -11.3% $48.82 -15.4% 3.1% -1.6% 2009 Annual 59.8% -9.3% $90.31 -10.7% $54.03 -19.0% 3.1% -6.5% 2010 1 61.4% 4.8% $89.25 -8.0% $54.83 -3.6% 2.7% 7.6% 2010 2 66.4% 7.2% $88.72 -2.3% $58.93 4.7% 2.3% 9.7% 2010F 3 66.5% 6.9% $87.82 0.6% $58.38 7.6% 2.1% 9.1% 2010F 4 58.8% 3.9% $86.79 0.5% $50.99 4.5% 1.4% 5.3% 2010F Annual 63.3% 5.8% $88.16 -2.4% $55.78 3.2% 2.1% 8.0% 2011F 1 63.4% 3.2% $91.38 2.4% $57.95 5.7% 1.4% 4.6% 2011F 2 67.8% 2.1% $89.79 1.2% $60.91 3.4% 1.2% 3.4% 2011F 3 67.2% 1.0% $89.69 2.1% $60.24 3.2% 0.9% 1.9% 2011F 4 60.8% 3.4% $89.49 3.1% $54.38 6.6% 1.5% 5.0% 2011F Annual 64.8% 2.4% $90.08 2.2% $58.36 4.6% 1.2% 3.7% 2012F Annual 67.3% 3.9% $95.99 6.6% $64.64 10.8% 0.7% 4.7% 2013F Annual 69.0% 2.4% $103.38 7.7% $71.30 10.3% 0.8% 3.2% 2014F Annual 68.3% -0.9% $108.12 4.6% $73.90 3.7% 2.3% 1.3% Source: Colliers PKF Hospitality Research, Smith Travel Research Interstate Hotels Hotels near major highways whose primary source of business is through passerby travel. Excludes suburban. Year Period Occ !"Occ ADR !"ADR RevPAR !"RevPAR !"Supply !"Demand 2005 Annual 56.8% 1.7% $60.01 3.9% $34.08 5.7% 1.0% 2.7% 2006 Annual 57.7% 1.7% $63.43 5.7% $36.63 7.5% 1.0% 2.7% 2007 Annual 57.7% -0.1% $66.98 5.6% $38.63 5.5% 1.7% 1.5% 2008 Annual 54.7% -5.2% $70.09 4.6% $38.31 -0.8% 3.0% -2.4% 2009 1 45.2% -9.1% $66.83 0.4% $30.18 -8.8% 3.7% -5.8% 2009 2 53.1% -10.2% $69.65 -1.1% $36.95 -11.1% 3.6% -7.0% 2009 3 56.1% -8.7% $71.98 -2.4% $40.37 -10.9% 3.4% -5.6% 2009 4 44.3% -8.5% $67.24 -2.0% $29.79 -10.3% 3.2% -5.6% 2009 Annual 49.7% -9.1% $69.14 -1.4% $34.34 -10.4% 3.5% -6.0% 2010 1 43.8% -3.1% $66.60 -0.4% $29.15 -3.4% 3.1% -0.1% 2010 2 54.8% 3.4% $69.76 0.2% $38.25 3.5% 2.6% 6.1% 2010F 3 59.6% 6.3% $72.62 0.9% $43.30 7.2% 2.3% 8.7% 2010F 4 45.7% 3.2% $67.73 0.7% $30.98 4.0% 1.5% 4.7% 2010F Annual 51.0% 2.7% $69.47 0.5% $35.44 3.2% 2.4% 5.1% 2011F 1 44.7% 2.0% $67.79 1.8% $30.28 3.9% 1.2% 3.3% 2011F 2 55.7% 1.6% $70.82 1.5% $39.47 3.2% 0.8% 2.4% 2011F 3 60.2% 0.9% $74.22 2.2% $44.67 3.2% 0.4% 1.4% 2011F 4 46.3% 1.3% $69.99 3.3% $32.44 4.7% 1.3% 2.6% 2011F Annual 51.7% 1.4% $70.97 2.2% $36.71 3.6% 0.9% 2.3% 2012F Annual 53.8% 3.9% $75.42 6.3% $40.55 10.5% 0.8% 4.8% 2013F Annual 54.7% 1.7% $81.77 8.4% $44.72 10.3% 1.2% 2.9% 2014F Annual 54.8% 0.3% $86.90 6.3% $47.65 6.6% 2.6% 2.9% P. 13 | COLLIERS PKF HOSPITALITY RESEARCH HOTEL HORIZONS® SEPTEMBER - NOVEMBER 2010 EDITION NATIONAL PLUS
  • 14. SEPTEMBER - NOVEMBER 2010 EDITION NATIONAL PLUS National Forecast by Location Classification (cont'd) Resort Hotels Hotels located in resort areas where the primary source of business is from leisure destination travel. Year Period Occ !"Occ ADR !"ADR RevPAR !"RevPAR !"Supply !"Demand 2005 Annual 66.3% 1.0% $126.50 6.0% $83.87 7.1% -2.4% -1.4% 2006 Annual 65.9% -0.6% $136.41 7.8% $89.90 7.2% -1.6% -2.2% 2007 Annual 65.5% -0.5% $144.38 5.8% $94.63 5.3% 0.1% -0.4% 2008 Annual 61.6% -6.1% $146.82 1.7% $90.38 -4.5% 1.2% -5.0% 2009 1 55.4% -13.0% $147.35 -11.8% $81.66 -23.3% 1.7% -11.5% 2009 2 59.4% -9.2% $127.10 -12.1% $75.45 -20.2% 1.6% -7.7% 2009 3 61.4% -5.0% $123.33 -11.7% $75.75 -16.1% 1.5% -3.5% 2009 4 51.7% -1.7% $121.56 -9.4% $62.81 -10.9% 1.8% 0.1% 2009 Annual 57.0% -7.4% $129.68 -11.7% $73.89 -18.2% 1.7% -5.9% 2010 1 57.1% 3.1% $140.62 -4.6% $80.31 -1.7% 1.5% 4.6% 2010 2 61.9% 4.4% $125.96 -0.9% $78.04 3.4% 0.8% 5.2% 2010F 3 66.2% 7.8% $123.48 0.1% $81.79 8.0% 0.6% 8.4% 2010F 4 55.7% 7.8% $122.40 0.7% $68.17 8.5% 0.3% 8.1% 2010F Annual 60.3% 5.8% $127.91 -1.4% $77.08 4.3% 0.8% 6.6% 2011F 1 61.6% 7.8% $146.61 4.3% $90.29 12.4% 0.8% 8.7% 2011F 2 66.8% 7.9% $130.17 3.3% $86.98 11.5% 0.3% 8.2% 2011F 3 68.3% 3.1% $130.76 5.9% $89.25 9.1% 0.3% 3.3% 2011F 4 57.7% 3.7% $129.95 6.2% $75.03 10.1% 1.4% 5.1% 2011F Annual 63.6% 5.5% $134.24 4.9% $85.37 10.8% 0.7% 6.2% 2012F Annual 65.9% 3.6% $145.89 8.7% $96.14 12.6% 0.7% 4.3% 2013F Annual 67.8% 2.9% $157.33 7.8% $106.70 11.0% 1.2% 4.1% 2014F Annual 66.6% -1.8% $166.97 6.1% $111.18 4.2% 1.8% -0.1% Source: Colliers PKF Hospitality Research, Smith Travel Research Small Metro/Town Hotels Year Period Occ !"Occ ADR !"ADR RevPAR !"RevPAR !"Supply !"Demand 2005 Annual 56.5% 2.2% $71.44 3.7% $40.37 6.0% 0.4% 2.6% 2006 Annual 56.9% 0.6% $75.18 5.2% $42.75 5.9% 0.7% 1.4% 2007 Annual 56.9% 0.0% $79.37 5.6% $45.15 5.6% 1.5% 1.5% 2008 Annual 54.7% -3.9% $82.48 3.9% $45.09 -0.1% 2.5% -1.5% 2009 1 44.0% -8.9% $75.43 -1.3% $33.20 -10.1% 2.9% -6.3% 2009 2 52.2% -10.3% $80.12 -1.7% $41.79 -11.9% 2.8% -7.8% 2009 3 59.1% -8.2% $88.12 -3.3% $52.05 -11.2% 2.8% -5.6% 2009 4 43.5% -7.8% $75.67 -2.4% $32.95 -10.0% 2.6% -5.4% 2009 Annual 49.8% -8.8% $80.60 -2.3% $40.16 -10.9% 2.8% -6.3% 2010 1 43.0% -2.3% $74.62 -1.1% $32.09 -3.3% 2.4% 0.1% 2010 2 54.3% 4.2% $79.92 -0.2% $43.42 3.9% 1.9% 6.1% 2010F 3 62.7% 6.1% $88.65 0.6% $55.54 6.7% 0.5% 6.6% 2010F 4 45.4% 4.3% $76.12 0.6% $34.58 5.0% 1.7% 6.1% 2010F Annual 51.5% 3.3% $80.72 0.1% $41.56 3.5% 1.6% 5.0% 2011F 1 44.0% 2.2% $76.69 2.8% $33.71 5.1% 3.5% 5.8% 2011F 2 55.3% 1.9% $80.90 1.2% $44.78 3.1% 0.2% 2.0% 2011F 3 62.9% 0.4% $90.22 1.8% $56.77 2.2% 0.2% 0.6% 2011F 4 46.3% 2.0% $78.10 2.6% $36.18 4.6% 2.4% 4.4% 2011F Annual 52.2% 1.3% $82.22 1.9% $42.90 3.2% 1.5% 2.9% 2012F Annual 54.1% 3.8% $86.89 5.7% $47.04 9.7% 1.0% 4.8% 2013F Annual 55.5% 2.5% $93.70 7.8% $51.97 10.5% 1.7% 4.2% 2014F Annual 55.1% -0.7% $98.91 5.6% $54.47 4.8% 2.3% 1.6% Source: Colliers PKF Hospitality Research, Smith Travel Research P. 14 | COLLIERS PKF HOSPITALITY RESEARCH HOTEL HORIZONS® SEPTEMBER - NOVEMBER 2010 EDITION NATIONAL PLUS
  • 15. SEPTEMBER - NOVEMBER 2010 EDITION NATIONAL PLUS National Horizon Profile Year When Nominal RevPAR Returns to Previous Peak - Market Comparison 3 Albuquerque 5 Detroit 4 Nashville 5 Sacramento 4 Anaheim 4 Fort Lauderdale 4 New Orleans 3 Saint Louis 4 Atlanta 5 Fort Worth 4 New York 4 Salt Lake City 4 Austin 4 Hartford 5 Newark 5 San Antonio 3 Baltimore 5 Houston 4 Oahu 4 San Diego 4 Boston 4 Indianapolis 5 Oakland 5 San Francisco 4 Charlotte 4 Jacksonville 5 Orlando 4 Seattle 5 Chicago 3 Kansas City 4 Philadelphia 4 Tampa 3 Cincinnati 4 Long Island 5 Phoenix 5 Tucson 3 Cleveland 3 Los Angeles 3 Pittsburgh 3 Washington DC 3 Columbus 3 Memphis 4 Portland 5 West Palm Beach 4 Dallas 5 Miami 5 Raleigh-Durham 4 Denver 4 Minneapolis 5 Richmond 2012 2013 2014 Source: Colliers PKF Hospitality Research This page showcases the Colliers PKF Hospitality Research Hotel Horizons® forecasting universe. The map below displays the year in which nominal RevPAR levels are forecast to once again achieve their previous peak: 11 markets in 2012, 23 markets in 2013, and 16 markets in 2014 or later. Quarterly Hotel Horizons® reports are available for the nation and all the markets shown below. P. 15 | COLLIERS PKF HOSPITALITY RESEARCH HOTEL HORIZONS® SEPTEMBER - NOVEMBER 2010 EDITION NATIONAL PLUS
  • 16. Fairmont Embassy Suites Courtyard by Marriott Best Western Comfort Inn Days Inn Four Seasons Hilton Crowne Plaza Doubletree Club Fairfield Inn EconoLodge Loews Hyatt Hyatt Place Holiday Inn Hampton Inn Microtel Ritz Carlton Marriott Radisson Quality La Quinta Red Roof W Hotels Westin Residence Inn Red Lion TownPlace Suites Super 8 Wikipedia defines ‘forecasting’ as: 1. The variables included in the models follow from economic theory. 2. The relationships between economic variables are estimated with advanced statistical methods. 3. The forecasts developed with econometric models are more objective than forecasts purely based on judgmental approaches Econometric forecasting represents one of the most sophisticated approaches to gaining insights about future economic activity. Unlike some forecasting methods used in business practice, the models that underlie econometric forecasts rely on historical relationships, similar to statistical correlations, between economic variables. The data for measuring these variables come from actual market transactions involving individuals and firms interacting in the economy. Moreover, these economic variables allowed to enter econometric models have conceptual linkages to economic theory. P. 10 | COLLIERS PKF HOSPITALITY RESEARCH UPPER PRICED LOWER PRICED The financial benchmarks come from the 2010 edition (2009 data) of Trends ® in the Hotel Industry . Trends ® is Colliers PKF Consulting’s annual analysis of hotel financial statements from thousands of properties located across the nation. These data provide mean performance measurements for hotels that are similar in size, location, and ADR for an average upper priced or lower priced property located in the market. For a more in-depth report with a custom comparable set designed for your individual property, see our Colliers PKF-HR Benchmarker service. Consistent with this definition, Colliers PKF Hospitality Research prepares forecasts of the hotel markets in the U.S. based on generally accepted econometric procedures and sound judgment regarding fundamental relationships between the economic and behavioral market indicators and hotel financial performance, relationships that PKF has tracked for over 70 years. HOTEL HORIZONS® FORECAST APPENDIX Exhibit Definitions Financial Benchmarks Forecasting Method The Econometric Component Positive Features of an Econometric Model Market Segments - Representative Brands "the process of estimation in unknown situations. Prediction is a similar, but more general term, and usually refers to estimation of time series, cross- sectional or longitudinal data. In more recent years, forecasting has evolved into the practice of demand planning in every day business forecasting for manufacturing companies. The discipline of demand planning, also sometimes referred to as supply chain forecasting, embraces both statistical forecasting and consensus process...(emphasis added)" Occupancy levels, ADR change and RevPAR change are plotted on a fixed "grade" scale. Measured as current value minus the mean, divided by the series' standard deviation. Grades: A: Very strong, greater than one standard deviation above long run average. B: Strong, within one standard deviation above long run average C: Somewhat weak, within one standard deviation below long run average. D: Weak, below one standard deviation of the long run average. Year over year change in Income, Employment, RevPAR and Demand, displayed as annual (Exhibits 2 and 3) and quarterly (Exhibits 4 and 5). Index based change charts with base year 2005 = 100. These exhibits illustrate the magnitude of change. Compound average annual RevPAR, Demand and Supply change for Upper Priced, Lower Priced, and combined (All) hotels withing the MSA. Real RevPAR change (inflation adjusted, CPI) of the current period minus the historical mean of Real RevPAR change, divided by the historical standard deviation of Real RevPAR change. Exhibits 2 - 5 Exhibit 1 Exhibits 7 - 9 Exhibits 10 - 12 Exhibit 13
  • 17. 1. 2. 3. 1. The Supply Change is added to the previous period number of rooms available to produce a rooms available level in future periods. 2. Number of rooms sold is divided by number of rooms available to obtain occupancy percent in each future period. Finally, a committee of hotel experts from Colliers PKF Hospitality Research performs a thorough review of each model prediction. In the spirit of forecasting described above in the Wikipedia definition, this committee modifies predictions from the model when there is compelling evidence that factors have come into play in a market which the model could not possibly foresee. In the extreme case, a Katrina-style event causes the Committee’s forecast to differ noticeable from the model prediction In most instances, however, the committee either defers to the model prediction or makes modest adjustments. Economic Data from July 2010 Hotel Data from June 2010 P.11 | COLLIERS PKF HOSPITALITY RESEARCH Gaining insight to the future of complicated economic environments requires the introduction of multidimensional forecasting models. Thus, several equations often need to be identified and estimated to model complex economic conditions, as in the national economy. Multi-equation models have considerable appeal for economic forecasting because they explicitly recognize the interdependence of relationships commonly encountered in business and economics. The best examples of this type of model are demand and supply models, in which prices of goods are set by the interaction of buyers and sellers in the market. Thus, price appears as a variable in both the demand and supply equations. The Hotel Horizons ® econometric forecasting models, because they represent an entire sector of the national and MSA economies, fall into the category of multi-equation, demand and supply models. These models have a general structure as defined below, but vary in their form for particular market applications: Demand (the number of rooms occupied - accommodated demand) is the dependent variable in this equation, and equals either Gross Domestic (Metropolitan) Product, Real Personal Income, or Total Employment, which serve as the main independent variable, along with the lagged changes in any of these variables and the lagged demand from the prior year (different numbers of lags are used for independent variables based upon statistical significance). Supply Change (change in the number of rooms available) is the dependent variable, equals ADR and Occupancy, which serve as the main independent variables along with the change in supply from the prior period (different numbers of lags are used for independent variables based upon statistical significance). ADR (Real) is the dependent variable, equals Occupancy, which is the main independent variable along with ADR from the prior period (different numbers of lags are used for independent variables based upon statistical significance). ADR is represented as nominal in the preceding report. These equations are estimated with ordinary least squares in a non-simultaneous fashion using data from Smith Travel Research and Moody's Economy.com. dating back to the late 1980s. The parameters (coefficients on each variable) then are used to forecast demand, supply change, and ADR by multiplying the parameters with Moody's Economy.com forecast of the economic variables and relevant previously estimated values (lagged variables). Two additional calculations are made with these results as follows: The econometric model predicts future room supply in small increments (e.g., 100 rooms per quarter). In reality, rooms enter the market in large blocks (e.g., 1000 rooms) as new hotels are placed in service. When it becomes apparent that a new hotel (s) will be placed in service within the next 18 months, the modeled supply change will be manually adjusted to account for the opening of the new hotel (s). The reverse also is true when it become apparent that a hotel (s) will be taken out of service (e.g., demolished or converted to an alternative use). HOTEL HORIZONS® FORECAST APPENDIX The Judgmental Component The Equations
  • 18. SEPTEMBER - NOVEMBER 2010 EDITION NATIONAL PLUS 2010 2011 1st Qtr 2nd Qtr 3rd Qtr F 4th Qtr F Year End 1st Qtr F 2nd Qtr F 3rd Qtr F 4th Qtr F Year End This Report 0.0% -0.2% 1.2% 1.7% 0.6% 1.7% 2.4% 3.1% 4.0% 2.8% Last Report -0.6% -0.1% 0.9% 1.8% 0.5% 2.5% 3.2% 3.5% 4.0% 3.3% This Report -2.3% -0.6% 0.3% 0.9% -0.4% 1.2% 1.1% 1.5% 1.9% 1.4% Last Report -2.4% -1.5% -0.6% 0.1% -1.1% 0.9% 1.8% 2.5% 3.0% 2.1% This Report 2.7% 2.3% 1.8% 1.4% 2.0% 1.7% 0.7% 0.5% 1.6% 1.1% Last Report 2.9% 1.2% 0.3% 0.6% 1.2% 0.3% 0.3% 0.3% 0.5% 0.3% This Report 5.1% 8.7% 8.6% 6.4% 7.3% 4.8% 3.3% 1.5% 3.7% 3.2% Last Report 5.3% 5.8% 4.3% 3.2% 4.7% 3.5% 2.9% 3.1% 4.2% 3.4% This Report 2.3% 6.2% 6.7% 5.0% 5.2% 3.1% 2.5% 1.0% 2.1% 2.1% Last Report 2.3% 4.6% 4.0% 2.6% 3.4% 3.3% 2.6% 2.8% 3.7% 3.1% This Report -4.3% 0.0% 0.9% 0.8% -0.6% 4.3% 2.8% 3.9% 4.1% 3.8% Last Report -4.3% -1.1% -1.5% 0.5% -1.6% 3.1% 4.5% 4.7% 5.9% 4.6% This Report -2.0% 6.2% 7.6% 5.8% 4.6% 7.6% 5.4% 4.9% 6.3% 5.9% Last Report -2.1% 3.4% 2.4% 3.1% 1.7% 6.5% 7.2% 7.7% 9.8% 7.8% * Economic data (history and forecast) are from Moody's Economy.com ** Hotel performance data: History supplied by Smith Travel Research; Forecast developed by Colliers PKF Hospitality Research In January of 2010 Smith Travel Research, our source for historical lodging data, changed their policy regarding the handling of available room counts. Accordingly, some historical hotel performance data may differ from that presented in previous editions of Hotel Horizons®. What Has Changed Since The Last Report? 2010 and 2011 Year End Forecast Change in RevPAR 2010 Change in Occupancy** 2011 Change in Occupancy** 2010 Change in ADR** 2011 Change in ADR** 2010 Change in RevPAR** 2011 Change in RevPAR** P. 18 | COLLIERS PKF HOSPITALITY RESEARCH Forecasts are valuable tools for developing expectations of key variables. Changes to forecasts occur for two primary reasons. The first is adjustments to historical series made by the data provider, causing future periods to vary due to changes in their base. The second is that economic expectations tend to shift as more information becomes available, thus moving the hotel variables according to their underlying relationships. We are constantly re-evaluating the performance of Hotel Horizons® forecasts, and presented below is a view on how the world has changed since the June - August 2010 issue, presented in same period, prior year change format. All data under "This Report" are actual as of 2nd Quarter 2010. Data marked as "Last Report" are actual as of 1st Quarter 2010, with 2nd Quarter 2010 being the first forecast period for that report. As noted on earlier pages, all of the hotel variables below are modeled using data from Moody's Economy.com. It is important to note that all historical data are subject to revision. 2010 Change in Real Personal Income* 2011 Change in Real Personal Income* 2010 Change in Total Payroll Employment* 2011 Change in Total Payroll Employment* 2010 Change in Supply** 2011 Change in Supply** 2010 Change in Demand** 2011 Change in Demand** 4.6% 5.9% 1.7% 7.8% 2010 2011 This Report Last Report HOTEL HORIZONS® SEPTEMBER - NOVEMBER 2010 EDITION NATIONAL PLUS
  • 19. SEPTEMBER - NOVEMBER 2010 EDITION NATIONAL PLUS P. 19 | COLLIERS PKF HOSPITALITY RESEARCH Hotel Horizons® myShare! Hotel Horizons® myShare! is an informed way to estimate the future performance of any submarket, competitive set, or subject property based on the behavior of the overall market.! Seventy five to eighty percent of all occupancy and rate movements experienced by a property, or group of properties, can be explained through movements in the larger market.! The remaining twenty to twenty-five percent is endemic to the property or submarket itself, and those individuals who deal with the day to day operations of these properties are best suited to understand and account for these differences. myShare! utilizes historical penetration rates of the submarket, competitive set, and subject property to the larger market to produce informed micro-forecasts. myShare! gives the user the tools necessary to understand the historic movements of their subset, and apply that knowledge to future periods in time. myShare! is being introduced on a complimentary basis in time for budget season, and is included with every Hotel Horizons single market report, including this one. Check your original download or email hotelhorizonssupport@pkfc.com. View the video tutorial online at: www.pkfmyshare.com HOTEL HORIZONS® NATIONAL PLUS The Penetration Rate
  • 20. SEPTEMBER - NOVEMBER 2010 EDITION NATIONAL PLUS ADR Average Daily Rate - rooms revenue divided by paid rooms occupied. Occupancy Paid rooms occupied divided by available rooms. RevPAR Revenue per Available Room - rooms revenue divided by available rooms. Supply Average daily room nights available per quarter, represented as a change over previous year, same quarter except where noted annually. Demand (Accommodated Demand) Average daily room nights occupied per quarter, represented as a change over previous year, same quarter except where noted annually. LRA Long Run Average - Annual average from 1988 to 2009 Penetration Market area (or sub-market area) measurement as a percent of national (or market area) measurement. Standard Deviation The plotting of a normal data series and how far each individual data point lies from the mean: 68.2% of the series will fall within 1 standard deviation, 95.4% of all data points will fall within 2 standard deviations, and 99.7% falling within 3 standard deviations of the mean. For more reports visit our website at www.hotelhorizons.com HOTEL HORIZONS® NATIONAL PLUS Hotel Horizons ® is compiled and produced by Colliers PKF Hospitality Research, the research affiliate of Colliers PKF Consulting USA. Readers are advised that neither Colliers PKF Consulting USA nor Colliers PKF Hospitality Research represent the data herein to be definitive, neither should the contents be construed as a recommendation on policies or actions. Quotation, reproduction, and distribution are prohibited without the written permission of Colliers PKF Hospitality Research. Please address inquiries to Hotel Horizons ® , 3475 Lenox Road, Suite 720, Atlanta GA 30326. Phone: (866) 842 8754 Glossary of Terms mark.eble@pkfc.com hank.staley@pkfc.com bruce.baltin@pkfc.com jeff.lugosi@pkfc.com rachel.falkner@pkfc.com dave.arnold@pkfc.com Indianapolis Jacksonville Los Angeles Orlando Philadelphia New York john.fox@pkfc.com Contact: Mark Eble Contact: Hank Staley Contact: Bruce Baltin Contact: Jeff Lugosi Contact: Rachel Falkner Contact: David E. Arnold Contact: John A. Fox Asheville Chicago tony.jenkins@pkfc.com mark.eble@pkfc.com Atlanta Boston Bozeman mark.woodworth@pkfc.com scott.smith@pkfc.com reed.woodworth@pkfc.com chris.kraus@pkfc.com Dallas / Houston randy.mccaslin@pkfc.com Contact: Tony Jenkins Contact: Mark Eble Contact: Mark Woodworth Contact: Scott Smith Contact: Reed Woodworth Contact: Christopher Kraus Contact: Randy McCaslin tom.blake@pkfc.com thomas.callahan@pkfc.com chuck.ross@pkfc.com kannan.sankaran@pkfc.com Portland San Francisco Tampa Washington, D.C. Contact: Tom Blake Contact: Tom Callahan Contact: Chuck Ross Contact: Kannan Sankaran Dallas / Houston hank.wolpert@pkfc.com rs.patel@pkfc.com bob.kaplan@pkfc.com rod.apodaca@pkfc.com Los Angeles Miami Sacramento Seattle rich.lillis@pkfc.com kent.schwarz@pkfc.com dan.hayward@pkfc.com chris.burdett@pkfc.com Contact: Hank Wolpert Contact: R. S. Patel Contact: Bob Kaplan Contact: Rod Apodaca Contact: Rich Lillis Contact: Kent Schwarz Contact: Dan Hayward Contact: Chris Burdett San Francisco bob.eaton@pkfc.com mark.mcdermott@pkfc.com henry.bose@pkfc.com Contact: Bob Eaton Contact: Mark McDermott Contact: Henry Bose Hotel Brokerage ServicesAdvisory & Consulting Services CONSULTING USA Atlanta mark.woodworth@pkfc.com Contact: Mark Woodworth Industry Research & Publications HOSPITALITY RESEARCH