SlideShare uma empresa Scribd logo
1 de 18
Baixar para ler offline
Ronny Budiutama                                                                                                                                                                            Intero Real Estate
                                                                            Median Sold Price by Quarter
                                                                   Q3 2008 vs. Q3 2011: The median sold price is down 15%


                                                                                 Q3 2008 vs. Q3 2011
                  Q3 2008                                             Q3 2011                                       Change                                              %
                  820,000                                             701,000                                       -119,000                                          -15%


MLS: SFMLS        Period:   3 years (quarterly)           Price:    All                       Construction Type:    All            Bedrooms:    All             Bathrooms:      All   Lot Size: All
Property Types:   Residential                                                                                                                                                         Sq Ft:    All
Cities:           San Francisco


Clarus MarketMetrics®                                                                                      1 of 2                                                                                     10/28/2011
                                                  Information not guaranteed. © 2009-2010 Terradatum and its suppliers and licensors (www.terradatum.com/about/licensors.td).


                                                                                                                                                 1 of 18
Ronny Budiutama                                                                                                                                                      Intero Real Estate
                                                                 Median Sold Price by Quarter
                                                     Q3 2008 vs. Q3 2011: The median sold price is down 15%


Time Period             Median Price            # Units       Average DOM
Q3 2011                     701,000                 603                    62
Q2 2011                     720,000                 680                    62
Q1 2011                     664,000                 494                    71
Q4 2010                     728,000                 615                    60
Q3 2010                     730,000                 577                    58
Q2 2010                     775,000                 671                    54
Q1 2010                     735,000                 467                    61
Q4 2009                     769,000                 649                    57
Q3 2009                     739,000                 651                    58
Q2 2009                     750,000                 557                    65
Q1 2009                     652,000                 333                    62
Q4 2008                     725,000                 481                    57
Q3 2008                     820,000                 619                    52


Clarus MarketMetrics®                                                                           2 of 2                                                                         10/28/2011
                                       Information not guaranteed. © 2009-2010 Terradatum and its suppliers and licensors (www.terradatum.com/about/licensors.td).


                                                                                                                                      2 of 18
Ronny Budiutama                                                                                                                                                                               Intero Real Estate
                                                                          Median For Sale vs. Median Sold
          Q3 08 vs. Q3 11: The median price of for sale properties is down 15% and the median price of sold properties is down 15%


                       Q3 2008 vs. Q3 2011                                                                                                                         Q3 2008 vs. Q3 2011
     Q3 2008          Q3 2011                Change                        %                                                                    Q3 2008            Q3 2011            Change               %
     799,000          680,000                -119,000                    -15%                                                                   820,000            701,000            -119,000           -15%


MLS: SFMLS        Period:   3 years (quarterly)           Price:   All                        Construction Type:    All             Bedrooms:    All            Bathrooms:      All      Lot Size: All
Property Types:   Residential                                                                                                                                                            Sq Ft:    All
Cities:           San Francisco


Clarus MarketMetrics®                                                                                      1 of 2                                                                                         10/28/2011
                                                  Information not guaranteed. © 2009-2010 Terradatum and its suppliers and licensors (www.terradatum.com/about/licensors.td).


                                                                                                                                                 3 of 18
Ronny Budiutama                                                                                                                                                    Intero Real Estate
                                                           Median For Sale vs. Median Sold
          Q3 08 vs. Q3 11: The median price of for sale properties is down 15% and the median price of sold properties is down 15%

                          For Sale                # Properties                         Sold                 # Properties                        Price
Time Period                Median                     For Sale                       Median                        Sold                    Difference
Q3 2011                    680,000                         1,649                    701,000                           603                      21,000
Q2 2011                    699,000                         1,530                    720,000                           680                      21,000
Q1 2011                    675,950                         1,383                    664,000                           494                      -11,950
Q4 2010                    699,000                         1,448                    728,000                           615                      29,000
Q3 2010                    729,000                         1,769                    730,000                           577                       1,000
Q2 2010                    749,000                         1,657                    775,000                           671                      26,000
Q1 2010                    758,000                         1,339                    735,000                           467                      -23,000
Q4 2009                    769,000                         1,232                    769,000                           649                            0
Q3 2009                    795,000                         1,552                    739,000                           651                      -56,000
Q2 2009                    799,000                         1,594                    750,000                           557                      -49,000
Q1 2009                    788,000                         1,336                    652,000                           333                     -136,000
Q4 2008                    788,000                         1,336                    725,000                           481                      -63,000
Q3 2008                    799,000                         1,601                    820,000                           619                      21,000


Clarus MarketMetrics®                                                                         2 of 2                                                                         10/28/2011
                                     Information not guaranteed. © 2009-2010 Terradatum and its suppliers and licensors (www.terradatum.com/about/licensors.td).


                                                                                                                                    4 of 18
Ronny Budiutama                                                                                                                                                                            Intero Real Estate
                                                                               Sold Properties by Quarter
                                                           Q3 2008 vs. Q3 2011: The number of Sold properties is down 3%


                                                                                  Q3 2008 vs. Q3 2011
                  Q3 2008                                            Q3 2011                                        Change                                              %
                    619                                                603                                            -16                                              -3%


MLS: SFMLS        Period:   3 years (quarterly)           Price:   All                        Construction Type:    All             Bedrooms:    All            Bathrooms:      All   Lot Size: All
Property Types:   Residential                                                                                                                                                         Sq Ft:    All
Cities:           San Francisco


Clarus MarketMetrics®                                                                                      1 of 2                                                                                     10/28/2011
                                                  Information not guaranteed. © 2009-2010 Terradatum and its suppliers and licensors (www.terradatum.com/about/licensors.td).


                                                                                                                                                 5 of 18
Ronny Budiutama                                                                                                                                                                    Intero Real Estate
                                                                     Sold Properties by Quarter
                                                 Q3 2008 vs. Q3 2011: The number of Sold properties is down 3%


                                       Full Market                                                Bank Properties                                            Non-Bank Properties
Time Period             # Properties      Median Price         Average DOM              # Properties         % Bank            Median Price           # Properties    % Non-Bank        Median Price
Q3 2011                         603             701,000                     62                   119             19.7               450,000                     484         80.3            788,500
Q2 2011                         680             720,000                     62                   131             19.3               450,000                     549         80.7            782,500
Q1 2011                         494             664,000                     71                   120             24.3               450,000                     374         75.7            740,050
Q4 2010                         615             728,000                     60                     95            15.4               480,000                     520         84.5            785,000
Q3 2010                         577             730,000                     58                   105             18.2               460,000                     472         81.8            787,000
Q2 2010                         671             775,000                     54                   123             18.3               520,000                     548         81.7            837,500
Q1 2010                         467             735,000                     61                   113             24.2               501,000                     354         75.8            789,500
Q4 2009                         649             769,000                     57                   111             17.1               485,000                     538         82.9            819,250
Q3 2009                         651             739,000                     58                   136             20.9               518,150                     515         79.1            805,000
Q2 2009                         557             750,000                     65                   104             18.7               467,500                     453         81.3            805,000
Q1 2009                         333             652,000                     62                   104             31.2               501,500                     229         68.8            795,000
Q4 2008                         481             725,000                     57                     87            18.1               508,800                     394         81.9            798,250
Q3 2008                         619             820,000                     52                     17             2.8               525,000                     602         97.2            825,000


Clarus MarketMetrics®                                                                            2 of 2                                                                                       10/28/2011
                                        Information not guaranteed. © 2009-2010 Terradatum and its suppliers and licensors (www.terradatum.com/about/licensors.td).


                                                                                                                                       6 of 18
Ronny Budiutama                                                                                                                                                                            Intero Real Estate
                                                                   Under Contract Properties by Quarter
                                                    Q3 2008 vs. Q3 2011: The number of Under Contract properties is up 21%


                                                                                  Q3 2008 vs. Q3 2011
                  Q3 2008                                            Q3 2011                                        Change                                             %
                    568                                                685                                           117                                              +21%


MLS: SFMLS        Period:   3 years (quarterly)           Price:   All                        Construction Type:    All             Bedrooms:    All            Bathrooms:      All   Lot Size: All
Property Types:   Residential                                                                                                                                                         Sq Ft:    All
Cities:           San Francisco


Clarus MarketMetrics®                                                                                      1 of 2                                                                                     10/28/2011
                                                  Information not guaranteed. © 2009-2010 Terradatum and its suppliers and licensors (www.terradatum.com/about/licensors.td).


                                                                                                                                                 7 of 18
Ronny Budiutama                                                                                                                                                                    Intero Real Estate
                                                         Under Contract Properties by Quarter
                                          Q3 2008 vs. Q3 2011: The number of Under Contract properties is up 21%


                                       Full Market                                                Bank Properties                                            Non-Bank Properties
Time Period             # Properties      Median Price         Average DOM              # Properties         % Bank            Median Price           # Properties    % Non-Bank        Median Price
Q3 2011                         685             659,000                     58                   150             21.9               427,000                     535         78.1            749,000
Q2 2011                         681             699,999                     59                   124             18.2               450,102                     557         81.8            795,000
Q1 2011                         578             689,444                     70                   161             27.9               443,700                     417         72.2            790,000
Q4 2010                         559             699,000                     68                   102             18.2               460,400                     457         81.8            749,000
Q3 2010                         590             719,250                     60                   113             19.1               468,000                     477         80.8            779,000
Q2 2010                         681             749,000                     56                   120             17.6               462,200                     561         82.4            799,000
Q1 2010                         543             750,000                     53                   116             21.4               461,610                     427         78.6            799,000
Q4 2009                         548             747,000                     62                   112             20.4               452,670                     436         79.6            799,000
Q3 2009                         634             716,944                     58                   126             19.9               499,450                     508         80.1            799,000
Q2 2009                         665             778,000                     63                   123             18.5               475,000                     542         81.5            839,000
Q1 2009                         413             688,000                     68                   118             28.6               473,700                     295         71.4            785,000
Q4 2008                         400             699,000                     64                   100             25.0               504,000                     300         75.0            799,000
Q3 2008                         568             788,000                     50                     52             9.2               499,450                     516         90.8            799,000


Clarus MarketMetrics®                                                                            2 of 2                                                                                       10/28/2011
                                        Information not guaranteed. © 2009-2010 Terradatum and its suppliers and licensors (www.terradatum.com/about/licensors.td).


                                                                                                                                       8 of 18
Ronny Budiutama                                                                                                                                                                            Intero Real Estate
                                                                                New Properties by Quarter
                                                             Q3 2008 vs. Q3 2011: The number of New properties is up 5%


                                                                                  Q3 2008 vs. Q3 2011
                  Q3 2008                                            Q3 2011                                        Change                                              %
                    966                                               1,010                                           44                                               +5%


MLS: SFMLS        Period:   3 years (quarterly)           Price:   All                        Construction Type:    All             Bedrooms:    All            Bathrooms:      All   Lot Size: All
Property Types:   Residential                                                                                                                                                         Sq Ft:    All
Cities:           San Francisco


Clarus MarketMetrics®                                                                                      1 of 2                                                                                     10/28/2011
                                                  Information not guaranteed. © 2009-2010 Terradatum and its suppliers and licensors (www.terradatum.com/about/licensors.td).


                                                                                                                                                 9 of 18
Ronny Budiutama                                                                                                                                                                 Intero Real Estate
                                                                     New Properties by Quarter
                                                  Q3 2008 vs. Q3 2011: The number of New properties is up 5%


                            Full Market                                   Bank Properties                                             Non-Bank Properties
Time Period             # Properties     Median Price            # Properties         % Bank              Median Price         # Properties       % Non-Bank         Median Price
Q3 2011                       1,010            699,000                    192             19.0                477,500                   818                81.0          759,000
Q2 2011                         919            699,500                    184             20.0                436,678                   735                80.0          799,000
Q1 2011                         905            695,000                    216             23.9                450,000                   689                76.1          789,000
Q4 2010                         621            679,000                    154             24.8                456,950                   467                75.2          768,000
Q3 2010                       1,051            720,000                    180             17.1                459,450                   871                82.9          775,000
Q2 2010                       1,050            749,000                    190             18.1                461,700                   860                81.9          799,000
Q1 2010                         946            769,000                    185             19.6                515,000                   761                80.4          819,000
Q4 2009                         592            729,000                    149             25.2                450,000                   443                74.8          799,000
Q3 2009                         882            777,000                    153             17.4                497,000                   729                82.7          839,000
Q2 2009                         927            785,000                    186             20.1                498,950                   741                79.9          879,000
Q1 2009                         841            799,000                    181             21.5                489,900                   660                78.5          895,000
Q4 2008                         616            759,500                    153             24.8                499,900                   463                75.2          890,000
Q3 2008                         966            799,974                    148             15.3                499,000                   818                84.7          875,000


Clarus MarketMetrics®                                                                            2 of 2                                                                                   10/28/2011
                                       Information not guaranteed. © 2009-2010 Terradatum and its suppliers and licensors (www.terradatum.com/about/licensors.td).


                                                                                                                                      10 of 18
Ronny Budiutama                                                                                                                                                                            Intero Real Estate
                                                                           For Sale Properties by Quarter
                                                          Q3 2008 vs. Q3 2011: The number of For Sale properties is up 3%


                                                                                  Q3 2008 vs. Q3 2011
                  Q3 2008                                            Q3 2011                                        Change                                              %
                   1,601                                              1,649                                           48                                               +3%


MLS: SFMLS        Period:   3 years (quarterly)           Price:   All                        Construction Type:    All             Bedrooms:    All            Bathrooms:      All   Lot Size: All
Property Types:   Residential                                                                                                                                                         Sq Ft:    All
Cities:           San Francisco


Clarus MarketMetrics®                                                                                      1 of 2                                                                                     10/28/2011
                                                  Information not guaranteed. © 2009-2010 Terradatum and its suppliers and licensors (www.terradatum.com/about/licensors.td).


                                                                                                                                                 11 of 18
Ronny Budiutama                                                                                                                                                                    Intero Real Estate
                                                                 For Sale Properties by Quarter
                                                Q3 2008 vs. Q3 2011: The number of For Sale properties is up 3%


                                       Full Market                                                Bank Properties                                            Non-Bank Properties
Time Period             # Properties      Median Price         Average DOM              # Properties         % Bank            Median Price           # Properties    % Non-Bank        Median Price
Q3 2011                       1,649             680,000                     65                   374             22.7               459,000                   1,275         77.3            759,000
Q2 2011                       1,530             699,000                     67                   350             22.9               449,000                   1,180         77.1            795,000
Q1 2011                       1,383             675,950                     74                   376             27.2               449,700                   1,007         72.8            788,000
Q4 2010                       1,448             699,000                     86                   322             22.2               450,000                   1,126         77.8            775,000
Q3 2010                       1,769             729,000                     68                   347             19.6               460,000                   1,422         80.4            799,000
Q2 2010                       1,657             749,000                     63                   344             20.8               469,482                   1,313         79.2            830,000
Q1 2010                       1,339             758,000                     64                   310             23.1               476,500                   1,029         76.8            849,000
Q4 2009                       1,232             769,000                     80                   285             23.1               469,900                     947         76.9            868,888
Q3 2009                       1,552             795,000                     67                   315             20.3               499,000                   1,237         79.7            879,000
Q2 2009                       1,594             799,000                     68                   345             21.6               499,000                   1,249         78.4            899,000
Q1 2009                       1,336             788,000                     75                   331             24.8               490,000                   1,005         75.2            895,000
Q4 2008                       1,336             788,000                     84                   305             22.8               499,900                   1,031         77.2            897,000
Q3 2008                       1,601             799,000                     65                   222             13.9               512,450                   1,379         86.1            849,000


Clarus MarketMetrics®                                                                            2 of 2                                                                                       10/28/2011
                                        Information not guaranteed. © 2009-2010 Terradatum and its suppliers and licensors (www.terradatum.com/about/licensors.td).


                                                                                                                                       12 of 18
Ronny Budiutama                                                                                                                                                                            Intero Real Estate
                                                                            Expired Properties by Quarter
                                                       Q3 2008 vs. Q3 2011: The number of Expired properties is down 12%


                                                                                  Q3 2008 vs. Q3 2011
                  Q3 2008                                            Q3 2011                                        Change                                               %
                    313                                                277                                            -36                                              -12%


MLS: SFMLS        Period:   3 years (quarterly)           Price:   All                        Construction Type:    All             Bedrooms:    All            Bathrooms:      All   Lot Size: All
Property Types:   Residential                                                                                                                                                         Sq Ft:    All
Cities:           San Francisco


Clarus MarketMetrics®                                                                                      1 of 2                                                                                     10/28/2011
                                                  Information not guaranteed. © 2009-2010 Terradatum and its suppliers and licensors (www.terradatum.com/about/licensors.td).


                                                                                                                                                 13 of 18
Ronny Budiutama                                                                                                                                                                    Intero Real Estate
                                                                  Expired Properties by Quarter
                                             Q3 2008 vs. Q3 2011: The number of Expired properties is down 12%


                                       Full Market                                                Bank Properties                                            Non-Bank Properties
Time Period             # Properties      Median Price         Average DOM             # Properties          % Bank           Median Price           # Properties     % Non-Bank       Median Price
Q3 2011                         277             699,000                     96                     65            23.5               435,000                     212         76.5           798,500
Q2 2011                         210             749,000                    110                     44            20.9               425,000                     166         79.0           809,500
Q1 2011                         194             672,500                    114                     49            25.3               460,000                     145         74.7           789,000
Q4 2010                         411             749,000                    108                     60            14.6               462,500                     351         85.4           799,000
Q3 2010                         352             799,000                     99                     66            18.8               499,000                     286         81.2           849,000
Q2 2010                         258             749,250                     89                     57            22.1               478,000                     201         77.9           875,000
Q1 2010                         189             799,000                    106                     40            21.2               525,000                     149         78.8           879,000
Q4 2009                         291             959,000                    102                     48            16.5               512,750                     243         83.5          1,095,000
Q3 2009                         278             877,000                    101                     53            19.1               499,000                     225         80.9           979,950
Q2 2009                         259             974,500                    102                     60            23.2               567,450                     199         76.8          1,098,000
Q1 2009                         256             799,000                    106                     54            21.1               507,450                     202         78.9           889,000
Q4 2008                         441             949,000                     97                     55            12.5               524,000                     386         87.5           999,000
Q3 2008                         313             849,950                     95                     18             5.8               640,500                     295         94.2           870,000


Clarus MarketMetrics®                                                                            2 of 2                                                                                       10/28/2011
                                        Information not guaranteed. © 2009-2010 Terradatum and its suppliers and licensors (www.terradatum.com/about/licensors.td).


                                                                                                                                       14 of 18
Ronny Budiutama                                                                                                                                                                              Intero Real Estate
                                                                            Supply & Demand by Quarter
                  Q3 2008 vs. Q3 2011: The number of for sale properties is up 3% and the number of sold properties is down 3%


                       Q3 2008 vs. Q3 2011                                                                                                                         Q3 2008 vs. Q3 2011
     Q3 2008          Q3 2011                Change                       %                                                                     Q3 2008            Q3 2011            Change             %
      1,601            1,649                   48                        +3%                                                                      619                603                -16             -3%


MLS: SFMLS        Period:   3 years (quarterly)           Price:   All                        Construction Type:    All             Bedrooms:    All            Bathrooms:      All     Lot Size: All
Property Types:   Residential                                                                                                                                                           Sq Ft:    All
Cities:           San Francisco


Clarus MarketMetrics®                                                                                      1 of 2                                                                                        10/28/2011
                                                  Information not guaranteed. © 2009-2010 Terradatum and its suppliers and licensors (www.terradatum.com/about/licensors.td).


                                                                                                                                                 15 of 18
Ronny Budiutama                                                                                                                                                      Intero Real Estate
                                                                 Supply & Demand by Quarter
                Q3 2008 vs. Q3 2011: The number of for sale properties is up 3% and the number of sold properties is down 3%

                        # Properties              Average DOM                    # Properties               Average DOM
Time Period                 For Sale                   For Sale                         Sold                        Sold
Q3 2011                       1,649                             65                         603                           62
Q2 2011                       1,530                             67                         680                           62
Q1 2011                       1,383                             74                         494                           71
Q4 2010                       1,448                             86                         615                           60
Q3 2010                       1,769                             68                         577                           58
Q2 2010                       1,657                             63                         671                           54
Q1 2010                       1,339                             64                         467                           61
Q4 2009                       1,232                             80                         649                           57
Q3 2009                       1,552                             67                         651                           58
Q2 2009                       1,594                             68                         557                           65
Q1 2009                       1,336                             75                         333                           62
Q4 2008                       1,336                             84                         481                           57
Q3 2008                       1,601                             65                         619                           52


Clarus MarketMetrics®                                                                            2 of 2                                                                        10/28/2011
                                       Information not guaranteed. © 2009-2010 Terradatum and its suppliers and licensors (www.terradatum.com/about/licensors.td).


                                                                                                                                     16 of 18
Ronny Budiutama                                                                                                                                                                            Intero Real Estate
                                                                   The Average Days on Market by Quarter
                                                              Q3 2008 vs. Q3 2011: The average days on market is up 14%


                                                                                  Q3 2008 vs. Q3 2011
                  Q3 2008                                            Q3 2011                                        Change                                             %
                    50                                                 58                                             7                                               +14%


MLS: SFMLS        Period:   3 years (quarterly)           Price:   All                        Construction Type:    All             Bedrooms:    All            Bathrooms:      All   Lot Size: All
Property Types:   Residential                                                                                                                                                         Sq Ft:    All
Cities:           San Francisco


Clarus MarketMetrics®                                                                                      1 of 2                                                                                     10/28/2011
                                                  Information not guaranteed. © 2009-2010 Terradatum and its suppliers and licensors (www.terradatum.com/about/licensors.td).


                                                                                                                                                 17 of 18
Ronny Budiutama                                                                                                                                                     Intero Real Estate
                                                    The Average Days on Market by Quarter
                                                  Q3 2008 vs. Q3 2011: The average days on market is up 14%


Time Period             Average DOM      # UC Units
Q3 2011                          58              685
Q2 2011                          59              681
Q1 2011                          70              578
Q4 2010                          68              559
Q3 2010                          60              590
Q2 2010                          56              681
Q1 2010                          53              543
Q4 2009                          62              548
Q3 2009                          58              634
Q2 2009                          63              665
Q1 2009                          68              413
Q4 2008                          64              400
Q3 2008                          50              568


Clarus MarketMetrics®                                                                          2 of 2                                                                         10/28/2011
                                      Information not guaranteed. © 2009-2010 Terradatum and its suppliers and licensors (www.terradatum.com/about/licensors.td).


                                                                                                                                     18 of 18

Mais conteúdo relacionado

Destaque

ReuniãO Com Investidores Do 3 T05 En
ReuniãO Com Investidores Do 3 T05 EnReuniãO Com Investidores Do 3 T05 En
ReuniãO Com Investidores Do 3 T05 EnTIM RI
 
Erl1 panorama de samaritan´s purse
Erl1 panorama de samaritan´s purseErl1 panorama de samaritan´s purse
Erl1 panorama de samaritan´s purseJosue Miranda
 
The Outcome Economy
The Outcome EconomyThe Outcome Economy
The Outcome EconomyHelge Tennø
 

Destaque (9)

Mart's Portfolio
Mart's PortfolioMart's Portfolio
Mart's Portfolio
 
Presentation1
Presentation1Presentation1
Presentation1
 
ReuniãO Com Investidores Do 3 T05 En
ReuniãO Com Investidores Do 3 T05 EnReuniãO Com Investidores Do 3 T05 En
ReuniãO Com Investidores Do 3 T05 En
 
Erl1 panorama de samaritan´s purse
Erl1 panorama de samaritan´s purseErl1 panorama de samaritan´s purse
Erl1 panorama de samaritan´s purse
 
Who Am I
Who  Am  IWho  Am  I
Who Am I
 
Power point
Power pointPower point
Power point
 
Test
TestTest
Test
 
Test
TestTest
Test
 
The Outcome Economy
The Outcome EconomyThe Outcome Economy
The Outcome Economy
 

Semelhante a San francisco residential q3 2008 q32011

San Francisco Residential Q2 2009 - Q2 2012
San Francisco Residential Q2 2009 - Q2 2012San Francisco Residential Q2 2009 - Q2 2012
San Francisco Residential Q2 2009 - Q2 2012Ronny Budiutama
 
TREB Mid Month Report October 1010
TREB Mid Month Report October 1010TREB Mid Month Report October 1010
TREB Mid Month Report October 1010NicoleLehoczky
 
San francisco Real Estate Market June 2010 - June 2012
San francisco Real Estate Market June 2010 - June 2012San francisco Real Estate Market June 2010 - June 2012
San francisco Real Estate Market June 2010 - June 2012Ronny Budiutama
 
Toronto Real Estate Statistics september 2011
Toronto Real Estate Statistics september 2011Toronto Real Estate Statistics september 2011
Toronto Real Estate Statistics september 2011John Helfrich
 
San Francisco Residential Market July 2010 - July 2012
San Francisco Residential Market July 2010 - July 2012San Francisco Residential Market July 2010 - July 2012
San Francisco Residential Market July 2010 - July 2012Ronny Budiutama
 
Market Figures February 2011
Market Figures   February 2011Market Figures   February 2011
Market Figures February 2011NicoleLehoczky
 
San francisco residential april10 april 12
San francisco residential april10   april 12San francisco residential april10   april 12
San francisco residential april10 april 12Ronny Budiutama
 
SANTANDER MEXICO-SANTANDER INVESTOR DAY 2011
SANTANDER MEXICO-SANTANDER INVESTOR DAY 2011SANTANDER MEXICO-SANTANDER INVESTOR DAY 2011
SANTANDER MEXICO-SANTANDER INVESTOR DAY 2011BANCO SANTANDER
 
Country Club of Louisiana Baton Rouge Home Sales Q3 2011 vs Q3 2014
Country Club of Louisiana Baton Rouge Home Sales Q3 2011 vs Q3 2014Country Club of Louisiana Baton Rouge Home Sales Q3 2011 vs Q3 2014
Country Club of Louisiana Baton Rouge Home Sales Q3 2011 vs Q3 2014Bill Cobb, Appraiser
 
Tricumen Muni Market 23 Jan12 Public
Tricumen Muni Market 23 Jan12   PublicTricumen Muni Market 23 Jan12   Public
Tricumen Muni Market 23 Jan12 Publicsebwalker
 
REALOGY8K51408_000
REALOGY8K51408_000REALOGY8K51408_000
REALOGY8K51408_000finance35
 
REALOGY8K51408_000
REALOGY8K51408_000REALOGY8K51408_000
REALOGY8K51408_000finance35
 
Toronto real estate statistics august 2011
Toronto real estate statistics august 2011Toronto real estate statistics august 2011
Toronto real estate statistics august 2011John Helfrich
 

Semelhante a San francisco residential q3 2008 q32011 (20)

San Francisco Residential Q2 2009 - Q2 2012
San Francisco Residential Q2 2009 - Q2 2012San Francisco Residential Q2 2009 - Q2 2012
San Francisco Residential Q2 2009 - Q2 2012
 
TREB Mid Month Report October 1010
TREB Mid Month Report October 1010TREB Mid Month Report October 1010
TREB Mid Month Report October 1010
 
San francisco Real Estate Market June 2010 - June 2012
San francisco Real Estate Market June 2010 - June 2012San francisco Real Estate Market June 2010 - June 2012
San francisco Real Estate Market June 2010 - June 2012
 
Toronto Real Estate Statistics september 2011
Toronto Real Estate Statistics september 2011Toronto Real Estate Statistics september 2011
Toronto Real Estate Statistics september 2011
 
San Francisco Residential Market July 2010 - July 2012
San Francisco Residential Market July 2010 - July 2012San Francisco Residential Market July 2010 - July 2012
San Francisco Residential Market July 2010 - July 2012
 
Market Figures February 2011
Market Figures   February 2011Market Figures   February 2011
Market Figures February 2011
 
Cw12 q3
Cw12 q3Cw12 q3
Cw12 q3
 
Commercial Real Estate Market Watch for Toronto: September 2012
Commercial Real Estate Market Watch for Toronto: September 2012Commercial Real Estate Market Watch for Toronto: September 2012
Commercial Real Estate Market Watch for Toronto: September 2012
 
San francisco residential april10 april 12
San francisco residential april10   april 12San francisco residential april10   april 12
San francisco residential april10 april 12
 
Nr mid month_0510
Nr mid month_0510Nr mid month_0510
Nr mid month_0510
 
SANTANDER MEXICO-SANTANDER INVESTOR DAY 2011
SANTANDER MEXICO-SANTANDER INVESTOR DAY 2011SANTANDER MEXICO-SANTANDER INVESTOR DAY 2011
SANTANDER MEXICO-SANTANDER INVESTOR DAY 2011
 
Country Club of Louisiana Baton Rouge Home Sales Q3 2011 vs Q3 2014
Country Club of Louisiana Baton Rouge Home Sales Q3 2011 vs Q3 2014Country Club of Louisiana Baton Rouge Home Sales Q3 2011 vs Q3 2014
Country Club of Louisiana Baton Rouge Home Sales Q3 2011 vs Q3 2014
 
Tricumen Muni Market 23 Jan12 Public
Tricumen Muni Market 23 Jan12   PublicTricumen Muni Market 23 Jan12   Public
Tricumen Muni Market 23 Jan12 Public
 
Q1 2009 Earning Report of Deltic Timber Corp
Q1 2009 Earning Report of Deltic Timber CorpQ1 2009 Earning Report of Deltic Timber Corp
Q1 2009 Earning Report of Deltic Timber Corp
 
Mid Month Stats
Mid Month StatsMid Month Stats
Mid Month Stats
 
Release 4 q10
Release 4 q10Release 4 q10
Release 4 q10
 
Greater Toronto REALTORS Rental Report for Q2, 2012
Greater Toronto REALTORS Rental Report for Q2, 2012Greater Toronto REALTORS Rental Report for Q2, 2012
Greater Toronto REALTORS Rental Report for Q2, 2012
 
REALOGY8K51408_000
REALOGY8K51408_000REALOGY8K51408_000
REALOGY8K51408_000
 
REALOGY8K51408_000
REALOGY8K51408_000REALOGY8K51408_000
REALOGY8K51408_000
 
Toronto real estate statistics august 2011
Toronto real estate statistics august 2011Toronto real estate statistics august 2011
Toronto real estate statistics august 2011
 

Mais de Ronny Budiutama

San Francisco January 2024 Market Report
San Francisco January 2024 Market ReportSan Francisco January 2024 Market Report
San Francisco January 2024 Market ReportRonny Budiutama
 
San Francisco December 2023 Market Report
San Francisco December 2023 Market ReportSan Francisco December 2023 Market Report
San Francisco December 2023 Market ReportRonny Budiutama
 
San Francisco November 2023 Market Report
San Francisco November 2023 Market ReportSan Francisco November 2023 Market Report
San Francisco November 2023 Market ReportRonny Budiutama
 
2023 Annual San Francisco Housing Market
2023 Annual San Francisco Housing Market2023 Annual San Francisco Housing Market
2023 Annual San Francisco Housing MarketRonny Budiutama
 
October 2023 Report: San Francisco Real Estate Market Insights
October 2023 Report: San Francisco Real Estate Market InsightsOctober 2023 Report: San Francisco Real Estate Market Insights
October 2023 Report: San Francisco Real Estate Market InsightsRonny Budiutama
 
CA Weekly MLS Market Data Report - August 2023
CA Weekly MLS Market Data Report - August 2023CA Weekly MLS Market Data Report - August 2023
CA Weekly MLS Market Data Report - August 2023Ronny Budiutama
 
San Francisco Market Report July 2023.pdf
San Francisco Market Report July 2023.pdfSan Francisco Market Report July 2023.pdf
San Francisco Market Report July 2023.pdfRonny Budiutama
 
San Francisco May 2023 Market Report.pdf
San Francisco May 2023 Market Report.pdfSan Francisco May 2023 Market Report.pdf
San Francisco May 2023 Market Report.pdfRonny Budiutama
 
San Francisco June 2023 Market Report.pdf
San Francisco June 2023 Market Report.pdfSan Francisco June 2023 Market Report.pdf
San Francisco June 2023 Market Report.pdfRonny Budiutama
 
San Francisco Market Report March 2023.pdf
San Francisco Market Report March 2023.pdfSan Francisco Market Report March 2023.pdf
San Francisco Market Report March 2023.pdfRonny Budiutama
 
San Francisco Market Report February 2023
San Francisco Market Report February 2023San Francisco Market Report February 2023
San Francisco Market Report February 2023Ronny Budiutama
 
San Francisco Market Report January 2023.pdf
San Francisco Market Report January 2023.pdfSan Francisco Market Report January 2023.pdf
San Francisco Market Report January 2023.pdfRonny Budiutama
 
Annual Report on the San Francisco County Housing Market.pdf
Annual Report on the San Francisco County Housing Market.pdfAnnual Report on the San Francisco County Housing Market.pdf
Annual Report on the San Francisco County Housing Market.pdfRonny Budiutama
 
San Francisco Market Report December 2022.pdf
San Francisco Market Report December 2022.pdfSan Francisco Market Report December 2022.pdf
San Francisco Market Report December 2022.pdfRonny Budiutama
 
San Francisco Market Report November 2022.pdf
San Francisco Market Report November 2022.pdfSan Francisco Market Report November 2022.pdf
San Francisco Market Report November 2022.pdfRonny Budiutama
 
San Francisco Market Report October 2022.pdf
San Francisco Market Report October 2022.pdfSan Francisco Market Report October 2022.pdf
San Francisco Market Report October 2022.pdfRonny Budiutama
 
San Francisco Market Report September 2022.pdf
San Francisco Market Report September 2022.pdfSan Francisco Market Report September 2022.pdf
San Francisco Market Report September 2022.pdfRonny Budiutama
 
San Francisco Market Report August 2022.pdf
San Francisco Market Report August 2022.pdfSan Francisco Market Report August 2022.pdf
San Francisco Market Report August 2022.pdfRonny Budiutama
 
San Francisco Market Report July 2022.pdf
San Francisco Market Report July 2022.pdfSan Francisco Market Report July 2022.pdf
San Francisco Market Report July 2022.pdfRonny Budiutama
 
San Francisco Market Report June 2022.pdf
San Francisco Market Report June 2022.pdfSan Francisco Market Report June 2022.pdf
San Francisco Market Report June 2022.pdfRonny Budiutama
 

Mais de Ronny Budiutama (20)

San Francisco January 2024 Market Report
San Francisco January 2024 Market ReportSan Francisco January 2024 Market Report
San Francisco January 2024 Market Report
 
San Francisco December 2023 Market Report
San Francisco December 2023 Market ReportSan Francisco December 2023 Market Report
San Francisco December 2023 Market Report
 
San Francisco November 2023 Market Report
San Francisco November 2023 Market ReportSan Francisco November 2023 Market Report
San Francisco November 2023 Market Report
 
2023 Annual San Francisco Housing Market
2023 Annual San Francisco Housing Market2023 Annual San Francisco Housing Market
2023 Annual San Francisco Housing Market
 
October 2023 Report: San Francisco Real Estate Market Insights
October 2023 Report: San Francisco Real Estate Market InsightsOctober 2023 Report: San Francisco Real Estate Market Insights
October 2023 Report: San Francisco Real Estate Market Insights
 
CA Weekly MLS Market Data Report - August 2023
CA Weekly MLS Market Data Report - August 2023CA Weekly MLS Market Data Report - August 2023
CA Weekly MLS Market Data Report - August 2023
 
San Francisco Market Report July 2023.pdf
San Francisco Market Report July 2023.pdfSan Francisco Market Report July 2023.pdf
San Francisco Market Report July 2023.pdf
 
San Francisco May 2023 Market Report.pdf
San Francisco May 2023 Market Report.pdfSan Francisco May 2023 Market Report.pdf
San Francisco May 2023 Market Report.pdf
 
San Francisco June 2023 Market Report.pdf
San Francisco June 2023 Market Report.pdfSan Francisco June 2023 Market Report.pdf
San Francisco June 2023 Market Report.pdf
 
San Francisco Market Report March 2023.pdf
San Francisco Market Report March 2023.pdfSan Francisco Market Report March 2023.pdf
San Francisco Market Report March 2023.pdf
 
San Francisco Market Report February 2023
San Francisco Market Report February 2023San Francisco Market Report February 2023
San Francisco Market Report February 2023
 
San Francisco Market Report January 2023.pdf
San Francisco Market Report January 2023.pdfSan Francisco Market Report January 2023.pdf
San Francisco Market Report January 2023.pdf
 
Annual Report on the San Francisco County Housing Market.pdf
Annual Report on the San Francisco County Housing Market.pdfAnnual Report on the San Francisco County Housing Market.pdf
Annual Report on the San Francisco County Housing Market.pdf
 
San Francisco Market Report December 2022.pdf
San Francisco Market Report December 2022.pdfSan Francisco Market Report December 2022.pdf
San Francisco Market Report December 2022.pdf
 
San Francisco Market Report November 2022.pdf
San Francisco Market Report November 2022.pdfSan Francisco Market Report November 2022.pdf
San Francisco Market Report November 2022.pdf
 
San Francisco Market Report October 2022.pdf
San Francisco Market Report October 2022.pdfSan Francisco Market Report October 2022.pdf
San Francisco Market Report October 2022.pdf
 
San Francisco Market Report September 2022.pdf
San Francisco Market Report September 2022.pdfSan Francisco Market Report September 2022.pdf
San Francisco Market Report September 2022.pdf
 
San Francisco Market Report August 2022.pdf
San Francisco Market Report August 2022.pdfSan Francisco Market Report August 2022.pdf
San Francisco Market Report August 2022.pdf
 
San Francisco Market Report July 2022.pdf
San Francisco Market Report July 2022.pdfSan Francisco Market Report July 2022.pdf
San Francisco Market Report July 2022.pdf
 
San Francisco Market Report June 2022.pdf
San Francisco Market Report June 2022.pdfSan Francisco Market Report June 2022.pdf
San Francisco Market Report June 2022.pdf
 

Último

Omaxe Dwarka In Delhi E Brochure Pdf
Omaxe Dwarka In Delhi E Brochure     PdfOmaxe Dwarka In Delhi E Brochure     Pdf
Omaxe Dwarka In Delhi E Brochure Pdfashiyadav24
 
Call Girls In Chand Nagar (Delhi)+918447779280 Welcome To Vip Women Seeking M...
Call Girls In Chand Nagar (Delhi)+918447779280 Welcome To Vip Women Seeking M...Call Girls In Chand Nagar (Delhi)+918447779280 Welcome To Vip Women Seeking M...
Call Girls In Chand Nagar (Delhi)+918447779280 Welcome To Vip Women Seeking M...asmaqueen5
 
Mahindra Happinest Tathawade Pune Brochure.pdf
Mahindra Happinest Tathawade Pune Brochure.pdfMahindra Happinest Tathawade Pune Brochure.pdf
Mahindra Happinest Tathawade Pune Brochure.pdfBabyrudram
 
Premium Villa Projects in Sarjapur Road Bengaluru
Premium Villa Projects in Sarjapur Road BengaluruPremium Villa Projects in Sarjapur Road Bengaluru
Premium Villa Projects in Sarjapur Road BengaluruShivaSeo3
 
9711199012 Call {Girls Delhi} Very Low rate Vaishali DownLoad PDF
9711199012 Call {Girls Delhi} Very Low rate Vaishali DownLoad PDF9711199012 Call {Girls Delhi} Very Low rate Vaishali DownLoad PDF
9711199012 Call {Girls Delhi} Very Low rate Vaishali DownLoad PDFMs Riya
 
Call Girls In Mayur Vihar Delhi ☆↫8447779280 ❤Escorts Service In Delhi
Call Girls In Mayur Vihar Delhi ☆↫8447779280 ❤Escorts Service In DelhiCall Girls In Mayur Vihar Delhi ☆↫8447779280 ❤Escorts Service In Delhi
Call Girls In Mayur Vihar Delhi ☆↫8447779280 ❤Escorts Service In Delhiasmaqueen5
 
3D Architectural Rendering Company by Panoram CGI
3D Architectural Rendering Company by Panoram CGI3D Architectural Rendering Company by Panoram CGI
3D Architectural Rendering Company by Panoram CGIPanoram CGI
 
Call Girls in shastri nagar Delhi 8264348440 ✅ call girls ❤️
Call Girls in shastri nagar Delhi 8264348440 ✅ call girls ❤️Call Girls in shastri nagar Delhi 8264348440 ✅ call girls ❤️
Call Girls in shastri nagar Delhi 8264348440 ✅ call girls ❤️soniya singh
 
Telibagh & Call Girls Lucknow - 450+ Call Girl Cash Payment 🎂 8923113531 🎪 Ne...
Telibagh & Call Girls Lucknow - 450+ Call Girl Cash Payment 🎂 8923113531 🎪 Ne...Telibagh & Call Girls Lucknow - 450+ Call Girl Cash Payment 🎂 8923113531 🎪 Ne...
Telibagh & Call Girls Lucknow - 450+ Call Girl Cash Payment 🎂 8923113531 🎪 Ne...gurkirankumar98700
 
Call Girls in Noida Sector 12 Noida 💯Call Us 🔝 9582086666 🔝 South Delhi Escor...
Call Girls in Noida Sector 12 Noida 💯Call Us 🔝 9582086666 🔝 South Delhi Escor...Call Girls in Noida Sector 12 Noida 💯Call Us 🔝 9582086666 🔝 South Delhi Escor...
Call Girls in Noida Sector 12 Noida 💯Call Us 🔝 9582086666 🔝 South Delhi Escor...delhimodel235
 
Maha Mauka Squarefeet Brochure |Maha Mauka Squarefeet PDF Brochure|
Maha Mauka Squarefeet Brochure |Maha Mauka Squarefeet PDF Brochure|Maha Mauka Squarefeet Brochure |Maha Mauka Squarefeet PDF Brochure|
Maha Mauka Squarefeet Brochure |Maha Mauka Squarefeet PDF Brochure|AkshayJoshi575980
 
FULL ENJOY 🔝 8264348440 🔝 Call Girls in DLF phase 3 | Gurgaon
FULL ENJOY 🔝 8264348440 🔝 Call Girls in DLF phase 3 | GurgaonFULL ENJOY 🔝 8264348440 🔝 Call Girls in DLF phase 3 | Gurgaon
FULL ENJOY 🔝 8264348440 🔝 Call Girls in DLF phase 3 | Gurgaonsoniya singh
 
Call Girls in Noida Sector 11 Noida 💯Call Us 🔝 9582086666 🔝 South Delhi Escor...
Call Girls in Noida Sector 11 Noida 💯Call Us 🔝 9582086666 🔝 South Delhi Escor...Call Girls in Noida Sector 11 Noida 💯Call Us 🔝 9582086666 🔝 South Delhi Escor...
Call Girls in Noida Sector 11 Noida 💯Call Us 🔝 9582086666 🔝 South Delhi Escor...delhimodel235
 
Raquel Thompson: Combining Creativity with Practicality in Architecture
Raquel Thompson: Combining  Creativity with Practicality in ArchitectureRaquel Thompson: Combining  Creativity with Practicality in Architecture
Raquel Thompson: Combining Creativity with Practicality in ArchitectureRaquel Thompson Barbados
 
Call Girls in Noida Sector 13 Noida 💯Call Us 🔝 9582086666 🔝 South Delhi Escor...
Call Girls in Noida Sector 13 Noida 💯Call Us 🔝 9582086666 🔝 South Delhi Escor...Call Girls in Noida Sector 13 Noida 💯Call Us 🔝 9582086666 🔝 South Delhi Escor...
Call Girls in Noida Sector 13 Noida 💯Call Us 🔝 9582086666 🔝 South Delhi Escor...delhimodel235
 
Girls in Kalyanpuri }Delhi↫8447779280↬Escort Service. In Delhi NCR
Girls in Kalyanpuri }Delhi↫8447779280↬Escort Service. In Delhi NCRGirls in Kalyanpuri }Delhi↫8447779280↬Escort Service. In Delhi NCR
Girls in Kalyanpuri }Delhi↫8447779280↬Escort Service. In Delhi NCRasmaqueen5
 
Greater Vancouver Realtors Statistics Package April 2024
Greater Vancouver Realtors Statistics Package April 2024Greater Vancouver Realtors Statistics Package April 2024
Greater Vancouver Realtors Statistics Package April 2024VickyAulakh1
 
M3M 129 E Brochure Noida Expressway, Sector 129, Noida
M3M 129 E Brochure Noida Expressway, Sector 129, NoidaM3M 129 E Brochure Noida Expressway, Sector 129, Noida
M3M 129 E Brochure Noida Expressway, Sector 129, Noidasarak0han45400
 
2k Shot Call girls Karol Bagh Delhi 9205541914
2k Shot Call girls Karol Bagh Delhi 92055419142k Shot Call girls Karol Bagh Delhi 9205541914
2k Shot Call girls Karol Bagh Delhi 9205541914Delhi Call girls
 
Kohinoor Flats In Hinjewadi Phase 2 | Homes Built To Suit Your Needs
Kohinoor Flats In Hinjewadi Phase 2 | Homes Built To Suit Your NeedsKohinoor Flats In Hinjewadi Phase 2 | Homes Built To Suit Your Needs
Kohinoor Flats In Hinjewadi Phase 2 | Homes Built To Suit Your Needsaidasheikh47
 

Último (20)

Omaxe Dwarka In Delhi E Brochure Pdf
Omaxe Dwarka In Delhi E Brochure     PdfOmaxe Dwarka In Delhi E Brochure     Pdf
Omaxe Dwarka In Delhi E Brochure Pdf
 
Call Girls In Chand Nagar (Delhi)+918447779280 Welcome To Vip Women Seeking M...
Call Girls In Chand Nagar (Delhi)+918447779280 Welcome To Vip Women Seeking M...Call Girls In Chand Nagar (Delhi)+918447779280 Welcome To Vip Women Seeking M...
Call Girls In Chand Nagar (Delhi)+918447779280 Welcome To Vip Women Seeking M...
 
Mahindra Happinest Tathawade Pune Brochure.pdf
Mahindra Happinest Tathawade Pune Brochure.pdfMahindra Happinest Tathawade Pune Brochure.pdf
Mahindra Happinest Tathawade Pune Brochure.pdf
 
Premium Villa Projects in Sarjapur Road Bengaluru
Premium Villa Projects in Sarjapur Road BengaluruPremium Villa Projects in Sarjapur Road Bengaluru
Premium Villa Projects in Sarjapur Road Bengaluru
 
9711199012 Call {Girls Delhi} Very Low rate Vaishali DownLoad PDF
9711199012 Call {Girls Delhi} Very Low rate Vaishali DownLoad PDF9711199012 Call {Girls Delhi} Very Low rate Vaishali DownLoad PDF
9711199012 Call {Girls Delhi} Very Low rate Vaishali DownLoad PDF
 
Call Girls In Mayur Vihar Delhi ☆↫8447779280 ❤Escorts Service In Delhi
Call Girls In Mayur Vihar Delhi ☆↫8447779280 ❤Escorts Service In DelhiCall Girls In Mayur Vihar Delhi ☆↫8447779280 ❤Escorts Service In Delhi
Call Girls In Mayur Vihar Delhi ☆↫8447779280 ❤Escorts Service In Delhi
 
3D Architectural Rendering Company by Panoram CGI
3D Architectural Rendering Company by Panoram CGI3D Architectural Rendering Company by Panoram CGI
3D Architectural Rendering Company by Panoram CGI
 
Call Girls in shastri nagar Delhi 8264348440 ✅ call girls ❤️
Call Girls in shastri nagar Delhi 8264348440 ✅ call girls ❤️Call Girls in shastri nagar Delhi 8264348440 ✅ call girls ❤️
Call Girls in shastri nagar Delhi 8264348440 ✅ call girls ❤️
 
Telibagh & Call Girls Lucknow - 450+ Call Girl Cash Payment 🎂 8923113531 🎪 Ne...
Telibagh & Call Girls Lucknow - 450+ Call Girl Cash Payment 🎂 8923113531 🎪 Ne...Telibagh & Call Girls Lucknow - 450+ Call Girl Cash Payment 🎂 8923113531 🎪 Ne...
Telibagh & Call Girls Lucknow - 450+ Call Girl Cash Payment 🎂 8923113531 🎪 Ne...
 
Call Girls in Noida Sector 12 Noida 💯Call Us 🔝 9582086666 🔝 South Delhi Escor...
Call Girls in Noida Sector 12 Noida 💯Call Us 🔝 9582086666 🔝 South Delhi Escor...Call Girls in Noida Sector 12 Noida 💯Call Us 🔝 9582086666 🔝 South Delhi Escor...
Call Girls in Noida Sector 12 Noida 💯Call Us 🔝 9582086666 🔝 South Delhi Escor...
 
Maha Mauka Squarefeet Brochure |Maha Mauka Squarefeet PDF Brochure|
Maha Mauka Squarefeet Brochure |Maha Mauka Squarefeet PDF Brochure|Maha Mauka Squarefeet Brochure |Maha Mauka Squarefeet PDF Brochure|
Maha Mauka Squarefeet Brochure |Maha Mauka Squarefeet PDF Brochure|
 
FULL ENJOY 🔝 8264348440 🔝 Call Girls in DLF phase 3 | Gurgaon
FULL ENJOY 🔝 8264348440 🔝 Call Girls in DLF phase 3 | GurgaonFULL ENJOY 🔝 8264348440 🔝 Call Girls in DLF phase 3 | Gurgaon
FULL ENJOY 🔝 8264348440 🔝 Call Girls in DLF phase 3 | Gurgaon
 
Call Girls in Noida Sector 11 Noida 💯Call Us 🔝 9582086666 🔝 South Delhi Escor...
Call Girls in Noida Sector 11 Noida 💯Call Us 🔝 9582086666 🔝 South Delhi Escor...Call Girls in Noida Sector 11 Noida 💯Call Us 🔝 9582086666 🔝 South Delhi Escor...
Call Girls in Noida Sector 11 Noida 💯Call Us 🔝 9582086666 🔝 South Delhi Escor...
 
Raquel Thompson: Combining Creativity with Practicality in Architecture
Raquel Thompson: Combining  Creativity with Practicality in ArchitectureRaquel Thompson: Combining  Creativity with Practicality in Architecture
Raquel Thompson: Combining Creativity with Practicality in Architecture
 
Call Girls in Noida Sector 13 Noida 💯Call Us 🔝 9582086666 🔝 South Delhi Escor...
Call Girls in Noida Sector 13 Noida 💯Call Us 🔝 9582086666 🔝 South Delhi Escor...Call Girls in Noida Sector 13 Noida 💯Call Us 🔝 9582086666 🔝 South Delhi Escor...
Call Girls in Noida Sector 13 Noida 💯Call Us 🔝 9582086666 🔝 South Delhi Escor...
 
Girls in Kalyanpuri }Delhi↫8447779280↬Escort Service. In Delhi NCR
Girls in Kalyanpuri }Delhi↫8447779280↬Escort Service. In Delhi NCRGirls in Kalyanpuri }Delhi↫8447779280↬Escort Service. In Delhi NCR
Girls in Kalyanpuri }Delhi↫8447779280↬Escort Service. In Delhi NCR
 
Greater Vancouver Realtors Statistics Package April 2024
Greater Vancouver Realtors Statistics Package April 2024Greater Vancouver Realtors Statistics Package April 2024
Greater Vancouver Realtors Statistics Package April 2024
 
M3M 129 E Brochure Noida Expressway, Sector 129, Noida
M3M 129 E Brochure Noida Expressway, Sector 129, NoidaM3M 129 E Brochure Noida Expressway, Sector 129, Noida
M3M 129 E Brochure Noida Expressway, Sector 129, Noida
 
2k Shot Call girls Karol Bagh Delhi 9205541914
2k Shot Call girls Karol Bagh Delhi 92055419142k Shot Call girls Karol Bagh Delhi 9205541914
2k Shot Call girls Karol Bagh Delhi 9205541914
 
Kohinoor Flats In Hinjewadi Phase 2 | Homes Built To Suit Your Needs
Kohinoor Flats In Hinjewadi Phase 2 | Homes Built To Suit Your NeedsKohinoor Flats In Hinjewadi Phase 2 | Homes Built To Suit Your Needs
Kohinoor Flats In Hinjewadi Phase 2 | Homes Built To Suit Your Needs
 

San francisco residential q3 2008 q32011

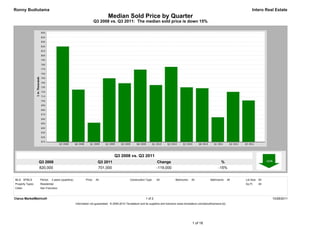
  • 1. Ronny Budiutama Intero Real Estate Median Sold Price by Quarter Q3 2008 vs. Q3 2011: The median sold price is down 15% Q3 2008 vs. Q3 2011 Q3 2008 Q3 2011 Change % 820,000 701,000 -119,000 -15% MLS: SFMLS Period: 3 years (quarterly) Price: All Construction Type: All Bedrooms: All Bathrooms: All Lot Size: All Property Types: Residential Sq Ft: All Cities: San Francisco Clarus MarketMetrics® 1 of 2 10/28/2011 Information not guaranteed. © 2009-2010 Terradatum and its suppliers and licensors (www.terradatum.com/about/licensors.td). 1 of 18
  • 2. Ronny Budiutama Intero Real Estate Median Sold Price by Quarter Q3 2008 vs. Q3 2011: The median sold price is down 15% Time Period Median Price # Units Average DOM Q3 2011 701,000 603 62 Q2 2011 720,000 680 62 Q1 2011 664,000 494 71 Q4 2010 728,000 615 60 Q3 2010 730,000 577 58 Q2 2010 775,000 671 54 Q1 2010 735,000 467 61 Q4 2009 769,000 649 57 Q3 2009 739,000 651 58 Q2 2009 750,000 557 65 Q1 2009 652,000 333 62 Q4 2008 725,000 481 57 Q3 2008 820,000 619 52 Clarus MarketMetrics® 2 of 2 10/28/2011 Information not guaranteed. © 2009-2010 Terradatum and its suppliers and licensors (www.terradatum.com/about/licensors.td). 2 of 18
  • 3. Ronny Budiutama Intero Real Estate Median For Sale vs. Median Sold Q3 08 vs. Q3 11: The median price of for sale properties is down 15% and the median price of sold properties is down 15% Q3 2008 vs. Q3 2011 Q3 2008 vs. Q3 2011 Q3 2008 Q3 2011 Change % Q3 2008 Q3 2011 Change % 799,000 680,000 -119,000 -15% 820,000 701,000 -119,000 -15% MLS: SFMLS Period: 3 years (quarterly) Price: All Construction Type: All Bedrooms: All Bathrooms: All Lot Size: All Property Types: Residential Sq Ft: All Cities: San Francisco Clarus MarketMetrics® 1 of 2 10/28/2011 Information not guaranteed. © 2009-2010 Terradatum and its suppliers and licensors (www.terradatum.com/about/licensors.td). 3 of 18
  • 4. Ronny Budiutama Intero Real Estate Median For Sale vs. Median Sold Q3 08 vs. Q3 11: The median price of for sale properties is down 15% and the median price of sold properties is down 15% For Sale # Properties Sold # Properties Price Time Period Median For Sale Median Sold Difference Q3 2011 680,000 1,649 701,000 603 21,000 Q2 2011 699,000 1,530 720,000 680 21,000 Q1 2011 675,950 1,383 664,000 494 -11,950 Q4 2010 699,000 1,448 728,000 615 29,000 Q3 2010 729,000 1,769 730,000 577 1,000 Q2 2010 749,000 1,657 775,000 671 26,000 Q1 2010 758,000 1,339 735,000 467 -23,000 Q4 2009 769,000 1,232 769,000 649 0 Q3 2009 795,000 1,552 739,000 651 -56,000 Q2 2009 799,000 1,594 750,000 557 -49,000 Q1 2009 788,000 1,336 652,000 333 -136,000 Q4 2008 788,000 1,336 725,000 481 -63,000 Q3 2008 799,000 1,601 820,000 619 21,000 Clarus MarketMetrics® 2 of 2 10/28/2011 Information not guaranteed. © 2009-2010 Terradatum and its suppliers and licensors (www.terradatum.com/about/licensors.td). 4 of 18
  • 5. Ronny Budiutama Intero Real Estate Sold Properties by Quarter Q3 2008 vs. Q3 2011: The number of Sold properties is down 3% Q3 2008 vs. Q3 2011 Q3 2008 Q3 2011 Change % 619 603 -16 -3% MLS: SFMLS Period: 3 years (quarterly) Price: All Construction Type: All Bedrooms: All Bathrooms: All Lot Size: All Property Types: Residential Sq Ft: All Cities: San Francisco Clarus MarketMetrics® 1 of 2 10/28/2011 Information not guaranteed. © 2009-2010 Terradatum and its suppliers and licensors (www.terradatum.com/about/licensors.td). 5 of 18
  • 6. Ronny Budiutama Intero Real Estate Sold Properties by Quarter Q3 2008 vs. Q3 2011: The number of Sold properties is down 3% Full Market Bank Properties Non-Bank Properties Time Period # Properties Median Price Average DOM # Properties % Bank Median Price # Properties % Non-Bank Median Price Q3 2011 603 701,000 62 119 19.7 450,000 484 80.3 788,500 Q2 2011 680 720,000 62 131 19.3 450,000 549 80.7 782,500 Q1 2011 494 664,000 71 120 24.3 450,000 374 75.7 740,050 Q4 2010 615 728,000 60 95 15.4 480,000 520 84.5 785,000 Q3 2010 577 730,000 58 105 18.2 460,000 472 81.8 787,000 Q2 2010 671 775,000 54 123 18.3 520,000 548 81.7 837,500 Q1 2010 467 735,000 61 113 24.2 501,000 354 75.8 789,500 Q4 2009 649 769,000 57 111 17.1 485,000 538 82.9 819,250 Q3 2009 651 739,000 58 136 20.9 518,150 515 79.1 805,000 Q2 2009 557 750,000 65 104 18.7 467,500 453 81.3 805,000 Q1 2009 333 652,000 62 104 31.2 501,500 229 68.8 795,000 Q4 2008 481 725,000 57 87 18.1 508,800 394 81.9 798,250 Q3 2008 619 820,000 52 17 2.8 525,000 602 97.2 825,000 Clarus MarketMetrics® 2 of 2 10/28/2011 Information not guaranteed. © 2009-2010 Terradatum and its suppliers and licensors (www.terradatum.com/about/licensors.td). 6 of 18
  • 7. Ronny Budiutama Intero Real Estate Under Contract Properties by Quarter Q3 2008 vs. Q3 2011: The number of Under Contract properties is up 21% Q3 2008 vs. Q3 2011 Q3 2008 Q3 2011 Change % 568 685 117 +21% MLS: SFMLS Period: 3 years (quarterly) Price: All Construction Type: All Bedrooms: All Bathrooms: All Lot Size: All Property Types: Residential Sq Ft: All Cities: San Francisco Clarus MarketMetrics® 1 of 2 10/28/2011 Information not guaranteed. © 2009-2010 Terradatum and its suppliers and licensors (www.terradatum.com/about/licensors.td). 7 of 18
  • 8. Ronny Budiutama Intero Real Estate Under Contract Properties by Quarter Q3 2008 vs. Q3 2011: The number of Under Contract properties is up 21% Full Market Bank Properties Non-Bank Properties Time Period # Properties Median Price Average DOM # Properties % Bank Median Price # Properties % Non-Bank Median Price Q3 2011 685 659,000 58 150 21.9 427,000 535 78.1 749,000 Q2 2011 681 699,999 59 124 18.2 450,102 557 81.8 795,000 Q1 2011 578 689,444 70 161 27.9 443,700 417 72.2 790,000 Q4 2010 559 699,000 68 102 18.2 460,400 457 81.8 749,000 Q3 2010 590 719,250 60 113 19.1 468,000 477 80.8 779,000 Q2 2010 681 749,000 56 120 17.6 462,200 561 82.4 799,000 Q1 2010 543 750,000 53 116 21.4 461,610 427 78.6 799,000 Q4 2009 548 747,000 62 112 20.4 452,670 436 79.6 799,000 Q3 2009 634 716,944 58 126 19.9 499,450 508 80.1 799,000 Q2 2009 665 778,000 63 123 18.5 475,000 542 81.5 839,000 Q1 2009 413 688,000 68 118 28.6 473,700 295 71.4 785,000 Q4 2008 400 699,000 64 100 25.0 504,000 300 75.0 799,000 Q3 2008 568 788,000 50 52 9.2 499,450 516 90.8 799,000 Clarus MarketMetrics® 2 of 2 10/28/2011 Information not guaranteed. © 2009-2010 Terradatum and its suppliers and licensors (www.terradatum.com/about/licensors.td). 8 of 18
  • 9. Ronny Budiutama Intero Real Estate New Properties by Quarter Q3 2008 vs. Q3 2011: The number of New properties is up 5% Q3 2008 vs. Q3 2011 Q3 2008 Q3 2011 Change % 966 1,010 44 +5% MLS: SFMLS Period: 3 years (quarterly) Price: All Construction Type: All Bedrooms: All Bathrooms: All Lot Size: All Property Types: Residential Sq Ft: All Cities: San Francisco Clarus MarketMetrics® 1 of 2 10/28/2011 Information not guaranteed. © 2009-2010 Terradatum and its suppliers and licensors (www.terradatum.com/about/licensors.td). 9 of 18
  • 10. Ronny Budiutama Intero Real Estate New Properties by Quarter Q3 2008 vs. Q3 2011: The number of New properties is up 5% Full Market Bank Properties Non-Bank Properties Time Period # Properties Median Price # Properties % Bank Median Price # Properties % Non-Bank Median Price Q3 2011 1,010 699,000 192 19.0 477,500 818 81.0 759,000 Q2 2011 919 699,500 184 20.0 436,678 735 80.0 799,000 Q1 2011 905 695,000 216 23.9 450,000 689 76.1 789,000 Q4 2010 621 679,000 154 24.8 456,950 467 75.2 768,000 Q3 2010 1,051 720,000 180 17.1 459,450 871 82.9 775,000 Q2 2010 1,050 749,000 190 18.1 461,700 860 81.9 799,000 Q1 2010 946 769,000 185 19.6 515,000 761 80.4 819,000 Q4 2009 592 729,000 149 25.2 450,000 443 74.8 799,000 Q3 2009 882 777,000 153 17.4 497,000 729 82.7 839,000 Q2 2009 927 785,000 186 20.1 498,950 741 79.9 879,000 Q1 2009 841 799,000 181 21.5 489,900 660 78.5 895,000 Q4 2008 616 759,500 153 24.8 499,900 463 75.2 890,000 Q3 2008 966 799,974 148 15.3 499,000 818 84.7 875,000 Clarus MarketMetrics® 2 of 2 10/28/2011 Information not guaranteed. © 2009-2010 Terradatum and its suppliers and licensors (www.terradatum.com/about/licensors.td). 10 of 18
  • 11. Ronny Budiutama Intero Real Estate For Sale Properties by Quarter Q3 2008 vs. Q3 2011: The number of For Sale properties is up 3% Q3 2008 vs. Q3 2011 Q3 2008 Q3 2011 Change % 1,601 1,649 48 +3% MLS: SFMLS Period: 3 years (quarterly) Price: All Construction Type: All Bedrooms: All Bathrooms: All Lot Size: All Property Types: Residential Sq Ft: All Cities: San Francisco Clarus MarketMetrics® 1 of 2 10/28/2011 Information not guaranteed. © 2009-2010 Terradatum and its suppliers and licensors (www.terradatum.com/about/licensors.td). 11 of 18
  • 12. Ronny Budiutama Intero Real Estate For Sale Properties by Quarter Q3 2008 vs. Q3 2011: The number of For Sale properties is up 3% Full Market Bank Properties Non-Bank Properties Time Period # Properties Median Price Average DOM # Properties % Bank Median Price # Properties % Non-Bank Median Price Q3 2011 1,649 680,000 65 374 22.7 459,000 1,275 77.3 759,000 Q2 2011 1,530 699,000 67 350 22.9 449,000 1,180 77.1 795,000 Q1 2011 1,383 675,950 74 376 27.2 449,700 1,007 72.8 788,000 Q4 2010 1,448 699,000 86 322 22.2 450,000 1,126 77.8 775,000 Q3 2010 1,769 729,000 68 347 19.6 460,000 1,422 80.4 799,000 Q2 2010 1,657 749,000 63 344 20.8 469,482 1,313 79.2 830,000 Q1 2010 1,339 758,000 64 310 23.1 476,500 1,029 76.8 849,000 Q4 2009 1,232 769,000 80 285 23.1 469,900 947 76.9 868,888 Q3 2009 1,552 795,000 67 315 20.3 499,000 1,237 79.7 879,000 Q2 2009 1,594 799,000 68 345 21.6 499,000 1,249 78.4 899,000 Q1 2009 1,336 788,000 75 331 24.8 490,000 1,005 75.2 895,000 Q4 2008 1,336 788,000 84 305 22.8 499,900 1,031 77.2 897,000 Q3 2008 1,601 799,000 65 222 13.9 512,450 1,379 86.1 849,000 Clarus MarketMetrics® 2 of 2 10/28/2011 Information not guaranteed. © 2009-2010 Terradatum and its suppliers and licensors (www.terradatum.com/about/licensors.td). 12 of 18
  • 13. Ronny Budiutama Intero Real Estate Expired Properties by Quarter Q3 2008 vs. Q3 2011: The number of Expired properties is down 12% Q3 2008 vs. Q3 2011 Q3 2008 Q3 2011 Change % 313 277 -36 -12% MLS: SFMLS Period: 3 years (quarterly) Price: All Construction Type: All Bedrooms: All Bathrooms: All Lot Size: All Property Types: Residential Sq Ft: All Cities: San Francisco Clarus MarketMetrics® 1 of 2 10/28/2011 Information not guaranteed. © 2009-2010 Terradatum and its suppliers and licensors (www.terradatum.com/about/licensors.td). 13 of 18
  • 14. Ronny Budiutama Intero Real Estate Expired Properties by Quarter Q3 2008 vs. Q3 2011: The number of Expired properties is down 12% Full Market Bank Properties Non-Bank Properties Time Period # Properties Median Price Average DOM # Properties % Bank Median Price # Properties % Non-Bank Median Price Q3 2011 277 699,000 96 65 23.5 435,000 212 76.5 798,500 Q2 2011 210 749,000 110 44 20.9 425,000 166 79.0 809,500 Q1 2011 194 672,500 114 49 25.3 460,000 145 74.7 789,000 Q4 2010 411 749,000 108 60 14.6 462,500 351 85.4 799,000 Q3 2010 352 799,000 99 66 18.8 499,000 286 81.2 849,000 Q2 2010 258 749,250 89 57 22.1 478,000 201 77.9 875,000 Q1 2010 189 799,000 106 40 21.2 525,000 149 78.8 879,000 Q4 2009 291 959,000 102 48 16.5 512,750 243 83.5 1,095,000 Q3 2009 278 877,000 101 53 19.1 499,000 225 80.9 979,950 Q2 2009 259 974,500 102 60 23.2 567,450 199 76.8 1,098,000 Q1 2009 256 799,000 106 54 21.1 507,450 202 78.9 889,000 Q4 2008 441 949,000 97 55 12.5 524,000 386 87.5 999,000 Q3 2008 313 849,950 95 18 5.8 640,500 295 94.2 870,000 Clarus MarketMetrics® 2 of 2 10/28/2011 Information not guaranteed. © 2009-2010 Terradatum and its suppliers and licensors (www.terradatum.com/about/licensors.td). 14 of 18
  • 15. Ronny Budiutama Intero Real Estate Supply & Demand by Quarter Q3 2008 vs. Q3 2011: The number of for sale properties is up 3% and the number of sold properties is down 3% Q3 2008 vs. Q3 2011 Q3 2008 vs. Q3 2011 Q3 2008 Q3 2011 Change % Q3 2008 Q3 2011 Change % 1,601 1,649 48 +3% 619 603 -16 -3% MLS: SFMLS Period: 3 years (quarterly) Price: All Construction Type: All Bedrooms: All Bathrooms: All Lot Size: All Property Types: Residential Sq Ft: All Cities: San Francisco Clarus MarketMetrics® 1 of 2 10/28/2011 Information not guaranteed. © 2009-2010 Terradatum and its suppliers and licensors (www.terradatum.com/about/licensors.td). 15 of 18
  • 16. Ronny Budiutama Intero Real Estate Supply & Demand by Quarter Q3 2008 vs. Q3 2011: The number of for sale properties is up 3% and the number of sold properties is down 3% # Properties Average DOM # Properties Average DOM Time Period For Sale For Sale Sold Sold Q3 2011 1,649 65 603 62 Q2 2011 1,530 67 680 62 Q1 2011 1,383 74 494 71 Q4 2010 1,448 86 615 60 Q3 2010 1,769 68 577 58 Q2 2010 1,657 63 671 54 Q1 2010 1,339 64 467 61 Q4 2009 1,232 80 649 57 Q3 2009 1,552 67 651 58 Q2 2009 1,594 68 557 65 Q1 2009 1,336 75 333 62 Q4 2008 1,336 84 481 57 Q3 2008 1,601 65 619 52 Clarus MarketMetrics® 2 of 2 10/28/2011 Information not guaranteed. © 2009-2010 Terradatum and its suppliers and licensors (www.terradatum.com/about/licensors.td). 16 of 18
  • 17. Ronny Budiutama Intero Real Estate The Average Days on Market by Quarter Q3 2008 vs. Q3 2011: The average days on market is up 14% Q3 2008 vs. Q3 2011 Q3 2008 Q3 2011 Change % 50 58 7 +14% MLS: SFMLS Period: 3 years (quarterly) Price: All Construction Type: All Bedrooms: All Bathrooms: All Lot Size: All Property Types: Residential Sq Ft: All Cities: San Francisco Clarus MarketMetrics® 1 of 2 10/28/2011 Information not guaranteed. © 2009-2010 Terradatum and its suppliers and licensors (www.terradatum.com/about/licensors.td). 17 of 18
  • 18. Ronny Budiutama Intero Real Estate The Average Days on Market by Quarter Q3 2008 vs. Q3 2011: The average days on market is up 14% Time Period Average DOM # UC Units Q3 2011 58 685 Q2 2011 59 681 Q1 2011 70 578 Q4 2010 68 559 Q3 2010 60 590 Q2 2010 56 681 Q1 2010 53 543 Q4 2009 62 548 Q3 2009 58 634 Q2 2009 63 665 Q1 2009 68 413 Q4 2008 64 400 Q3 2008 50 568 Clarus MarketMetrics® 2 of 2 10/28/2011 Information not guaranteed. © 2009-2010 Terradatum and its suppliers and licensors (www.terradatum.com/about/licensors.td). 18 of 18