SlideShare uma empresa Scribd logo
1 de 9
Baixar para ler offline
North Dakota Trading Relationships -- 2004 - 2010                                                                                                                                                     Mexico
                                                                                                                                                                                                             Domestic
                                                                                                                                                                                                              Canada


                                                                                                                                                             2009-2010 2009-2010       2004-2010 2004-2010
                                                                   2004          2005        2006          2007          2008          2009          2010    Difference % Change       Difference % Change
Mexico
Truck            Exports                                      $4,387,396    $8,775,652 $8,226,108    $10,517,022   $15,066,483   $21,627,331   $22,112,644   $485,313          2.2% $17,725,248     404.0%
                 Imports                                     $45,495,030   $79,271,601 $43,006,575   $48,687,416   $32,729,456   $35,959,934   $45,760,804 $9,800,870         27.3%    $265,774       0.6%
                 Total Truck Trade with Mexico               $49,882,426   $88,047,253 $51,232,683   $59,204,438   $47,795,939   $57,587,265   $67,873,448 $10,286,183        17.9% $17,991,022      36.1%
                                                                                                                                                                           #DIV/0!
Rail             Exports                                     $42,435,097   $40,051,205 $41,579,461 $109,222,732 $182,389,151 $170,410,478 $135,390,542 -$35,019,936          -20.6% $92,955,445     219.1%
                 Imports                                       $307,860      $882,176    $172,424     $564,416    $5,368,709    $220,006    $1,074,652    $854,646          388.5%     $766,792     249.1%
                 Total Rail Trade with Mexico                $42,742,957   $40,933,381 $41,751,885 $109,787,148 $187,757,860 $170,630,484 $136,465,194 -$34,165,290          -20.0% $93,722,237     219.3%
                                                                                                                                                                           #DIV/0!
TOTAL            Exports                                     $46,822,493 $48,826,857 $49,805,569 $119,739,754 $197,455,634 $192,037,809 $157,503,186 -$34,534,623            -18.0% $110,680,693    236.4%
                 Imports                                     $45,802,890 $80,153,777 $43,178,999 $49,251,832 $38,098,165 $36,179,940 $46,835,456 $10,655,516                  29.5%   $1,032,566      2.3%
                 Total Trade with Mexico                     $92,625,383 $128,980,634 $92,984,568 $168,991,586 $235,553,799 $228,217,749 $204,338,642 -$23,879,107           -10.5% $111,713,259    120.6%


Laredo, TX

Truck            Exports                                $3,187,304          $5,973,721 $6,405,656     $9,012,291   $11,078,263   $18,959,660   $17,595,902   -$1,363,758      -7.2%   $14,408,598   452.1%
                           % of Total Exports to Mexico      72.6%              68.1%       77.9%         85.7%         73.5%         87.7%         79.6%                     -8.1%                   6.9%
                 Imports                               $13,211,603         $54,483,352 $42,539,226   $41,144,291   $27,872,272   $33,060,650   $35,455,480   $2,394,830        7.2%   $22,243,877   168.4%
                          % of Total Imports to Mexico       29.0%              68.7%       98.9%         84.5%         85.2%         91.9%         77.5%                    -14.5%                  48.4%
                 Total Truck Trade Thru Laredo          $16,398,907        $60,457,073 $48,944,882   $50,156,582   $38,950,535   $52,020,310   $53,051,382   $1,031,072        2.0%   $36,652,475   223.5%
                            % Total Trade with Mexico        32.9%              68.7%       95.5%         84.7%         81.5%         90.3%         78.2%                    -12.2%                  45.3%

Rail             Exports                               $17,285,274         $24,394,111 $17,432,331   $38,073,340   $72,562,683   $32,496,362   $15,184,384 -$17,311,978     -53.3%    -$2,100,890   -12.2%
                           % of Total Exports to Mexico      40.7%              60.9%       41.9%         34.9%         39.8%         19.1%         11.2%                    -7.9%                  -29.5%
                 Imports                                  $251,976           $882,176    $172,424      $312,570      $407,282      $220,006      $978,120     $758,114      344.6%      $726,144    288.2%
                          % of Total Imports to Mexico       81.8%             100.0%      100.0%         55.4%          7.6%        100.0%         91.0%                    -9.0%                    9.2%
                 Total Rail Trade Thru Laredo           $17,537,250        $25,276,287 $17,604,755   $38,385,910   $72,969,965   $32,716,368   $16,162,504 -$16,553,864     -50.6%    -$1,374,746    -7.8%
                             % Total Trade with Mexico       41.0%              61.7%       42.2%         35.0%         38.9%         19.2%         11.8%                    -7.3%                  -29.2%

TOTAL
                 Exports                               $20,472,578         $30,367,832 $23,837,987   $47,085,631 $83,640,946     $51,456,022   $32,780,286 -$18,675,736      -36.3%   $12,307,708    60.1%
                           % of Total Exports to Mexico      43.7%              62.2%       47.9%         39.3%        42.4%          26.8%         20.8%                     -6.0%                 -22.9%
                 Imports                               $13,463,579         $55,365,528 $42,711,650   $41,456,861 $28,279,554     $33,280,656   $36,433,600 $3,152,944          9.5%   $22,970,021   170.6%
                          % of Total Imports to Mexico       29.4%              69.1%       98.9%         84.2%        74.2%          92.0%         77.8%                    -14.2%                  48.4%
                 Total Trade Thru Laredo                $33,936,157        $85,733,360 $66,549,637   $88,542,492 $111,920,500    $84,736,678   $69,213,886 -$15,522,792      -18.3%   $35,277,729   104.0%
                            % Total Trade with Mexico        36.6%              66.5%       71.6%         52.4%        47.5%          37.1%         33.9%                     -3.3%                  -2.8%
North Dakota Trading Relationships -- 2004 - 2010                                                                                                                                                     Mexico
                                                                                                                                                                                                            Domestic
                                                                                                                                                                                                             Canada


Eagle Pass, TX


Truck            Exports                                      $359,611      $402,363    $852,033       $35,970       $12,328            $0     $109,734     $109,734    #DIV/0!      -$249,877     -69.5%
                           % of Total Exports to Mexico           8.2%          4.6%      10.4%          0.3%          0.1%          0.0%         0.5%                      0.5%                    -7.7%
                 Imports                                    $2,668,178     $3,253,472         $0            $0            $0            $0           $0           $0    #DIV/0!    -$2,668,178    -100.0%
                          % of Total Imports to Mexico            5.9%          4.1%       0.0%          0.0%          0.0%          0.0%         0.0%                      0.0%                    -5.9%
                 Total Truck Trade Thru Eagle Pass           $8,687,358    $3,655,835   $852,033       $35,970       $12,328            $0     $109,734     $109,734    #DIV/0!    -$2,918,055     -98.7%
                            % Total Trade with Mexico            17.4%          4.2%       1.7%          0.1%          0.0%          0.0%         0.2%                      0.2%                   -17.3%

Rail             Exports                               $12,267,723         $8,256,437 $15,851,694   $25,701,736   $79,858,514 $114,741,917   $97,764,967 -$16,976,950     -14.8%   $85,497,244    696.9%
                           % of Total Exports to Mexico      28.9%             20.6%       38.1%         23.5%         43.8%        67.3%         72.2%                     4.9%                   43.3%
                 Imports                                   $55,884                 $0          $0            $0    $1,701,920           $0       $33,436      $33,436   #DIV/0!       -$22,448    -40.2%
                          % of Total Imports to Mexico        0.0%              0.0%        0.0%          0.0%         31.7%         0.0%          3.1%                     3.1%                    3.1%
                 Total Rail Trade Thru Eagle Pass       $12,323,607        $8,256,437 $15,851,694   $25,701,736   $81,560,434 $114,741,917   $97,798,403 -$16,943,514     -14.8%   $85,474,796    693.6%
                             % Total Trade with Mexico       28.8%             20.2%       38.0%         23.4%         43.4%        67.2%         71.7%                     4.4%                   42.8%

TOTAL
                 Exports                               $12,627,334         $8,658,800 $16,703,727   $25,737,706   $79,870,842 $114,741,917   $97,874,701 -$16,867,216     -14.7%   $85,247,367    675.1%
                           % of Total Exports to Mexico      27.0%             17.7%       33.5%         21.5%         40.5%        59.7%         62.1%                     2.4%                   35.2%
                 Imports                                $2,724,062         $3,253,472          $0            $0    $1,701,920           $0       $33,436      $33,436   #DIV/0!    -$2,690,626    -98.8%
                          % of Total Imports to Mexico        5.9%              4.1%        0.0%          0.0%          4.5%         0.0%          0.1%                     0.1%                   -5.9%
                 Total Trade Thru Eagle Pass            $15,351,396       $11,912,272 $16,703,727   $25,737,706   $81,572,762 $114,741,917   $97,908,137 -$16,833,780     -14.7%   $82,556,741    537.8%
                            % Total Trade with Mexico        16.6%              9.2%       18.0%         15.2%         34.6%        50.3%         47.9%                    -2.4%                   31.3%

Del Rio, TX

Truck            Exports                                            $0             $0          $0     $211,815             $0           $0            $0          $0    #DIV/0!            $0    #DIV/0!
                           % of Total Exports to Mexico           0.0%          0.0%        0.0%         2.0%           0.0%         0.0%          0.0%                     0.0%                     0.0%
                 Imports                                            $0             $0          $0           $0             $0           $0            $0          $0    #DIV/0!            $0    #DIV/0!
                          % of Total Imports to Mexico            0.0%            0%        0.0%         0.0%           0.0%         0.0%          0.0%                     0.0%                     0.0%
                 Total Truck Trade Thru Del Rio                      $0            $0          $0     $211,815             $0           $0            $0          $0    #DIV/0!            $0    #DIV/0!
                            % Total Trade with Mexico             0.0%          0.0%        0.0%         0.4%           0.0%         0.0%          0.0%                     0.0%                     0.0%

Rail             Exports                                            $0             $0                                                                             $0    #DIV/0!            $0    #DIV/0!
                           % of Total Exports to Mexico           0.0%          0.0%                 #DIV/0!       #DIV/0!      #DIV/0!       #DIV/0!                   #DIV/0!                  #DIV/0!
                 Imports                                            $0             $0                                                                             $0    #DIV/0!            $0    #DIV/0!
                          % of Total Imports to Mexico            0.0%          0.0%                 #DIV/0!       #DIV/0!      #DIV/0!       #DIV/0!                   #DIV/0!                  #DIV/0!
                 Total Rail Trade Thru Del Rio                       $0            $0                                                                             $0    #DIV/0!            $0    #DIV/0!
                             % Total Trade with Mexico            0.0%          0.0%                      0.0%          0.0%         0.0%          0.0%                     0.0%                     0.0%

TOTAL
                 Exports                                            $0             $0          $0     $211,815             $0           $0            $0          $0    #DIV/0!            $0    #DIV/0!
                           % of Total Exports to Mexico           0.0%          0.0%        0.0%         0.2%           0.0%         0.0%          0.0%                     0.0%                     0.0%
                 Imports                                            $0             $0          $0           $0             $0           $0            $0          $0    #DIV/0!            $0    #DIV/0!
                          % of Total Imports to Mexico            0.0%          0.0%        0.0%         0.0%           0.0%         0.0%          0.0%                     0.0%                     0.0%
                 Total Trade Thru Del Rio                            $0            $0          $0     $211,815             $0           $0            $0          $0    #DIV/0!            $0    #DIV/0!
                            % Total Trade with Mexico             0.0%          0.0%        0.0%         0.1%           0.0%         0.0%          0.0%                     0.0%                     0.0%
North Dakota Trading Relationships -- 2004 - 2010                                                                                                                                              Mexico
                                                                                                                                                                                                     Domestic
                                                                                                                                                                                                      Canada


GPITC

Truck           Exports                                $3,546,915     $6,376,084 $7,257,689     $9,260,076   $11,090,591   $18,959,660   $17,705,636   -$1,254,024    -6.6%   $14,158,721   399.2%
                          % of Total Exports to Mexico      80.8%         72.7%       88.2%         88.0%         73.6%         87.7%         80.1%                   -7.6%                  -0.8%
                Imports                               $15,879,781    $57,736,824 $42,539,226   $41,144,291   $27,872,272   $33,060,650   $35,455,480   $2,394,830      7.2%   $19,575,699   123.3%
                         % of Total Imports to Mexico       34.9%         72.8%       98.9%         84.5%         85.2%         91.9%         77.5%                  -14.5%                  42.6%
                Total Truck Trade Thru GPITC           $19,426,696   $64,112,908 $49,796,915   $50,404,367   $38,962,863   $52,020,310   $53,161,116   $1,140,806      2.2%   $33,734,420   173.6%
                           % Total Trade with Mexico        38.9%         72.8%       97.2%         85.1%         81.5%         90.3%         78.3%                  -12.0%                  39.4%

Rail            Exports                               $29,552,997    $32,650,548 $33,284,025   $63,775,076 $152,421,197 $147,238,279 $112,949,351 -$34,288,928       -23.3%   $83,396,354   282.2%
                          % of Total Exports to Mexico      69.6%         81.5%       80.0%         58.4%        83.6%        86.4%        83.4%                      -3.0%                  13.8%
                Imports                                  $307,860      $882,176    $172,424      $312,570    $2,109,202    $220,006    $1,011,556    $791,550        359.8%     $703,696    228.6%
                         % of Total Imports to Mexico      100.0%        100.0%      100.0%         55.4%        39.3%       100.0%        94.1%                      -5.9%                  -5.9%
                Total Rail Trade Thru GPITC            $29,860,857   $33,532,724 $33,456,449   $64,087,646 $154,530,399 $147,458,285 $113,960,907 -$33,497,378       -22.7%   $84,100,050   281.6%
                            % Total Trade with Mexico       69.9%         81.9%       80.1%         58.4%        82.3%        86.4%        83.5%                      -2.9%                  13.6%

TOTAL
                Exports                               $33,099,912    $39,026,632 $40,541,714 $73,035,152 $163,511,788 $166,197,939 $130,654,987 -$35,542,952         -21.4% $97,555,075     294.7%
                          % of Total Exports to Mexico      70.7%         79.9%       81.4%        61.0%        82.8%        86.5%        83.0%                       -3.6%                  12.3%
                Imports                               $16,187,641    $58,619,000 $42,711,650 $41,456,861 $29,981,474 $33,280,656 $36,467,036 $3,186,380                9.6% $20,279,395     125.3%
                         % of Total Imports to Mexico       35.3%         73.1%       98.9%        84.2%        78.7%        92.0%        77.9%                      -14.1%                  42.5%
                Total Trade Thru GPITC                 $49,287,553   $97,645,632 $83,253,364 $114,492,013 $193,493,262 $199,478,595 $167,122,023 -$32,356,572        -16.2% $117,834,470    239.1%
                           % Total Trade with Mexico        53.2%         75.7%       89.5%        67.8%        82.1%        87.4%        81.8%                       -5.6%                  28.6%
North Dakota Trading Relationships -- 2004 - 2010                                                                                                                 Mexico
                                                                                                                                                                   Domestic
                                                                                                                                                                    Canada


2010         Leading Exports from North Dakota to Mexico (Surface         2010    2010        Leading Exports from North Dakota to Mexico (Surface         2010
             Transportation)

                                                                                              Transportation)
Rank                                                                     Export   Rank        Coahuila                                                    Export
1       11   Malts; Starches and Inulin                             $70,149,888      1   11   Malts; Starches and Inulin                             $17,921,004
2       10   Cereals                                                $26,780,551      2   10   Cereals                                                 $3,480,551
3       7    Edible Vegetables and Roots                            $14,669,437      3   85   Electrical Machinery; Equipment and Parts               $3,045,534
4       12   Oil Seeds and Oleaginous Fruits                        $10,891,275      4   84   Computer-Related Machinery and Parts                    $1,026,497
5       23   Food Residues and Waste                                 $8,269,966      5   23   Food Residues and Waste                                 $1,001,838
6       84   Computer-Related Machinery and Parts                    $6,779,692      6   90   Measuring and Testing Instruments                         $593,168
7       85   Electrical Machinery; Equipment and Parts               $4,469,196      7   39   Plastics and Articles                                       $9,800
8       15   Animal or Vegetable Fats and Oils                       $3,932,388      8    1   Live Animals                                                $5,000
9       48   Paper and Paperboard                                    $3,817,918      9   87   Vehicles Other than Railway                               4,500.00
10      39   Plastics and Articles                                   $3,395,156     10   82   Tools of Base Metal                                       3,150.00

 2010        Leading Imports to North Dakota from Mexico (Surface          2010   2010        Leading Exports from North Dakota to Mexico (Surface          2010
Rank                                                                     Import   Rank        Nuevo Leon                                                  Export
1       85   Electrical Machinery; Equipment and Parts              $23,608,009      1   11   Malts; Starches and Inulin                              $9,342,045
2       94   Furniture; Lamps and Prefabricated Buildings            $6,383,587      2   48   Paper and Paperboard                                    $3,805,419
3       84   Computer-Related Machinery and Parts                    $5,866,923      3   10   Cereals                                                 $3,691,887
4       87   Vehicles Other than Railway                             $5,036,799      4   39   Plastics and Articles                                   $2,818,869
5       98   Special Classification Provisions                       $1,786,094      5   84   Computer-Related Machinery and Parts                    $2,493,574
6       24   Tobacco and Manufactured Tobacco                        $1,602,856      6   85   Electrical Machinery; Equipment and Parts               $1,289,919
7       12   Oil Seeds and Oleaginous Fruits                         $1,145,433      7    7   Edible Vegetables and Roots                              $478,614
8       90   Measuring and Testing Instruments                        $563,649       8   90   Measuring and Testing Instruments                        $315,108
9       8    Edible Fruit and Nuts                                    $226,501       9   27   Mineral Fuels; Oils and Waxes                            $292,728
10      73   Articles of Iron and Steel                               $102,122      10   20   Preparations of Vegetables; Fruits and Nuts              $119,216

                                                                                  2010      Leading Exports from North Dakota to Mexico (Surface            2010
                                                                                  Rank      Tamaulipas                                                    Export
                                                                                     1   84 Computer-Related Machinery and Parts                        $27,143
                                                                                     2   87 Vehicles Other than Railway                                 7,648.00
                                                                                     3
                                                                                     4
                                                                                     5
                                                                                     6
                                                                                     7
                                                                                     8
                                                                                     9
                                                                                    10
North Dakota Trading Relationships -- 2004 - 2010                                                                                                     Mexico
                                                                                                                                                           Domestic
                                                                                                                                                            Canada


                                                                                                                                           Rail Truck
                                                                                                                                       Change Change
                                                                               Rail Truck          Domestic --                           2002-  2002-
        2002                         Domestic -- 2007                       Change Change                 2015                            2015   2015
Exports        Rail Truck            Exports               Rail Truck                           Exports          Rail   Truck
Colorado         0     39 4%         Colorado               38      0  2%     0%   -100%        Colorado          80      320   8%     #DIV/0!     722%
Montana          0    201 19%        Montana                 0    398 25% #DIV/0!    98%        Montana           43      411   9%     #DIV/0!     105%
Nebraska         0     72 7%         Nebraska                0    151 10% #DIV/0!   110%        Nebraska          69      181   5%     #DIV/0!     151%
New Mexico       0      0 0%         New Mexico             32      0  2% #DIV/0! #DIV/0!       New Mexico        40       46   2%     #DIV/0!   #DIV/0!
North Dakota                         North Dakota                                               North Dakota   376.95        0
Oklahoma         0    59    5%       Oklahoma                0       0   0% #DIV/0!    -100%    Oklahoma           4       74   2%     #DIV/0!      26%
South Dakota     0   513   48%       South Dakota            0     745 47% #DIV/0!       45%    South Dakota     -      1,791 37%      #DIV/0!     249%
Texas           47   137   17%       Texas                   0     285 18%   -100%      108%    Texas            904      332 26%       1823%      142%
Wyoming          0    12    1%       Wyoming                 0       0   0% #DIV/0!    -100%    Wyoming          -        118   2%     #DIV/0!     887%
Total ($m)      47 1,033             Total ($m)                  1,579 104%  -100%       53%    Total ($m)     1,516    3,274 100%      3126%      217%
                   1,080                                         1,579                   46%                            4,790                      344%

Imports        Rail Truck            Imports               Rail Truck                           Imports        Rail     Truck
Colorado         0      0 0%         Colorado                0    120  5% #DIV/0!     #DIV/0!   Colorado         -        123     4%   #DIV/0!   #DIV/0!
Montana          0     50 6%         Montana                73    195 11% #DIV/0!       290%    Montana            83     247    11%   #DIV/0!     395%
Nebraska         0    207 24%        Nebraska                0    358 15% #DIV/0!        73%    Nebraska            7     293    10%   #DIV/0!      42%
New Mexico       0      0 0%         New Mexico              0      0  0% #DIV/0!     #DIV/0!   New Mexico       -          0     0%   #DIV/0!   #DIV/0!
North Dakota                         North Dakota                                               North Dakota                       0
Oklahoma        24     91 13%        Oklahoma                0   184   8%  -100%        102%    Oklahoma           0       90     3%     -98%       -1%
South Dakota     1    199 23%        South Dakota            0   645 27%   -100%        224%    South Dakota     -      1,205    40%    -100%      505%
Texas            0    280 32%        Texas                   0   788 33% #DIV/0!        181%    Texas             35      879    30%   #DIV/0!     214%
Wyoming          0     12 1%         Wyoming                 0    44   2% #DIV/0!       267%    Wyoming            7       46     2%   #DIV/0!     284%
Total ($m)      25    839            Total ($m)             73 2,334 100%   192%        178%    Total ($m)       132    2,884   100%     429%      244%
                      864                                      2,407                    179%                            3,017                      249%

TOTALS         Rail Truck            TOTALS                Rail Truck                           TOTALS         Rail     Truck
Colorado         0     39 2%         Colorado               38    120  4% #DIV/0!       208%    Colorado           80     444     7%   #DIV/0!    1038%
Montana          0    251 13%        Montana                73    593 16% #DIV/0!       136%    Montana          126      658    11%   #DIV/0!     162%
Nebraska         0    279 14%        Nebraska                0    509 13% #DIV/0!        82%    Nebraska           76     474     7%   #DIV/0!      70%
New Mexico       0      0 0%         New Mexico             32      0  1% #DIV/0!     #DIV/0!   New Mexico         40      47     1%   #DIV/0!   #DIV/0!
North Dakota                         North Dakota                                               North Dakota                       0
Oklahoma        24   150    9%       Oklahoma                0   184   5%  -100%         23%    North Dakota       4      165     2%     -83%       10%
South Dakota     1   712   37%       South Dakota            0 1,390 34%   -100%         95%    Oklahoma         -      2,996    40%    -100%      321%
Texas           47   417   24%       Texas                   0 1,073 26%   -100%        157%    South Dakota     939    1,211    29%    1897%      190%
Wyoming          0    24    1%       Wyoming                 0    44   1% #DIV/0!        83%    Texas              7      165     2%   #DIV/0!     585%
Total ($m)      72 1,872             Total ($m)            143 3,913 100%    99%        109%    Total ($m)     1,272    6,159   100%   #DIV/0!     229%
                   1,944                                       4,056                    109%                            7,430                      282%
North Dakota Trading Relationships -- 2004 - 2010                                                                                                                                               Mexico
                                                                                                                                                                                                       Domestic
                                                                                                                                                                                                        Canada


                                                                                                                                                                           2009-2010 2009-2010      2004-2010 2004-2010
                                                                         2004           2005           2006           2007           2008           2009           2010    Difference % Change      Difference % Change
Canada
Truck             Exports                                     $352,617,295.00   $419,882,015   $595,428,470   $791,923,797 $1,179,135,819   $985,257,025 $1,142,298,099 $157,041,074      15.9%  $789,680,804      223.9%
                  Imports                                     $825,606,711.00   $870,171,453   $906,886,515 $1,064,836,721 $1,364,790,059 $1,074,904,397 $1,284,044,420 $209,140,023      19.5%  $458,437,709       55.5%
                  Total Truck Trade with Canada              $1,178,224,006.00 $1,290,053,468 $1,502,314,985 $1,856,760,518 $2,543,925,878 $2,060,161,422 $2,426,342,519 $366,181,097     17.8% $1,248,118,513     105.9%
                                                                                                                                                                                        #DIV/0!
Rail              Exports                                     $111,520,552.00   $112,464,759   $127,165,570   $201,483,095  $232,679,400     $245,614,622   $407,013,276 $161,398,654     65.7%  $295,492,724      265.0%
                  Imports                                     $240,870,374.00   $298,094,957   $352,127,200   $496,614,744  $964,355,727     $495,327,822   $538,977,593 $43,649,771        8.8% $298,107,219      123.8%
                  Total Rail Trade with Canada                $352,390,926.00   $410,559,716   $479,292,770   $698,097,839 $1,197,035,127    $740,942,444   $945,990,869 $205,048,425     27.7%   $593,599,943     168.4%
                                                                                                                                                                                        #DIV/0!
TOTAL             Exports                                     $464,137,847.00   $532,346,774   $722,594,040   $993,406,892 $1,411,815,219 $1,230,871,647 $1,549,311,375 $318,439,728      25.9% $1,085,173,528     233.8%
                  Imports                                    $1,066,477,085.00 $1,168,266,410 $1,259,013,715 $1,561,451,465 $2,329,145,786 $1,570,232,219 $1,823,022,013 $252,789,794     16.1%  $756,544,928       70.9%
                  Total Trade with Canada                    $1,530,614,932.00 $1,700,613,184 $1,981,607,755 $2,554,858,357 $3,740,961,005 $2,801,103,866 $3,372,333,388 $571,229,522     20.4% $1,841,718,456     120.3%


Raymond, MT

Truck             Exports                                         $1,240,512      $1,800,710     $2,235,444     $1,676,275     $3,434,217     $16,983,369     $5,346,106 -$11,637,263     -68.5%    $4,105,594     331.0%
                            % of Total Exports to Canada                0.4%           0.4%           0.4%           0.2%           0.3%            1.7%           0.5%                    -1.3%                     0.1%
                  Imports                                        $34,580,237     $55,738,064    $48,873,684    $79,564,584    $72,892,469     $38,712,238    $41,886,623   $3,174,385       8.2%    $7,306,386      21.1%
                           % of Total Imports to Canada                 4.2%           6.4%           5.4%           7.5%           5.3%            3.6%           3.3%                    -0.3%                    -0.9%
                  Total Truck Trade Thru Raymond                  $35,820,749    $57,538,774    $51,109,128    $81,240,859    $76,326,686     $55,695,607    $47,232,729 -$8,462,878      -15.2%   $11,411,980      31.9%
                             % Total Trade with Canada                  3.0%           4.5%           3.4%           4.4%           3.0%            2.7%           1.9%                    -0.8%                    -1.1%

Rail              Exports                                                 $0              $0                                                                                      $0    #DIV/0!            $0     #DIV/0!
                            % of Total Exports to Canada                0.0%           0.0%           0.0%            0.0%           0.0%           0.0%           0.0%                     0.0%                      0.0%
                  Imports                                                 $0              $0                                                                                      $0    #DIV/0!            $0     #DIV/0!
                           % of Total Imports to Canada                 0.0%           0.0%           0.0%            0.0%           0.0%           0.0%           0.0%                     0.0%                      0.0%
                  Total Truck Trade Thru Raymond                           $0             $0                             $0             $0             $0             $0          $0    #DIV/0!            $0     #DIV/0!
                             % Total Trade with Canada                  0.0%           0.0%           0.0%            0.0%           0.0%           0.0%           0.0%                     0.0%                      0.0%

TOTAL
                  Exports                                          $1,240,512     $1,800,710     $2,235,444     $1,676,275     $3,434,217     $16,983,369     $5,346,106 -$11,637,263     -68.5%    $4,105,594     331.0%
                            % of Total Exports to Canada                0.3%           0.3%           0.3%           0.2%           0.2%            1.4%           0.3%                    -1.0%                     0.1%
                  Imports                                         $34,580,237    $55,738,064    $48,873,684    $79,564,584    $72,892,469     $38,712,238    $41,886,623   $3,174,385       8.2%    $7,306,386      21.1%
                           % of Total Imports to Canada                 3.2%           4.8%           3.9%           5.1%           3.1%            2.5%           2.3%                    -0.2%                    -0.9%
                  Total Trade Thru Raymond                        $35,820,749    $57,538,774    $51,109,128    $81,240,859    $76,326,686     $55,695,607    $47,232,729 -$8,462,878      -15.2%   $11,411,980      31.9%
                             % Total Trade with Canada                  2.3%           3.4%           2.6%           3.2%           2.0%            2.0%           1.4%                    -0.6%                    -0.9%
North Dakota Trading Relationships -- 2004 - 2010                                                                                                                                          Mexico
                                                                                                                                                                                                 Domestic
                                                                                                                                                                                                  Canada


Sweetgrass, MT


Truck            Exports                                     $7,326,593      $5,696,813     $6,948,569    $10,235,884    $13,563,595    $10,665,250    $20,014,338    $9,349,088   87.7%     $12,687,745    173.2%
                           % of Total Exports to Canada            2.1%           1.4%           1.2%           1.3%           1.2%           1.1%           1.8%                   0.7%                     -0.3%
                 Imports                                     $10,219,204    $12,971,810    $12,298,527    $33,064,108    $52,943,493    $30,832,171    $61,217,106   $30,384,935   98.5%     $50,997,902    499.0%
                          % of Total Exports to Canada             1.2%           1.5%           1.4%           3.1%           3.9%           2.9%           4.8%                   1.9%                      3.5%
                 Total Truck Trade Thru Sweetgrass            17,545,797    $18,668,623    $19,247,096    $43,299,992    $66,507,088    $41,497,421    $81,231,444   $39,734,023   95.8%     $63,685,647    363.0%
                            % Total Trade with Canada              1.5%           1.4%           1.3%           2.3%           2.6%           2.0%           3.3%                   1.3%                      1.9%

Rail             Exports                                     $4,911,997      $3,792,971    $12,169,175    $18,743,569    $17,537,401    $17,869,850     $6,606,914 -$11,262,936    -63.0%     $1,694,917    34.5%
                           % of Total Exports to Canada            4.4%           3.4%           9.6%           9.3%           7.5%           7.3%           1.6%                   -5.7%                   -2.8%
                 Imports                                      $5,803,312     $4,795,417     $3,141,194     $2,673,782     $6,195,214     $5,459,822     $8,241,861   $2,782,039     51.0%     $2,438,549    42.0%
                          % of Total Exports to Canada             2.4%           1.6%           0.9%           0.5%           0.6%           1.1%           1.5%                    0.4%                   -0.9%
                 Total Rail Trade Thru Sweet Grass           $10,715,309     $8,588,388    $15,310,369    $21,417,351    $23,732,615    $23,329,672    $14,848,775 -$8,480,897     -36.4%     $4,133,466    38.6%
                             % Total Trade with Canada             3.0%           2.1%           3.2%           3.1%           2.0%           3.1%           1.6%                   -1.6%                   -1.5%

TOTAL
                 Exports                                     $12,238,590     $9,489,784    $19,117,744    $28,979,453    $31,100,996    $28,535,100    $26,621,252   -$1,913,848   -6.7%     $14,382,662    117.5%
                           % of Total Exports to Canada            2.6%           1.8%           2.6%           2.9%           2.2%           2.3%           1.7%                  -0.6%                     -0.9%
                 Imports                                     $16,022,516    $17,767,227    $15,439,721    $35,737,890    $59,138,707    $36,291,993    $69,458,967   $33,166,974   91.4%     $53,436,451    333.5%
                          % of Total Imports to Canada             1.5%           1.5%           1.2%           2.3%           2.5%           2.3%           3.8%                   1.5%                      2.3%
                 Total Trade Thru Sweet Grass                $28,261,106    $27,257,011    $34,557,465    $64,717,343    $90,239,703    $64,827,093    $96,080,219   $31,253,126   48.2%     $67,819,113    240.0%
                            % Total Trade with Canada              1.8%           1.6%           1.7%           2.5%           2.4%           2.3%           2.8%                   0.5%                      1.0%

Portal, ND

Truck            Exports                                     $86,828,752   $116,233,617   $188,724,374   $246,261,952   $357,392,062   $383,936,666   $496,627,326 $112,690,660    29.4%    $409,798,574    472.0%
                           % of Total Exports to Canada           24.6%          27.7%          31.7%          31.1%          30.3%          39.0%          43.5%                   4.5%                     18.9%
                 Imports                                    $126,385,029   $158,663,144   $196,457,991   $166,476,410   $323,527,624   $264,048,444   $347,985,655 $83,937,211     31.8%    $221,600,626    175.3%
                          % of Total Imports to Canada            15.3%          18.2%          21.7%          15.6%          23.7%          24.6%          27.1%                   2.5%                     11.8%
                 Total Truck Trade Thru Portal              $213,213,781   $274,896,761   $385,182,365   $412,738,362   $680,919,686   $647,985,110   $844,612,981 $196,627,871    30.3%    $631,399,200    296.1%
                            % Total Trade with Canada             18.1%          21.3%          25.6%          22.2%          26.8%          31.5%          34.8%                   3.4%                     16.7%

Rail             Exports                                     $63,595,039    $59,220,419    $59,544,101   $111,054,242    $89,927,676   $146,680,644   $315,941,225 $256,397,124    115.4%   $252,346,186    396.8%
                           % of Total Exports to Canada           57.0%          52.7%          46.8%          55.1%          38.6%          59.7%          77.6%                   17.9%                    20.6%
                 Imports                                    $142,132,619   $213,028,616   $262,741,465   $343,375,249   $706,705,264   $331,106,836   $334,464,345 $71,722,880       1.0%   $192,331,726    135.3%
                           % of Total Imports to Canada           59.0%          71.5%          74.6%          69.1%          73.3%          66.8%          62.1%                   -4.8%                     3.0%
                 Total Rail Trade Thru Portal               $205,727,658   $272,249,035   $322,285,566   $454,429,491   $796,632,940   $477,787,480   $650,405,570 $328,120,004     36.1%   $444,677,912    216.1%
                             % Total Trade with Canada            58.4%          66.3%          67.2%          65.1%          66.6%          64.5%          68.8%                    4.3%                    10.4%

TOTAL
                 Exports                                    $150,423,791   $175,454,036   $248,268,475   $357,316,194  $447,319,738   $530,617,310   $812,568,551 $281,951,241     53.1%  $662,144,760      440.2%
                           % of Total Exports to Canada           32.4%          33.0%          34.4%          36.0%          31.7%          43.1%          52.4%                   9.3%                     20.0%
                 Imports                                    $268,517,648   $371,691,760   $459,199,456   $509,851,659 $1,030,232,888  $595,155,280   $682,450,000 $87,294,720      14.7%  $413,932,352      154.2%
                          % of Total Imports to Canada            25.2%          31.8%          36.5%          32.7%          44.2%          37.9%          37.4%                  -0.5%                     12.3%
                 Total Trade Thru Portal                    $418,941,439   $547,145,796   $707,467,931   $867,167,853 $1,477,552,626 $1,125,772,590 $1,495,018,551 $369,245,961    32.8% $1,076,077,112     256.9%
                            % Total Trade with Canada             27.4%          32.2%          35.7%          33.9%          39.5%          40.2%          44.3%                   4.1%                     17.0%
North Dakota Trading Relationships -- 2004 - 2010                                                                                                                                           Mexico
                                                                                                                                                                                                  Domestic
                                                                                                                                                                                                   Canada


Wild Horse
                                                                      0
Truck            Exports                                             $0             $0             $0             $0             $0             $0             $0           $0    #DIV/0!             $0     #DIV/0!
                           % of Total Exports to Canada           0.0%           0.0%           0.0%          19.4%           0.0%           0.0%           0.0%                      0.0%                       0.0%
                 Imports                                        $23,762       $100,659       $112,331       $220,824       $179,929       $800,471        $11,407     -$789,064     -98.6%       -$12,355      -52.0%
                          % of Total Imports to Canada            0.0%           0.0%           0.0%          19.0%           0.0%           0.1%           0.0%                     -0.1%                       0.0%
                 Total Truck Trade Thru GPITC                   $23,762       $100,659       $112,331       $220,824       $179,929       $800,471        $11,407     -$789,064     -98.6%       -$12,355      -52.0%
                            % Total Trade with Canada             0.0%           0.0%           0.0%          19.3%           0.0%           0.0%           0.0%                      0.0%                       0.0%

Rail             Exports                                                                                                          $0                                        $0    #DIV/0!             $0     #DIV/0!
                           % of Total Exports to Canada            0.0%           0.0%           0.0%          11.0%           0.0%           0.0%           0.0%                     0.0%                       0.0%
                 Imports                                                                                                          $0                                        $0    #DIV/0!             $0     #DIV/0!
                           % of Total Imports to Canada            0.0%           0.0%           0.0%          22.4%           0.0%           0.0%           0.0%                     0.0%                       0.0%
                 Total Rail Trade Thru GPITC                          $0             $0             $0             $0             $0             $0             $0          $0    #DIV/0!             $0     #DIV/0!
                             % Total Trade with Canada             0.0%           0.0%           0.0%          17.7%           0.0%           0.0%           0.0%                     0.0%                       0.0%

TOTAL
                 Exports                                             $0             $0             $0             $0             $0             $0             $0           $0    #DIV/0!             $0     #DIV/0!
                           % of Total Exports to Canada           0.0%           0.0%           0.0%           0.0%           0.0%           0.0%           0.0%                      0.0%                       0.0%
                 Imports                                        $23,762       $100,659       $112,331       $220,824       $179,929       $800,471        $11,407     -$789,064     -98.6%       -$12,355      -52.0%
                          % of Total Imports to Canada            0.0%           0.0%           0.0%           0.0%           0.0%           0.1%           0.0%                     -0.1%                       0.0%
                 Total Trade Thru GPITC                         $23,762       $100,659       $112,331       $220,824       $179,929       $800,471        $11,407     -$789,064     -98.6%       -$12,355      -52.0%
                            % Total Trade with Canada             0.0%           0.0%           0.0%           0.0%           0.0%           0.0%           0.0%                      0.0%                       0.0%

GPITC
                                                            #DIV/0!
Truck            Exports                                     $95,395,857   $123,731,140   $197,908,387   $258,174,111   $374,389,874   $411,585,285   $521,987,770 $110,402,485     26.8%    $426,591,913     447.2%
                           % of Total Exports to Canada           27.1%          29.5%          33.2%          32.6%          31.8%          41.8%          45.7%                    3.9%                      18.6%
                 Imports                                    $137,868,507   $173,536,323   $211,104,293   $201,437,617   $380,085,263   $312,664,455   $414,560,274 $101,895,819     32.6%    $276,691,767     200.7%
                          % of Total Imports to Canada            16.7%          19.9%          23.3%          18.9%          27.8%          29.1%          32.3%                    3.2%                      15.6%
                 Total Truck Trade Thru GPITC               $233,264,364   $297,267,463   $409,012,680   $459,611,728   $754,475,137   $724,249,740   $936,548,044 $212,298,304     29.3%    $703,283,680     301.5%
                            % Total Trade with Canada             19.8%          23.0%          27.2%          24.8%          29.7%          35.2%          38.6%                    3.4%                      18.8%

Rail             Exports                                     $68,507,036    $63,013,390    $71,713,276   $129,797,811   $107,465,077   $164,550,494   $322,548,139 $157,997,645     96.0%    $254,041,103     370.8%
                           % of Total Exports to Canada           19.4%          15.0%          12.0%          16.4%           9.1%          16.7%          28.2%                   11.5%                       8.8%
                 Imports                                    $147,935,931   $217,824,033   $265,882,659   $346,049,031   $712,900,478   $336,566,658   $342,706,206   $6,139,548      1.8%    $194,770,275     131.7%
                           % of Total Imports to Canada           17.9%          25.0%          29.3%          32.5%          52.2%          31.3%          26.7%                   -4.6%                       8.8%
                 Total Rail Trade Thru GPITC                $216,442,967   $280,837,423   $337,595,935   $475,846,842   $820,365,555   $501,117,152   $665,254,345 $164,137,193     32.8%    $448,811,378     207.4%
                             % Total Trade with Canada            18.4%          21.8%          22.5%          25.6%          32.2%          24.3%          27.4%                    3.1%                       9.0%

TOTAL
                 Exports                                    $163,902,893   $186,744,530   $269,621,663   $387,971,922  $481,854,951   $576,135,779   $844,535,909 $268,400,130      46.6%  $680,633,016       415.3%
                           % of Total Exports to Canada           35.3%          35.1%          37.3%          39.1%          34.1%          46.8%          54.5%                    7.7%                      19.2%
                 Imports                                    $285,804,438   $391,360,356   $476,986,952   $547,486,648 $1,092,985,741  $649,231,113   $757,266,480 $108,035,367      16.6%  $471,462,042       165.0%
                          % of Total Imports to Canada            26.8%          33.5%          37.9%          35.1%          46.9%          41.3%          41.5%                    0.2%                      14.7%
                 Total Trade Thru GPITC                     $449,707,331   $578,104,886   $746,608,615   $935,458,570 $1,574,840,692 $1,225,366,892 $1,601,802,389 $376,435,497     30.7% $1,152,095,058      256.2%
                            % Total Trade with Canada             29.4%          34.0%          37.7%          36.6%          42.1%          43.7%          47.5%                    3.8%                      18.1%
North Dakota Trading Relationships -- 2004 - 2010                                                                                                                  Mexico
                                                                                                                                                                     Domestic
                                                                                                                                                                      Canada


2010         Leading Exports from North Dakota to Canada (Surface          2010    2010        Leading Exports from North Dakota to Canada (Surface          2010
             Transportation)                                                                   Transportation)


Rank                                                                      Export   Rank        Alberta                                                      Export
1       84   Computer-Related Machinery and Parts                   $290,858,481      1   27   Mineral Fuels; Oils and Waxes                          $147,640,435
2       27   Mineral Fuels; Oils and Waxes                          $282,077,356      2   31   Fertilizers                                            $142,504,571
3       87   Vehicles Other than Railway                            $275,596,016      3   28   Inorganic Chemicals                                     $99,842,614
4       15   Animal or Vegetable Fats and Oils                      $231,998,460      4   84   Computer-Related Machinery and Parts                    $91,066,201
5       10   Cereals                                                 $92,960,713      5   73   Articles of Iron and Steel                              $27,639,844
6       23   Food Residues and Waste                                 $55,925,479      6   94   Furniture; Lamps and Prefabricated Buildings            $22,765,875
7       12   Oil Seeds and Oleaginous Fruits                         $55,347,351      7   71   Pearls; Stones; Metals and Imitation Jewelry            $19,224,504
8       29   Organic Chemicals                                       $37,555,434      8   29   Organic Chemicals                                       $12,672,570
9       7    Edible Vegetables and Roots                             $32,094,377      9   25   Salt; Sulfur; Plaster and Cement                        $11,501,834
10      38   Miscellaneous Chemical Products                         $27,821,145     10   39   Plastics and Articles                                    $9,258,800

 2010        Leading Imports to North Dakota from Canada (Surface           2010   2010        Leading Exports from North Dakota to Canada (Surface          2010
Rank                                                                      Import   Rank        British Colombia                                             Export
1       12   Oil Seeds and Oleaginous Fruits                        $333,689,447      1   44   Wood and Articles                                        $7,784,137
2       84   Computer-Related Machinery and Parts                   $268,302,498      2   87   Vehicles Other than Railway                              $4,519,312
3       27   Mineral Fuels; Oils and Waxes                          $238,777,127      3   84   Computer-Related Machinery and Parts                     $2,078,236
4       31   Fertilizers                                            $213,209,921      4   85   Electrical Machinery; Equipment and Parts                 $631,771
5       28   Inorganic Chemicals                                    $125,058,137      5   94   Furniture; Lamps and Prefabricated Buildings              $603,926
6       87   Vehicles Other than Railway                            $122,985,890      6   39   Plastics and Articles                                     $467,880
7       73   Articles of Iron and Steel                              $81,576,892      7   21   Miscellaneous Edible Preparations                         $449,534
8       98   Special Classification Provisions                       $61,041,179      8   95   Toys; Games and Sport Equipment                           $374,440
9       10   Cereals                                                 $53,876,443      9   28   Inorganic Chemicals                                       $365,273
10      72   Iron and Steel                                          $41,427,220     10   12   Oil Seeds and Oleaginous Fruits                            $346,226

                                                                                   2010        Leading Exports from North Dakota to Canada (Surface          2010
                                                                                   Rank        Saskatchewan                                                 Export
                                                                                      1   12   Oil Seeds and Oleaginous Fruits                         $83,891,118
                                                                                      2   84   Computer-Related Machinery and Parts                    $72,708,869
                                                                                      3   27   Mineral Fuels; Oils and Waxes                           $53,656,921
                                                                                      4   31   Fertilizers                                             $49,764,041
                                                                                      5   10   Cereals                                                 $41,331,686
                                                                                      6   38   Miscellaneous Chemical Products                         $25,040,929
                                                                                      7   28   Inorganic Chemicals                                     $18,748,392
                                                                                      8    1   Live Animals                                             $7,713,550
                                                                                      9   73   Articles of Iron and Steel                               $7,209,736
                                                                                     10   44   Wood and Articles                                        $3,748,657

Mais conteúdo relacionado

Mais procurados

Texas Trade through Ports-to-Plains Region – 2004-2010
Texas Trade through Ports-to-Plains Region – 2004-2010Texas Trade through Ports-to-Plains Region – 2004-2010
Texas Trade through Ports-to-Plains Region – 2004-2010Ports-To-Plains Blog
 
North Dakota Trade Relationships 2004-2011
North Dakota Trade Relationships 2004-2011North Dakota Trade Relationships 2004-2011
North Dakota Trade Relationships 2004-2011Ports-To-Plains Blog
 
South Dakota Trade Relationships 2004-2011
South Dakota Trade Relationships 2004-2011South Dakota Trade Relationships 2004-2011
South Dakota Trade Relationships 2004-2011Ports-To-Plains Blog
 
Nebraska Trade Relationships 2004 – 2011
Nebraska Trade Relationships 2004 – 2011Nebraska Trade Relationships 2004 – 2011
Nebraska Trade Relationships 2004 – 2011Ports-To-Plains Blog
 
Oklahoma Trade Relationships 2004-2011
Oklahoma Trade Relationships 2004-2011Oklahoma Trade Relationships 2004-2011
Oklahoma Trade Relationships 2004-2011Ports-To-Plains Blog
 
Principals of Business Finance
Principals of Business FinancePrincipals of Business Finance
Principals of Business FinanceKathleen Boushele
 
Q2 2017 CONDO MARKET REPORT
Q2 2017 CONDO MARKET REPORTQ2 2017 CONDO MARKET REPORT
Q2 2017 CONDO MARKET REPORTMichelle Makos
 
Hexter Fair Economic Forecast 021909 Allen
Hexter Fair Economic Forecast 021909 AllenHexter Fair Economic Forecast 021909 Allen
Hexter Fair Economic Forecast 021909 AllenSheriStinson
 

Mais procurados (9)

Texas Trade through Ports-to-Plains Region – 2004-2010
Texas Trade through Ports-to-Plains Region – 2004-2010Texas Trade through Ports-to-Plains Region – 2004-2010
Texas Trade through Ports-to-Plains Region – 2004-2010
 
North Dakota Trade Relationships 2004-2011
North Dakota Trade Relationships 2004-2011North Dakota Trade Relationships 2004-2011
North Dakota Trade Relationships 2004-2011
 
South Dakota Trade Relationships 2004-2011
South Dakota Trade Relationships 2004-2011South Dakota Trade Relationships 2004-2011
South Dakota Trade Relationships 2004-2011
 
Nebraska Trade Relationships 2004 – 2011
Nebraska Trade Relationships 2004 – 2011Nebraska Trade Relationships 2004 – 2011
Nebraska Trade Relationships 2004 – 2011
 
Oklahoma Trade Relationships 2004-2011
Oklahoma Trade Relationships 2004-2011Oklahoma Trade Relationships 2004-2011
Oklahoma Trade Relationships 2004-2011
 
IT Industry Statistics 2007 Final Report
IT Industry Statistics 2007 Final ReportIT Industry Statistics 2007 Final Report
IT Industry Statistics 2007 Final Report
 
Principals of Business Finance
Principals of Business FinancePrincipals of Business Finance
Principals of Business Finance
 
Q2 2017 CONDO MARKET REPORT
Q2 2017 CONDO MARKET REPORTQ2 2017 CONDO MARKET REPORT
Q2 2017 CONDO MARKET REPORT
 
Hexter Fair Economic Forecast 021909 Allen
Hexter Fair Economic Forecast 021909 AllenHexter Fair Economic Forecast 021909 Allen
Hexter Fair Economic Forecast 021909 Allen
 

Destaque

Rural Heartland of America – Equity Evaluation
Rural Heartland of America – Equity EvaluationRural Heartland of America – Equity Evaluation
Rural Heartland of America – Equity EvaluationPorts-To-Plains Blog
 
Howdy Partner!: Heartland Expressway Association
Howdy Partner!: Heartland Expressway AssociationHowdy Partner!: Heartland Expressway Association
Howdy Partner!: Heartland Expressway AssociationPorts-To-Plains Blog
 
Reach for the Sky!: Funding Opportunities – Programs, grants, innovative fund...
Reach for the Sky!: Funding Opportunities – Programs, grants, innovative fund...Reach for the Sky!: Funding Opportunities – Programs, grants, innovative fund...
Reach for the Sky!: Funding Opportunities – Programs, grants, innovative fund...Ports-To-Plains Blog
 
Howdy Partners!: Eastern Alberta Corridor
Howdy Partners!: Eastern Alberta CorridorHowdy Partners!: Eastern Alberta Corridor
Howdy Partners!: Eastern Alberta CorridorPorts-To-Plains Blog
 
Dia Internacional del Hombre
Dia Internacional del HombreDia Internacional del Hombre
Dia Internacional del Hombrenegroguida
 
Tic Palabras Point
Tic Palabras PointTic Palabras Point
Tic Palabras Pointari
 
Comics sobre los Cuentos del Lobo
Comics sobre los Cuentos del LoboComics sobre los Cuentos del Lobo
Comics sobre los Cuentos del Loboaftnsdc
 
Concurso Animal mais Fotogénico
Concurso Animal mais FotogénicoConcurso Animal mais Fotogénico
Concurso Animal mais Fotogénicoruthgms
 
Exercicis mecanismes
Exercicis mecanismesExercicis mecanismes
Exercicis mecanismestecnovicent
 
I Congreso Webmasters 1 Día Miguelangelivarsmas.Com
I Congreso Webmasters 1 Día Miguelangelivarsmas.ComI Congreso Webmasters 1 Día Miguelangelivarsmas.Com
I Congreso Webmasters 1 Día Miguelangelivarsmas.Comforwards
 
Objetivos del curso de la Fiuner Junio 2011
Objetivos del curso de la Fiuner Junio 2011Objetivos del curso de la Fiuner Junio 2011
Objetivos del curso de la Fiuner Junio 2011apeljor
 

Destaque (20)

Rural Heartland of America – Equity Evaluation
Rural Heartland of America – Equity EvaluationRural Heartland of America – Equity Evaluation
Rural Heartland of America – Equity Evaluation
 
Howdy Partner!: Heartland Expressway Association
Howdy Partner!: Heartland Expressway AssociationHowdy Partner!: Heartland Expressway Association
Howdy Partner!: Heartland Expressway Association
 
Keynote Presentation
Keynote PresentationKeynote Presentation
Keynote Presentation
 
Reach for the Sky!: Funding Opportunities – Programs, grants, innovative fund...
Reach for the Sky!: Funding Opportunities – Programs, grants, innovative fund...Reach for the Sky!: Funding Opportunities – Programs, grants, innovative fund...
Reach for the Sky!: Funding Opportunities – Programs, grants, innovative fund...
 
Howdy Partners!: Eastern Alberta Corridor
Howdy Partners!: Eastern Alberta CorridorHowdy Partners!: Eastern Alberta Corridor
Howdy Partners!: Eastern Alberta Corridor
 
Aprende
Aprende Aprende
Aprende
 
4.gaia energia
4.gaia energia4.gaia energia
4.gaia energia
 
Compta stes
Compta stesCompta stes
Compta stes
 
Alcohol vicio laura
Alcohol vicio lauraAlcohol vicio laura
Alcohol vicio laura
 
Hoy Y Siempre 2388
Hoy Y  Siempre 2388Hoy Y  Siempre 2388
Hoy Y Siempre 2388
 
Dia Internacional del Hombre
Dia Internacional del HombreDia Internacional del Hombre
Dia Internacional del Hombre
 
Sondagem Industrial | Maio 2014 | Divulgação 17/06/2014
Sondagem Industrial | Maio 2014 | Divulgação 17/06/2014Sondagem Industrial | Maio 2014 | Divulgação 17/06/2014
Sondagem Industrial | Maio 2014 | Divulgação 17/06/2014
 
Tic Palabras Point
Tic Palabras PointTic Palabras Point
Tic Palabras Point
 
Un mes de su partida
Un mes de su partidaUn mes de su partida
Un mes de su partida
 
Comics sobre los Cuentos del Lobo
Comics sobre los Cuentos del LoboComics sobre los Cuentos del Lobo
Comics sobre los Cuentos del Lobo
 
Concurso Animal mais Fotogénico
Concurso Animal mais FotogénicoConcurso Animal mais Fotogénico
Concurso Animal mais Fotogénico
 
Abezoo
AbezooAbezoo
Abezoo
 
Exercicis mecanismes
Exercicis mecanismesExercicis mecanismes
Exercicis mecanismes
 
I Congreso Webmasters 1 Día Miguelangelivarsmas.Com
I Congreso Webmasters 1 Día Miguelangelivarsmas.ComI Congreso Webmasters 1 Día Miguelangelivarsmas.Com
I Congreso Webmasters 1 Día Miguelangelivarsmas.Com
 
Objetivos del curso de la Fiuner Junio 2011
Objetivos del curso de la Fiuner Junio 2011Objetivos del curso de la Fiuner Junio 2011
Objetivos del curso de la Fiuner Junio 2011
 

Semelhante a North Dakota Trade through Ports-to-Plains Region – 2004-2010

Colorado Trade Relationships 2004-2011
Colorado Trade Relationships 2004-2011Colorado Trade Relationships 2004-2011
Colorado Trade Relationships 2004-2011Ports-To-Plains Blog
 
Texas Trade Relationships 2004 - 2011
Texas Trade Relationships 2004 - 2011Texas Trade Relationships 2004 - 2011
Texas Trade Relationships 2004 - 2011Ports-To-Plains Blog
 
Montana Trading Relationship 2004-2011
Montana Trading Relationship 2004-2011Montana Trading Relationship 2004-2011
Montana Trading Relationship 2004-2011Ports-To-Plains Blog
 
Ports-to-Plains Alliance Trade Summary 2004-2011
Ports-to-Plains Alliance Trade Summary 2004-2011Ports-to-Plains Alliance Trade Summary 2004-2011
Ports-to-Plains Alliance Trade Summary 2004-2011Ports-To-Plains Blog
 
Naa Annual Newspaper Ad Expenditures 09
Naa Annual Newspaper Ad Expenditures 09Naa Annual Newspaper Ad Expenditures 09
Naa Annual Newspaper Ad Expenditures 09Juan Varela
 
The 99% Tax Plan Taxation Schedules
The 99% Tax Plan Taxation SchedulesThe 99% Tax Plan Taxation Schedules
The 99% Tax Plan Taxation Schedulesdarrick72
 
Caída Publicidad EEUU 2009
Caída Publicidad EEUU 2009Caída Publicidad EEUU 2009
Caída Publicidad EEUU 2009Juan Varela
 
Cushman & Wakefield Q12018 Canadian Office Statistical Summary
 Cushman & Wakefield Q12018 Canadian Office Statistical Summary Cushman & Wakefield Q12018 Canadian Office Statistical Summary
Cushman & Wakefield Q12018 Canadian Office Statistical SummaryGuy Masse
 
Cushman & Wakefield's Canadian Office Statistical Summary Q4 2018
Cushman & Wakefield's Canadian Office Statistical Summary Q4 2018Cushman & Wakefield's Canadian Office Statistical Summary Q4 2018
Cushman & Wakefield's Canadian Office Statistical Summary Q4 2018Guy Masse
 
Slide presentation 2 q10
Slide presentation 2 q10Slide presentation 2 q10
Slide presentation 2 q10Cia Hering RI
 
C&W-Canadian Office Stats -Q1 2019 - #cre #realestate
 C&W-Canadian Office Stats -Q1 2019 - #cre #realestate C&W-Canadian Office Stats -Q1 2019 - #cre #realestate
C&W-Canadian Office Stats -Q1 2019 - #cre #realestateGuy Masse
 
Grendene - 15th Annual Latin America Conference - Citigroup
Grendene - 15th Annual Latin America Conference - CitigroupGrendene - 15th Annual Latin America Conference - Citigroup
Grendene - 15th Annual Latin America Conference - CitigroupGrendene
 
July 2021 - Market Report
July 2021 - Market Report July 2021 - Market Report
July 2021 - Market Report Michelle Makos
 
Slide presentation 1 q10
Slide presentation 1 q10Slide presentation 1 q10
Slide presentation 1 q10Cia Hering RI
 
JLL Great Lakes Scorecard
JLL Great Lakes ScorecardJLL Great Lakes Scorecard
JLL Great Lakes ScorecardAndrew Batson
 
Swifton CFOs LLC - Boston BizSpark presentation - Financial Projections for I...
Swifton CFOs LLC - Boston BizSpark presentation - Financial Projections for I...Swifton CFOs LLC - Boston BizSpark presentation - Financial Projections for I...
Swifton CFOs LLC - Boston BizSpark presentation - Financial Projections for I...David Fogel
 

Semelhante a North Dakota Trade through Ports-to-Plains Region – 2004-2010 (20)

Colorado Trade Relationships 2004-2011
Colorado Trade Relationships 2004-2011Colorado Trade Relationships 2004-2011
Colorado Trade Relationships 2004-2011
 
Texas Trade Relationships 2004 - 2011
Texas Trade Relationships 2004 - 2011Texas Trade Relationships 2004 - 2011
Texas Trade Relationships 2004 - 2011
 
Montana Trading Relationship 2004-2011
Montana Trading Relationship 2004-2011Montana Trading Relationship 2004-2011
Montana Trading Relationship 2004-2011
 
Ports-to-Plains Alliance Trade Summary 2004-2011
Ports-to-Plains Alliance Trade Summary 2004-2011Ports-to-Plains Alliance Trade Summary 2004-2011
Ports-to-Plains Alliance Trade Summary 2004-2011
 
Naa Annual Newspaper Ad Expenditures 09
Naa Annual Newspaper Ad Expenditures 09Naa Annual Newspaper Ad Expenditures 09
Naa Annual Newspaper Ad Expenditures 09
 
The 99% Tax Plan Taxation Schedules
The 99% Tax Plan Taxation SchedulesThe 99% Tax Plan Taxation Schedules
The 99% Tax Plan Taxation Schedules
 
Caída Publicidad EEUU 2009
Caída Publicidad EEUU 2009Caída Publicidad EEUU 2009
Caída Publicidad EEUU 2009
 
Cushman & Wakefield Q12018 Canadian Office Statistical Summary
 Cushman & Wakefield Q12018 Canadian Office Statistical Summary Cushman & Wakefield Q12018 Canadian Office Statistical Summary
Cushman & Wakefield Q12018 Canadian Office Statistical Summary
 
Cushman & Wakefield's Canadian Office Statistical Summary Q4 2018
Cushman & Wakefield's Canadian Office Statistical Summary Q4 2018Cushman & Wakefield's Canadian Office Statistical Summary Q4 2018
Cushman & Wakefield's Canadian Office Statistical Summary Q4 2018
 
Slide presentation 2 q10
Slide presentation 2 q10Slide presentation 2 q10
Slide presentation 2 q10
 
C&W-Canadian Office Stats -Q1 2019 - #cre #realestate
 C&W-Canadian Office Stats -Q1 2019 - #cre #realestate C&W-Canadian Office Stats -Q1 2019 - #cre #realestate
C&W-Canadian Office Stats -Q1 2019 - #cre #realestate
 
Grendene - 15th Annual Latin America Conference - Citigroup
Grendene - 15th Annual Latin America Conference - CitigroupGrendene - 15th Annual Latin America Conference - Citigroup
Grendene - 15th Annual Latin America Conference - Citigroup
 
July 2021 - Market Report
July 2021 - Market Report July 2021 - Market Report
July 2021 - Market Report
 
1 q10
1 q101 q10
1 q10
 
Slide presentation 1 q10
Slide presentation 1 q10Slide presentation 1 q10
Slide presentation 1 q10
 
Apimec 2 q05 results
Apimec   2 q05 resultsApimec   2 q05 results
Apimec 2 q05 results
 
CNR_DCF(USD)
CNR_DCF(USD)CNR_DCF(USD)
CNR_DCF(USD)
 
JLL Great Lakes Scorecard
JLL Great Lakes ScorecardJLL Great Lakes Scorecard
JLL Great Lakes Scorecard
 
Swifton CFOs LLC - Boston BizSpark presentation - Financial Projections for I...
Swifton CFOs LLC - Boston BizSpark presentation - Financial Projections for I...Swifton CFOs LLC - Boston BizSpark presentation - Financial Projections for I...
Swifton CFOs LLC - Boston BizSpark presentation - Financial Projections for I...
 
Pick. Click. Give. Update
Pick. Click. Give. UpdatePick. Click. Give. Update
Pick. Click. Give. Update
 

Mais de Ports-To-Plains Blog

2013 Ports-to-Plains Alliance Energy Conference Handouts
2013 Ports-to-Plains Alliance Energy Conference Handouts2013 Ports-to-Plains Alliance Energy Conference Handouts
2013 Ports-to-Plains Alliance Energy Conference HandoutsPorts-To-Plains Blog
 
Energy Development Impact on Transportation Infrastructure
Energy Development Impact on Transportation InfrastructureEnergy Development Impact on Transportation Infrastructure
Energy Development Impact on Transportation InfrastructurePorts-To-Plains Blog
 
Wind Energy's Future and the Impact on U.S. Manufacturing
Wind Energy's Future and the Impact on U.S. ManufacturingWind Energy's Future and the Impact on U.S. Manufacturing
Wind Energy's Future and the Impact on U.S. ManufacturingPorts-To-Plains Blog
 
Compressed Air Wind Energy Storage
Compressed Air Wind Energy StorageCompressed Air Wind Energy Storage
Compressed Air Wind Energy StoragePorts-To-Plains Blog
 
Fuels Policy, Ethanol and RFS Reform Political and Policy Implications on Gas...
Fuels Policy, Ethanol and RFS Reform Political and Policy Implications on Gas...Fuels Policy, Ethanol and RFS Reform Political and Policy Implications on Gas...
Fuels Policy, Ethanol and RFS Reform Political and Policy Implications on Gas...Ports-To-Plains Blog
 
Ports-to-Plains Letter Submitted to Department of State
Ports-to-Plains Letter Submitted to Department of StatePorts-to-Plains Letter Submitted to Department of State
Ports-to-Plains Letter Submitted to Department of StatePorts-To-Plains Blog
 
News Release Keystone XL Supporting SEIS Finding 041813
News Release Keystone XL Supporting SEIS Finding 041813News Release Keystone XL Supporting SEIS Finding 041813
News Release Keystone XL Supporting SEIS Finding 041813Ports-To-Plains Blog
 
Ports-to-Plains: The Importance of a Statewide Transportation to Colorado's E...
Ports-to-Plains: The Importance of a Statewide Transportation to Colorado's E...Ports-to-Plains: The Importance of a Statewide Transportation to Colorado's E...
Ports-to-Plains: The Importance of a Statewide Transportation to Colorado's E...Ports-To-Plains Blog
 
2013 Energy Conference Save the Date
2013 Energy Conference Save the Date2013 Energy Conference Save the Date
2013 Energy Conference Save the DatePorts-To-Plains Blog
 
February 2013 Update from the Ports-to-Plains Alliance
February 2013 Update from the Ports-to-Plains AllianceFebruary 2013 Update from the Ports-to-Plains Alliance
February 2013 Update from the Ports-to-Plains AlliancePorts-To-Plains Blog
 
Draft Supplemental EIS for the Keystone XL Project
Draft Supplemental EIS for the Keystone XL ProjectDraft Supplemental EIS for the Keystone XL Project
Draft Supplemental EIS for the Keystone XL ProjectPorts-To-Plains Blog
 
PTP supports Heineman Keystone XL Pipeline Decision
PTP supports Heineman Keystone XL Pipeline DecisionPTP supports Heineman Keystone XL Pipeline Decision
PTP supports Heineman Keystone XL Pipeline DecisionPorts-To-Plains Blog
 
News Release PTP Keystone XL Nebraska
News Release PTP Keystone XL NebraskaNews Release PTP Keystone XL Nebraska
News Release PTP Keystone XL NebraskaPorts-To-Plains Blog
 
Ports-to-Plains Alliance Webinar 113012
Ports-to-Plains Alliance Webinar 113012Ports-to-Plains Alliance Webinar 113012
Ports-to-Plains Alliance Webinar 113012Ports-To-Plains Blog
 
Comments on Interim Guidance on State Freight Plans and State Advisory Commit...
Comments on Interim Guidance on State Freight Plans and State Advisory Commit...Comments on Interim Guidance on State Freight Plans and State Advisory Commit...
Comments on Interim Guidance on State Freight Plans and State Advisory Commit...Ports-To-Plains Blog
 
Interim Guidance on State Freight Plans and State Freight Advisory Committees
Interim Guidance on State Freight Plans and State Freight Advisory CommitteesInterim Guidance on State Freight Plans and State Freight Advisory Committees
Interim Guidance on State Freight Plans and State Freight Advisory CommitteesPorts-To-Plains Blog
 
Ports-to-Plains Alliance Northern Working Group Strategic Plan October 2012
Ports-to-Plains Alliance Northern Working Group Strategic Plan October 2012Ports-to-Plains Alliance Northern Working Group Strategic Plan October 2012
Ports-to-Plains Alliance Northern Working Group Strategic Plan October 2012Ports-To-Plains Blog
 

Mais de Ports-To-Plains Blog (20)

Canada and U.S. Trade Overview
Canada and U.S. Trade Overview Canada and U.S. Trade Overview
Canada and U.S. Trade Overview
 
2013 Ports-to-Plains Alliance Energy Conference Handouts
2013 Ports-to-Plains Alliance Energy Conference Handouts2013 Ports-to-Plains Alliance Energy Conference Handouts
2013 Ports-to-Plains Alliance Energy Conference Handouts
 
Energy Development Impact on Transportation Infrastructure
Energy Development Impact on Transportation InfrastructureEnergy Development Impact on Transportation Infrastructure
Energy Development Impact on Transportation Infrastructure
 
Wind Energy's Future and the Impact on U.S. Manufacturing
Wind Energy's Future and the Impact on U.S. ManufacturingWind Energy's Future and the Impact on U.S. Manufacturing
Wind Energy's Future and the Impact on U.S. Manufacturing
 
Compressed Air Wind Energy Storage
Compressed Air Wind Energy StorageCompressed Air Wind Energy Storage
Compressed Air Wind Energy Storage
 
Fuels Policy, Ethanol and RFS Reform Political and Policy Implications on Gas...
Fuels Policy, Ethanol and RFS Reform Political and Policy Implications on Gas...Fuels Policy, Ethanol and RFS Reform Political and Policy Implications on Gas...
Fuels Policy, Ethanol and RFS Reform Political and Policy Implications on Gas...
 
Ports-to-Plains Letter Submitted to Department of State
Ports-to-Plains Letter Submitted to Department of StatePorts-to-Plains Letter Submitted to Department of State
Ports-to-Plains Letter Submitted to Department of State
 
News Release Keystone XL Supporting SEIS Finding 041813
News Release Keystone XL Supporting SEIS Finding 041813News Release Keystone XL Supporting SEIS Finding 041813
News Release Keystone XL Supporting SEIS Finding 041813
 
Ports-to-Plains: The Importance of a Statewide Transportation to Colorado's E...
Ports-to-Plains: The Importance of a Statewide Transportation to Colorado's E...Ports-to-Plains: The Importance of a Statewide Transportation to Colorado's E...
Ports-to-Plains: The Importance of a Statewide Transportation to Colorado's E...
 
2013 Energy Conference Save the Date
2013 Energy Conference Save the Date2013 Energy Conference Save the Date
2013 Energy Conference Save the Date
 
February 2013 Update from the Ports-to-Plains Alliance
February 2013 Update from the Ports-to-Plains AllianceFebruary 2013 Update from the Ports-to-Plains Alliance
February 2013 Update from the Ports-to-Plains Alliance
 
Draft Supplemental EIS for the Keystone XL Project
Draft Supplemental EIS for the Keystone XL ProjectDraft Supplemental EIS for the Keystone XL Project
Draft Supplemental EIS for the Keystone XL Project
 
PTP supports Heineman Keystone XL Pipeline Decision
PTP supports Heineman Keystone XL Pipeline DecisionPTP supports Heineman Keystone XL Pipeline Decision
PTP supports Heineman Keystone XL Pipeline Decision
 
Keystone XL Letter Dec 2012 NEDEQ
Keystone XL Letter Dec 2012 NEDEQKeystone XL Letter Dec 2012 NEDEQ
Keystone XL Letter Dec 2012 NEDEQ
 
News Release PTP Keystone XL Nebraska
News Release PTP Keystone XL NebraskaNews Release PTP Keystone XL Nebraska
News Release PTP Keystone XL Nebraska
 
Ports-to-Plains Alliance Webinar 113012
Ports-to-Plains Alliance Webinar 113012Ports-to-Plains Alliance Webinar 113012
Ports-to-Plains Alliance Webinar 113012
 
Comments on Interim Guidance on State Freight Plans and State Advisory Commit...
Comments on Interim Guidance on State Freight Plans and State Advisory Commit...Comments on Interim Guidance on State Freight Plans and State Advisory Commit...
Comments on Interim Guidance on State Freight Plans and State Advisory Commit...
 
Interim Guidance on State Freight Plans and State Freight Advisory Committees
Interim Guidance on State Freight Plans and State Freight Advisory CommitteesInterim Guidance on State Freight Plans and State Freight Advisory Committees
Interim Guidance on State Freight Plans and State Freight Advisory Committees
 
Ports-to-Plains Alliance Northern Working Group Strategic Plan October 2012
Ports-to-Plains Alliance Northern Working Group Strategic Plan October 2012Ports-to-Plains Alliance Northern Working Group Strategic Plan October 2012
Ports-to-Plains Alliance Northern Working Group Strategic Plan October 2012
 
Return to Rural
Return to RuralReturn to Rural
Return to Rural
 

North Dakota Trade through Ports-to-Plains Region – 2004-2010

  • 1. North Dakota Trading Relationships -- 2004 - 2010 Mexico Domestic Canada 2009-2010 2009-2010 2004-2010 2004-2010 2004 2005 2006 2007 2008 2009 2010 Difference % Change Difference % Change Mexico Truck Exports $4,387,396 $8,775,652 $8,226,108 $10,517,022 $15,066,483 $21,627,331 $22,112,644 $485,313 2.2% $17,725,248 404.0% Imports $45,495,030 $79,271,601 $43,006,575 $48,687,416 $32,729,456 $35,959,934 $45,760,804 $9,800,870 27.3% $265,774 0.6% Total Truck Trade with Mexico $49,882,426 $88,047,253 $51,232,683 $59,204,438 $47,795,939 $57,587,265 $67,873,448 $10,286,183 17.9% $17,991,022 36.1% #DIV/0! Rail Exports $42,435,097 $40,051,205 $41,579,461 $109,222,732 $182,389,151 $170,410,478 $135,390,542 -$35,019,936 -20.6% $92,955,445 219.1% Imports $307,860 $882,176 $172,424 $564,416 $5,368,709 $220,006 $1,074,652 $854,646 388.5% $766,792 249.1% Total Rail Trade with Mexico $42,742,957 $40,933,381 $41,751,885 $109,787,148 $187,757,860 $170,630,484 $136,465,194 -$34,165,290 -20.0% $93,722,237 219.3% #DIV/0! TOTAL Exports $46,822,493 $48,826,857 $49,805,569 $119,739,754 $197,455,634 $192,037,809 $157,503,186 -$34,534,623 -18.0% $110,680,693 236.4% Imports $45,802,890 $80,153,777 $43,178,999 $49,251,832 $38,098,165 $36,179,940 $46,835,456 $10,655,516 29.5% $1,032,566 2.3% Total Trade with Mexico $92,625,383 $128,980,634 $92,984,568 $168,991,586 $235,553,799 $228,217,749 $204,338,642 -$23,879,107 -10.5% $111,713,259 120.6% Laredo, TX Truck Exports $3,187,304 $5,973,721 $6,405,656 $9,012,291 $11,078,263 $18,959,660 $17,595,902 -$1,363,758 -7.2% $14,408,598 452.1% % of Total Exports to Mexico 72.6% 68.1% 77.9% 85.7% 73.5% 87.7% 79.6% -8.1% 6.9% Imports $13,211,603 $54,483,352 $42,539,226 $41,144,291 $27,872,272 $33,060,650 $35,455,480 $2,394,830 7.2% $22,243,877 168.4% % of Total Imports to Mexico 29.0% 68.7% 98.9% 84.5% 85.2% 91.9% 77.5% -14.5% 48.4% Total Truck Trade Thru Laredo $16,398,907 $60,457,073 $48,944,882 $50,156,582 $38,950,535 $52,020,310 $53,051,382 $1,031,072 2.0% $36,652,475 223.5% % Total Trade with Mexico 32.9% 68.7% 95.5% 84.7% 81.5% 90.3% 78.2% -12.2% 45.3% Rail Exports $17,285,274 $24,394,111 $17,432,331 $38,073,340 $72,562,683 $32,496,362 $15,184,384 -$17,311,978 -53.3% -$2,100,890 -12.2% % of Total Exports to Mexico 40.7% 60.9% 41.9% 34.9% 39.8% 19.1% 11.2% -7.9% -29.5% Imports $251,976 $882,176 $172,424 $312,570 $407,282 $220,006 $978,120 $758,114 344.6% $726,144 288.2% % of Total Imports to Mexico 81.8% 100.0% 100.0% 55.4% 7.6% 100.0% 91.0% -9.0% 9.2% Total Rail Trade Thru Laredo $17,537,250 $25,276,287 $17,604,755 $38,385,910 $72,969,965 $32,716,368 $16,162,504 -$16,553,864 -50.6% -$1,374,746 -7.8% % Total Trade with Mexico 41.0% 61.7% 42.2% 35.0% 38.9% 19.2% 11.8% -7.3% -29.2% TOTAL Exports $20,472,578 $30,367,832 $23,837,987 $47,085,631 $83,640,946 $51,456,022 $32,780,286 -$18,675,736 -36.3% $12,307,708 60.1% % of Total Exports to Mexico 43.7% 62.2% 47.9% 39.3% 42.4% 26.8% 20.8% -6.0% -22.9% Imports $13,463,579 $55,365,528 $42,711,650 $41,456,861 $28,279,554 $33,280,656 $36,433,600 $3,152,944 9.5% $22,970,021 170.6% % of Total Imports to Mexico 29.4% 69.1% 98.9% 84.2% 74.2% 92.0% 77.8% -14.2% 48.4% Total Trade Thru Laredo $33,936,157 $85,733,360 $66,549,637 $88,542,492 $111,920,500 $84,736,678 $69,213,886 -$15,522,792 -18.3% $35,277,729 104.0% % Total Trade with Mexico 36.6% 66.5% 71.6% 52.4% 47.5% 37.1% 33.9% -3.3% -2.8%
  • 2. North Dakota Trading Relationships -- 2004 - 2010 Mexico Domestic Canada Eagle Pass, TX Truck Exports $359,611 $402,363 $852,033 $35,970 $12,328 $0 $109,734 $109,734 #DIV/0! -$249,877 -69.5% % of Total Exports to Mexico 8.2% 4.6% 10.4% 0.3% 0.1% 0.0% 0.5% 0.5% -7.7% Imports $2,668,178 $3,253,472 $0 $0 $0 $0 $0 $0 #DIV/0! -$2,668,178 -100.0% % of Total Imports to Mexico 5.9% 4.1% 0.0% 0.0% 0.0% 0.0% 0.0% 0.0% -5.9% Total Truck Trade Thru Eagle Pass $8,687,358 $3,655,835 $852,033 $35,970 $12,328 $0 $109,734 $109,734 #DIV/0! -$2,918,055 -98.7% % Total Trade with Mexico 17.4% 4.2% 1.7% 0.1% 0.0% 0.0% 0.2% 0.2% -17.3% Rail Exports $12,267,723 $8,256,437 $15,851,694 $25,701,736 $79,858,514 $114,741,917 $97,764,967 -$16,976,950 -14.8% $85,497,244 696.9% % of Total Exports to Mexico 28.9% 20.6% 38.1% 23.5% 43.8% 67.3% 72.2% 4.9% 43.3% Imports $55,884 $0 $0 $0 $1,701,920 $0 $33,436 $33,436 #DIV/0! -$22,448 -40.2% % of Total Imports to Mexico 0.0% 0.0% 0.0% 0.0% 31.7% 0.0% 3.1% 3.1% 3.1% Total Rail Trade Thru Eagle Pass $12,323,607 $8,256,437 $15,851,694 $25,701,736 $81,560,434 $114,741,917 $97,798,403 -$16,943,514 -14.8% $85,474,796 693.6% % Total Trade with Mexico 28.8% 20.2% 38.0% 23.4% 43.4% 67.2% 71.7% 4.4% 42.8% TOTAL Exports $12,627,334 $8,658,800 $16,703,727 $25,737,706 $79,870,842 $114,741,917 $97,874,701 -$16,867,216 -14.7% $85,247,367 675.1% % of Total Exports to Mexico 27.0% 17.7% 33.5% 21.5% 40.5% 59.7% 62.1% 2.4% 35.2% Imports $2,724,062 $3,253,472 $0 $0 $1,701,920 $0 $33,436 $33,436 #DIV/0! -$2,690,626 -98.8% % of Total Imports to Mexico 5.9% 4.1% 0.0% 0.0% 4.5% 0.0% 0.1% 0.1% -5.9% Total Trade Thru Eagle Pass $15,351,396 $11,912,272 $16,703,727 $25,737,706 $81,572,762 $114,741,917 $97,908,137 -$16,833,780 -14.7% $82,556,741 537.8% % Total Trade with Mexico 16.6% 9.2% 18.0% 15.2% 34.6% 50.3% 47.9% -2.4% 31.3% Del Rio, TX Truck Exports $0 $0 $0 $211,815 $0 $0 $0 $0 #DIV/0! $0 #DIV/0! % of Total Exports to Mexico 0.0% 0.0% 0.0% 2.0% 0.0% 0.0% 0.0% 0.0% 0.0% Imports $0 $0 $0 $0 $0 $0 $0 $0 #DIV/0! $0 #DIV/0! % of Total Imports to Mexico 0.0% 0% 0.0% 0.0% 0.0% 0.0% 0.0% 0.0% 0.0% Total Truck Trade Thru Del Rio $0 $0 $0 $211,815 $0 $0 $0 $0 #DIV/0! $0 #DIV/0! % Total Trade with Mexico 0.0% 0.0% 0.0% 0.4% 0.0% 0.0% 0.0% 0.0% 0.0% Rail Exports $0 $0 $0 #DIV/0! $0 #DIV/0! % of Total Exports to Mexico 0.0% 0.0% #DIV/0! #DIV/0! #DIV/0! #DIV/0! #DIV/0! #DIV/0! Imports $0 $0 $0 #DIV/0! $0 #DIV/0! % of Total Imports to Mexico 0.0% 0.0% #DIV/0! #DIV/0! #DIV/0! #DIV/0! #DIV/0! #DIV/0! Total Rail Trade Thru Del Rio $0 $0 $0 #DIV/0! $0 #DIV/0! % Total Trade with Mexico 0.0% 0.0% 0.0% 0.0% 0.0% 0.0% 0.0% 0.0% TOTAL Exports $0 $0 $0 $211,815 $0 $0 $0 $0 #DIV/0! $0 #DIV/0! % of Total Exports to Mexico 0.0% 0.0% 0.0% 0.2% 0.0% 0.0% 0.0% 0.0% 0.0% Imports $0 $0 $0 $0 $0 $0 $0 $0 #DIV/0! $0 #DIV/0! % of Total Imports to Mexico 0.0% 0.0% 0.0% 0.0% 0.0% 0.0% 0.0% 0.0% 0.0% Total Trade Thru Del Rio $0 $0 $0 $211,815 $0 $0 $0 $0 #DIV/0! $0 #DIV/0! % Total Trade with Mexico 0.0% 0.0% 0.0% 0.1% 0.0% 0.0% 0.0% 0.0% 0.0%
  • 3. North Dakota Trading Relationships -- 2004 - 2010 Mexico Domestic Canada GPITC Truck Exports $3,546,915 $6,376,084 $7,257,689 $9,260,076 $11,090,591 $18,959,660 $17,705,636 -$1,254,024 -6.6% $14,158,721 399.2% % of Total Exports to Mexico 80.8% 72.7% 88.2% 88.0% 73.6% 87.7% 80.1% -7.6% -0.8% Imports $15,879,781 $57,736,824 $42,539,226 $41,144,291 $27,872,272 $33,060,650 $35,455,480 $2,394,830 7.2% $19,575,699 123.3% % of Total Imports to Mexico 34.9% 72.8% 98.9% 84.5% 85.2% 91.9% 77.5% -14.5% 42.6% Total Truck Trade Thru GPITC $19,426,696 $64,112,908 $49,796,915 $50,404,367 $38,962,863 $52,020,310 $53,161,116 $1,140,806 2.2% $33,734,420 173.6% % Total Trade with Mexico 38.9% 72.8% 97.2% 85.1% 81.5% 90.3% 78.3% -12.0% 39.4% Rail Exports $29,552,997 $32,650,548 $33,284,025 $63,775,076 $152,421,197 $147,238,279 $112,949,351 -$34,288,928 -23.3% $83,396,354 282.2% % of Total Exports to Mexico 69.6% 81.5% 80.0% 58.4% 83.6% 86.4% 83.4% -3.0% 13.8% Imports $307,860 $882,176 $172,424 $312,570 $2,109,202 $220,006 $1,011,556 $791,550 359.8% $703,696 228.6% % of Total Imports to Mexico 100.0% 100.0% 100.0% 55.4% 39.3% 100.0% 94.1% -5.9% -5.9% Total Rail Trade Thru GPITC $29,860,857 $33,532,724 $33,456,449 $64,087,646 $154,530,399 $147,458,285 $113,960,907 -$33,497,378 -22.7% $84,100,050 281.6% % Total Trade with Mexico 69.9% 81.9% 80.1% 58.4% 82.3% 86.4% 83.5% -2.9% 13.6% TOTAL Exports $33,099,912 $39,026,632 $40,541,714 $73,035,152 $163,511,788 $166,197,939 $130,654,987 -$35,542,952 -21.4% $97,555,075 294.7% % of Total Exports to Mexico 70.7% 79.9% 81.4% 61.0% 82.8% 86.5% 83.0% -3.6% 12.3% Imports $16,187,641 $58,619,000 $42,711,650 $41,456,861 $29,981,474 $33,280,656 $36,467,036 $3,186,380 9.6% $20,279,395 125.3% % of Total Imports to Mexico 35.3% 73.1% 98.9% 84.2% 78.7% 92.0% 77.9% -14.1% 42.5% Total Trade Thru GPITC $49,287,553 $97,645,632 $83,253,364 $114,492,013 $193,493,262 $199,478,595 $167,122,023 -$32,356,572 -16.2% $117,834,470 239.1% % Total Trade with Mexico 53.2% 75.7% 89.5% 67.8% 82.1% 87.4% 81.8% -5.6% 28.6%
  • 4. North Dakota Trading Relationships -- 2004 - 2010 Mexico Domestic Canada 2010 Leading Exports from North Dakota to Mexico (Surface 2010 2010 Leading Exports from North Dakota to Mexico (Surface 2010 Transportation) Transportation) Rank Export Rank Coahuila Export 1 11 Malts; Starches and Inulin $70,149,888 1 11 Malts; Starches and Inulin $17,921,004 2 10 Cereals $26,780,551 2 10 Cereals $3,480,551 3 7 Edible Vegetables and Roots $14,669,437 3 85 Electrical Machinery; Equipment and Parts $3,045,534 4 12 Oil Seeds and Oleaginous Fruits $10,891,275 4 84 Computer-Related Machinery and Parts $1,026,497 5 23 Food Residues and Waste $8,269,966 5 23 Food Residues and Waste $1,001,838 6 84 Computer-Related Machinery and Parts $6,779,692 6 90 Measuring and Testing Instruments $593,168 7 85 Electrical Machinery; Equipment and Parts $4,469,196 7 39 Plastics and Articles $9,800 8 15 Animal or Vegetable Fats and Oils $3,932,388 8 1 Live Animals $5,000 9 48 Paper and Paperboard $3,817,918 9 87 Vehicles Other than Railway 4,500.00 10 39 Plastics and Articles $3,395,156 10 82 Tools of Base Metal 3,150.00 2010 Leading Imports to North Dakota from Mexico (Surface 2010 2010 Leading Exports from North Dakota to Mexico (Surface 2010 Rank Import Rank Nuevo Leon Export 1 85 Electrical Machinery; Equipment and Parts $23,608,009 1 11 Malts; Starches and Inulin $9,342,045 2 94 Furniture; Lamps and Prefabricated Buildings $6,383,587 2 48 Paper and Paperboard $3,805,419 3 84 Computer-Related Machinery and Parts $5,866,923 3 10 Cereals $3,691,887 4 87 Vehicles Other than Railway $5,036,799 4 39 Plastics and Articles $2,818,869 5 98 Special Classification Provisions $1,786,094 5 84 Computer-Related Machinery and Parts $2,493,574 6 24 Tobacco and Manufactured Tobacco $1,602,856 6 85 Electrical Machinery; Equipment and Parts $1,289,919 7 12 Oil Seeds and Oleaginous Fruits $1,145,433 7 7 Edible Vegetables and Roots $478,614 8 90 Measuring and Testing Instruments $563,649 8 90 Measuring and Testing Instruments $315,108 9 8 Edible Fruit and Nuts $226,501 9 27 Mineral Fuels; Oils and Waxes $292,728 10 73 Articles of Iron and Steel $102,122 10 20 Preparations of Vegetables; Fruits and Nuts $119,216 2010 Leading Exports from North Dakota to Mexico (Surface 2010 Rank Tamaulipas Export 1 84 Computer-Related Machinery and Parts $27,143 2 87 Vehicles Other than Railway 7,648.00 3 4 5 6 7 8 9 10
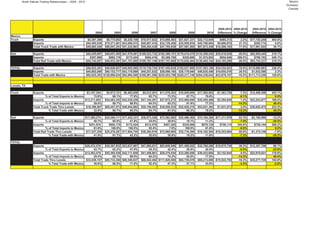
  • 5. North Dakota Trading Relationships -- 2004 - 2010 Mexico Domestic Canada Rail Truck Change Change Rail Truck Domestic -- 2002- 2002- 2002 Domestic -- 2007 Change Change 2015 2015 2015 Exports Rail Truck Exports Rail Truck Exports Rail Truck Colorado 0 39 4% Colorado 38 0 2% 0% -100% Colorado 80 320 8% #DIV/0! 722% Montana 0 201 19% Montana 0 398 25% #DIV/0! 98% Montana 43 411 9% #DIV/0! 105% Nebraska 0 72 7% Nebraska 0 151 10% #DIV/0! 110% Nebraska 69 181 5% #DIV/0! 151% New Mexico 0 0 0% New Mexico 32 0 2% #DIV/0! #DIV/0! New Mexico 40 46 2% #DIV/0! #DIV/0! North Dakota North Dakota North Dakota 376.95 0 Oklahoma 0 59 5% Oklahoma 0 0 0% #DIV/0! -100% Oklahoma 4 74 2% #DIV/0! 26% South Dakota 0 513 48% South Dakota 0 745 47% #DIV/0! 45% South Dakota - 1,791 37% #DIV/0! 249% Texas 47 137 17% Texas 0 285 18% -100% 108% Texas 904 332 26% 1823% 142% Wyoming 0 12 1% Wyoming 0 0 0% #DIV/0! -100% Wyoming - 118 2% #DIV/0! 887% Total ($m) 47 1,033 Total ($m) 1,579 104% -100% 53% Total ($m) 1,516 3,274 100% 3126% 217% 1,080 1,579 46% 4,790 344% Imports Rail Truck Imports Rail Truck Imports Rail Truck Colorado 0 0 0% Colorado 0 120 5% #DIV/0! #DIV/0! Colorado - 123 4% #DIV/0! #DIV/0! Montana 0 50 6% Montana 73 195 11% #DIV/0! 290% Montana 83 247 11% #DIV/0! 395% Nebraska 0 207 24% Nebraska 0 358 15% #DIV/0! 73% Nebraska 7 293 10% #DIV/0! 42% New Mexico 0 0 0% New Mexico 0 0 0% #DIV/0! #DIV/0! New Mexico - 0 0% #DIV/0! #DIV/0! North Dakota North Dakota North Dakota 0 Oklahoma 24 91 13% Oklahoma 0 184 8% -100% 102% Oklahoma 0 90 3% -98% -1% South Dakota 1 199 23% South Dakota 0 645 27% -100% 224% South Dakota - 1,205 40% -100% 505% Texas 0 280 32% Texas 0 788 33% #DIV/0! 181% Texas 35 879 30% #DIV/0! 214% Wyoming 0 12 1% Wyoming 0 44 2% #DIV/0! 267% Wyoming 7 46 2% #DIV/0! 284% Total ($m) 25 839 Total ($m) 73 2,334 100% 192% 178% Total ($m) 132 2,884 100% 429% 244% 864 2,407 179% 3,017 249% TOTALS Rail Truck TOTALS Rail Truck TOTALS Rail Truck Colorado 0 39 2% Colorado 38 120 4% #DIV/0! 208% Colorado 80 444 7% #DIV/0! 1038% Montana 0 251 13% Montana 73 593 16% #DIV/0! 136% Montana 126 658 11% #DIV/0! 162% Nebraska 0 279 14% Nebraska 0 509 13% #DIV/0! 82% Nebraska 76 474 7% #DIV/0! 70% New Mexico 0 0 0% New Mexico 32 0 1% #DIV/0! #DIV/0! New Mexico 40 47 1% #DIV/0! #DIV/0! North Dakota North Dakota North Dakota 0 Oklahoma 24 150 9% Oklahoma 0 184 5% -100% 23% North Dakota 4 165 2% -83% 10% South Dakota 1 712 37% South Dakota 0 1,390 34% -100% 95% Oklahoma - 2,996 40% -100% 321% Texas 47 417 24% Texas 0 1,073 26% -100% 157% South Dakota 939 1,211 29% 1897% 190% Wyoming 0 24 1% Wyoming 0 44 1% #DIV/0! 83% Texas 7 165 2% #DIV/0! 585% Total ($m) 72 1,872 Total ($m) 143 3,913 100% 99% 109% Total ($m) 1,272 6,159 100% #DIV/0! 229% 1,944 4,056 109% 7,430 282%
  • 6. North Dakota Trading Relationships -- 2004 - 2010 Mexico Domestic Canada 2009-2010 2009-2010 2004-2010 2004-2010 2004 2005 2006 2007 2008 2009 2010 Difference % Change Difference % Change Canada Truck Exports $352,617,295.00 $419,882,015 $595,428,470 $791,923,797 $1,179,135,819 $985,257,025 $1,142,298,099 $157,041,074 15.9% $789,680,804 223.9% Imports $825,606,711.00 $870,171,453 $906,886,515 $1,064,836,721 $1,364,790,059 $1,074,904,397 $1,284,044,420 $209,140,023 19.5% $458,437,709 55.5% Total Truck Trade with Canada $1,178,224,006.00 $1,290,053,468 $1,502,314,985 $1,856,760,518 $2,543,925,878 $2,060,161,422 $2,426,342,519 $366,181,097 17.8% $1,248,118,513 105.9% #DIV/0! Rail Exports $111,520,552.00 $112,464,759 $127,165,570 $201,483,095 $232,679,400 $245,614,622 $407,013,276 $161,398,654 65.7% $295,492,724 265.0% Imports $240,870,374.00 $298,094,957 $352,127,200 $496,614,744 $964,355,727 $495,327,822 $538,977,593 $43,649,771 8.8% $298,107,219 123.8% Total Rail Trade with Canada $352,390,926.00 $410,559,716 $479,292,770 $698,097,839 $1,197,035,127 $740,942,444 $945,990,869 $205,048,425 27.7% $593,599,943 168.4% #DIV/0! TOTAL Exports $464,137,847.00 $532,346,774 $722,594,040 $993,406,892 $1,411,815,219 $1,230,871,647 $1,549,311,375 $318,439,728 25.9% $1,085,173,528 233.8% Imports $1,066,477,085.00 $1,168,266,410 $1,259,013,715 $1,561,451,465 $2,329,145,786 $1,570,232,219 $1,823,022,013 $252,789,794 16.1% $756,544,928 70.9% Total Trade with Canada $1,530,614,932.00 $1,700,613,184 $1,981,607,755 $2,554,858,357 $3,740,961,005 $2,801,103,866 $3,372,333,388 $571,229,522 20.4% $1,841,718,456 120.3% Raymond, MT Truck Exports $1,240,512 $1,800,710 $2,235,444 $1,676,275 $3,434,217 $16,983,369 $5,346,106 -$11,637,263 -68.5% $4,105,594 331.0% % of Total Exports to Canada 0.4% 0.4% 0.4% 0.2% 0.3% 1.7% 0.5% -1.3% 0.1% Imports $34,580,237 $55,738,064 $48,873,684 $79,564,584 $72,892,469 $38,712,238 $41,886,623 $3,174,385 8.2% $7,306,386 21.1% % of Total Imports to Canada 4.2% 6.4% 5.4% 7.5% 5.3% 3.6% 3.3% -0.3% -0.9% Total Truck Trade Thru Raymond $35,820,749 $57,538,774 $51,109,128 $81,240,859 $76,326,686 $55,695,607 $47,232,729 -$8,462,878 -15.2% $11,411,980 31.9% % Total Trade with Canada 3.0% 4.5% 3.4% 4.4% 3.0% 2.7% 1.9% -0.8% -1.1% Rail Exports $0 $0 $0 #DIV/0! $0 #DIV/0! % of Total Exports to Canada 0.0% 0.0% 0.0% 0.0% 0.0% 0.0% 0.0% 0.0% 0.0% Imports $0 $0 $0 #DIV/0! $0 #DIV/0! % of Total Imports to Canada 0.0% 0.0% 0.0% 0.0% 0.0% 0.0% 0.0% 0.0% 0.0% Total Truck Trade Thru Raymond $0 $0 $0 $0 $0 $0 $0 #DIV/0! $0 #DIV/0! % Total Trade with Canada 0.0% 0.0% 0.0% 0.0% 0.0% 0.0% 0.0% 0.0% 0.0% TOTAL Exports $1,240,512 $1,800,710 $2,235,444 $1,676,275 $3,434,217 $16,983,369 $5,346,106 -$11,637,263 -68.5% $4,105,594 331.0% % of Total Exports to Canada 0.3% 0.3% 0.3% 0.2% 0.2% 1.4% 0.3% -1.0% 0.1% Imports $34,580,237 $55,738,064 $48,873,684 $79,564,584 $72,892,469 $38,712,238 $41,886,623 $3,174,385 8.2% $7,306,386 21.1% % of Total Imports to Canada 3.2% 4.8% 3.9% 5.1% 3.1% 2.5% 2.3% -0.2% -0.9% Total Trade Thru Raymond $35,820,749 $57,538,774 $51,109,128 $81,240,859 $76,326,686 $55,695,607 $47,232,729 -$8,462,878 -15.2% $11,411,980 31.9% % Total Trade with Canada 2.3% 3.4% 2.6% 3.2% 2.0% 2.0% 1.4% -0.6% -0.9%
  • 7. North Dakota Trading Relationships -- 2004 - 2010 Mexico Domestic Canada Sweetgrass, MT Truck Exports $7,326,593 $5,696,813 $6,948,569 $10,235,884 $13,563,595 $10,665,250 $20,014,338 $9,349,088 87.7% $12,687,745 173.2% % of Total Exports to Canada 2.1% 1.4% 1.2% 1.3% 1.2% 1.1% 1.8% 0.7% -0.3% Imports $10,219,204 $12,971,810 $12,298,527 $33,064,108 $52,943,493 $30,832,171 $61,217,106 $30,384,935 98.5% $50,997,902 499.0% % of Total Exports to Canada 1.2% 1.5% 1.4% 3.1% 3.9% 2.9% 4.8% 1.9% 3.5% Total Truck Trade Thru Sweetgrass 17,545,797 $18,668,623 $19,247,096 $43,299,992 $66,507,088 $41,497,421 $81,231,444 $39,734,023 95.8% $63,685,647 363.0% % Total Trade with Canada 1.5% 1.4% 1.3% 2.3% 2.6% 2.0% 3.3% 1.3% 1.9% Rail Exports $4,911,997 $3,792,971 $12,169,175 $18,743,569 $17,537,401 $17,869,850 $6,606,914 -$11,262,936 -63.0% $1,694,917 34.5% % of Total Exports to Canada 4.4% 3.4% 9.6% 9.3% 7.5% 7.3% 1.6% -5.7% -2.8% Imports $5,803,312 $4,795,417 $3,141,194 $2,673,782 $6,195,214 $5,459,822 $8,241,861 $2,782,039 51.0% $2,438,549 42.0% % of Total Exports to Canada 2.4% 1.6% 0.9% 0.5% 0.6% 1.1% 1.5% 0.4% -0.9% Total Rail Trade Thru Sweet Grass $10,715,309 $8,588,388 $15,310,369 $21,417,351 $23,732,615 $23,329,672 $14,848,775 -$8,480,897 -36.4% $4,133,466 38.6% % Total Trade with Canada 3.0% 2.1% 3.2% 3.1% 2.0% 3.1% 1.6% -1.6% -1.5% TOTAL Exports $12,238,590 $9,489,784 $19,117,744 $28,979,453 $31,100,996 $28,535,100 $26,621,252 -$1,913,848 -6.7% $14,382,662 117.5% % of Total Exports to Canada 2.6% 1.8% 2.6% 2.9% 2.2% 2.3% 1.7% -0.6% -0.9% Imports $16,022,516 $17,767,227 $15,439,721 $35,737,890 $59,138,707 $36,291,993 $69,458,967 $33,166,974 91.4% $53,436,451 333.5% % of Total Imports to Canada 1.5% 1.5% 1.2% 2.3% 2.5% 2.3% 3.8% 1.5% 2.3% Total Trade Thru Sweet Grass $28,261,106 $27,257,011 $34,557,465 $64,717,343 $90,239,703 $64,827,093 $96,080,219 $31,253,126 48.2% $67,819,113 240.0% % Total Trade with Canada 1.8% 1.6% 1.7% 2.5% 2.4% 2.3% 2.8% 0.5% 1.0% Portal, ND Truck Exports $86,828,752 $116,233,617 $188,724,374 $246,261,952 $357,392,062 $383,936,666 $496,627,326 $112,690,660 29.4% $409,798,574 472.0% % of Total Exports to Canada 24.6% 27.7% 31.7% 31.1% 30.3% 39.0% 43.5% 4.5% 18.9% Imports $126,385,029 $158,663,144 $196,457,991 $166,476,410 $323,527,624 $264,048,444 $347,985,655 $83,937,211 31.8% $221,600,626 175.3% % of Total Imports to Canada 15.3% 18.2% 21.7% 15.6% 23.7% 24.6% 27.1% 2.5% 11.8% Total Truck Trade Thru Portal $213,213,781 $274,896,761 $385,182,365 $412,738,362 $680,919,686 $647,985,110 $844,612,981 $196,627,871 30.3% $631,399,200 296.1% % Total Trade with Canada 18.1% 21.3% 25.6% 22.2% 26.8% 31.5% 34.8% 3.4% 16.7% Rail Exports $63,595,039 $59,220,419 $59,544,101 $111,054,242 $89,927,676 $146,680,644 $315,941,225 $256,397,124 115.4% $252,346,186 396.8% % of Total Exports to Canada 57.0% 52.7% 46.8% 55.1% 38.6% 59.7% 77.6% 17.9% 20.6% Imports $142,132,619 $213,028,616 $262,741,465 $343,375,249 $706,705,264 $331,106,836 $334,464,345 $71,722,880 1.0% $192,331,726 135.3% % of Total Imports to Canada 59.0% 71.5% 74.6% 69.1% 73.3% 66.8% 62.1% -4.8% 3.0% Total Rail Trade Thru Portal $205,727,658 $272,249,035 $322,285,566 $454,429,491 $796,632,940 $477,787,480 $650,405,570 $328,120,004 36.1% $444,677,912 216.1% % Total Trade with Canada 58.4% 66.3% 67.2% 65.1% 66.6% 64.5% 68.8% 4.3% 10.4% TOTAL Exports $150,423,791 $175,454,036 $248,268,475 $357,316,194 $447,319,738 $530,617,310 $812,568,551 $281,951,241 53.1% $662,144,760 440.2% % of Total Exports to Canada 32.4% 33.0% 34.4% 36.0% 31.7% 43.1% 52.4% 9.3% 20.0% Imports $268,517,648 $371,691,760 $459,199,456 $509,851,659 $1,030,232,888 $595,155,280 $682,450,000 $87,294,720 14.7% $413,932,352 154.2% % of Total Imports to Canada 25.2% 31.8% 36.5% 32.7% 44.2% 37.9% 37.4% -0.5% 12.3% Total Trade Thru Portal $418,941,439 $547,145,796 $707,467,931 $867,167,853 $1,477,552,626 $1,125,772,590 $1,495,018,551 $369,245,961 32.8% $1,076,077,112 256.9% % Total Trade with Canada 27.4% 32.2% 35.7% 33.9% 39.5% 40.2% 44.3% 4.1% 17.0%
  • 8. North Dakota Trading Relationships -- 2004 - 2010 Mexico Domestic Canada Wild Horse 0 Truck Exports $0 $0 $0 $0 $0 $0 $0 $0 #DIV/0! $0 #DIV/0! % of Total Exports to Canada 0.0% 0.0% 0.0% 19.4% 0.0% 0.0% 0.0% 0.0% 0.0% Imports $23,762 $100,659 $112,331 $220,824 $179,929 $800,471 $11,407 -$789,064 -98.6% -$12,355 -52.0% % of Total Imports to Canada 0.0% 0.0% 0.0% 19.0% 0.0% 0.1% 0.0% -0.1% 0.0% Total Truck Trade Thru GPITC $23,762 $100,659 $112,331 $220,824 $179,929 $800,471 $11,407 -$789,064 -98.6% -$12,355 -52.0% % Total Trade with Canada 0.0% 0.0% 0.0% 19.3% 0.0% 0.0% 0.0% 0.0% 0.0% Rail Exports $0 $0 #DIV/0! $0 #DIV/0! % of Total Exports to Canada 0.0% 0.0% 0.0% 11.0% 0.0% 0.0% 0.0% 0.0% 0.0% Imports $0 $0 #DIV/0! $0 #DIV/0! % of Total Imports to Canada 0.0% 0.0% 0.0% 22.4% 0.0% 0.0% 0.0% 0.0% 0.0% Total Rail Trade Thru GPITC $0 $0 $0 $0 $0 $0 $0 $0 #DIV/0! $0 #DIV/0! % Total Trade with Canada 0.0% 0.0% 0.0% 17.7% 0.0% 0.0% 0.0% 0.0% 0.0% TOTAL Exports $0 $0 $0 $0 $0 $0 $0 $0 #DIV/0! $0 #DIV/0! % of Total Exports to Canada 0.0% 0.0% 0.0% 0.0% 0.0% 0.0% 0.0% 0.0% 0.0% Imports $23,762 $100,659 $112,331 $220,824 $179,929 $800,471 $11,407 -$789,064 -98.6% -$12,355 -52.0% % of Total Imports to Canada 0.0% 0.0% 0.0% 0.0% 0.0% 0.1% 0.0% -0.1% 0.0% Total Trade Thru GPITC $23,762 $100,659 $112,331 $220,824 $179,929 $800,471 $11,407 -$789,064 -98.6% -$12,355 -52.0% % Total Trade with Canada 0.0% 0.0% 0.0% 0.0% 0.0% 0.0% 0.0% 0.0% 0.0% GPITC #DIV/0! Truck Exports $95,395,857 $123,731,140 $197,908,387 $258,174,111 $374,389,874 $411,585,285 $521,987,770 $110,402,485 26.8% $426,591,913 447.2% % of Total Exports to Canada 27.1% 29.5% 33.2% 32.6% 31.8% 41.8% 45.7% 3.9% 18.6% Imports $137,868,507 $173,536,323 $211,104,293 $201,437,617 $380,085,263 $312,664,455 $414,560,274 $101,895,819 32.6% $276,691,767 200.7% % of Total Imports to Canada 16.7% 19.9% 23.3% 18.9% 27.8% 29.1% 32.3% 3.2% 15.6% Total Truck Trade Thru GPITC $233,264,364 $297,267,463 $409,012,680 $459,611,728 $754,475,137 $724,249,740 $936,548,044 $212,298,304 29.3% $703,283,680 301.5% % Total Trade with Canada 19.8% 23.0% 27.2% 24.8% 29.7% 35.2% 38.6% 3.4% 18.8% Rail Exports $68,507,036 $63,013,390 $71,713,276 $129,797,811 $107,465,077 $164,550,494 $322,548,139 $157,997,645 96.0% $254,041,103 370.8% % of Total Exports to Canada 19.4% 15.0% 12.0% 16.4% 9.1% 16.7% 28.2% 11.5% 8.8% Imports $147,935,931 $217,824,033 $265,882,659 $346,049,031 $712,900,478 $336,566,658 $342,706,206 $6,139,548 1.8% $194,770,275 131.7% % of Total Imports to Canada 17.9% 25.0% 29.3% 32.5% 52.2% 31.3% 26.7% -4.6% 8.8% Total Rail Trade Thru GPITC $216,442,967 $280,837,423 $337,595,935 $475,846,842 $820,365,555 $501,117,152 $665,254,345 $164,137,193 32.8% $448,811,378 207.4% % Total Trade with Canada 18.4% 21.8% 22.5% 25.6% 32.2% 24.3% 27.4% 3.1% 9.0% TOTAL Exports $163,902,893 $186,744,530 $269,621,663 $387,971,922 $481,854,951 $576,135,779 $844,535,909 $268,400,130 46.6% $680,633,016 415.3% % of Total Exports to Canada 35.3% 35.1% 37.3% 39.1% 34.1% 46.8% 54.5% 7.7% 19.2% Imports $285,804,438 $391,360,356 $476,986,952 $547,486,648 $1,092,985,741 $649,231,113 $757,266,480 $108,035,367 16.6% $471,462,042 165.0% % of Total Imports to Canada 26.8% 33.5% 37.9% 35.1% 46.9% 41.3% 41.5% 0.2% 14.7% Total Trade Thru GPITC $449,707,331 $578,104,886 $746,608,615 $935,458,570 $1,574,840,692 $1,225,366,892 $1,601,802,389 $376,435,497 30.7% $1,152,095,058 256.2% % Total Trade with Canada 29.4% 34.0% 37.7% 36.6% 42.1% 43.7% 47.5% 3.8% 18.1%
  • 9. North Dakota Trading Relationships -- 2004 - 2010 Mexico Domestic Canada 2010 Leading Exports from North Dakota to Canada (Surface 2010 2010 Leading Exports from North Dakota to Canada (Surface 2010 Transportation) Transportation) Rank Export Rank Alberta Export 1 84 Computer-Related Machinery and Parts $290,858,481 1 27 Mineral Fuels; Oils and Waxes $147,640,435 2 27 Mineral Fuels; Oils and Waxes $282,077,356 2 31 Fertilizers $142,504,571 3 87 Vehicles Other than Railway $275,596,016 3 28 Inorganic Chemicals $99,842,614 4 15 Animal or Vegetable Fats and Oils $231,998,460 4 84 Computer-Related Machinery and Parts $91,066,201 5 10 Cereals $92,960,713 5 73 Articles of Iron and Steel $27,639,844 6 23 Food Residues and Waste $55,925,479 6 94 Furniture; Lamps and Prefabricated Buildings $22,765,875 7 12 Oil Seeds and Oleaginous Fruits $55,347,351 7 71 Pearls; Stones; Metals and Imitation Jewelry $19,224,504 8 29 Organic Chemicals $37,555,434 8 29 Organic Chemicals $12,672,570 9 7 Edible Vegetables and Roots $32,094,377 9 25 Salt; Sulfur; Plaster and Cement $11,501,834 10 38 Miscellaneous Chemical Products $27,821,145 10 39 Plastics and Articles $9,258,800 2010 Leading Imports to North Dakota from Canada (Surface 2010 2010 Leading Exports from North Dakota to Canada (Surface 2010 Rank Import Rank British Colombia Export 1 12 Oil Seeds and Oleaginous Fruits $333,689,447 1 44 Wood and Articles $7,784,137 2 84 Computer-Related Machinery and Parts $268,302,498 2 87 Vehicles Other than Railway $4,519,312 3 27 Mineral Fuels; Oils and Waxes $238,777,127 3 84 Computer-Related Machinery and Parts $2,078,236 4 31 Fertilizers $213,209,921 4 85 Electrical Machinery; Equipment and Parts $631,771 5 28 Inorganic Chemicals $125,058,137 5 94 Furniture; Lamps and Prefabricated Buildings $603,926 6 87 Vehicles Other than Railway $122,985,890 6 39 Plastics and Articles $467,880 7 73 Articles of Iron and Steel $81,576,892 7 21 Miscellaneous Edible Preparations $449,534 8 98 Special Classification Provisions $61,041,179 8 95 Toys; Games and Sport Equipment $374,440 9 10 Cereals $53,876,443 9 28 Inorganic Chemicals $365,273 10 72 Iron and Steel $41,427,220 10 12 Oil Seeds and Oleaginous Fruits $346,226 2010 Leading Exports from North Dakota to Canada (Surface 2010 Rank Saskatchewan Export 1 12 Oil Seeds and Oleaginous Fruits $83,891,118 2 84 Computer-Related Machinery and Parts $72,708,869 3 27 Mineral Fuels; Oils and Waxes $53,656,921 4 31 Fertilizers $49,764,041 5 10 Cereals $41,331,686 6 38 Miscellaneous Chemical Products $25,040,929 7 28 Inorganic Chemicals $18,748,392 8 1 Live Animals $7,713,550 9 73 Articles of Iron and Steel $7,209,736 10 44 Wood and Articles $3,748,657