SlideShare uma empresa Scribd logo
1 de 8
Baixar para ler offline
November 18, 2010
                                                                                                Jason Napodano, CFA
                    Equity Research                                                                     312-265-9421
                                                                                               jnapodano@zacks.com


 www.zacks.com                                                              111 North Canal Street, Chicago, IL 60606


 Aastrom Biosciences, Inc.                         (ASTM-NASDAQ)

ASTM: No Change To Our Thesis Following                    UPDATE
The RESTORE-CLI Data...
                                                        Aastrom Bio shares will most likely be under significant selling
 Current Recommendation                Outperform       pressure the next few days as the excitement bubble bursts
                                                                          nd
                                                        following the 2 interim update from RESTORE-CLI. We
 Prior Recommendation                       Neutral     view this as typical biotech trading. In the long-run, we are
 Date of Last Change                    11/08/2010      still very comfortable with Aastrom’s position. We are not
                                                        spooked by the data from RESTORE-CLI at all. This was a
 Current Price (11/18/10)                     $2.57     small trial will low statistical powering that accomplished its
                                              $5.00     goal – establish proof-of-concept and position the company to
 Target Price                                           enter a phase III registration program. We would be buyers of
                                                        Aastrom’s stock on weakness relating to the RESTORE-CLI
                                                        data or the impending cash raise. Our NPV calculations peg
                                                        Aastrom fairly-valued at roughly $5 per share – market
                                                        capitalization of $140 million.

SUMMARY DATA
 52-Week High                             $4.20           Risk Level                                       Above Average
 52-Week Low                              $1.34           Type of Stock                                      Small-Growth
 One-Year Return (%)                      71.01           Industry                                       Med-Biomed/Gene
 Beta                                     -0.06           Zacks Rank in Industry                                 72 of 141
 Average Daily Volume (sh)            3,054,582
                                                       ZACKS ESTIMATES
 Shares Outstanding (mil)                     28
                                                       Revenue
 Market Capitalization ($mil)              $119        (In millions of $)
 Short Interest Ratio (days)                1.30                       Q1            Q2        Q3                Q4        Year
 Institutional Ownership (%)                  14                      (Mar)         (Jun)     (Sep)             (Dec)      (Dec)
 Insider Ownership (%)                         1
                                                        2010           0.07 A        0.02 A         0A              0A      0.09 A
                                                        2011                 0A        0E           0E              0E         0E
 Annual Cash Dividend                      $0.00
                                                        2012                                                                   0E
 Dividend Yield (%)                         0.00
                                                        2013                                                                   0E
 5-Yr. Historical Growth Rates
                                                       Earnings per Share
   Sales (%)                                N/A        (EPS is operating earnings before non-recurring items)
   Earnings Per Share (%)                   N/A                        Q1            Q2         Q3               Q4        Year
   Dividend (%)                             N/A                       (Mar)         (Jun)      (Sep)            (Dec)      (Dec)
                                                         2010        -$0.18 A      -$0.21 A   -$0.16 A          -$0.18 A   -$0.72 A
 P/E using TTM EPS                          N/A          2011        -$0.21 A      -$0.21 E   -$0.23 E          -$0.27 E   -$0.92 E
                                                         2012                                                              -$1.00 E
 P/E using 2011 Estimate                    N/A
                                                         2013                                                              -$0.97 E
 P/E using 2012 Estimate                    N/A
                                                       Zacks Projected EPS Growth Rate - Next 4 Years %                       N/A
 Zacks Rank                                    3


 © Copyright 2010, Zacks Investment Research. All Rights Reserved.
WHAT’S NEW

    RESTORE-CLI Update

    On November 18, 2010 at the VEITHsymposium satellite event in NYC, Dr. Richard Powell, principal investigator for
    the RESTORE-CLI program, presented a second interim update from the trial. The data included an update from
    an additional 26 patients, 72 in total, who completed the study.

    …Backgrounder on RESTORE-CLI…

    RESOTRE-CLI was initiated in April 2007. The trial is a double-blind, multi-center phase IIb program with the
    primary outcome of the program assessing safely in treating patients with PAD-induced CLI. The ability to reduce
    the incidence of major amputations in the treated limbs, close open wounds, improve blood flow, and improve
    overall quality of life was also assessed. Patients enrolling in the program were deemed to have “no acceptable
    option for revascularization” to treat their condition. The program randomized patients into 2-arms (2:1 ratio) of: 1)
    expanded cells administered intramuscularly vs. 2) control (electrolyte solution). Both groups continue to also
    receive the standard of care appropriate for their medical condition.

    RESTORE-CLI completed enrollment at 86 patients across 18 clinical sites in March 2010. In June 2010, Aastrom
    reported the first interim results from RESTORE-CLI at the annual meeting for the Society for Vascular Surgery.
    Data included 46 patients at the 6 month timeframe and 30 patients at the 12 month timeframe. The results from
    the second interim update on 72 patients were presented at the VEITHsymposium satellite event in November
    2010. The two key points were as follows:

    On Time To Treatment Failure…
                                                                                  st
                                 Efficacy Assessment on ITT Population – 1 Interim
                                                           TRC             Control
                            Parameter
                                                          (n=32)           (n=14)
                                          Amputation       25%              43%
                                  De Novo Gangrene         16%              14%
                              Doubling in Wound Size       19%              36%
                                  All Cause Mortality       3%               7%
                                    Treatment Failure      41%              79%                         p = 0.0053

                                                                                  nd
                                 Efficacy Assessment on ITT Population – 2 Interim
                                                           TRC             Control
                            Parameter
                                                          (n=16)           (n=10)
                                          Amputation       13%               0%
                                  De Novo Gangrene          6%              30%
                              Doubling in Wound Size       19%              20%
                                   All Cause Mortality     13%               0%
                                     Treatment Failure            42%                  63%               p < 0.05


                                  Efficacy Assessment on ITT Population – TOTAL
                                                           TRC             Control
                            Parameter
                                                          (n=48)           (n=24)
                                          Amputation       21%              25%
                                  De Novo Gangrene         13%              21%
                              Doubling in Wound Size       19%              29%
                                  All Cause Mortality       6%               4%
                                     Treatment Failure            42%                  63%              p = 0.0132


Zacks Investment Research                                Page 2                                        www.zacks.com
Results for the primary endpoint of the phase 2b program were statistically significant for Time to Treatment Failure
    at p = 0.0132. The graph below shows the clear separation between TRC and the control for the entire population.
    The bar chart breaks down the individual components of Treatment Failure, where we see that each was
    meaningfully in-favor of TRC vs. the control.


    Conclusion: The Time to Treatment Failure composite endpoint was clearly a success in RESTORE-CLI. The p-
    value of 0.0132 is incredibly strong considering only 72 patients were included. We would have liked to see better
    data with respect to “Death” and “Amputation”, but these are things we expect will continue to separate upon the
    final analysis of the program expected in May 2011.

    On Amputation Free Survival…
                                                                                 st
                                Efficacy Assessment on ITT Population – 1 Interim
                                                          TRC             Control
                           Parameter
                                                         (n=32)           (n=14)
                            Amputation Free Survival      78%              50%                        p = 0.0376


                                 Efficacy Assessment on ITT Population – TOTAL
                                                          TRC             Control
                           Parameter
                                                         (n=48)           (n=24)
                            Amputation Free Survival      75%              71%                        p = 0.5541


    This is the key endpoint in the eyes of the U.S. FDA. This is what Aastrom will design the upcoming phase III to
    detect. The results from RESTORE-CLI show a favorable trend, but failed to meet statistical significance. We
    believe this was due to a number of factors. Mainly, the control group at the backend of the trial responded
    significantly better than expected. Some reasons why:
                                                                                  st
        Excitement from the medical community grew significantly following the 1 interim update. It is possible that
                                                                                   st    nd
        patients received a significant step-up in quality-of-care in-between the 1 and 2 analysis. The step-up in
        medical care could have reduced the event rate.

        Patients may have skewed a little “less sick” as the trial completed enrollment. There is nothing mechanistically
        speaking that would cause TRC to not work in this population, but a less sick population will certainly have less
        events (MACE, amputation, death) in a 12-month time period. Management noted that of the 10 new control
                                                st      nd
        patients that were added between the 1 and 2 analysis, there were no events during months 7-12. Just 2 or
        3 events, which you would assume given the ~30% net event rate, would have made the this endpoint
        statistically significant at p<0.05.

        Amputations are subjective and a placebo effect was clearly evident. Pain scores are a major contributor to the
        decision to amputate. Things like de novo gangrene and wound size are clearly not subjective and showed
        statistical significance in favor of TRC. However, pain is subjective and with less reported pain it is possible
        physicians were delaying amputations accordingly. This is something we expect will mitigate as the trial
        progresses to the final analysis. Placebo response does not actually delay disease progression.


Zacks Investment Research                              Page 3                                        www.zacks.com
st    nd
    Conclusion: The chart above clearly shows the big change in control response from the 1 to 2 update. We are
    encouraged by the fact that TRC behaved remarkably consistent throughout the trial. Assuming management can
    alleviate some of the placebo effect in the phase III trial through better patient selection and more standardized
    care, if TRC offers up an amputation free survival rate of ~75%, while the control trends to the expected ~65%, the
    phase III trial will most definitely meet statistical significance with 450-500 patients.

    On Safety Assessment…

    Safety was a paramount concern during the trial. Management enrolled a total of 86 patients. Only 72 progressed
    to treatment. Fourteen (14) patients were not treated for various reasons:

            Some did not meet entry criteria upon further review prior to bone aspiration.
            Some could not tolerate the bone aspiration.
            Some of the bone aspirate was contaminated or could not be expanded under Aastrom’s technology.
            Some had amputations in-between the bone aspiration and the injection (2-weeks).
            Some had significant adverse events in-between the bone aspiration and the injection (2-weeks).
            Some provided bone aspirate for expansion, but never returned for injection.

    Patients that did undergo the procedure generally responded well. Adverse events (AEs) were high, as expected,
    but nothing was significantly higher in the TRC group vs. the control.

                                   Safety Assessment on ITT Population - TOTAL
                                                               TRC             Control
                                Parameter
                                                              (n=53)            (n=24)
                         Number (%) with Adverse Events      46 (87%)          22 (92%)
                                        Number of Deaths      3 (6%)            1 (4%)
                   Number (%) with Serious Adverse Events    23 (43%)          12 (50%)
                        Number (%) Withdrawal due to AE       1 (2%)               0


    What’s Next?

    …SPA Under Review…

    In mid-October 2010, Aastrom announced that it had submitted a special protocol assessment (SPA) on the
    company's phase III clinical development program in CLI. The SPA allows for close consultation with the agency on
    the protocol design and necessary endpoints for approval. We expect the FDA will respond back in mid-December
    2010 (approx. 60 days from filing). We expect that Aastrom will need to make some minor adjustments to the
    protocol based on the FDA’s response in December, and thus one additional round of filing and response may push
    the initiation of the program back to late March / early April 2011. This actually works in management favor, as they
                                                                                           nd
    can now incorporate minor changes given what the company has learned from the 2 interim update on
    RESTORE-CLI and Sanofi-Aventis’ phase III failure with NV1-FGF in the TALSIMAN-201 program.


Zacks Investment Research                              Page 4                                        www.zacks.com
We expect that the phase III program will look similar to the phase IIb RESTORE-CLI program. Management may
    focus the patient population to be more homogeneous in nature to lower variability and risk. We expect there to be
    two phase III trials in the program, with in the area of 500 patients total between two arms. The primary endpoint
    will be amputation-free survival at 12 months, with secondary endpoints including amputation, de novo gangrene,
    wound healing, and all cause mortality. Management may look to enroll a “less sick” population in one of the two
    phase III programs, but at this time we are still waiting for the final protocol.

    Enrollment should proceed faster than the phase IIb program now that management has identified the key wound
    care centers and vascular surgeons from the RESTORE-CLI program. We expect approximately 50 sites in the
    U.S. and Canada to participate. Site selection and enrollment criteria will be instrumental to the success of the
    program. Enrollment should take between 12 to 18 months to complete.

    The total cost should be roughly $15 to $20 million, or $30-40k per patient. We note this is relatively inexpensive for
    a pivotal phase III program. The design and costs are more in-line with a medical device than a small molecule
    pharmaceutical. In late October 2010, Aastrom Bio signed a new strategic manufacturing partnership with ATEK
    Medical. ATEK will supply the disposable cassettes used during the cell therapy procedure. The relationship puts a
    more comprehensive and long-term supply agreement into place ahead of the phase III program. This should work
    to alleviate supply or logistic issues that could materialize during the program.

    …FDA Grants Fast Track Status for CLI…

    Also in October 2010, the U.S. FDA granted a Fast Track designation to Aastrom’s cell therapy development
    program for CLI. The FDA's fast track program is designed to facilitate the development and expedite the review of
    new drugs and biologics intended to treat serious or life-threatening conditions and that demonstrate the potential to
    address unmet medical needs. CLI clearly falls into this category.

        Critical limb ischemia (CLI) affects approximately 1 million people in the U.S. each year -- roughly 2% of the
        population over the age of 50. Over 25% of patients with PAD will eventually development CLI. CLI is defined
        as inadequate blood flow to the limbs, and if left untreated can result in tissue loss, gangrene, amputation and
        death. In fact, CLI leads to an average of 150,000 major limb amputations each year. CLI has a high mortality
        rate: 20% after 6-months after initial diagnosis and 25% after 12-months. Nearly 30% of all patients who
        undergo a major limb amputation will require another amputation at some point in the future. The mortality rate
        post-amputation remains high, at roughly 25%.

    Fast track-designated drugs and biologics ordinarily qualify for priority review, thereby expediting the review
    process. In addition, the designation may allow Aastrom to submit portions of the biologic license application (BLA)
    on a rolling submission basis. For a company of Aastrom’s size, it’s a significant benefit in our view.

    …Market for CLI Remains Wide Open…

    Therapeutic options for patients with CLI are limited. Besides being at significantly increased risk for heart attack,
    stroke or vascular death, patients with CLI often live with several other co-morbidities, including diabetes, angina,
    dyslipidemia, hypertension and renal disease. For less severe forms of PAD, physicians will typically recommend
    smoking cessation (when applicable), and changes to diet and exercise.

    Medications such as aspirin, statins and clopidogrel (Plavix) are common first-line therapies for early-stage PAD.
    Many patients will also be on medications for diabetes and heart failure as well. However, once PAD progresses to
    the point of CLI, the only real options available to patients are surgical. Patients are passed from the cardiologist,
    diabetologist or podiatrist to the care of the vascular surgeon. Surgical procedures include percutaneous
    transluminal angioplasty, plaque excision, stenting and bypass grafting. Patients living with CLI suffer from severe
    pain as a result of the neuropathy, tissue loss and ischemia. The healthcare burden associated with PAD-related
    amputations in the U.S. is greater than $10 billion per year.


Zacks Investment Research                                Page 5                                        www.zacks.com
Cash Raise Coming Soon…

    Management has guided to external R&D costs associated with the RESTORE-CLI program of $15 to $20 million.
    We expect approximately half of these costs to take place in calendar 2011. Our financial model forecasts cash at
    the end of calendar 2010 of approximately $10.5 million.

    On November 12, 2010, Aastrom filed a $75 million mixed securities shelf. We do not expect the company to see to
    raise this much cash at one time. More likely is that the company finances to the next major event, which will be the
     st
    1 interim analysis of the phase III trial after 200-250 patients have completed treatment. This will most likely be
    around mid-2012. We note there are several other catalysts before this time, including the full analysis from
    RESTORE-CLI in May 2011, along with meaningful updates from the Dilated Cardiomyopathy (DCM) program
    during the first half of 2011.

    We suspect that management will look to raise cash of approximately $25 million before the end of the year. This
    will be enough to fund operations in 2012. We are also aware that the company has entered “CDA” with several
    firms on collaborating for both CLI and DCM. We believe these talks center around the Ex-North American rights to
    TRC in CLI or DCM. Management is looking to commercialize TRC in North America alone. After all, they are
    footing the bill for the phase III trial and will be in close contact with approximately 50 centers around the U.S. and
    Canada throughout the next few years while the trial is active. No company will be in better position from a market
    awareness standpoint than Aastrom. A deal Ex-N.A. for sizable upfront cash could fund the expansion of an
    internal sales force to promote TRC post-approval. This is not a primary-care “pound-the-street” indication.
    Aastrom could easily build and manage the small specialty sales force necessary to see TRC achieve blockbuster
    sales if the data backs up the claim.


    Outperform Rating / $5 Price Target

    Aastrom Bio shares will most likely be under significant selling pressure the next few days as the excitement bubble
                           nd
    bursts following the 2 interim update from RESTORE-CLI. We view this as typical biotech trading. In the long-
    run, we are still very comfortable with Aastrom’s position. We are not spooked by the data from RESTORE-CLI at
    all. This was a small trial will low statistical powering that accomplished its goal – establish proof-of-concept and
    position the company to enter a phase III registration program. We would be buyers of Aastrom’s stock on
    weakness relating to the RESTORE-CLI data or the impending cash raise. Our NPV calculations peg Aastrom
    fairly-valued at roughly $5 per share – market capitalization of $140 million.


Zacks Investment Research                               Page 6                                         www.zacks.com
PROJECTED FINANCIALS


Aastrom Biosciences
Income Statement


                                                Jun-10      Sep-10         Dec-10       Mar-11     Jun-11     Jun-11      Jun-12      Jun-13      Jun-14
     Aastrom Biosciences
                                                2010 A       Q1 A           Q2 E         Q3 E       Q4 E      2011 E      2012 E      2013 E      2014 E
        R&D Agreements / Grants                    $0         $0               $0         $0         $0          $0          $0          $0          $0
                                  YOY Growth       0%           -                   -      -          -           0%         0%          0%          0%
           Product Sales & Rentals               $0.089       $0               $0         $0         $0          $0          $0          $0          $0
                                  YOY Growth        -           -                   -      -          -            -        0.0%        0.0%        0.0%

 Total Revenues                                  $0.089       $0               $0         $0         $0          $0          $0          $0          $0
                                  YOY Growth      -51.1%        -                   -      -          -         -100.0%       -           -           -
    Cost of Product Sales & Rentals              $0.034       $0                $0        $0         $0           $0         $0          $0          $0
                        Product Gross Margin       0%           -                   -      -          -            -          -           -           -
            Research & Development               $12.658     $4.167          $4.250      $5.000     $6.000     $19.417     $25.000     $25.000     $20.000
                                       % R&D     14222.5%       -                   -      -          -            -          -           -           -
         Selling, General, and Admin             $5.201      $1.686          $1.700      $1.750     $1.800     $6.936      $7.250      $8.000      $9.000
                                      % SG&A     5843.8%        -                   -      -          -            -          -           -           -

 Operating Income                               ($17.804)   ($5.853)       ($5.950)     ($6.750)   ($7.800)   ($26.353)   ($32.250)   ($33.000)   ($29.000)
                            Operating Margin        -           -                   -      -          -            -          -           -           -
           Other Income (Expenses)               $0.075      $0.020          $0.026      $0.055     $0.045     $0.146      $0.120      $0.130      $0.200
 Pre-Tax Income                                 ($17.729)   ($5.833)       ($5.924)     ($6.695)   ($7.755)   ($26.207)   ($32.130)   ($32.870)   ($28.800)
       Taxes & Other Charges                       $0         $0                $0        $0         $0           $0         $0          $0          $0
                                     Tax Rate      0%         0%                0%        0%         0%           0%         0%          0%          0%

 Net Income                                     ($17.729)   ($5.833)       ($5.924)     ($6.695)   ($7.755)   ($26.207)   ($32.130)   ($32.870)   ($28.800)
                                  Net Margin        -           -                   -      -          -            -          -           -           -

 Reported EPS                                   ($0.72)     ($0.21)         ($0.21)     ($0.23)    ($0.27)    ($0.92)     ($1.00)     ($0.97)     ($0.80)
                                  YOY Growth        -           -                   -      -          -            -          -           -           -
                       FAS-123R Expense            $0.7       $0.2             $0.2       $0.2       $0.3        $0.9       $1.1        $1.5        $2.0
           Weighted Ave. Shares Out               24.7        28.3            28.5        28.7       28.9        28.6       32.0        34.0        36.0
 Source: Zacks Investment Research, Inc.                      Jason Napodano, CFA


   © Copyright 2010, Zacks Investment Research. All Rights Reserved.
HISTORICAL ZACKS RECOMMENDATIONS


     DISCLOSURES

     The analysts contributing to this report do not hold any shares of ASTM.

     Zacks Investment Research may have, or seeks to have, a business relationship with the companies listed in this report. Additionally, the
     analysts contributing to this report certify that the views expressed herein accurately reflect the analysts’ personal views as to the subject
     securities and issuers. Zacks certifies that no part of the analysts’ compensation was, is, or will be, directly or indirectly, related to the specific
     recommendation or views expressed by the analyst in the report. Additional information on the securities mentioned in this report is available
     upon request. This report is based on data obtained from sources we believe to be reliable, but is not guaranteed as to accuracy and does not
     purport to be complete. Because of individual objectives, the report should not be construed as advice designed to meet the particular
     investment needs of any investor. Any opinions expressed herein are subject to change. This report is not to be construed as an offer or the
     solicitation of an offer to buy or sell the securities herein mentioned. Zacks or its officers, employees or customers may have a position long or
     short in the securities mentioned and buy or sell the securities from time to time. Zacks uses the following rating system for the securities it
     covers. Outperform- Zacks expects that the subject company will outperform the broader U.S. equity market over the next one to two quarters.
     Neutral- Zacks expects that the company will perform in line with the broader U.S. equity market over the next one to two quarters.
     Underperform- Zacks expects the company will under perform the broader U.S. Equity market over the next one to two quarters. The current
     distribution of Zacks Ratings is as follows on the 1007 companies covered: Outperform- 13.3%, Neutral- 79.8%, Underperform – 6.4%. Data is
     as of midnight on the business day immediately prior to this publication.


© Copyright 2010, Zacks Investment Research. All Rights Reserved.

Mais conteúdo relacionado

Destaque

1 s2.0-s1470204510701327-main
1 s2.0-s1470204510701327-main1 s2.0-s1470204510701327-main
1 s2.0-s1470204510701327-mainJames Hilbert
 
Claim based authentaication
Claim based authentaicationClaim based authentaication
Claim based authentaicationSean Xiong
 
Phase 2b emerge study of cdx 011
Phase 2b emerge study of cdx 011Phase 2b emerge study of cdx 011
Phase 2b emerge study of cdx 011James Hilbert
 
Bmn 110 ph12 results
Bmn 110 ph12 resultsBmn 110 ph12 results
Bmn 110 ph12 resultsJames Hilbert
 
Core db framework
Core db frameworkCore db framework
Core db frameworkSean Xiong
 
Cbli 2011 05 25 barda
Cbli 2011 05 25 bardaCbli 2011 05 25 barda
Cbli 2011 05 25 bardaJames Hilbert
 
Company presentation
Company presentationCompany presentation
Company presentationJames Hilbert
 
Dcth isolation perfusion
Dcth isolation perfusionDcth isolation perfusion
Dcth isolation perfusionJames Hilbert
 
Docetaxel Versus Docetaxel/Cisplatin in NSCLC
Docetaxel Versus Docetaxel/Cisplatin in NSCLCDocetaxel Versus Docetaxel/Cisplatin in NSCLC
Docetaxel Versus Docetaxel/Cisplatin in NSCLCJames Hilbert
 
Saras's - Planning tool
Saras's - Planning toolSaras's - Planning tool
Saras's - Planning toolhsceunice
 
Lovenox trial scheduling
Lovenox trial schedulingLovenox trial scheduling
Lovenox trial schedulingJames Hilbert
 
Novel therapies in hcc
Novel therapies in hccNovel therapies in hcc
Novel therapies in hccJames Hilbert
 

Destaque (17)

1 s2.0-s1470204510701327-main
1 s2.0-s1470204510701327-main1 s2.0-s1470204510701327-main
1 s2.0-s1470204510701327-main
 
Claim based authentaication
Claim based authentaicationClaim based authentaication
Claim based authentaication
 
Phase 2b emerge study of cdx 011
Phase 2b emerge study of cdx 011Phase 2b emerge study of cdx 011
Phase 2b emerge study of cdx 011
 
Clda bmo01
Clda bmo01Clda bmo01
Clda bmo01
 
Bmn 110 ph12 results
Bmn 110 ph12 resultsBmn 110 ph12 results
Bmn 110 ph12 results
 
Goldman mnta
Goldman mntaGoldman mnta
Goldman mnta
 
Core db framework
Core db frameworkCore db framework
Core db framework
 
Cbli 2011 05 25 barda
Cbli 2011 05 25 bardaCbli 2011 05 25 barda
Cbli 2011 05 25 barda
 
Company presentation
Company presentationCompany presentation
Company presentation
 
Dcth isolation perfusion
Dcth isolation perfusionDcth isolation perfusion
Dcth isolation perfusion
 
Alny
AlnyAlny
Alny
 
Docetaxel Versus Docetaxel/Cisplatin in NSCLC
Docetaxel Versus Docetaxel/Cisplatin in NSCLCDocetaxel Versus Docetaxel/Cisplatin in NSCLC
Docetaxel Versus Docetaxel/Cisplatin in NSCLC
 
Saras's - Planning tool
Saras's - Planning toolSaras's - Planning tool
Saras's - Planning tool
 
Lovenox trial scheduling
Lovenox trial schedulingLovenox trial scheduling
Lovenox trial scheduling
 
Novel therapies in hcc
Novel therapies in hccNovel therapies in hcc
Novel therapies in hcc
 
Optr 04052011
Optr 04052011Optr 04052011
Optr 04052011
 
Nsclc 2nd line
Nsclc 2nd lineNsclc 2nd line
Nsclc 2nd line
 

Semelhante a Astm restore cli update nov 2010

Bell Potter Securities Report on Mesoblast 1 31-2012
Bell Potter Securities Report on Mesoblast 1 31-2012Bell Potter Securities Report on Mesoblast 1 31-2012
Bell Potter Securities Report on Mesoblast 1 31-2012DailyDoseEquities
 
Scotiabank. alicorp _02_jan2013_185807_ids_505
Scotiabank. alicorp _02_jan2013_185807_ids_505Scotiabank. alicorp _02_jan2013_185807_ids_505
Scotiabank. alicorp _02_jan2013_185807_ids_505gro77
 
corning annual reports 2001
corning annual reports 2001corning annual reports 2001
corning annual reports 2001finance35
 
Credit suisse bac cs-1
Credit suisse bac cs-1Credit suisse bac cs-1
Credit suisse bac cs-1gro77
 
Jrn Initiate
Jrn InitiateJrn Initiate
Jrn Initiatettgoods
 
FifthThird 3Q08 Release_Final
FifthThird 3Q08 Release_FinalFifthThird 3Q08 Release_Final
FifthThird 3Q08 Release_Finalfinance28
 
FifthThird3Q08Release_Final
FifthThird3Q08Release_FinalFifthThird3Q08Release_Final
FifthThird3Q08Release_Finalfinance28
 
Baird September 2012 Facility Services Report
Baird September 2012 Facility Services ReportBaird September 2012 Facility Services Report
Baird September 2012 Facility Services ReportDavid Crace
 
Motherson Sumi Systems
Motherson Sumi Systems Motherson Sumi Systems
Motherson Sumi Systems Angel Broking
 
2011 - Q1 - Commentary
2011 - Q1 - Commentary2011 - Q1 - Commentary
2011 - Q1 - CommentaryDrew Beja
 
.monsanto 10-10-07
.monsanto 10-10-07.monsanto 10-10-07
.monsanto 10-10-07finance28
 
Monsanto Q4 2007 Financial Results
Monsanto Q4 2007 Financial ResultsMonsanto Q4 2007 Financial Results
Monsanto Q4 2007 Financial Resultsearningsreport
 
monsanto 10-10-07
monsanto 10-10-07monsanto 10-10-07
monsanto 10-10-07finance28
 
Vstm report by lazard capital markets 3 15-12
Vstm report by lazard capital markets 3 15-12Vstm report by lazard capital markets 3 15-12
Vstm report by lazard capital markets 3 15-12DailyDoseEquities
 
ALR Technologies Taglich Brothers Analyst Report
ALR Technologies Taglich Brothers Analyst ReportALR Technologies Taglich Brothers Analyst Report
ALR Technologies Taglich Brothers Analyst ReportALR Technologies
 
4yrTradeAnalysis_Full-Version
4yrTradeAnalysis_Full-Version4yrTradeAnalysis_Full-Version
4yrTradeAnalysis_Full-VersionJason Wyman
 
FifthThird 2Q 08 Earnings Release_Fina
FifthThird 2Q 08 Earnings Release_FinaFifthThird 2Q 08 Earnings Release_Fina
FifthThird 2Q 08 Earnings Release_Finafinance28
 
FifthThird 2Q 08 EarningsRelease_Fina
FifthThird 2Q 08 EarningsRelease_FinaFifthThird 2Q 08 EarningsRelease_Fina
FifthThird 2Q 08 EarningsRelease_Finafinance28
 

Semelhante a Astm restore cli update nov 2010 (20)

Bell Potter Securities Report on Mesoblast 1 31-2012
Bell Potter Securities Report on Mesoblast 1 31-2012Bell Potter Securities Report on Mesoblast 1 31-2012
Bell Potter Securities Report on Mesoblast 1 31-2012
 
Jdsu
JdsuJdsu
Jdsu
 
Scotiabank. alicorp _02_jan2013_185807_ids_505
Scotiabank. alicorp _02_jan2013_185807_ids_505Scotiabank. alicorp _02_jan2013_185807_ids_505
Scotiabank. alicorp _02_jan2013_185807_ids_505
 
corning annual reports 2001
corning annual reports 2001corning annual reports 2001
corning annual reports 2001
 
Credit suisse bac cs-1
Credit suisse bac cs-1Credit suisse bac cs-1
Credit suisse bac cs-1
 
Jrn Initiate
Jrn InitiateJrn Initiate
Jrn Initiate
 
FifthThird 3Q08 Release_Final
FifthThird 3Q08 Release_FinalFifthThird 3Q08 Release_Final
FifthThird 3Q08 Release_Final
 
FifthThird3Q08Release_Final
FifthThird3Q08Release_FinalFifthThird3Q08Release_Final
FifthThird3Q08Release_Final
 
Baird September 2012 Facility Services Report
Baird September 2012 Facility Services ReportBaird September 2012 Facility Services Report
Baird September 2012 Facility Services Report
 
Motherson Sumi Systems
Motherson Sumi Systems Motherson Sumi Systems
Motherson Sumi Systems
 
2011 - Q1 - Commentary
2011 - Q1 - Commentary2011 - Q1 - Commentary
2011 - Q1 - Commentary
 
.monsanto 10-10-07
.monsanto 10-10-07.monsanto 10-10-07
.monsanto 10-10-07
 
Monsanto Q4 2007 Financial Results
Monsanto Q4 2007 Financial ResultsMonsanto Q4 2007 Financial Results
Monsanto Q4 2007 Financial Results
 
monsanto 10-10-07
monsanto 10-10-07monsanto 10-10-07
monsanto 10-10-07
 
Vstm report by lazard capital markets 3 15-12
Vstm report by lazard capital markets 3 15-12Vstm report by lazard capital markets 3 15-12
Vstm report by lazard capital markets 3 15-12
 
ALR Technologies Taglich Brothers Analyst Report
ALR Technologies Taglich Brothers Analyst ReportALR Technologies Taglich Brothers Analyst Report
ALR Technologies Taglich Brothers Analyst Report
 
Equity analysis
Equity analysisEquity analysis
Equity analysis
 
4yrTradeAnalysis_Full-Version
4yrTradeAnalysis_Full-Version4yrTradeAnalysis_Full-Version
4yrTradeAnalysis_Full-Version
 
FifthThird 2Q 08 Earnings Release_Fina
FifthThird 2Q 08 Earnings Release_FinaFifthThird 2Q 08 Earnings Release_Fina
FifthThird 2Q 08 Earnings Release_Fina
 
FifthThird 2Q 08 EarningsRelease_Fina
FifthThird 2Q 08 EarningsRelease_FinaFifthThird 2Q 08 EarningsRelease_Fina
FifthThird 2Q 08 EarningsRelease_Fina
 

Mais de James Hilbert

Protalix analyst day presentation
Protalix analyst day presentationProtalix analyst day presentation
Protalix analyst day presentationJames Hilbert
 
Aldoxorubicin p2-sts-01 ctos poster 10-31-13
Aldoxorubicin p2-sts-01 ctos poster 10-31-13Aldoxorubicin p2-sts-01 ctos poster 10-31-13
Aldoxorubicin p2-sts-01 ctos poster 10-31-13James Hilbert
 
Asco 2012 abstract_45010_oral_final
Asco 2012 abstract_45010_oral_finalAsco 2012 abstract_45010_oral_final
Asco 2012 abstract_45010_oral_finalJames Hilbert
 
5 understanding some basic trial designs in sarcomas (inclusive a placebo one...
5 understanding some basic trial designs in sarcomas (inclusive a placebo one...5 understanding some basic trial designs in sarcomas (inclusive a placebo one...
5 understanding some basic trial designs in sarcomas (inclusive a placebo one...James Hilbert
 
Transforming time for prostate cancer therapies
Transforming time for prostate cancer therapiesTransforming time for prostate cancer therapies
Transforming time for prostate cancer therapiesJames Hilbert
 
The combos study an expert interview with william s
The combos study  an expert interview with william sThe combos study  an expert interview with william s
The combos study an expert interview with william sJames Hilbert
 
$MAPP Phase 3 results
$MAPP Phase 3 results$MAPP Phase 3 results
$MAPP Phase 3 resultsJames Hilbert
 
Second or third additional chemotherapy drug for non-small cell lung cancer i...
Second or third additional chemotherapy drug for non-small cell lung cancer i...Second or third additional chemotherapy drug for non-small cell lung cancer i...
Second or third additional chemotherapy drug for non-small cell lung cancer i...James Hilbert
 
$SNGX Nnational.2.1.2010
$SNGX Nnational.2.1.2010$SNGX Nnational.2.1.2010
$SNGX Nnational.2.1.2010James Hilbert
 
GS Weekly Options Watch - May 11th
GS Weekly Options Watch - May 11thGS Weekly Options Watch - May 11th
GS Weekly Options Watch - May 11thJames Hilbert
 
Ariad jeffries jan 2011
Ariad jeffries jan 2011Ariad jeffries jan 2011
Ariad jeffries jan 2011James Hilbert
 

Mais de James Hilbert (17)

Protalix analyst day presentation
Protalix analyst day presentationProtalix analyst day presentation
Protalix analyst day presentation
 
Aldoxorubicin p2-sts-01 ctos poster 10-31-13
Aldoxorubicin p2-sts-01 ctos poster 10-31-13Aldoxorubicin p2-sts-01 ctos poster 10-31-13
Aldoxorubicin p2-sts-01 ctos poster 10-31-13
 
Ttrsc
TtrscTtrsc
Ttrsc
 
Asco 2012 abstract_45010_oral_final
Asco 2012 abstract_45010_oral_finalAsco 2012 abstract_45010_oral_final
Asco 2012 abstract_45010_oral_final
 
5 understanding some basic trial designs in sarcomas (inclusive a placebo one...
5 understanding some basic trial designs in sarcomas (inclusive a placebo one...5 understanding some basic trial designs in sarcomas (inclusive a placebo one...
5 understanding some basic trial designs in sarcomas (inclusive a placebo one...
 
Transforming time for prostate cancer therapies
Transforming time for prostate cancer therapiesTransforming time for prostate cancer therapies
Transforming time for prostate cancer therapies
 
The combos study an expert interview with william s
The combos study  an expert interview with william sThe combos study  an expert interview with william s
The combos study an expert interview with william s
 
$MAPP Phase 3 results
$MAPP Phase 3 results$MAPP Phase 3 results
$MAPP Phase 3 results
 
12702889
1270288912702889
12702889
 
Second or third additional chemotherapy drug for non-small cell lung cancer i...
Second or third additional chemotherapy drug for non-small cell lung cancer i...Second or third additional chemotherapy drug for non-small cell lung cancer i...
Second or third additional chemotherapy drug for non-small cell lung cancer i...
 
$SNGX Nnational.2.1.2010
$SNGX Nnational.2.1.2010$SNGX Nnational.2.1.2010
$SNGX Nnational.2.1.2010
 
$PSTI Oppenheimer
$PSTI Oppenheimer$PSTI Oppenheimer
$PSTI Oppenheimer
 
GS Weekly Options Watch - May 11th
GS Weekly Options Watch - May 11thGS Weekly Options Watch - May 11th
GS Weekly Options Watch - May 11th
 
Psti needham 4411
Psti needham 4411Psti needham 4411
Psti needham 4411
 
Ariad jeffries jan 2011
Ariad jeffries jan 2011Ariad jeffries jan 2011
Ariad jeffries jan 2011
 
Clda roth01
Clda roth01Clda roth01
Clda roth01
 
Clda griffin01
Clda griffin01Clda griffin01
Clda griffin01
 

Astm restore cli update nov 2010

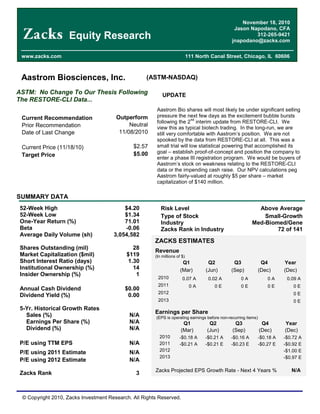
  • 1. November 18, 2010 Jason Napodano, CFA Equity Research 312-265-9421 jnapodano@zacks.com www.zacks.com 111 North Canal Street, Chicago, IL 60606 Aastrom Biosciences, Inc. (ASTM-NASDAQ) ASTM: No Change To Our Thesis Following UPDATE The RESTORE-CLI Data... Aastrom Bio shares will most likely be under significant selling Current Recommendation Outperform pressure the next few days as the excitement bubble bursts nd following the 2 interim update from RESTORE-CLI. We Prior Recommendation Neutral view this as typical biotech trading. In the long-run, we are Date of Last Change 11/08/2010 still very comfortable with Aastrom’s position. We are not spooked by the data from RESTORE-CLI at all. This was a Current Price (11/18/10) $2.57 small trial will low statistical powering that accomplished its $5.00 goal – establish proof-of-concept and position the company to Target Price enter a phase III registration program. We would be buyers of Aastrom’s stock on weakness relating to the RESTORE-CLI data or the impending cash raise. Our NPV calculations peg Aastrom fairly-valued at roughly $5 per share – market capitalization of $140 million. SUMMARY DATA 52-Week High $4.20 Risk Level Above Average 52-Week Low $1.34 Type of Stock Small-Growth One-Year Return (%) 71.01 Industry Med-Biomed/Gene Beta -0.06 Zacks Rank in Industry 72 of 141 Average Daily Volume (sh) 3,054,582 ZACKS ESTIMATES Shares Outstanding (mil) 28 Revenue Market Capitalization ($mil) $119 (In millions of $) Short Interest Ratio (days) 1.30 Q1 Q2 Q3 Q4 Year Institutional Ownership (%) 14 (Mar) (Jun) (Sep) (Dec) (Dec) Insider Ownership (%) 1 2010 0.07 A 0.02 A 0A 0A 0.09 A 2011 0A 0E 0E 0E 0E Annual Cash Dividend $0.00 2012 0E Dividend Yield (%) 0.00 2013 0E 5-Yr. Historical Growth Rates Earnings per Share Sales (%) N/A (EPS is operating earnings before non-recurring items) Earnings Per Share (%) N/A Q1 Q2 Q3 Q4 Year Dividend (%) N/A (Mar) (Jun) (Sep) (Dec) (Dec) 2010 -$0.18 A -$0.21 A -$0.16 A -$0.18 A -$0.72 A P/E using TTM EPS N/A 2011 -$0.21 A -$0.21 E -$0.23 E -$0.27 E -$0.92 E 2012 -$1.00 E P/E using 2011 Estimate N/A 2013 -$0.97 E P/E using 2012 Estimate N/A Zacks Projected EPS Growth Rate - Next 4 Years % N/A Zacks Rank 3 © Copyright 2010, Zacks Investment Research. All Rights Reserved.
  • 2. WHAT’S NEW RESTORE-CLI Update On November 18, 2010 at the VEITHsymposium satellite event in NYC, Dr. Richard Powell, principal investigator for the RESTORE-CLI program, presented a second interim update from the trial. The data included an update from an additional 26 patients, 72 in total, who completed the study. …Backgrounder on RESTORE-CLI… RESOTRE-CLI was initiated in April 2007. The trial is a double-blind, multi-center phase IIb program with the primary outcome of the program assessing safely in treating patients with PAD-induced CLI. The ability to reduce the incidence of major amputations in the treated limbs, close open wounds, improve blood flow, and improve overall quality of life was also assessed. Patients enrolling in the program were deemed to have “no acceptable option for revascularization” to treat their condition. The program randomized patients into 2-arms (2:1 ratio) of: 1) expanded cells administered intramuscularly vs. 2) control (electrolyte solution). Both groups continue to also receive the standard of care appropriate for their medical condition. RESTORE-CLI completed enrollment at 86 patients across 18 clinical sites in March 2010. In June 2010, Aastrom reported the first interim results from RESTORE-CLI at the annual meeting for the Society for Vascular Surgery. Data included 46 patients at the 6 month timeframe and 30 patients at the 12 month timeframe. The results from the second interim update on 72 patients were presented at the VEITHsymposium satellite event in November 2010. The two key points were as follows: On Time To Treatment Failure… st Efficacy Assessment on ITT Population – 1 Interim TRC Control Parameter (n=32) (n=14) Amputation 25% 43% De Novo Gangrene 16% 14% Doubling in Wound Size 19% 36% All Cause Mortality 3% 7% Treatment Failure 41% 79% p = 0.0053 nd Efficacy Assessment on ITT Population – 2 Interim TRC Control Parameter (n=16) (n=10) Amputation 13% 0% De Novo Gangrene 6% 30% Doubling in Wound Size 19% 20% All Cause Mortality 13% 0% Treatment Failure 42% 63% p < 0.05 Efficacy Assessment on ITT Population – TOTAL TRC Control Parameter (n=48) (n=24) Amputation 21% 25% De Novo Gangrene 13% 21% Doubling in Wound Size 19% 29% All Cause Mortality 6% 4% Treatment Failure 42% 63% p = 0.0132 Zacks Investment Research Page 2 www.zacks.com
  • 3. Results for the primary endpoint of the phase 2b program were statistically significant for Time to Treatment Failure at p = 0.0132. The graph below shows the clear separation between TRC and the control for the entire population. The bar chart breaks down the individual components of Treatment Failure, where we see that each was meaningfully in-favor of TRC vs. the control. Conclusion: The Time to Treatment Failure composite endpoint was clearly a success in RESTORE-CLI. The p- value of 0.0132 is incredibly strong considering only 72 patients were included. We would have liked to see better data with respect to “Death” and “Amputation”, but these are things we expect will continue to separate upon the final analysis of the program expected in May 2011. On Amputation Free Survival… st Efficacy Assessment on ITT Population – 1 Interim TRC Control Parameter (n=32) (n=14) Amputation Free Survival 78% 50% p = 0.0376 Efficacy Assessment on ITT Population – TOTAL TRC Control Parameter (n=48) (n=24) Amputation Free Survival 75% 71% p = 0.5541 This is the key endpoint in the eyes of the U.S. FDA. This is what Aastrom will design the upcoming phase III to detect. The results from RESTORE-CLI show a favorable trend, but failed to meet statistical significance. We believe this was due to a number of factors. Mainly, the control group at the backend of the trial responded significantly better than expected. Some reasons why: st Excitement from the medical community grew significantly following the 1 interim update. It is possible that st nd patients received a significant step-up in quality-of-care in-between the 1 and 2 analysis. The step-up in medical care could have reduced the event rate. Patients may have skewed a little “less sick” as the trial completed enrollment. There is nothing mechanistically speaking that would cause TRC to not work in this population, but a less sick population will certainly have less events (MACE, amputation, death) in a 12-month time period. Management noted that of the 10 new control st nd patients that were added between the 1 and 2 analysis, there were no events during months 7-12. Just 2 or 3 events, which you would assume given the ~30% net event rate, would have made the this endpoint statistically significant at p<0.05. Amputations are subjective and a placebo effect was clearly evident. Pain scores are a major contributor to the decision to amputate. Things like de novo gangrene and wound size are clearly not subjective and showed statistical significance in favor of TRC. However, pain is subjective and with less reported pain it is possible physicians were delaying amputations accordingly. This is something we expect will mitigate as the trial progresses to the final analysis. Placebo response does not actually delay disease progression. Zacks Investment Research Page 3 www.zacks.com
  • 4. st nd Conclusion: The chart above clearly shows the big change in control response from the 1 to 2 update. We are encouraged by the fact that TRC behaved remarkably consistent throughout the trial. Assuming management can alleviate some of the placebo effect in the phase III trial through better patient selection and more standardized care, if TRC offers up an amputation free survival rate of ~75%, while the control trends to the expected ~65%, the phase III trial will most definitely meet statistical significance with 450-500 patients. On Safety Assessment… Safety was a paramount concern during the trial. Management enrolled a total of 86 patients. Only 72 progressed to treatment. Fourteen (14) patients were not treated for various reasons: Some did not meet entry criteria upon further review prior to bone aspiration. Some could not tolerate the bone aspiration. Some of the bone aspirate was contaminated or could not be expanded under Aastrom’s technology. Some had amputations in-between the bone aspiration and the injection (2-weeks). Some had significant adverse events in-between the bone aspiration and the injection (2-weeks). Some provided bone aspirate for expansion, but never returned for injection. Patients that did undergo the procedure generally responded well. Adverse events (AEs) were high, as expected, but nothing was significantly higher in the TRC group vs. the control. Safety Assessment on ITT Population - TOTAL TRC Control Parameter (n=53) (n=24) Number (%) with Adverse Events 46 (87%) 22 (92%) Number of Deaths 3 (6%) 1 (4%) Number (%) with Serious Adverse Events 23 (43%) 12 (50%) Number (%) Withdrawal due to AE 1 (2%) 0 What’s Next? …SPA Under Review… In mid-October 2010, Aastrom announced that it had submitted a special protocol assessment (SPA) on the company's phase III clinical development program in CLI. The SPA allows for close consultation with the agency on the protocol design and necessary endpoints for approval. We expect the FDA will respond back in mid-December 2010 (approx. 60 days from filing). We expect that Aastrom will need to make some minor adjustments to the protocol based on the FDA’s response in December, and thus one additional round of filing and response may push the initiation of the program back to late March / early April 2011. This actually works in management favor, as they nd can now incorporate minor changes given what the company has learned from the 2 interim update on RESTORE-CLI and Sanofi-Aventis’ phase III failure with NV1-FGF in the TALSIMAN-201 program. Zacks Investment Research Page 4 www.zacks.com
  • 5. We expect that the phase III program will look similar to the phase IIb RESTORE-CLI program. Management may focus the patient population to be more homogeneous in nature to lower variability and risk. We expect there to be two phase III trials in the program, with in the area of 500 patients total between two arms. The primary endpoint will be amputation-free survival at 12 months, with secondary endpoints including amputation, de novo gangrene, wound healing, and all cause mortality. Management may look to enroll a “less sick” population in one of the two phase III programs, but at this time we are still waiting for the final protocol. Enrollment should proceed faster than the phase IIb program now that management has identified the key wound care centers and vascular surgeons from the RESTORE-CLI program. We expect approximately 50 sites in the U.S. and Canada to participate. Site selection and enrollment criteria will be instrumental to the success of the program. Enrollment should take between 12 to 18 months to complete. The total cost should be roughly $15 to $20 million, or $30-40k per patient. We note this is relatively inexpensive for a pivotal phase III program. The design and costs are more in-line with a medical device than a small molecule pharmaceutical. In late October 2010, Aastrom Bio signed a new strategic manufacturing partnership with ATEK Medical. ATEK will supply the disposable cassettes used during the cell therapy procedure. The relationship puts a more comprehensive and long-term supply agreement into place ahead of the phase III program. This should work to alleviate supply or logistic issues that could materialize during the program. …FDA Grants Fast Track Status for CLI… Also in October 2010, the U.S. FDA granted a Fast Track designation to Aastrom’s cell therapy development program for CLI. The FDA's fast track program is designed to facilitate the development and expedite the review of new drugs and biologics intended to treat serious or life-threatening conditions and that demonstrate the potential to address unmet medical needs. CLI clearly falls into this category. Critical limb ischemia (CLI) affects approximately 1 million people in the U.S. each year -- roughly 2% of the population over the age of 50. Over 25% of patients with PAD will eventually development CLI. CLI is defined as inadequate blood flow to the limbs, and if left untreated can result in tissue loss, gangrene, amputation and death. In fact, CLI leads to an average of 150,000 major limb amputations each year. CLI has a high mortality rate: 20% after 6-months after initial diagnosis and 25% after 12-months. Nearly 30% of all patients who undergo a major limb amputation will require another amputation at some point in the future. The mortality rate post-amputation remains high, at roughly 25%. Fast track-designated drugs and biologics ordinarily qualify for priority review, thereby expediting the review process. In addition, the designation may allow Aastrom to submit portions of the biologic license application (BLA) on a rolling submission basis. For a company of Aastrom’s size, it’s a significant benefit in our view. …Market for CLI Remains Wide Open… Therapeutic options for patients with CLI are limited. Besides being at significantly increased risk for heart attack, stroke or vascular death, patients with CLI often live with several other co-morbidities, including diabetes, angina, dyslipidemia, hypertension and renal disease. For less severe forms of PAD, physicians will typically recommend smoking cessation (when applicable), and changes to diet and exercise. Medications such as aspirin, statins and clopidogrel (Plavix) are common first-line therapies for early-stage PAD. Many patients will also be on medications for diabetes and heart failure as well. However, once PAD progresses to the point of CLI, the only real options available to patients are surgical. Patients are passed from the cardiologist, diabetologist or podiatrist to the care of the vascular surgeon. Surgical procedures include percutaneous transluminal angioplasty, plaque excision, stenting and bypass grafting. Patients living with CLI suffer from severe pain as a result of the neuropathy, tissue loss and ischemia. The healthcare burden associated with PAD-related amputations in the U.S. is greater than $10 billion per year. Zacks Investment Research Page 5 www.zacks.com
  • 6. Cash Raise Coming Soon… Management has guided to external R&D costs associated with the RESTORE-CLI program of $15 to $20 million. We expect approximately half of these costs to take place in calendar 2011. Our financial model forecasts cash at the end of calendar 2010 of approximately $10.5 million. On November 12, 2010, Aastrom filed a $75 million mixed securities shelf. We do not expect the company to see to raise this much cash at one time. More likely is that the company finances to the next major event, which will be the st 1 interim analysis of the phase III trial after 200-250 patients have completed treatment. This will most likely be around mid-2012. We note there are several other catalysts before this time, including the full analysis from RESTORE-CLI in May 2011, along with meaningful updates from the Dilated Cardiomyopathy (DCM) program during the first half of 2011. We suspect that management will look to raise cash of approximately $25 million before the end of the year. This will be enough to fund operations in 2012. We are also aware that the company has entered “CDA” with several firms on collaborating for both CLI and DCM. We believe these talks center around the Ex-North American rights to TRC in CLI or DCM. Management is looking to commercialize TRC in North America alone. After all, they are footing the bill for the phase III trial and will be in close contact with approximately 50 centers around the U.S. and Canada throughout the next few years while the trial is active. No company will be in better position from a market awareness standpoint than Aastrom. A deal Ex-N.A. for sizable upfront cash could fund the expansion of an internal sales force to promote TRC post-approval. This is not a primary-care “pound-the-street” indication. Aastrom could easily build and manage the small specialty sales force necessary to see TRC achieve blockbuster sales if the data backs up the claim. Outperform Rating / $5 Price Target Aastrom Bio shares will most likely be under significant selling pressure the next few days as the excitement bubble nd bursts following the 2 interim update from RESTORE-CLI. We view this as typical biotech trading. In the long- run, we are still very comfortable with Aastrom’s position. We are not spooked by the data from RESTORE-CLI at all. This was a small trial will low statistical powering that accomplished its goal – establish proof-of-concept and position the company to enter a phase III registration program. We would be buyers of Aastrom’s stock on weakness relating to the RESTORE-CLI data or the impending cash raise. Our NPV calculations peg Aastrom fairly-valued at roughly $5 per share – market capitalization of $140 million. Zacks Investment Research Page 6 www.zacks.com
  • 7. PROJECTED FINANCIALS Aastrom Biosciences Income Statement Jun-10 Sep-10 Dec-10 Mar-11 Jun-11 Jun-11 Jun-12 Jun-13 Jun-14 Aastrom Biosciences 2010 A Q1 A Q2 E Q3 E Q4 E 2011 E 2012 E 2013 E 2014 E R&D Agreements / Grants $0 $0 $0 $0 $0 $0 $0 $0 $0 YOY Growth 0% - - - - 0% 0% 0% 0% Product Sales & Rentals $0.089 $0 $0 $0 $0 $0 $0 $0 $0 YOY Growth - - - - - - 0.0% 0.0% 0.0% Total Revenues $0.089 $0 $0 $0 $0 $0 $0 $0 $0 YOY Growth -51.1% - - - - -100.0% - - - Cost of Product Sales & Rentals $0.034 $0 $0 $0 $0 $0 $0 $0 $0 Product Gross Margin 0% - - - - - - - - Research & Development $12.658 $4.167 $4.250 $5.000 $6.000 $19.417 $25.000 $25.000 $20.000 % R&D 14222.5% - - - - - - - - Selling, General, and Admin $5.201 $1.686 $1.700 $1.750 $1.800 $6.936 $7.250 $8.000 $9.000 % SG&A 5843.8% - - - - - - - - Operating Income ($17.804) ($5.853) ($5.950) ($6.750) ($7.800) ($26.353) ($32.250) ($33.000) ($29.000) Operating Margin - - - - - - - - - Other Income (Expenses) $0.075 $0.020 $0.026 $0.055 $0.045 $0.146 $0.120 $0.130 $0.200 Pre-Tax Income ($17.729) ($5.833) ($5.924) ($6.695) ($7.755) ($26.207) ($32.130) ($32.870) ($28.800) Taxes & Other Charges $0 $0 $0 $0 $0 $0 $0 $0 $0 Tax Rate 0% 0% 0% 0% 0% 0% 0% 0% 0% Net Income ($17.729) ($5.833) ($5.924) ($6.695) ($7.755) ($26.207) ($32.130) ($32.870) ($28.800) Net Margin - - - - - - - - - Reported EPS ($0.72) ($0.21) ($0.21) ($0.23) ($0.27) ($0.92) ($1.00) ($0.97) ($0.80) YOY Growth - - - - - - - - - FAS-123R Expense $0.7 $0.2 $0.2 $0.2 $0.3 $0.9 $1.1 $1.5 $2.0 Weighted Ave. Shares Out 24.7 28.3 28.5 28.7 28.9 28.6 32.0 34.0 36.0 Source: Zacks Investment Research, Inc. Jason Napodano, CFA © Copyright 2010, Zacks Investment Research. All Rights Reserved.
  • 8. HISTORICAL ZACKS RECOMMENDATIONS DISCLOSURES The analysts contributing to this report do not hold any shares of ASTM. Zacks Investment Research may have, or seeks to have, a business relationship with the companies listed in this report. Additionally, the analysts contributing to this report certify that the views expressed herein accurately reflect the analysts’ personal views as to the subject securities and issuers. Zacks certifies that no part of the analysts’ compensation was, is, or will be, directly or indirectly, related to the specific recommendation or views expressed by the analyst in the report. Additional information on the securities mentioned in this report is available upon request. This report is based on data obtained from sources we believe to be reliable, but is not guaranteed as to accuracy and does not purport to be complete. Because of individual objectives, the report should not be construed as advice designed to meet the particular investment needs of any investor. Any opinions expressed herein are subject to change. This report is not to be construed as an offer or the solicitation of an offer to buy or sell the securities herein mentioned. Zacks or its officers, employees or customers may have a position long or short in the securities mentioned and buy or sell the securities from time to time. Zacks uses the following rating system for the securities it covers. Outperform- Zacks expects that the subject company will outperform the broader U.S. equity market over the next one to two quarters. Neutral- Zacks expects that the company will perform in line with the broader U.S. equity market over the next one to two quarters. Underperform- Zacks expects the company will under perform the broader U.S. Equity market over the next one to two quarters. The current distribution of Zacks Ratings is as follows on the 1007 companies covered: Outperform- 13.3%, Neutral- 79.8%, Underperform – 6.4%. Data is as of midnight on the business day immediately prior to this publication. © Copyright 2010, Zacks Investment Research. All Rights Reserved.