Physiology of Soccer - Fisiologia do Futebol
•
4 gostaram•2,132 visualizações

Soccer is the most popular sport in the world and is performed by men and women, children and adults with different levels of expertise. Soccer performance depends upon a myriad of factors such as technical/biomechanical, tactical, mental and physiological areas.

Recomendados
Mais conteúdo relacionado
Mais procurados
Mais procurados (16)
Destaque
Semelhante a Physiology of Soccer - Fisiologia do Futebol
Semelhante a Physiology of Soccer - Fisiologia do Futebol (20)
Mais de Fernando Farias
Mais de Fernando Farias (20)
Último
Último (16)
Physiology of Soccer - Fisiologia do Futebol
- 1. Sports Med 2005; 35 (6): 501-536 REVIEW ARTICLE 0112-1642/05/0006-0501/$34.95/0 2005 Adis Data Information BV. All rights reserved. Physiology of Soccer An Update Tomas Stølen,1 Karim Chamari,2 Carlo Castagna3 and Ulrik Wisløff4,5 1 Human Movement Science Section, Faculty of Social Sciences and Technology Management, Norwegian University of Science and Technology, Trondheim, Norway 2 Unit´e de Recherche ‘Evaluation, Sport, Sant´e’ – National Center of Medicine and Science in Sport (CNMSS), El Menzah, Tunis, Tunisia 3 School of Sport and Exercise Sciences, Faculty of Medicine and Surgery, University of Rome Tor Vergata, Rome, Italy 4 Department of Circulation and Medical Imaging, Norwegian University of Science and Technology, Trondheim, Norway 5 Department of Cardiology, St. Olavs Hospital, Trondheim, Norway Contents Abstract . . . . . . . . . . . . . . . . . . . . . . . . . . . . . . . . . . . . . . . . . . . . . . . . . . . . . . . . . . . . . . . . . . . . . . . . . . . . . . . . . . . . 502 1. Physical Demands . . . . . . . . . . . . . . . . . . . . . . . . . . . . . . . . . . . . . . . . . . . . . . . . . . . . . . . . . . . . . . . . . . . . . . 503 1.1 Game Intensity . . . . . . . . . . . . . . . . . . . . . . . . . . . . . . . . . . . . . . . . . . . . . . . . . . . . . . . . . . . . . . . . . . . . . . 503 1.2 Anaerobic Periods in Soccer . . . . . . . . . . . . . . . . . . . . . . . . . . . . . . . . . . . . . . . . . . . . . . . . . . . . . . . . . . 509 2. Physiological Profile . . . . . . . . . . . . . . . . . . . . . . . . . . . . . . . . . . . . . . . . . . . . . . . . . . . . . . . . . . . . . . . . . . . . . 509 2.1 Maximal Aerobic Capacity . . . . . . . . . . . . . . . . . . . . . . . . . . . . . . . . . . . . . . . . . . . . . . . . . . . . . . . . . . . 509 2.1.1 Adult Male Soccer Players . . . . . . . . . . . . . . . . . . . . . . . . . . . . . . . . . . . . . . . . . . . . . . . . . . . . . . 509 2.1.2 Young Soccer Players . . . . . . . . . . . . . . . . . . . . . . . . . . . . . . . . . . . . . . . . . . . . . . . . . . . . . . . . . . 511 2.1.3 Female Soccer Players . . . . . . . . . . . . . . . . . . . . . . . . . . . . . . . . . . . . . . . . . . . . . . . . . . . . . . . . . 511 2.1.4 Aerobic Capacity During Season and Inter- and Intra-Country Comparison . . . . . . . . . . 514 2.1.5 Strength Capacity . . . . . . . . . . . . . . . . . . . . . . . . . . . . . . . . . . . . . . . . . . . . . . . . . . . . . . . . . . . . . 514 3. Soccer Referees . . . . . . . . . . . . . . . . . . . . . . . . . . . . . . . . . . . . . . . . . . . . . . . . . . . . . . . . . . . . . . . . . . . . . . . . 519 3.1 Physiological Aspects of Refereeing . . . . . . . . . . . . . . . . . . . . . . . . . . . . . . . . . . . . . . . . . . . . . . . . . . . 519 3.1.1 Match Activity . . . . . . . . . . . . . . . . . . . . . . . . . . . . . . . . . . . . . . . . . . . . . . . . . . . . . . . . . . . . . . . . . 519 3.1.2 Heart Rate . . . . . . . . . . . . . . . . . . . . . . . . . . . . . . . . . . . . . . . . . . . . . . . . . . . . . . . . . . . . . . . . . . . . 520 3.1.3 Blood Lactate . . . . . . . . . . . . . . . . . . . . . . . . . . . . . . . . . . . . . . . . . . . . . . . . . . . . . . . . . . . . . . . . . 520 3.1.4 Physical Fitness and Match Performance . . . . . . . . . . . . . . . . . . . . . . . . . . . . . . . . . . . . . . . . . 520 3.1.5 Training Experiments in Soccer Referees . . . . . . . . . . . . . . . . . . . . . . . . . . . . . . . . . . . . . . . . . . 521 4. Exercise Training . . . . . . . . . . . . . . . . . . . . . . . . . . . . . . . . . . . . . . . . . . . . . . . . . . . . . . . . . . . . . . . . . . . . . . . . 521 5. Endurance Training . . . . . . . . . . . . . . . . . . . . . . . . . . . . . . . . . . . . . . . . . . . . . . . . . . . . . . . . . . . . . . . . . . . . . 521 5.1 Training for Increased Aerobic Capacity . . . . . . . . . . . . . . . . . . . . . . . . . . . . . . . . . . . . . . . . . . . . . . . 521 6. Strength Training, Sprinting and Jumping Ability . . . . . . . . . . . . . . . . . . . . . . . . . . . . . . . . . . . . . . . . . . . . 523 6.1 Muscular Hypertrophy . . . . . . . . . . . . . . . . . . . . . . . . . . . . . . . . . . . . . . . . . . . . . . . . . . . . . . . . . . . . . . . . 524 6.2 Neural Adaptations . . . . . . . . . . . . . . . . . . . . . . . . . . . . . . . . . . . . . . . . . . . . . . . . . . . . . . . . . . . . . . . . . . 524 6.3 Strength Training Effects on Endurance Performance . . . . . . . . . . . . . . . . . . . . . . . . . . . . . . . . . . . . 526 6.4 Sprinting and Jumping Abilities . . . . . . . . . . . . . . . . . . . . . . . . . . . . . . . . . . . . . . . . . . . . . . . . . . . . . . . . 526 7. Anaerobic Power . . . . . . . . . . . . . . . . . . . . . . . . . . . . . . . . . . . . . . . . . . . . . . . . . . . . . . . . . . . . . . . . . . . . . . . 527 8. Evaluation of Physical Performance . . . . . . . . . . . . . . . . . . . . . . . . . . . . . . . . . . . . . . . . . . . . . . . . . . . . . . . 527 9. Endurance Tests . . . . . . . . . . . . . . . . . . . . . . . . . . . . . . . . . . . . . . . . . . . . . . . . . . . . . . . . . . . . . . . . . . . . . . . . 528 9.1 Continuous Multistage Fitness Test . . . . . . . . . . . . . . . . . . . . . . . . . . . . . . . . . . . . . . . . . . . . . . . . . . . . . 528 9.2 Yo-Yo Intermittent Recovery Test . . . . . . . . . . . . . . . . . . . . . . . . . . . . . . . . . . . . . . . . . . . . . . . . . . . . . . 528 9.3 Soccer-Specific Testing of Maximal Oxygen Uptake (V˙ O2max) . . . . . . . . . . . . . . . . . . . . . . . . . . . . 529 9.4 Hoff Test: Aerobic Testing with the Ball . . . . . . . . . . . . . . . . . . . . . . . . . . . . . . . . . . . . . . . . . . . . . . . . . 529 9.5 Laboratory Tests . . . . . . . . . . . . . . . . . . . . . . . . . . . . . . . . . . . . . . . . . . . . . . . . . . . . . . . . . . . . . . . . . . . . . 529 9.5.1 V˙ O2max . . . . . . . . . . . . . . . . . . . . . . . . . . . . . . . . . . . . . . . . . . . . . . . . . . . . . . . . . . . . . . . . . . . . . . . 529 9.5.2 Anaerobic Threshold . . . . . . . . . . . . . . . . . . . . . . . . . . . . . . . . . . . . . . . . . . . . . . . . . . . . . . . . . . . 530
- 2. 502 Stølen et al. 9.5.3 Running Economy . . . . . . . . . . . . . . . . . . . . . . . . . . . . . . . . . . . . . . . . . . . . . . . . . . . . . . . . . . . . . . 531 9.5.4 Anaerobic Capacity Tests . . . . . . . . . . . . . . . . . . . . . . . . . . . . . . . . . . . . . . . . . . . . . . . . . . . . . . 531 9.5.5 The Wingate Test . . . . . . . . . . . . . . . . . . . . . . . . . . . . . . . . . . . . . . . . . . . . . . . . . . . . . . . . . . . . . . . 531 9.5.6 Maximal Anaerobic Oxygen Deficit . . . . . . . . . . . . . . . . . . . . . . . . . . . . . . . . . . . . . . . . . . . . . . 531 9.6 Strength and Power Tests . . . . . . . . . . . . . . . . . . . . . . . . . . . . . . . . . . . . . . . . . . . . . . . . . . . . . . . . . . . . . 531 9.7 Field Tests . . . . . . . . . . . . . . . . . . . . . . . . . . . . . . . . . . . . . . . . . . . . . . . . . . . . . . . . . . . . . . . . . . . . . . . . . . . 531 9.7.1 Vertical Jump Test . . . . . . . . . . . . . . . . . . . . . . . . . . . . . . . . . . . . . . . . . . . . . . . . . . . . . . . . . . . . . 531 9.7.2 5-JumpTest . . . . . . . . . . . . . . . . . . . . . . . . . . . . . . . . . . . . . . . . . . . . . . . . . . . . . . . . . . . . . . . . . . . . 531 9.7.3 30m Sprint (10m Lap Time) . . . . . . . . . . . . . . . . . . . . . . . . . . . . . . . . . . . . . . . . . . . . . . . . . . . . . . 532 9.7.4 Repeated Sprinting Ability (Bangsbo Soccer Sprint Test) . . . . . . . . . . . . . . . . . . . . . . . . . . . . 532 9.7.5 10m Shuttle Test . . . . . . . . . . . . . . . . . . . . . . . . . . . . . . . . . . . . . . . . . . . . . . . . . . . . . . . . . . . . . . . . 532 10. Conclusion . . . . . . . . . . . . . . . . . . . . . . . . . . . . . . . . . . . . . . . . . . . . . . . . . . . . . . . . . . . . . . . . . . . . . . . . . . . . . 532 Abstract Soccer is the most popular sport in the world and is performed by men and women, children and adults with different levels of expertise. Soccer performance depends upon a myriad of factors such as technical/biomechanical, tactical, mental and physiological areas. One of the reasons that soccer is so popular worldwide is that players may not need to have an extraordinary capacity within any of these performance areas, but possess a reasonable level within all areas. However, there are trends towards more systematic training and selection influ-encing the anthropometric profiles of players who compete at the highest level. As with other activities, soccer is not a science, but science may help improve performance. Efforts to improve soccer performance often focus on technique and tactics at the expense of physical fitness. During a 90-minute game, elite-level players run about 10km at an average intensity close to the anaerobic threshold (80–90% of maximal heart rate). Within this endurance context, numerous explosive bursts of activity are required, includ-ing jumping, kicking, tackling, turning, sprinting, changing pace, and sustaining forceful contractions to maintain balance and control of the ball against defensive pressure. The best teams continue to increase their physical capacities, whilst the less well ranked have similar values as reported 30 years ago. Whether this is a result of fewer assessments and training resources, selling the best players, and/or knowledge of how to perform effective exercise training regimens in less well ranked teams, is not known. As there do exist teams from lower divisions with as high aerobic capacity as professional teams, the latter factor probably plays an important role. This article provides an update on the physiology of soccer players and referees, and relevant physiological tests. It also gives examples of effective strength- and endurance-training programmes to improve on-field performance. The cited literature has been accumulated by computer searching of relevant databases and a review of the authors’ extensive files. From a total of 9893 papers covering topics discussed in this article, 843 were selected for closer scrutiny, excluding studies where information was redundant, insufficient or the experi-mental design was inadequate. In this article, 181 were selected and discussed. The information may have important implications for the safety and success of soccer players and hopefully it should be understood and acted upon by coaches and individual soccer players. 2005 Adis Data Information BV. All rights reserved. Sports Med 2005; 35 (6)
- 3. Physiology of Soccer 503 Soccer is the most popular sport in the world,[1] highest force that can be performed by the neuro-performed by men and women, children and adults muscular system during one maximum voluntary with different levels of expertise. As with other contraction (one repetition maximum [1RM]), sports, soccer is not a science but science may help whereas power is the product of strength and speed improve performance.[1] The performance depends and refers to the ability of the neuromuscular system upon a myriad of factors such as technical, tactical, to produce the greatest possible impulse in a given physical, physiological and mental areas. This arti- time period. Maximal strength is one basic quality cle provides an overview of important literature in that influences power performance; an increase in soccer physiology, describes relevant physiological maximal strength is usually connected with an im-tests and gives examples of effective strength and provement in relative strength and therefore with endurance training regimens to improve on-field improvement of power abilities. A significant rela-soccer performance not highlighted in previous re- tionship has been observed between 1RM and accel-views. Furthermore, this article presents up-to-date eration and movement velocity.[23,24] This maximal data about the physiology of soccer referees. strength/power performance relationship is sup-ported by jump test results as well as in 30m sprint 1. Physical Demands results.[25,26] By increasing the available force of Distances covered at top level are in the order of muscular contraction in appropriate muscles or mus-10– 12km for the field players, and about 4km for the cle groups, acceleration and speed may improve in goalkeeper (table I). Several studies report that the skills critical to soccer such as turning, sprinting and midfield players run the longest distances during a changing pace.[1] High levels of maximal strength in game and that professional players run longer dis- upper and lower limbs may also prevent injuries in tances than non-professionals.[2-4] The exercise in- soccer.[27] Furthermore, Lehnhart et al.[28] showed tensity is reduced and the distance covered is 5–10% that introducing a strength training regimen reduced less in the second half compared with the first.[4-8] the number of injuries by about 50%. From this it During a soccer game, a sprint bout occurs approxi- should be obvious that superior technical and indi-mately every 90 seconds, each lasting an average of vidual (and team) tactical ability in soccer can only 2–4 seconds.[7,9] Sprinting constitutes 1–11% of the be consistently demonstrated throughout the course total distance covered during a match[4-6,9] corre- of a 90-minute competition by soccer players with sponding to 0.5–3.0% of effective play time (i.e. the high endurance capacity and strength. time when the ball is in play).[5,7,9-11] In the endur- 1.1 Game Intensity ance context of the game, each player performs 1000–1400 mainly short activities[4,7-9] changing Because of the game duration, soccer is mainly every 4–6 seconds. Activities performed are: 10–20 dependent upon aerobic metabolism. The average sprints; high-intensity running approximately every work intensity, measured as percentage of maximal 70 seconds; about 15 tackles; 10 headings; 50 in- heart rate (HRmax), during a 90-minute soccer match volvements with the ball; about 30 passes as well as is close to the anaerobic threshold (the highest exer-changing pace and sustaining forceful contractions cise intensity where the production and removal of to maintain balance and control of the ball against lactate is equal; normally between 80–90% of defensive pressure.[3,5,7-12] Withers et al.[5] noted that HRmax in soccer players) [table II]. It would be the fullbacks sprinted more than twice as much as physiologically impossible to keep a higher average the central-defenders (2.5 times longer), whilst the intensity over a longer period of time due to the midfielders and the attackers sprinted significantly resultant accumulation of blood lactate. However, more than central-defenders (1.6–1.7 times longer). expressing game intensity as an average over 90 This is in line with Mohr et al.[4] who reported that minutes, or for each half, could result in a substantial fullbacks and attackers sprinted significantly longer loss of specific information. Indeed, soccer matches than central-backs and midfielders. show periods and situations of high-intensity activi- Strength and power are equally as important as ty where accumulation of lactate takes place. There-endurance in soccer. Maximal strength refers to the fore, the players need periods of low-intensity activ- 2005 Adis Data Information BV. All rights reserved. Sports Med 2005; 35 (6)
- 4. 504 Stølen et al. 2005 Adis Data Information BV. All rights reserved. Sports Med 2005; 35 (6) Table I. Distance covered in different positions in male and female soccer players Study Level/country (sex) n Distance covered (m) according to playing position, no. of players in parentheses Method of unspecified defender midfielder attack measurement Agnevik[12] Division 1/Sweden (M) 10 10 200 Cine film Bangsbo et al.[7] Division 1 and 2/Denmark (M) 14 10 100 (4) 11 400 (7) 10 500 (3) Video Bangsbo[1] Elite/Denmark (F) 1 9 500 (1)a Video Brewer and Davis[13] Elite/Sweden (F) >8 500 Ekblom[3] Division 1 and 4/Sweden (M) 44 9 600 10 600 10 100 Hand notation Division 2/Germany (M) 10 9 800 (10) Helgerud et al.[10] Elite juniors/Norway (M) 10 9 107 (10) Video Training group (M) 9 1 035 (9) Knowles and Brooke[14] Professional/England (M) 40 4 834 Hand notation Mohr et al.[4] Division 1/Denmark (M) 24 1 033 (24) Video Top team/Italy (M) 18 1 086 (18) Video Combining both teams (M) 42 9 740 (11) CB 11 000 (13) 10 480 (9) 10 980 (9) FB Ohashi et al.[15] National/Japan (M) 2 9 845 (2) Trigonometry League/Japan (M) 2 10 824 (2) Reilly and Thomas[9] Division 1/England (M) 32 7 759 (7) CB 9 805 (11) 8 397 (14) Tape recorder 8 8 245 (8) FB Rienzi et al.[8] EPL/England (M) 6 10 104 (6) Video International/SA (M) 17 8 638 (17) EPL/SA international (M) 23 8 695 (9) 9 960 (10) 7 736 (4) Saltin[16] Non-elite/Sweden (M) 5 12 000 Cine film Smaros[17] Division 2/Finland (M) 7 7 100 (7) TV cameras Thatcher and EPL first-team/England (M) 12 9 741 (12) Batterham[18] EPL U-19/England (M) 12 10 274 (12) Van Gool et al.[6] University team/Belgium (M) 7 9 902 (2) 10 710 (3) 9 820 (2) Cine film Vianni[19] Level unknown/Russia (M) 17 000 Wade[20] Professional/England (M) 1 600–5 486 Whitehead[2] Division 1/England (M) 2 11 472 (1) 13 827 (1) Hand notation Division 2/England (M) 2 10 826 (1) 11 184 (1) Top amateur/England (M) 2 9 679 (1) 9 084 (1) College/England (M) 2 6 609 (1) 8 754 (1) Winterbottom[21] Professional/England (M) 3 361 Withers et al.[5] National league/Australia (M) 15 10 169 (5) CB 12 194 (5) 11 766 (5) Video 5 11 980 (5) FB Zelenka et al.[22] Professional/Czech (M) 1 11 500 a 80-minute game. CB = central-back; Czech = Czech Republic; EPL = English Premier League; F = female; FB = full-back; M = male; SA = South America; U = under.
- 5. Physiology of Soccer 505 2005 Adis Data Information BV. All rights reserved. Sports Med 2005; 35 (6) Table II. Heart rate in male and female soccer players Study Level/country (sex) n Type of match (min) HR (beats/min) HRmax (%) Agnevik[12] Division 1/Sweden (M) 1 League (90) 175 93 Ali and Farrally[33] Semi-professional/Scotland (M) 9 League (90) 172 University/Scotland (M) 9 League (90) 167 Recreational/Scotland (M) 9 League (90) 168 Bangsbo[1] League/Denmark (M) 6 League (90) ~159 Elite/Denmark (F) 1 International (80) 170 Brewer and Davis[13] Elite/Sweden (F) League 175a 89–91a Helgerud et al.[10] Elite juniors/Norway (M) 8 League (90) 82.2 Training group/Norway (M) 9 League (90) 85.6 Mohr et al.[34] Division 4/Denmark (M) 9 Friendly (90) 160 Division 4/Denmark (M) 16 Friendly (90) 162 Ogushi et al.[32] League/Japan (M) 2 Friendly (90) 161 Reilly[35] League/England (M) Friendly (90) 157 Seliger[36] Unknown/Czech (M) Model (10) 165 80 Strøyer et al.[37] Elite beginning of puberty/Denmark (M) 9 League 175 86.8 Elite end of puberty/Denmark (M) 7 League 176 87.1 Van Gool et al.[6] University/Belgium (M) 7 Friendly (90) 167 a Indicates an average of three matches. Czech = Czech Republic; F = female; HR = heart rate; HRmax = maximal heart rate; M = male.
- 6. 506 Stølen et al. ity to remove lactate from the working muscles. In the total game time. Bangsbo[1] showed that relative terms, there is little or no difference between HR–V˙ O2 line is valid, in intermittent exercise, by the exercise intensity in professional and non-pro- comparing intermittent exercise and continuous ex-fessional soccer, but the absolute intensity is higher ercise in a laboratory test on a treadmill. The same in professionals.[3] No-one has yet managed to pro- HR–V˙ O2 relationship was found over a large range vide accurate and valid data when measuring oxy- of intensities[1] and is supported by recent data.[39,41] gen uptake (V˙ O2) during a soccer match. The values If we assume that the HR–V˙ O2 line may be used measured[29-32] are probably underestimated, since for an accurate estimation of V˙ O2 in soccer, an the equipment most likely inhibited the perform- average exercise intensity of 85% of HRmax will ance. correspond to about 75% of V˙ O2max.[38] This corre-Ogushi et al.[32] used Douglas bags (the equip- sponds to an average V˙ O2 of 45.0, 48.8 and 52.5 ment weighing 1200g), measuring V˙ O2 in periods of mL/kg/min for a player with 60, 65 and 70 mL/kg/ about 3 minutes in two players. They found an min in V˙ O2max, respectively, and probably reflects average V˙ O2 of 35 and 38 mL/kg/min in the first the energy expenditure in modern soccer. For a half and 29 and 30 mL/kg/min in the second. This player weighing 75kg this corresponds to 1519, corresponded to 56–61% and 47–49% of maximal 1645 and 1772 kcal expended during a game (1L oxygen uptake (V˙ O2max) for the two players in the oxygen/min corresponds to 5 kcal) assuming the first and second half, respectively, which is substan- following values of 60, 65 and 70 mL/kg/min in tially lower than reported in other studies.[10,37] The V˙ O2max, respectively. distances covered during the V˙ O2 recordings were In a previous study, we found a difference of 11% shorter when compared with those not wearing about 5 mL/kg/min in running economy between the Douglas bags, which partly explain the low V˙ O2 seniors and cadets during treadmill running at 9 km/ values observed. There is good reason to believe that hour (unpublished data). Running economy is re-the use of Douglas bags, due to their size (and ferred to as the ratio between work intensity and limited time for gas sampling), reduced the involve- V˙ O2.[42] At a given work intensity, V˙ O2 may vary ment in duels, tackles and other energy-demanding considerably between subjects with similar V˙ O2max. activities in the match, and, thus, underestimated the This is also evident in highly trained subjects.[43] In energy demands in soccer. New portable gas elite endurance athletes with a relatively narrow analysers (~500g) allow valid results, but at present range in V˙ O2max, running economy has been found no such study has been performed. Establishing the to differ as much as 20%[44] and correlate with relationship between heart rate (HR) and V˙ O2 dur- performance.[43] The causes of inter-individual vari-ing a game allows accurate indirect measurement of ations in gross oxygen cost of activity at a standard V˙ O2 during soccer matches. Establishing each play- work-intensity are not well understood, but it seems er’s relationship between HR and V˙ O2 (the likely that anatomical trait, mechanical skill, neuro- HR–V˙ O2 relationship) may accurately reflect the muscular skill and storage of elastic energy are energy expenditure in steady-state exercise. Howev- important.[45] In practical terms, 5 mL/kg/min lower er, some authors[32] question the HR–V˙ O2 relation- V˙ O2 at the same exercise intensity means that the ship in intermittent exercise. Static contractions, senior players exercised with approximately 10 exercise with small muscle groups and psychologi- beats/min less relative to individual HRmax com-cal and thermal stresses, will elevate the HR at a pared with cadets. Alternatively, seniors could exer-given V˙ O2; i.e. changing the HR–V˙ O2 line.[38] How- cise at the same relative HR but at a higher absolute ever, in soccer, with dynamic work with large mus- exercise intensity. The senior players reached the cle groups, one might expect the HR–V˙ O2 line to be same relative HR (in percentage of HRmax) as cadets a good estimate of energy expenditure.[1,39] Balsom when exercising at approximately 10 km/hour. et al.[40] suggested that HR increases disproportion- Thus, a change in exercise intensity of 1 km/hour ately to the V˙ O2 after sprinting activities. This ac- lead to a change in metabolism of about 5 mL/kg/ counts only for a minor overestimation of the V˙ O2 min and increased the HR by approximately 10 in soccer, since sprinting accounts for about 1% of beats/min to cope with the increased energy/oxygen 2005 Adis Data Information BV. All rights reserved. Sports Med 2005; 35 (6)
- 7. Physiology of Soccer 507 2005 Adis Data Information BV. All rights reserved. Sports Med 2005; 35 (6) Table III. Activity profile distances covered in different intensities in male soccer players Study Level/country Position n Distance covered (m) according to mode of movement (numbers/text in parentheses indicate speed) walk jog stride/cruise sprint back Bangsbo et al.[7] Division 1 and 2/Denmark 14 3600a 5200b 2100 300 Castagna et al.[47] Young/Italy 11 1144a 3200 986 468 114 Knowles and Brooke[14] Professional/England 40 1703 2610 520 Mohr et al.[4] Division 1/Denmark 24 1900 410 Top team/Italy 18 2430 650 Combining both teams FB 9 2460 640 CD 11 1690 440 M 13 2230 440 A 9 2280 690 Ohashi et al.[15] League/Japan 4 7709 2035 589 (0–4 m/sec) (4–6 m/sec) (6–10 m/sec) Reilly and Thomas[9] Division 1/England FB 8 2292 2902 1583 783 668 CB 7 1777 2910 1598 830 651 M 11 2029 4040 2159 1059 510 A 14 2309 2771 1755 1066 495 Rienzi et al.[8] International/SA 17 3251a 4119b 923 345 EPL/England 6 3068a 6111b 887 268 International/EPL D 9 3256a 4507b 701 231 M 10 3023a 5511b 1110 316 A 4 3533a 2746b 900 557 Saltin[16] Non-elite/Sweden 5 2340 5880 2880 Thatcher and Batterham[18] EPL first team/England D 4 253 EPL first team/England M 4 387 EPL first team/England A 4 306 EPL U-19/England D 4 2572 3956 360 1114c EPL U-19/England M 4 2442 5243 247 1301c EPL U-19/England A 4 2961 4993 222 803c Van Gool et al.[6] University players/Belgium D 2 4449 (low) 4859 (medium) 595 (high) M 3 4182 (low) 5704 (medium) 823 (high) A 2 4621 (low) 4333 (medium) 867 (high) Wade[20] Professional/England 1372–3652 229–1829d Whitehead[2] Division 1/England M 1 2150 4604 2281 1894 D 1 2593 3545 2753 2593 Division 2/England M 1 4910 4183 1096 1007 D 1 4190 2966 2079 1591 Continued next page
- 8. 508 Stølen et al. demand. Translating the differences in running speed between seniors and cadets into differences in distance covered during a 90-minute game, yield a difference of about 1500m per player. Although this is a theoretical consideration, Hoff and Helgerud[46] estimated that a 5% improvement in running econo-my could increase match distance by approximately 1000m. As can be seen from table III there is a large variation in distances covered at different intensi-ties. There are also notable differences between leagues and playing divisions in different countries. This may partly be explained by vague definitions of the intensities described in some studies. To avoid this, game intensity should be expressed as a per-centage of HRmax as well as by describing the number and duration of sprints performed and num-ber of involvements with the ball per game, which should be reasonably easy to define regardless of the players’ level. To test each player’s HRmax, we recommend uphill running either on a treadmill or outdoor. The players should perform a thorough warm-up for about 20 minutes before running two to three 4-minute runs close to maximum effort; in the last run they should run to exhaustion starting from the second minute of submaximal running. The highest HR recorded, by a HR monitor, should be used as the individual’s HRmax. For us, this was achievable regardless of age (<12 years) and sex. We highly recommend measuring each player’s HRmax, and don’t use different available equations as we frequently experience players >35 years and <20 years with HRmax >220 and <180 beats/min, respectively. Using the traditional formula, 220 – age, will in most cases be very misleading. Recently, Strøyer et al.[37] reported that HRs dur-ing soccer matches were higher in young elite soccer players than in non-elite counterparts of the same age (12 years). The average HR during games was similar in young elite players in early puberty (177 beats/min in the first half vs 174 in the second half) and end of puberty (178 vs 173 beats/min). Early-puberty elite players had higher V˙ O2 related to body mass (mb) [mL/kg/min] than non-elite players dur-ing both match halves. The elite players at the end of puberty showed higher absolute V˙ O2 values during match play than young elite players, but identical relative aerobic loads. Finally, with respect to Table III. Contd Study Level/country Position n Distance covered (m) according to mode of movement (numbers/text in parentheses indicate speed) walk jog stride/cruise sprint back Top amateur/England M 1 3824 3397 945 908 D 1 4104 2575 1820 1181 College/England M 1 3563 2968 1348 875 D 1 3133 1870 1071 529 Winterbottom[21] Professional/England 2347 1015d Withers et al.[5] National league/Australia FB 5 2839 5391 1737 946 1066 CB 5 3081 3854 1271 397 1556 M 5 2670 6085 1841 646 951 A 5 3506 5224 1177 682 1188 a Including backwards walking. b Including sideways and backwards jogging. c Including sideways jogging. d Speed running. A = attacker; CB = central-back; CD = central defender; D = defender; EPL = English Premier League; FB = full-back; M = midfield player; SA = South America; U = under. 2005 Adis Data Information BV. All rights reserved. Sports Med 2005; 35 (6)
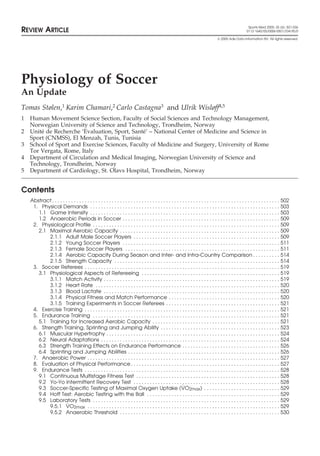
- 9. Physiology of Soccer 509 time–motion analysis, the main difference found the anaerobic system to a higher degree than non-was that the frequency of standing activity was elite players. It is important to note that the lactate significantly higher among the non-elite players concentration measured in soccer depends largely compared with the elite players.[37] on the activity pattern of the player in the 5 minutes There is a lack of studies addressing the issue of preceding blood sampling. Indeed, it has been possible cultural and/or geographical differences in shown that the lactate value was positively correlat-distance covered and time spent in different intensi- ed to the amount of work performed just before the ty zones, as most research published so far concerns sampling.[1] All of the data presented in table IV European teams. In this context, Rienzi et al.[8] show lower lactate concentrations in the second half reported that English premier league players cov- compared with the first. These observations are in ered about 15km more as a team compared with accordance with the reduced distance covered and South American international players. Whether this lower intensity reported in most of the studies.[4-9] reflected differences in aerobic capacity or in play- The rate of lactate removal or clearance depends ing style/tactics is not known. Measuring the exer- on lactate concentration, activity in the recovery cise intensity and distance covered in several teams period and aerobic capacity. The higher the lactate from different continents during a world cup in concentration, the higher the removal rate.[1] It is soccer, as well as assessing teams at similar levels important to note that the players with higher from different leagues, could add important knowl- V˙ O2max may have lower blood lactate concentra-edge to the physiology of international soccer (table tions because of an enhanced recovery from high- II). intensity intermittent exercise through: increased aerobic response; improved lactate removal; and 1.2 Anaerobic Periods in Soccer enhanced phosphocreatine regeneration.[53] On the other hand, they may have similar blood lactate Although aerobic metabolism dominates the en- concentrations exercising at a higher absolute inten-ergy delivery during a soccer game, the most deci- sity compared with their less fit counterparts. In-sive actions are covered by means of anaerobic deed, increased V˙ O2max results in lower blood and metabolism. To perform short sprints, jumps, tack- muscle lactate levels for the same absolute submax-les, and duel play, anaerobic energy release is deter- imal workload because of decreased production of minant with regard to who is sprinting fastest or lactate as a result of increased reliance on the aero-jumping highest. This is often crucial for the match bic energy system and increased lactate clear-outcome.[ 48] ance.[53,54] An exercise intensity of about 70% of Figure 1 summarises the lactate profile during the HRmax removes blood lactate most efficient-two halves in soccer games in elite and non-elite ly[38,55,56] (table IV). soccer players. It appears that the elite players tax 2. Physiological Profile 2.1 Maximal Aerobic Capacity 2.1.1 Adult Male Soccer Players The V˙ O2max in male out-field soccer players varies from about 50–75 mL/kg/min (155–205 mL/ kg0.75/min), whilst the goalkeepers have 50–55 mL/ kg/min (155–160 mL/kg0.75/min) [table IV]. It seems like aerobic capacity among high-perform-ance teams has been elevated over the last dec-ade,[ 57,58] compared with those reported in the 1980s.[3,59,60] Anaerobic threshold is reported to be between 76.6% and 90.3% of HRmax, which is in the 10.0 7.5 5.0 2.5 0.0 Half 1 Half 1 Elite and 1st div. Non-elite Lactate concentration (mmol /L) Half 2 Half 2 Fig. 1. Lactate concentration in elite and non-elite soccer players. The data are based on average values presented in table IV. div. = division. 2005 Adis Data Information BV. All rights reserved. Sports Med 2005; 35 (6)
- 10. 510 Stølen et al. 2005 Adis Data Information BV. All rights reserved. Sports Med 2005; 35 (6) Table IV. Blood lactate in male and female soccer players (numbers in parentheses indicate range) Study Level/country (sex) n Lactate 1st half (mmol/L) Lactate 2nd half (mmol/L) during end during end Agnevik[12] Division 1/Sweden (M) 10 10.0 (–15.5) Bangsbo et al.[7] Division 1 and 2/Denmark (M) 14 4.9 (2.1–10.3) 3.7 (1.8–5.2) 4.4 (2.1–6.9) Bangsbo[1] League/Denmark (M) 4.1 (2.9–6.0) 2.6 (2.0–3.6) 2.4 (1.6–3.9) 2.7 (1.6–4.6) League/Denmark (M) 6.6 (4.3–9.3) 3.9 (2.8–5.4) 4.0 (2.5–6.2) 3.9 (2.3–6.4) Brewer and Davis[13] Elite/Sweden (F) 5.1 ± 2.1 4.6 ± 2.1 Capranica et al.[49] Young/Italy (M) 6 3.1–8.1 (during match) Ekblom[3] Division 1/Sweden (M) 9.5 (6.9–14.3) 7.2 (4.5–10.8) Division 2/Sweden (M) 8.0 (5.1–11.5) 6.6 (3.1–11.0) Division 3/Sweden (M) 5.5 (3.0–12.6) 4.2 (3.2–8.0) Division 4/Sweden (M) 4.0 (1.9–6.3) 3.9 (1.0–8.5) Gerish et al.[50] Top amateurs/Germany (M) 59 5.6 ± 2.0a 4.7 ± 2.2a University/Germany (M) 6.8 ± 1.0 5.9 ± 2.0 5.1 ± 1.6 4.9 ± 1.7 Rohde and Esperson[51] Division 1 and 2/Denmark (M) 22 5.1 ± 1.6 3.9 ± 1.6 Smaros[17] Division 2/Finland (M) 7 4.9 ± 1.9 4.1 ± 1.3 Smith et al.[52] College/England (M) 6 5.2 ± 1.2 (during match) a Median. F = female; M = male.
- 11. Physiology of Soccer 511 range of HRs reported during matches (table II and be to design an exercise training programme to table V). improve the poorer functional capacity. However, using appropriate scaling procedures, the subjects 2.1.2 Young Soccer Players have comparable values, or even an opposite result, Traditionally, junior soccer players have lower to the initial analysis. Thus, appropriate scaling may V˙ O2max (<60 mL/kg/min) than seniors (table V); certainly affect the evaluation and the resultant however, there are exceptions. Helgerud et al.[10] training programme in efforts to improve capacity. found a V˙ O2max of 64.3 mL/kg/min in juniors and What is often mixed up in the discussion of how the under-18 national team of Hungary had an aver- to express V˙ O2 in relation to mb is the relationship age value of 73.9 mL/kg/min (212.7 mL/kg0.75/ between aerobic performance and aerobic capacity. min).[63] Strøyer et al.[37] observed higher V˙ O2max As we know that aerobic capacity certainly influ-values for the midfielders/attackers than for the de- ences the on-field performance,[10] it is reasonable to fenders (65 vs 58 mL/kg/min, respectively, for give this some priority when designing a training young elite soccer players at the end of puberty, i.e. schedule for a season. From table VI it should be 14 years of age). obvious that one needs some knowledge of appro-Some studies report that young soccer players priate scaling procedures when evaluating players’ have similar V˙ O2max, but lower running economy aerobic capacity (i.e. V˙ O2max, running economy and than adults when expressed in mL/kg/min.[84] Nev- anaerobic threshold) when designing an appropriate ertheless, when expressed appropriately, i.e. in mL/ individual training programme. However, even kg0.75/min the results are quite different. Chamari et though improving, for example, V˙ O2max, which im-al.[ 85] showed that under-15 players had similar proves the player’s ability to run longer, faster and V˙ O2max, but lower running economy when ex- be more involved in duels in each game, is not a pressed classically, compared with senior elite play- guarantee as aerobic performance is influenced by a ers. However, using appropriate scaling procedures myriad of factors such as team tactics, opponents, showed that young soccer players had significantly energy intake. Thus aerobic performance per se lower V˙ O2max, but similar running economy com- should not be governed by the statistical adjustments pared with their senior counterparts. Dimensional of allometry, whilst aerobic capacity, which is an scaling of geometrically similar individuals suggests important basis for aerobic performance, should (ta-that V˙ O2max, which is primarily limited by maximal ble VI). cardiac output, should be proportional to mb raised to the power of 0.67.[38] Empirical studies have 2.1.3 Female Soccer Players shown that V˙ O2, depending upon the group studied, Previous research suggests that both female and should be expressed in relation to mb (ideally lean male players tax the aerobic and anaerobic energy mb) raised to the power of 0.75–0.94, over a wide systems to a similar level,[91] but female soccer range of bodyweights.[42,86-89] Since senior players players appear to run a shorter distance compared might be consistently heavier, compared with youth with male players.[92,93] Unfortunately, few studies players, their V˙ O2max might be underestimated and have examined the physiological profile of female energy cost of running overestimated using the soccer players. There is a reported V˙ O2max of traditional expression, mL/kg/min. 38.6–57.6 mL/kg/min or 109.7–160.3 mL/kg0.75/ In line with Svedenhag,[90] expressing V˙ O2 in min (table VII). The Danish nationals, as a team, had direct relation to mb (i.e. kg1.0), or according to 100 mL/kg/min higher V˙ O2max than the least fit appropriate scaling procedures, may influence the team. The huge differences observed may have a evaluation and the design of an exercise regimen. connection with the level of women’s soccer in Subjects A and B from a previous study (table VI) general. Differences in physical resources, deter-illustrate this point. Expressing V˙ O2 traditionally as mined as strength and endurance parameters, be-mL/ lmb/min (where lmb = lean mb in kg), subject A tween male and female elite soccer teams, are simi-has a better running economy but a lower V˙ O2max lar to their sedentary counterparts. This means that than subject B. A natural conclusion from this may compared with sedentary counterparts within the 2005 Adis Data Information BV. All rights reserved. Sports Med 2005; 35 (6)
- 12. 512 Stølen et al. 2005 Adis Data Information BV. All rights reserved. Sports Med 2005; 35 (6) Table V. Physiological profile of male soccer players (±SD) Study Level/country n Position Anthropometrya V˙O2maxa,b AT height (cm) weight (kg) L/min mL/kg/min mL/kg0.75/min (% V˙O2max)b Adhikari and Kumar National/India 2 G 180.1 ± 1.8 64.0 ± 3.0 3.60 56.3 ± 1.3 159.2 Das[61] 4 D 172.4 ± 2.9 65.1 ± 1.3 3.93 60.3 ± 5.0 171.3 5 M 173.2 ± 5.5 67.8 ± 5.4 3.91 57.7 ± 4.9 165.6 7 A 169.3 ± 2.3 60.1 ± 2.3 3.65 60.7 ± 4.9 169.0 Al-Hazzaa et al.[62] Elite/Saudia Arabia CB 182.3 ± 6.1 82.1 ± 6.9 4.28 ± 0.66 52.3 ± 7.3 157.3 ± 21.8 FB 176.0 ± 3.9 72.4 ± 4.1 4.16 ± 0.19 57.7 ± 5.1 168.0 ± 12.8 M 174.7 ± 6.7 68.2 ± 4.4 4.13 ± 0.26 59.9 ± 0.93 172.2 ± 1.7 A 177.4 ± 5.8 72.7 ± 5.9 4.11 ± 0.29 56.9 ± 2.5 165.8 ± 5.4 Apor[63] Division 1–1st/Hungary 66.6 2nd 64.3 3rd 63.3 5th 58.1 National/Hungary 8 68.6 ± 8.7 5.07 73.9 ± 10.8 212.7 Arnason et al.[27] Division elite/Iceland 8c 63.2 ± 0.4 Division 1/Iceland 7c 61.9 ± 0.7 Division 1 elite/Iceland 15 G 57.3 ± 4.7 Division 1 elite/Iceland 87 D 62.8 ± 4.4 Division 1 elite/Iceland 76 M 63.0 ± 4.3 Division 1 elite/Iceland 47 A 62.9 ± 5.5 Aziz et al.[64] National/Singapore 23 175.0 ± 6.0 65.6 ± 6.1 3.82 ± 0.42 58.2 ± 3.7 165.7 Bangsbo[65] Elite/Denmark 5 G 190.0 ± 6.0 87.8 ± 8.0 4.48 51.0 ± 2.0 156.1 13 CB 189.0 ± 4.0 87.5 ± 2.5 4.90 56.0 ± 3.5 171.3 12 FB 179.0 ± 6.0 72.1 ± 10.0 4.43 61.5 ± 10.0 179.2 21 M 177.0 ± 6.0 74.0 ± 8.0 4.63 62.6 ± 4.0 183.6 14 A 178.0 ± 7.0 73.9 ± 3.1 4.43 60.0 ± 3.7 175.9 Bunc and Psotta[66] Elite/Czech 15 182.7 ± 5.5 78.7 ± 6.2 4.80 ± 0.41 61.0 ± 5.2 181.7 80.5 ± 2.5 8 years/Czech 22 132.4 ± 4.3 28.2 ± 3.2 1.60 ± 0.14 56.7 ± 4.9 130.7 76.5 ± 1.3 Bunc et al.[67] Elite/Czech 15 182.6 ± 5.5 78.7 ± 6.2 4.87 61.9 ± 4.1 184.4 80.5 Casajus[58] Division 1/Spain 15 180.0 ± 8.0 78.5 ± 6.45 5.10 ± 0.40 65.5 ± 8.0 193.4 76.6 Division 1/Spain 15 180.0 ± 8.0 78.5 ± 6.45 5.20 ± 0.76 66.4 ± 7.6 197.2 79.4 Chamari et al.[68] U-19 elite Tunisia- 34 177.8 ± 6.7 70.5 ± 6.4 4.30 ± 0.40 61.1 ± 4.6 177.0 ± 13.0 90.1 ± 3.9 Senegal Chin et al.[69] Elite/Hong Kong 24 173.4 ± 4.6 67.7 ± 5.0 4.00 59.1 ± 4.9 169.5 80.0 Continued next page
- 13. Physiology of Soccer 513 2005 Adis Data Information BV. All rights reserved. Sports Med 2005; 35 (6) Table V. Contd Study Level/country n Position Anthropometrya V˙O2maxa,b AT height (cm) weight (kg) L/min mL/kg/min mL/kg0.75/min (% V˙O2max)b Drust et al.[70] University/England 7 178.0 ± 5.0 72.2 ± 5.0 4.17 57.8 ± 4.0 168.5 Ekblom[3] Top team/Sweden ~61.0 Faina et al.[60] Amateur/Italy 17 178.5 ± 5.9 72.1 ± 8.0 4.62 64.1 ± 7.2 186.8 Professional/Italy 27 177.2 ± 4.5 74.4 ± 5.8 4.38 58.9 ± 6.1 173.0 world class/Italy 1 63.2 Helgerud et al.[10] Juniors/Norway 9 4.25 ± 1.9 58.1 ± 4.5 169.9 ± 9.6 82.4 After training period 9 4.59 ± 1.4 64.3 ± 3.9 188.3 ± 10.6 86.3 Division 1/Norway 21 183.9 ± 5.4 78.4 ± 7.4 4.73 ± 0.48 60.5 ± 4.8 178.4 ± 14.8 After training period 21 183.9 ± 5.4 78.4 ± 7.4 5.21 ± 0.52 65.7 ± 5.22 192.9 ± 19.4 Heller et al.[71] League/Czech 12 183.0 ± 3.5 75.6 ± 3.4 4.54 60.1 ± 2.8 177.2 79.4 After season 12 4.48 59.3 ± 3.1 174.9 81.1 Hoff et al.[72] Division 2/Norwayd 8 4.63 ± 0.51 60.3 ± 3.3 178.6 ± 13.3 85.5 Hollmann et al.[59] Nationals-78/Germany 17 62.0 ± 4.5 Impellizzeri et al.[73] Young/Italy 19 178.5 ± 4.8 70.2 ± 4.7 4.03 57.4 ± 4.0 166.2 Leatt et al.[74] U-16 elite/Canada 8 171.1 ± 4.3 62.7 ± 2.8 3.68 ± 0.43 59.0 ± 3.2 165.2 U-18 elite 9 175.8 ± 4.4 69.1 ± 3.4 3.99 ± 0.59 57.7 ± 6.8 166.5 MacMillan et al.[75] Youth team/Scotland 11 177.0 ± 6.4 70.6 ± 8.1 4.45 ± 0.37 63.4 ± 5.6 183.3 ± 13.2 After training period 11 70.2 ± 8.2 4.87 ± 0.45 69.8 ± 6.6 201.5 ± 16.2 Matkovic et al.[76] Division 1/Croatia 44 179.1 ± 5.9 77.5 ± 7.19 4.12 ± 0.64 52.1 ± 10.7 157.7 Nowacki et al.[77] Division 3/Germany 10 69.2 ± 7.8 Puga et al.[78] Division 1/Portugal 2 G 186.0 84.4 4.45 52.7 159.7 3 CB 185.3 75.9 4.16 54.8 161.7 2 FB 175.0 67.5 4.19 62.1 178.0 8 M 176.8 74.0 4.58 61.9 181.6 6 A 174.6 71.1 4.31 60.6 176.0 Rahkila and Senior/Finland 31 180.4 ± 4.3 76.0 ± 7.6 4.20 ± 0.30 56.0 ± 3.0 163.2 83.9 Luthanen[79] U-18 plus U-17/Finland 25 178.6 ± 6.3 71.3 ± 6.8 4.00 ± 0.50 56.0 ± 4.0 163.0 85.7 U-16/Finland 21 177.1 ± 7.4 66.7 ± 6.8 3.80 ± 0.40 58.0 ± 5.0 162.8 84.5 U-15/Finland 29 174.7 ± 5.1 62.5 ± 6.5 3.60 ± 0.40 57.0 ± 5.0 162.0 86.0 Rhodes et al.[80] Olympic/Canada 16 177.3 ± 6.5 72.6 ± 6.2 4.20 ± 0.40 58.7 ± 4.1 168.9 Strøyer et al.[37] EbP/Danish 9 154.1 ± 8.2 42.5 ± 7.2 2.47 ± 0.28 58.6 ± 5.0 148.2 EeP/Danish 7 172.2 ± 6.1 57.5 ± 7.2 3.59 ± 0.44 63.7 ± 8.5 172.1 Vanderford et al.[81] U-14/US 20 163.9 ± 0.4 49.9 ± 0.4 2.64 52.9 ± 1.2 140.6 65.9 ± 1.4 Continued next page
- 14. 514 Stølen et al. same sex, the female elite soccer players have im-proved as much as the male elite soccer players. Therefore, there is no reason to claim that female soccer has shortcomings compared with elite male soccer in terms of strength and endurance.[91] 2.1.4 Aerobic Capacity During Season and Inter-and Intra-Country Comparison Casajus[58] noted a higher V˙ O2max at the end of the season, while Helgerud et al. (unpublished ob-servation) and Heller et al.[71] reported the opposite. In this context, the initial level of V˙ O2max at the beginning of the season, as well as the training schedule during the season, surely have an impact on the time course of V˙ O2max during the season (table VII). The lower ranked national teams seem to have a lower V˙ O2max (e.g. India, Singapore and Saudi Ara-bia) than the best national teams (e.g. Germany). Apor[63] reported that the winning team in the Hun-garian elite league had higher average V˙ O2max than the teams at the second, third and fifth places. Wisløff et al.[57] showed that the winning team in the Norwegian elite league had superior aerobic capaci-ty compared with the team that finished last. While some authorities claim V˙ O2max is not a truly sensi-tive measure of performance capability in soccer, it is positively related to work rate in a game.[10] Reilly et al.[101] previously suggested that the consistent observation of V˙ O2max >60 mL/kg/min in elite teams implied a threshold below which an individu-al player is unlikely to possess the physiological attributes for success in elite soccer. Furthermore, they also highlight the need for reference value to be adjusted upwards as training programmes in the elite game are optimised. Considering all advantages of a high level of V˙ O2max in soccer, it would be reasona-ble to expect about 70 mL/kg/min for a 75kg profes-sional male soccer player, or about 200 mL/kg0.75/ min ‘independent’ of mb. 2.1.5 Strength Capacity As no standardised protocol for testing strength of soccer players exists, it is difficult to compare results among different studies. Results from previ-ous studies are summarised in table VIII. In our view, the commonly used isokinetic tests do not reflect the movement of the limbs involved during soccer, as no natural muscle movement is isokinetic. Table V. Contd Study Level/country n Position Anthropometrya V˙O2maxa,b AT height (cm) weight (kg) L/min mL/kg/min mL/kg0.75/min (% V˙O2max)b U-15/US 19 176.1 ± 0.3 62.8 ± 0.3 3.42 54.5 ± 1.3 153.3 63.5 ± 2.5 U-16/US 20 177.1 ± 0.3 68.6 ± 0.4 3.86 56.2 ± 1.5 161.9 61.2 ± 1.3 Vanfraechem and Division 1/Belgium 18 181.0 ± 3.9 76.7 ± 6.4 4.30 ± 0.52 56.5 ± 7.0 165.9 90.3 Thomas[82] Verstappen and Division 1/Holland 15 72.0 ± 3.7 4.90 ± 0.50 68.0 ± 5.0 198.2 Bovens[83] 15 77.7 ± 4.8 4.90 ± 0.60 63.0 ± 7.0 187.2 Wisløff et al.[57] Division 1/Norway (first) 14 181.1 ± 4.8 76.9 ± 6.3 5.20 ± 0.40 67.6 ± 4.0 200.2 ± 8.4 Division 1/Norway (last) 15 180.8 ± 4.9 76.8 ± 7.4 4.60 ± 0.50 59.9 ± 4.2 177.1 ± 13.5 a Data presented without standard deviation are calculated from the average bodyweight measured in the respective studies. b V˙O2max and AT presented are from valid and reliable tests, not estimations. c Number of teams. d Including elite juniors. A = attacker; AT = anaerobic threshold; CB = central-back; Czech = Czech Republic; D = defender; EbP = elite players beginning of puberty; EeP = elite players end of puberty; FB = full-back; G = goalkeeper; M = midfield player; U = under; V˙O2max = maximal oxygen uptake. 2005 Adis Data Information BV. All rights reserved. Sports Med 2005; 35 (6)
- 15. Physiology of Soccer 515 ity.[107-109] Nevertheless, in sports-specific training for high-velocity movements, a combination of maximum strength training in a basic nonspecific movement with emphasis on high velocity and high mobilisation of power, and training the fast move-ment in the same period of time, gave a substantially higher increase in movement velocity[102,110] than training the fast movement itself, even with supramaximal velocities.[111] These findings ques-tion some of the fundamentals of trying to establish both movement and velocity specificity as basics for strength development. Considering maximal strength from testing of other explosive events, it Table VI. Maximal oxygen uptake (V˙O2max) and running economy in two subjects differing in bodyweight (reproduced from Chamari et al.,[85] with permission)a Subject A Subject B (80kg) (50kg) Running economy,b V˙O2submax mL/lmb/min 34.5 39.0 mL/lmb0.60/min 199 186 V˙O2max mL/lmb/min 55 60 mL/lmb0.72/min 188 179 a Variables measured in a V˙O2max treadmill test (treadmill slope: 5.5%). b Running economy measured at the end of 4 min at 7 km/h. lmb = lean body mass; V˙O2submax = submaximal oxygen uptake. would be reasonable to expect, for a 75kg male Tests employing free barbells will reflect the func- soccer player, squat-values >200kg (90º in the knee tional strength of the soccer player more accurate- joint) or about 11.0 kg/mb0.67.[26,57] The expected ly.[57] Furthermore, free barbells are readily availa- values for bench press would be 100kg or about 5.5 ble to most teams and provide more teams the poten- kg/mb0.67.[57] It would be reasonable to expect that tial to develop a meaningful functional testing the elite soccer player has vertical jump height val-programme in conjunction with strength training. In ues close to 60cm.[26,57] A higher level of all strength strength-training studies, it has been observed that parameters would be preferable and would reduce measured increases in strength are dependent on the the risk of injuries and allow for more powerful similarities between training and testing exercise. jumps, kicks, tackles and sprints, among other fac-tors (table VIII).[28] This specificity in movement patterns in strength training probably reflects the role of learning and There exists little data for strength capacity in coordination.[102,103] The neuromuscular system also female soccer players. However, Helgerud et al.[91] reacts sensitively, in terms of adaptation to slow or compared one of the best female teams in the world fast contraction stimuli.[25,104] Increased peak torque (Trondheimsørn, Trondheim, Norway) with Rosen-has been observed at, or near, the velocity of train- borg Football Club, Trondheim, Norway. To per-ing[ 105,106] and at speeds below training veloc- form such comparisons, dimensional scaling must Table VII. Physiological profile of female soccer players Study Level/country n Anthropometry (±SD) V˙O2max (±SD) height (cm) weight (kg) L/min mL/kg/min mL/kg0.75/min Davis and Brewer[94] National/England 14 166.0 ± 6.1 60.8 ± 5.2 48.4 ± 4.7 135.2 After training period 14 166.0 ± 6.5 59.6 ± 5.2 52.2 ± 5.1a 145.0 Evangelista et al.[95] Division 1/Italy 12 49.75 ± 8.3 138.5b Helgerud et al.[91] Elite/Norway 12 169.7 ± 7.1 62.5 ± 7.4 3.36 ± 0.37 54.0 ± 3.54 151.5 ± 9.3 Jensen and Larsson[96] National/Denmark 10 169.0 63.2 53.3 150.3 After training period 10 57.6 162.4 Polman et al.[97] Elite/England 36 164.0 65.2 38.6a 109.7 After training period 36 164.0 62.7 45.7a 128.6 Rhodes and Mosher[98] University/Canada 12 164.8 59.5 47.1 ± 6.4 130.8 Tamer et al.[99] Division 1/Turkey 22 43.15 ± 4.06a 120.1b Tumilty and Darby[100] National/Australia 20 164.0 ± 6.1 58.5 ± 5.7 48.5 ± 4.8a 134.1 a V˙O2max is estimated. b V˙O2max calculated by using a bodyweight of 60kg, data presented without standard deviation is calculated from the average bodyweight measured in the respective studies. V˙O2max = maximal oxygen uptake. 2005 Adis Data Information BV. All rights reserved. Sports Med 2005; 35 (6)
- 16. 516 Stølen et al. 2005 Adis Data Information BV. All rights reserved. Sports Med 2005; 35 (6) Table VIII. Strength, power and jumping ability in male and female soccer players Study Level/country (sex) n Position Absolute (N/m) peak isokinetic concentric knee extension torque at Half-squat Jumping height different velocities (rad/sec) ± SD (cm) 0.52 2.09 3.14 4.19 5.24 kg kg/mb–0.67 CMJ SJ Adhikari et Nationals/India (M) 2 G 61.0a al.[61] 4 D 54.0a 5 MF 57.2a 7 A 55.3a Arnason et Division elite/Iceland (M) 8b 39.4 37.8 al.[27] Division 1/Iceland (M) 7b 38.8 37.0 Division elite-division 16 G 38.0 35.8 1/Iceland (M) Division elite-division 79 D 39.3 37.7 1/Iceland (M) Division elite-division 70 MF 39.3 37.6 1/Iceland (M) Division elite-division 49 A 39.4 37.8 1/Iceland (M) Bangsbo[65] Elite/Denmark (M) 5 G 260 ± 23 162 ± 9 13 CB 275 ± 20 165 ± 9 12 FB 268 ± 18 131 ± 6 21 MF 225 ± 6 134 ± 3 14 A 277 ± 22 161 ± 12 Casajus et Division 1/Spain (M) 15 47.8a 39.0 al.[58] Mid-season 15 46.7a 39.2 Davis et al.[112] Division 1 and 2/England 13 G 239 ± 46 (M) 24 CB 243 ± 31 22 FB 219 ± 31 35 MF 211 ± 30 41 A 222 ± 26 Diallo et al.[113] 12–13 years/France (M) 10 29.2 27.3 After training period (M) 10 32.6 29.3 Ekblom[3] Top team/Sweden (M) 59.0a Faina et al.[60] Amateurs/Italy (M) 17 36.9c 34.2 Professional/Italy (M) 27 43.5c 40.4 Continued next page
- 17. Physiology of Soccer 517 2005 Adis Data Information BV. All rights reserved. Sports Med 2005; 35 (6) Table VIII. Contd Study Level/country (sex) n Position Absolute (N/m) peak isokinetic concentric knee extension torque at Half-squat Jumping height different velocities (rad/sec) ± SD (cm) 0.52 2.09 3.14 4.19 5.24 kg kg/mb–0.67 CMJ SJ World class/Italy (M) 1 48.0c 35.0 Garganta et Elite-young/Portugal (M) 23 34.7c 33.3 al.[114] Non-elite young (M) 31.6c 30.3 Gorostiaga et Young players/Spain (M) 21 37.0 al.[115] Helgerud et al. Division 1/Norway (M) 21 115.7 6.3 57.2a (unpublished observation) After training period (M) 21 176.4 9.4 60.2a Division 1/Norway (F) 12 112.5 7.1 42.9 Hoff and Division 2/Norway 8 161.3 8.8 44.1c 38.6 Helgerud[72] After training period 8 215.6 11.8 46.8c 39.8 Leatt et al.[74] U-16,U-18/Canada 17 165 97 85 71 53.0a MacMillan et Youth team/Scotland (M) 11 129.1 7.49 53.4 40.3 al.[75] Mathur and Top players/Nigeria 18 48.7a Igbokwe[116] Polman et al.[97] Elite/England (F) 36 39.3a After training period (F) 36 44.8a Rahnama et Amateur premier/UK (M) 13 182 ± 34 129 ± 27 al.[117] Amateur post-exercise/UK 13 167 ± 35 118 ± 24 (M) Rhodes et al.[80] Olympic/Canada (M) 16 246 Siegler et al.[118] High school teams/US (F) 17 37.7d After training period 17 39.4d Tiryaki et al.[119] Division 1/Turkey (M) 16 64.8d Division 2/Turkey (M) 16 54.1d Division 3/Turkey (M) 16 57.0d Togari et al.[120] Nationals/Japan (M) 20 202 ± 37 157 ± 24 123 ± 17 101 ± 17 League players (M) 86 203 ± 34 162 ± 22 133 ± 21 102 ± 17 University national (M) 40 171 ± 26 149 ± 24 107 ± 21 95 ± 14 Youth national (M) 35 181 ± 42 146 ± 22 116 ± 24 97 ± 16 Continued next page
- 18. 518 Stølen et al. be considered when evaluating strength mea-sures.[ 57] In two geometrically similar and quantita-tively identical individuals, one may expect all line-ar dimensions (L) to be proportional. The length of the arms, the legs, and the individual muscles will have a ratio L : 1, the cross-sectional area L2 : 1 and the volume ratio L3 : 1. Since muscular strength is related to muscle cross-sectional area, and mb varies directly with body volume, whole body muscular strength measures will vary in proportion to mb0.67. In practical terms this means that strength training goals should not be given in relation to mb. A training goal of 0.8 times bodyweight for bench press or 1.5 times bodyweight for half-squats is easy for a light individual, but very difficult for a big person. Relative strength should thus be compared between individuals in terms of kg/mb0.67.[38] Abso-lute strength is important when attempting to move an external object such as the ball or an opponent. Strength relative to mb is the important factor when carrying bodyweight, especially for acceleration and deceleration in the soccer play. Relative strength comparisons are not functionally representative when values are divided by mb. If maximum strength is divided by mb for comparative purposes, the heavier individual’s capacity will be underesti-mated and not representative of on-field work ca-pacity. This information is important for coaches, and especially for evaluating physical fitness or work capacity in younger soccer players in different periods of growth where bodyweight and size differ significantly at the same age, as well as when com-paring physical capacities of male and female soccer players. Helgerud et al.[91] reported that Trondheimsørn lifted 112.5 ± 20.7kg in squats (corresponding to 1.8 ± 0.3 kg/mb and 7.1 ± 1.3 kg/mb0.67) and 43.8 ± 5.1kg in bench press (corresponding to 0.7 ± 0.1 kg/ mb and 2.7 ± 0.3 kg/mb0.67). Furthermore, they had 42.9 ± 3.3cm in vertical jump height. In the study of Helgerud et al.,[91] the female maximal strength in squats was 68% of the result for the male team, in absolute terms. Corrected for size, the capacity to move oneself in jumps and sprints, i.e. the relative strength for the female players was 79% of the male players, which shows that a big part of strength differences is really size difference. Female vertical jumping height was 76% of the male results, which Table VIII. Contd Study Level/country (sex) n Position Absolute (N/m) peak isokinetic concentric knee extension torque at Half-squat Jumping height different velocities (rad/sec) ± SD (cm) 0.52 2.09 3.14 4.19 5.24 kg kg/mb–0.67 CMJ SJ White et al.[121] Division 1/England (M) 17 59.8a Wisløff et al.[26] Division 1/Norway (M) 17 171.7 9.4 56.4a Division 1/Norway (M) 14 164.6 9.0 56.7a Division 1/Norway (M) 15 135.0 7.3 53.1a a With arms. b Number of teams. c No information whether arms were used or not. d Sergeant test. A = attacker; CB = central back; CMJ = counter movement jump; D = defender; F = female; FB = full-back; G = goalkeeper; M = male; MF = midfielder; mb = body mass; SJ = squat jump; U = under. 2005 Adis Data Information BV. All rights reserved. Sports Med 2005; 35 (6)
- 19. Physiology of Soccer 519 is in the lower part of differences reported. For tition.[1] Usually elite-level soccer referees reach bench press, the female players lifted 53% of the their ‘gold-age’ career level over 40 years of age.[124] male performance, also indicating that part of the Demonstration of that comes from the recent 2002 performance difference is a size difference. Correct- FIFA World Cup Finals in which the average age of ed for size, the female relative bench-press values the super elite-level soccer referees that officiated were 59% of the male values. Both results are in the competitions from the quarter-finals, was 41 ± 4 range of what is normally reported as sex differ- years (n = 8).[127] ences.[38] Part of the differences may also indeed be a result of differences in priority of strength training 3.1 Physiological Aspects of Refereeing and type of strength training performed. New stud-ies performing similar strength training in male and 3.1.1 Match Activity female soccer players will give new insight into sex Match-analysis studies reported that, during a differences in strength and power capacity in soccer. competitive match, a referee can cover a mean dis- 3. Soccer Referees tance of 11.5km, with ranges from 9 to 14km.[122,123,128,129] Of this distance, 16–17% is per- A soccer match is controlled by a referee who has formed at high intensity or at speeds >15–18 km/ full authority to enforce the laws of the game and is hour.[122,123] Standing is reported to account for free to move throughout the field using the most 14–22% of match duration.[122,123] Distances per-appropriate directional exercise modes in order to formed sprinting have been shown to range from gain optimal positioning. The referee is assisted by 0.5% to 12% of total match distance covered by an two assistant referees, each moving on the touch- elite-level soccer referee during actual match line in one of the two halves of the field. Although, play.[122,123,128,129] Analysis of between-halves dis-from the physiological point-of-view, the physical tance coverage is of great interest as it can reveal the stress imposed on the elite soccer referee could occurrence of fatigue and/or refereeing strate-resemble that found in soccer players playing in the gies.[122] With respect to this interesting aspect of midfield,[1,122] several aspects of a referees perform- soccer refereeing performance, there exist conflict-ance distinguishes him/her from that of a player’s ing results in the available literature. performance; for example, officials are not involved D’Ottavio and Castagna[122] reported a significant with the ball and cannot be substituted during the 4% decrease in total distance across halves in Serie match. Furthermore, compared with the soccer play- A (Italy) soccer referees. In contrast, Krustrup and ers that they normally officiate, referees have only Bangsbo[123] found no significant difference in total recently (and in limited numbers) become full-time coverage between halves in Danish top-level refer-professionals. ees. However, total distance should be considered as Another relevant aspect of soccer refereeing is only a gross measure of match activity.[130] In this the existing age difference between soccer players regard, analysis of those activities performed at high and soccer referees. For example, Bangsbo[1] report- intensity during the match may reveal more relevant ed that the average age of players competing in the information in the attempt to assess the likelihood of highest Danish league during the 1991/92 season possible fatiguing processes during the game. High-was 24 years. In contrast, the average age of referees intensity performance analysis revealed the occur-currently officiating at elite level in European coun- rence of a sort of ‘sparing behaviour’[122] in referees tries ranges from 38 to 40 years.[122-125] The differ- who officiated at high competitive level (Italian ence in the average age of players and referees may Serie A championship). In fact, in the study by exist because experience is considered, among the D’Ottavio and Castagna,[122] no between-half differ-international refereeing governing bodies, as a fun- ences in high-intensity coverage were detected de-damental prerequisite to officiate at the elite lev- spite a significant decrease of total distance. This el.[126] Paradoxically, an elite soccer referee reaches sort of ‘sparing behaviour’ has been confirmed in his or her best performance level at an average age longitudinal studies in the same population of elite-when most soccer players have retired from compe- level soccer referees.[131] In contrast, Krustrup and 2005 Adis Data Information BV. All rights reserved. Sports Med 2005; 35 (6)
- 20. 520 Stølen et al. Bangsbo[123] reported a second-half decrement in 3.1.3 Blood Lactate high-intensity activity, but no between-halves dif- Post-halves blood lactate concentration has been ference in total distance. These findings seem to reported to be approximately 5 mmol/L with no show that referees officiating at elite level may use significant differences across halves.[123] Blood lac-different refereeing strategies in order to conserve tate concentration analyses performed using during-energy during the game. From a refereeing strategy competition blood sampling revealed blood lactate concentrations as high as 7 mmol/L.[133] point of view, it would be advisable to have referees with a well developed ability to perform at high Similarly to what was reported in soccer players, intensity throughout the match. This ability is partic- these results support the notion that soccer referees ularly important for soccer referees as it has been experience substantial anaerobic exercise periods demonstrated that the most crucial outcome-related during the match. Further support to this observation activities may be revealed at the end of each half,[130] comes from the analysis of the post-first-half and where the likelihood of mental and physiological post-second-half blood lactate concentration ranges fatigue is higher. Similar to what was reported for found in elite-level soccer referees during competi-elite- level soccer players,[1] elite-level soccer refer- tive matches. In fact, it has been reported[123] in ees have been reported to change their motor beha- Danish elite-level soccer referees, high inter-indi-viour every 4 seconds, performing approximately vidual variation in blood lactate concentrations that 1270[123] activity changes by the end of an average ranged from 2–9.8 and 2.3–14.0 for the first- and the match. Recently, Helsen and Bultynck[124] found second-half, respectively. Those findings revealed that international-level soccer referees, in the at- that, as with soccer players, actual match-play blood tempt to regulate the behaviour of players, under- sampling may have had a profound effect on blood take 137 (104–162) observable decisions per match. lactate concentration results.[123,133] No difference in These results clearly show that elite-level soccer blood lactate concentration has been observed in referees of different competitive levels.[123] Howev-refereeing constitutes a demanding physical and er, comparisons among competitive levels were per-cognitive task. formed using post-half sampling and this may have affected the actual differences in match activities 3.1.2 Heart Rate that are usually observed in games at different com- Monitoring the HR of a referee compared with a petitive levels. soccer player is much more convenient as referees are not involved in physical contacts. The available 3.1.4 Physical Fitness and Match Performance scientific literature shows that soccer referees usual- Although considered a crucial component of the ly attain mean HRs between 85–95% of the estimat- physical match performance,[134,135] soccer referees ed, or individual, HR do not seem to have high levels of aerobic fitness as max.[123-125,128,129,132] Similar values in both halves have been reported in Italian far as V˙ O2max levels are concerned. The few papers that have addressed this issue reported V˙ O2max and Danish elite-level referees.[123,132] In contrast, levels ranging from 40 to 56 mL/kg/min, with group Weston and Brewer[125] found lower HRs during the averages around 46–51 mL/kg/min.[123,125,135] Lac-second half in English premier league referees. tate thresholds considered as speed attained at fixed Direct metabolic assessment performed during blood lactate concentrations have been shown to be friendly matches, has shown that referees officiate, 10 and 13 km/hour at 2 and 4 mmol/L, respective-on average, at 68% of their V˙ O2max.[133] Using the ly.[136] Similar results have been reported by Krus- HR–V˙ O2 relationship Krustrup and Bangsbo[123] trup and Bangsbo[123] in top level Danish soccer and Weston and Brewer[125] estimated an 81% referees during treadmill running. Similar to soccer V˙ O2max involvement during competitive games. In players,[137,138] V˙ O2max has been reported to posi-this regard, Weston and Brewer[125] estimated higher tively affect match physical performance in soccer percentages of V˙ O2max during the first half com- referees.[136] Specifically, V˙ O2max has been shown pared with the second half (81.2 ± 5.6 vs 79.7 ± 6.1, to promote global space coverage and high-intensity p < 0.05). running.[123,136] 2005 Adis Data Information BV. All rights reserved. Sports Med 2005; 35 (6)
- 21. Physiology of Soccer 521 Recent studies have revealed that field tests may 23% improvement was detected over the distance be used to predict soccer referees physical match covered at high intensity (speed >15 km/hour during performance.[123,135] Castagna and D’Ottavio[135] actual match play). showed that in elite-level Italian soccer, referee per- Interestingly, distance from infringements was formance over a 12-minute run for distance[126] is lessened as a consequence of the training interven-related to match total distance and distance per- tion. Although no structured studies have been car-formed at high intensity (speed >18 km/hour). In ried out in order to validate this assumption, being as Danish elite-level referees, high-intensity running close as possible to the infringement is commonly (speed >15 km/hour) revealed to be related to Yo- considered a prerequisite of proper judgment in soc- Yo intermittent recovery test performance (distance cer refereeing.[126] covered).[123] These findings have a great impact on It could be argued that the training protocol used fitness assessments of soccer referees as these tests by the Danish referees[123] was not sufficient to allow easy and low-cost mass testing. induce the proper training stimulus to improve V˙ O2max; even if the pre-V˙ O2max was as low as 46.5 3.1.5 Training Experiments in Soccer Referees Soccer referees differ from soccer players in that mL/kg/min. It could be speculated that elite referees, they do not have to possess high levels of motor or older active subjects, may adopt higher training abilities in order to officiate; thus most of the train- intensities and possibly attain higher HR range ing time can be devoted to the development of (90–95% of HRmax) proven by Helgerud et al.[10] as capacities that are important to endurance and effective in improving V˙ O2max. Again, the use of speed[126] improvement. Researchers have reported short intervals (such as 16 × 1 minute or 24 × 30 the importance of space coverage for better position- seconds with 2 : 1 exercise vs recovery ratio) and/or ing[139] in soccer refereeing. Additional evidence is the period of the season (mid-season break) used for available regarding the positive effect of soccer the training intervention may have accounted for the referees’ aerobic fitness on match cover- absence of V˙ O2max improvements. In our view, age.[123,134-136] As a logical consequence of this, aero- soccer referees should use the same training princi-bic training should be the main choice in soccer ples as soccer players (described in section 5.1) to referee training. Training studies conducted on elite- improve their strength and endurance capacity. level soccer referees have confirmed the effective- 4. Exercise Training ness of structured and period-interval running for specific fitness.[123,140] Specifically, Krustrup and It is beyond the scope of the present article to Bangsbo[123] showed significant improvement in give a thorough review of the existing literature Yo-Yo intermittent recovery test performance (31 ± regarding different types of training and their ef- 7%, p < 0.05) implementing 3–4 weekly training fects, as well as detailed training plans. These topics sessions during which referees completed long (4 × are excellently covered elsewhere.[46,141-143] Howev- 4 or 8 × 2 minutes) or short (16 × 1 minutes or 24 × er, we will give a few examples of effective strength 30 seconds) running intervals. As exercise intensi- and endurance training regimens not highlighted in fied, Krustrup and Bangsbo[123] used HRs >90% of previous reviews. soccer referees’ individual HRmax during all inter-val- training bouts. This differs from what was re- 5. Endurance Training ported for junior soccer players that exercised at similar intensities;[10] no significant V˙ O2max im- 5.1 Training for Increased Aerobic Capacity provements were reported in this group (n = 8) of 38-year-old soccer referees. Significant improve- It has, for a long time, been known that cardiac ments occurred in the peripherica-dependent aerobic output limits V˙ O2max in well trained individuals.[144] fitness domain, such as lowering of HR and blood Furthermore, it is now known that there is no plateau lactate concentration at selected treadmill speeds in stroke volume in well trained athletes[145,146] as (12–16 and 14 km/hour, respectively). As a conse- previously reported in untrained subjects.[38] As car-quence of the training intervention, a significant diac output consists of maximal heart frequency, 2005 Adis Data Information BV. All rights reserved. Sports Med 2005; 35 (6)
- 22. 522 Stølen et al. which is intrinsic and unchangeable, and stroke vol- perform interval training either as pure up-hill run-ume, endurance training to enhance V˙ O2max should ning or by means of the soccer-specific track. How-be designed to improve the stroke volume. Interval ever, it is not known whether this is true for elite training at an exercise intensity corresponding to soccer players as the highest value for V˙ O2max ever 90–95% of HRmax, lasting 3–8 minutes, separated reported for an elite soccer team, 67.6 mL/kg/min, by 2–3 minutes of active recovery at about 70% of was achieved through pure playing sessions.[57] HRmax, is an extremely effective training for in- Whether endurance training should be organised as creased stroke volume and V˙ O2max (unpublished a playing session, dribbling track or as purely run-observation). Recently, Helgerud et al.[10] showed in ning, it must be considered by each team. Monitor-elite junior players that interval training of 4 × 4 ing the training intensity during a playing session, minutes at 90–95% of HRmax (it normally takes 1–2 with the assistance of an HR monitor, will be helpful minutes to reach the required exercise intensity and in this regard. this period is part of the 4-minute interval), separat- A similar method to that described by Hoff et ed by 3 minutes active recovery at 60–70% of al.[39] was proposed by Platt et al.[148] suggesting that HRmax (for increased lactate removal) increased the groups of five or less may be more effective in V˙ O2max about 0.5% each training session. A similar younger players. For example, it seems that three-a-training programme, in which each training session side is preferable to five-a-side in terms of: direct lasted 35 minutes, was performed in a Norwegian, involvement in play; high-intensity activity; more elite soccer club twice a week, increasing V˙ O2max overall distance; less jogging and walking; higher from ~60 to ~66 mL/kg/min in 8 weeks (unpub- HRs; and more tackling, dribbling, goal attempts lished observation). and passes in young players.[148] As mentioned earli- In two recent studies (one unpublished),[10] the er in this section, the described interval training (4 × interval training was performed as uphill running. 4 minutes, 90–95% of HRmax, active pauses) im- The reason for this is that it is difficult to reach the proves the V˙ O2max by about 0.5% per training ses-desired exercise intensity close to V˙ O2max (90–95% sion. Unpublished data show that players with of HRmax) when running flat.[38] However, training, V˙ O2max >60 mL/kg/min require one interval train-purely by running, may raise motivational problems ing per week to maintain the V˙ O2, whilst players in soccer players. Hoff et al.,[39] therefore, designed with V˙ O2max >70 mL/kg/min require two interval a soccer-specific track as well as small-group play- trainings per week for maintenance. Thus, those ing sessions for specific interval training. Ball drib- players will increase their V˙ O2max by about 0.5% bling, changes of direction and backward running on per session beyond the required number to maintain the soccer-specific track are supposed to substitute the aerobic capacity. Furthermore, the beauty of this ‘up-hill’ when purely running. Similarly, Reilly[147] type of training is that it is possible to improve the showed that running with the ball increased the aerobic capacity of the team in a short period of energy cost by approximately 8% compared with time. purely running. Recently, we (unpublished data) tested the use- Hoff et al.[39] showed that interval playing in fulness of a 10-day ‘V˙ O2 cure’ for a Norwegian small-sided games induced a steady-state exercise second division team using the following receipt: intensity of 91% of HRmax, corresponding to about half of the players (n = 10) performed interval 85% of V˙ O2max, in Norwegian first-division play- training (4 × 4 minutes, using the dribbling track as ers. Furthermore, the corresponding values for run- described earlier in this section immediately after ning on the specially designed dribbling track were the regular soccer training; whilst the other half of 94% and 92%, respectively. Thus, both methods the players (n = 10) performed continuous dribbling were able to perform interval training. However, the at 70–75% of HRmax (corresponding to about 65% players with V˙ O2max >60 mL/kg/min had problems of V˙ O2max) for the same period of time (total of 28 reaching high enough intensities in the small-group minutes each training). The team alternated between play. Thus, it appears that in small-group play there one and two soccer training/interval sessions every is a ceiling of V˙ O2 above which one should prefer to second day, except at day 7, when no training was 2005 Adis Data Information BV. All rights reserved. Sports Med 2005; 35 (6)
- 23. Physiology of Soccer 523 performed. A total of 13 interval sessions were solute terms, but not in a percentage of V˙ O2max performed during the 10-day period. After the tenth (unpublished observation).[152] Also, running econo-day the players rested for a day, and performed my has been shown to improve substantially by regular soccer training for the next 4 days before re- interval training[10,152] and by high-intensity strength testing V˙ O2max. The interval group increased their training.[72,153,154] V˙ O2max by 7.3% (from 62 to 66.5 mL/kg/min, p < 0.001), whilst the other group increased from 62 to 6. Strength Training, Sprinting and 63.1 mL/kg/min (not significant). This illustrates Jumping Ability how it is possible, in a short period of time, to During a game, professional soccer players per-increase the aerobic capacity of the team, which form about 50 turns, comprising sustained forceful obviously may have an impact upon the on-field contractions, to maintain balance and control of the performance.[10,101] We suggest that soccer teams ball against defensive pressure.[5] Hence, strength with high ambitions should perform one or two short and power share importance with endurance at top-periods of ‘V˙ O2 cures’ in the preparation for the level soccer play. Power is, in turn, heavily depen-season (depending on the length of the preparation dent on maximal strength[23] with an increase in the phase), and one in between the two halves of the latter, being connected with an improvement in rela-season. In addition, the capacity should be main- tive strength and therefore with improvement in tained by one interval bout per week throughout the power abilities.[155] season. Furthermore, it seems like non-starters do Maximal strength is defined as the result of force-not improve their capacity throughout the sea- producing muscles performing maximally, either in son.[149] Thus, it may be necessary to differentiate isometric or dynamic pattern during a single volun-the training plan between the regular non-starters tary effort of a defined task. Typically, maximal and starters during the soccer season. strength is expressed as 1RM in a standardised There exists a myriad of other training regimens movement (and speed if performed using isokinetic to improve aerobic capacity, but in our view these equipment), for example the squat exercise. Power are not as effective as those described in section 5.1. is the ability to produce as much force as possible in Although there exists attractive methods that try to the shortest possible time. The muscle’s ability to simulate a soccer game,[18] it is our experience that develop force is dependent on many different factors these are not as effective as the described interval of which the most common factors are: initial posi-training because the exercise intensity is not high tion; speed of lengthening; speed of shortening; enough to challenge the limitation of soccer players’ eccentric initial phase; types of muscle fibres; num- V˙ O2max – the stroke volume. However, such train- ber of motor units active at the same time; cross-ing protocols may be valuable to simulate and study sectional area of the muscle; impulse frequency; and the physiology of a soccer game. Low-intensity substrate available for the exercising muscles.[105] training should, according to our view, not gain Two different mechanisms – muscular hypertro-priority in the planning of aerobic capacity of soccer phy and neural adaptations – are central in the players as they will naturally perform such efforts development of muscular strength. It is impossible during technical and tactical drills in normal soccer to generalise which type of training to choose and training. this must be judged by the coach and/or the individ- Training for improved anaerobic thresholds in- ual player. However, in general, we advise coaches volves continuous running for ≥30 minutes at an and/or soccer players to perform strength training exercise intensity corresponding to 85–90% of for neural adaptation if the player already carries HRmax.[150,151] As stated in section 1.1, the players ‘enough muscle mass’ as this type of training gives are exercising either above the threshold (accumu- advantages over just getting stronger (see section lating lactate) or below (for lactate removal). How- 6.1). In most cases, a combination of the two is the ever, the best exercise training regimen to improve optimal solution starting with some weeks of train-anaerobic threshold is to improve V˙ O2max; then ing for hypertrophy before only giving priority to anaerobic threshold improves substantially[10] in ab- neural adaptation, regardless of playing position. 2005 Adis Data Information BV. All rights reserved. Sports Med 2005; 35 (6)
- 24. 524 Stølen et al. 6.1 Muscular Hypertrophy training period, an increase in activity of fast glyco-lytic fibres is seen with an increase in strength.[103] There is a connection between the cross-sectional The central nervous system recruits motor units by area of the muscle and its potential for force devel- sending nerve impulses to the motor neuron. The opment.[25] The hypertrophy occurs as an increase in increased firing frequency contributes to increased the myofibril content of the fibres.[156] For many potential for force development.[103] An increased soccer players, increased bodyweight as a result of activation of the muscle may be a result of a lower hypertrophy is not desirable because the player will threshold of recruitment and an increased firing have to transport a higher mb. In addition, increased frequency of the nerve impulses. These changes are muscle mass does not necessarily increase the high- possible explanations for increased strength. Both velocity strength.[157] However, for players whose maximal strength and rate of force development are goal is to increase muscle mass, this type of training is effective. important factors in successful soccer performance because of the demands apparent from game play.[9] Typically, bodybuilder training includes a great volume of high-resistance, slow-velocity movement Both should therefore be systematically worked on to promote the hypertrophic effect.[157] Several within a weekly schedule using few repetitions with methods for developing muscular hypertrophy are high loads and high velocity of contrac-tion.[ 24,25,102,103] reported.[104] Eight to twelve RM in series is often used. The execution of the exercises changes from Behm and Sale[105] suggest two major principles slow to fast, and particularly the eccentric phase is for maximal neural adaptation. To train the fastest slow.[25] The goal of such training sessions is to motor units, which develop the highest force, one exhaust the trained muscle groups. If the coach has to work against high loads (85–95% of 1RM) thinks more muscle mass is necessary for some that guarantee maximal voluntary contraction. Max-players we suggest performing this type of strength imal advantage would be gained if the movements training in the preparation phase (1–3 sessions per were trained with a rapid action in addition to the week) and switch to strength training for neural high resistance. As a method to increase the rate of adaptation close to and in the season as described in force development, upon neural adaptations, section 6.2. Schmidtbleicher[25] suggests dynamic movements with a few repetitions (3–7). The resistance should 6.2 Neural Adaptations range from submaximal to maximal (85–100% of 1RM) with explosive movements. This may give During recent years, the focus of strength training raise to neuromuscular adaptation with minimal hy-has turned to neural adaptations.[105] The term ‘neu- pertrophy.[102] Because of high resistance, the move-ral adaptations’ is a broad description involving a ment speed will be slow, but the muscular contrac-number of factors such as: selective activation of tion will be fast if mobilised during the concentric motor units; synchronisation; selective activation of phase of the movement, attempting to lift the weight muscles; ballistic contractions; increased firing fre-quency of nerve impulses; increased reflex poten- as fast as possible. Mobilisation in the concentric tial; increased recruitment of motor units; and in- phase of contraction is very important for achieving creased co-contractions of agonists.[158] A notable the described training adaptations (table IX). part of the improvement in the ability of lifting A significant relationship has been observed be-weights is a result of an increased ability to coordi- tween 1RM and acceleration and movement veloc-nate other muscle groups involved in the movement, ity.[23] This maximal strength/power performance such as those which stabilise the body.[159] To devel- relationship is supported by results from both jump op maximal force, a muscle is dependent on as many and 30m sprint tests.[25,155] Thus, increasing the active motor units as possible. In a maximal volunta- available force of muscular contractions in appropri-ry contraction the small oxidative fibres are recruit- ate muscles or muscle groups, acceleration and ed first[160] and the fastest glycolytic fibres are re- speed in skills critical to soccer such as turning, cruited last in the hierarchy. In the early stages of a sprinting and changing pace may improve.[7] 2005 Adis Data Information BV. All rights reserved. Sports Med 2005; 35 (6)
- 25. Physiology of Soccer 525 2005 Adis Data Information BV. All rights reserved. Sports Med 2005; 35 (6) Table IX. Sprinting performance in male and female soccer players Study Level/country (sex) n Sprinting performance (sec) [± SD] 5m 10m 15m 20m 30m 40m Brewer and Davis[161] Professional/England (M) 15 2.35 ± 0.07 5.51 ± 0.13 Semi-professional/England (M) 12 2.70 ± 0.09 5.80 ± 0.17 Chamari et al.[68] Junior/Tunisia-Senegal (M) 34 1.87 ± 0.10 4.38 ± 0.18 Cometti et al.[162] Division 1/France (M) 29 1.80 ± 0.06 4.22 ± 0.19 Division 2/France (M) 34 1.82 ± 0.06 4.25 ± 0.15 Amateur/France (M) 32 1.90 ± 0.08 4.30 ± 0.14 Diallo et al.[113] 12–13 years/France (M) 10 5.56 ± 0.10 After reduced training (M) 10 5.71 ± 0.20 Dupont et al.[163] International level/France (M) 22 5.55 ± 0.15 After training period 22 5.35 ± 0.13 Gorostiaga et al.[115] Young players/Spain (M) 21 0.95 1.09 Helgerud et al.[10] Juniors/Norway (M) 9 1.88 ± 0.06 5.58 ± 0.16 Division 1/Norway (M) 21 1.87 ± 0.06 3.13 ± 0.10 After training period (M) 21 1.81 ± 0.07 3.08 ± 0.09 Hoff and Helgerud[72] Division 2/Norway (M)a 8 1.91 ± 0.07 5.68 ± 0.21 After training period (M) 8 1.81 ± 0.09 5.55 ± 0.16 Kollath and Quade[164] Professional/Germany (M) 20 1.03 ± 0.08 1.79 ± 0.09 3.03 ± 0.11 4.19 ± 0.14 Amateur/Germany (M) 19 1.07 ± 0.07 1.88 ± 0.10 3.15 ± 0.12 4.33 ± 0.16 Little and Williams[165] Division 1 and 2/England (M) 106 1.83 ± 0.08 MacMillan et al.[75] Youth team/Scotland (M) 11 1.96 ± 0.06 Mohr et al.[34] Division 4/Denmark (M) 8 4.45 ± 0.04 Siegler et al.[118] High school teams/US (F) 17 3.00 ± 0.15 Tumilty and Darby[100] National/Australia (F) 20 3.31 ± 0.11 Wisløff et al.[26] Division 1/Norway (M) 17 1.82 ± 0.30 3.00 ± 0.30 4.00 ± 0.20 a Including elite juniors. F = female; M = male.
- 26. 526 Stølen et al. The results from a recent study[26] confirm that a between jumping height and team success, and con-strong correlation exists between maximal strength, cludes that more attention should be paid to jump sprinting and jumping performance in elite soccer and power training in the training plan of soccer players, thus supporting the findings from earlier teams. work.[23-25] There were also strong correlations be-tween maximal strength and the 30m sprint test, 6.3 Strength Training Effects on including the recorded times between 10–30m Endurance Performance where the acceleration is substantially smaller than between 0–10m, and with the 10m shuttle run test Few studies have examined the impact of where breaking velocity is part of the performance. strength training on endurance performance. Hick-son et al.[166] reported a 27% increase in parallel It should be noted that in one of the Rosenborg squat 1RM after 10 weeks of maximal strength Football Club studies,[26] strength training was per- training using squats and three supplementary exer-formed on an individual basis without any super- cises. V˙ O2max was unchanged during the same peri-vised regimen from the coach. However, all players od while short-term endurance (4–8 minutes), mea-did perform half-squats as part of their normal sured as time to exhaustion during treadmill running strength-training programme. Nine of the players and on a bicycle ergometer, increased by 13% and who participated in that study received additional 11%, respectively. Several well controlled studies advice from our research group and consequently suggest that power enhancement might improve integrated a strength-training programme twice a work economy in the order of 5–15%,[72,153,154] and week into their normal schedule. This involved us- that increased rate-of-force production was the main ing few repetitions with high loads and high velocity explanatory variable for improved work econo-of contraction as described in section 6.2. These my.[154] nine players had considerably higher values of 1RM compared with the other eight players. We have 6.4 Sprinting and Jumping Abilities recently demonstrated the effectiveness of such a training programme, increasing 1RM in half-squats Recent studies report that 96% of sprint bouts by approximately 35% (from 160 to 215kg). The during a soccer game are shorter than 30m,[167] with programme consists of three series of five repeti- 49% being shorter than 10m. The 30m sprint times tions performed twice a week over a period of 8 reported by Wisløff et al.[26] are in line with earlier weeks with the load being increased by 5kg each studies undertaken with elite soccer players.[10] time the athlete successfully completes the work However, the data also show that there were sub-load.[ 72] The high-strength group had undergone a stantial time differences evident within the 30m test. training regime with emphasis on maximal For example, 10m lap times could give important mobilisation of force, which normally results in high information indicated by substantial differences training effects on rate-of-force development and within the 30m test, some of the players having might mean that the correlation between maximal similar 30m time but notably different 10m perform-strength and all sprint and jump parameters are not ances. The implication of this is that it is possible to necessarily a global finding. Helgerud et al. (unpub- differentiate the focus of sprint training individually lished observation) showed that maximal strength based on split-time recordings (results summarised training for neural adaptation (8 weeks) significant- in table IX). ly increased: half-squat 1RM from 115 to 175kg; In this context, it must be emphasised that the 10m sprints improved by 0.06 seconds (correspond- 10m performance is a relevant test variable in mod-ing to an improvement of approximately 0.5m com- ern soccer. Indeed, Cometti et al.[162] have shown pared with pretest or an opponent running 0.06 that the actual French professional and amateur soc-seconds slower in 10m); vertical jump height by cer players had similar 30m sprint performances, but 3cm; and running economy by about 5%. These data that the professionals had significantly lower 10m are particularly interesting considering a study by lap times. Sprinting time from 1.79 to 1.90 seconds Arnason et al.[27] reporting a positive relationship over 10m are reported in the literature. This means 2005 Adis Data Information BV. All rights reserved. Sports Med 2005; 35 (6)
- 27. Physiology of Soccer 527 that the fastest players are on average 1m ahead of the slowest ones after only 10m of sprint. This could be crucial in the critical duels influencing the results of a game. The professional players are faster over 10 or 15m[161,162,164] than the amateurs. Some also report a faster sprint time over 30 or 40m in the professionals.[161,164] A recent study by Mohr et al.[34] showed that the sprint capacity was reduced in the start of the second half compared with the first. This was related to a lowering of the muscle temper-ature in the 15-minute break. The reduction in sprint capacity was avoided when performing a low-inten-sity re-warm up before the second half of the game. This information should at least be considered by elite teams participating in important international games, but also by teams at lower levels that want to optimise their sprinting performances in the first minutes of the second half of soccer games. Jumping heights (with freely moving arms) from 47.8 to 60.1cm are average values reported in the literature for adult players (table VIII). Goalkeepers have the highest scores,[61,168] while the midfielders jump lower than the other field players.[57,61,168] It also seems that non-professionals score lower on vertical jump tests in some studies[27,60,119] but not all.[169] 7. Anaerobic Power Anaerobic power is difficult to measure and not a focus in this review. Here we present only results from the Wingate test and Cunningham and Falkner run test (table X). Mean power in the Wingate test ranges from 637 to 841W. The goalkeepers have the highest anaerobic power, while the midfielders pre-sent lower values.[112] The same tendency occurs when measuring peak power. The literature reports run times from 62 to 92.5 seconds in juniors for Cunningham and Falkner run test. Leatt et al.[74] noted 10 seconds’ longer run times for under-18 players, compared with under-16 players (table X). 8. Evaluation of Physical Performance Tests are used to determine accurate values of V˙ O2max, anaerobic threshold, work economy, maxi-mal aerobic performance, strength and power, and anaerobic energy production, as well as talent iden-tification.[ 101,169] For the anaerobic tests, the goal is Table X. Anaerobic power in male soccer players Study Level/country n Position Anthropometry (±SD) Wingate (±SD) AST height (cm) weight (kg) peak power mean power fatigue (sec) [±SD] (W) (W) (% decrease) Brewer and Davis[161] Professional/England 15 75.0 ± 8.5 930 638 Semi-professional/England 12 82.7 ± 8.2 868 637 Davis et al.[112] Division 1-2/England 13 G 86.1 ± 5.5 1273 841 38.5 ± 3.2 24 CD 83.3 ± 6.3 1189 833 35.1 ± 7.8 22 FB 75.4 ± 4.6 1119 723 40.7 ± 8.0 35 M 73.2 ± 4.8 1037 684 39.8 ± 7.8 41 A 76.4 ± 7.2 1144 754 37.6 ± 9.3 Leatt et al.[74] U-16/Canada 8 171.1 ± 4.3 62.7 ± 2.8 62 ± 8.0 U-18/Canada 9 175.8 ± 4.4 69.1 ± 3.4 72 ± 10.0 Rhodes et al.[80] Olympic team/Canada 16 177.3 ± 6.5 72.6 ± 6.2 92.5 ± 9.5 A = attacker; AST = anaerobic speed test; CB = central-back; CD = central-defender; FB = full-back; G = goalkeeper; M = midfield player; U = under. 2005 Adis Data Information BV. All rights reserved. Sports Med 2005; 35 (6)