2. International Journal of Management Research and Development (IJMRD), ISSN 2248 – 938X(Print) ISSN
2248 – 9398(Online), Volume 2, Number 1, July-December (2012)
National Aluminium Company- An Overview
National Aluminium Company limited (Nalco) is considered to be a turning in the history
of Indian Aluminium industry. In a major leap forward, Nalco has not only addressed the need
for self-sufficiency in Aluminium but also given the country a technological edge in producing
this strategic metal as per world standards. It was incorporated as a public sector enterprise of the
under Ministry of mines, Government of India in 1981.
National Aluminium Company Limited, abbreviated as 'NALCO', has units all over India at
places like Angul and Damanjodi. National Aluminium Company limited (Nalco) is Asia’s
largest integrated aluminium complex, comprising bauxite mining, alumina refining, aluminium
smelting and casting, power generation, rail and port facilities, with the technology collaboration
of aluminium Pechiney of France (now Alcan ) ISO : 2000 certification of quality management,
registration of products at London Metal Exchange, environment care conforming to ISO
14001,low cost operations and international customer base, Nalco enjoys the status of a five –star
Export House.
Need for the Study
A lot of study on Financial Management of different companies has been done but as far
as it is known to the researcher, there is hardly any of Working capital management and
profitability analysis on NALCO. NALCO is largest integrated aluminium complex. Moreover,
no comprehensive study is available which investigates these issues by taking the time period of
15 years (1995 -96 to 2009-10).This study is an attempt to fill this gap. The study may prove
beneficial to the NALCO, the aluminium industry as also to the academics.
Collection of Data
Data and information are very important factor for any research. The secondary data will
be collected from annual reports, other financial statements of NALCO and websites of NALCO.
Besides these, various journals and periodicals such as Metal World, Centre for Monitoring
Indian Economy(CMIE),information published by Ministry of mines will also be considered.
Data will also be collected from article published by different websites.
Tools used for Analysis of Data
This study is concerned with the Working capital management and profitability position
of NALCO. In order to achieve the objectives of the study, secondary data will be used.
The collected data will be arranged in the form of tables so that meaningful inferences can be
drawn. The analysis would be carried out by making use of both simple and advanced statistical
tools including graphs, index numbers, percentages, multiple regression analysis, correlation
and various parametric and non-parametric test.
53
3. International Journal of Management Research and Development (IJMRD), ISSN 2248 – 938X(Print) ISSN
2248 – 9398(Online), Volume 2, Number 1, July-December (2012)
Period of the Study
As far as the time period is concerned, I shall take the period of 10 years from 2000-02 to
2009-10 for examining the objective of study, which will be divided into three parts of 5 years
each. Part 1 is started 2000-01 to 2004-05 and the Part 2 from 2005-06 to 2009-10. The
performance of the company is evaluated on the basis of these three parts of study period.
Limitation of the study
There are some limitations of this study, which are given below:
• Temporal coverage: all the analysis, interpretation and findings will be derived from the
financial year of 1995-96 to 2009-10. It has assumed that the study period was under
normal condition.
• Data used in financial analysis has been collected on annual basis thus the result derived
will be more useful for the long term plan and prediction not for short term. Further
analysis will support mandatory to fundamental study.
• The area of this study is limited to the aluminium company only.
• This study is mainly based on secondary data. Therefore, reliability of conclusion of the
study will be based on accuracy of secondary data and the limitation of using second
hand information will also affect the study.
In spite of above limitations, the reliability and usefulness of the inference can not be ignored
and will serve plethora of the purposes.
Objective of the Study
1. Evaluating the management of cash in the company.
2. Examining the credit policy and procedure of the company.
3. Analysis of the inventory management of the company.
4. Analyzing the working capital performance of the company.
5. Analyzing the effectiveness of working capital management in the profitability of the
company.
Hypotheses
Following null hypotheses are to be proven-
1. H0: Cash Balance of the company does not affect its operating expenses.
2. H0: Company does not create the provision for doubtful debts according to size of
receivables which is not affective for receivables.
3. H0: Level of inventory in the company does not affect its sales.
4. H0: Working Capital Management of the company does not affect its profitability.
54
4. International Journal of Management Research and Development (IJMRD), ISSN 2248 – 938X(Print) ISSN
2248 – 9398(Online), Volume 2, Number 1, July-December (2012)
Analysis of Cash Management in NALCO
H0 =Cash Balance of the company does not affect its operating expenses.
Table 1: Statement of Cash and Bank Balance and Total Operating Expenses
Cash And Bank Change in Total Operating Change in
Years
Balance Times Expenses Times
2001 66.00 409.95
2002 114.23 0.73 554.24 0.35
2003 49.56 -0.57 499.07 -0.10
2004 98.36 0.98 506.11 0.01
2005 755.21 6.68 639.85 0.26
2006 2193.71 1.90 708.02 0.11
2007 3686.53 0.68 781.56 0.10
2008 3516.46 -0.05 1022.24 0.31
2009 2869.04 -0.18 1257.25 0.23
2010 3152.35 0.10 1386.26 0.10
Average-Total 1650.15 1.14 776.46 0.15
Source: computed from annual reports of National Aluminium Company
Table 1 shows that there is a large gap between cash balance and operating expenses in the year 2001, but
it was not largest. The largest difference between these two is happened in the year 2003 when the cash
and bank balance is Rs. 49.56 crore and the operating expenses Rs.499.07 crore. The scenario has been
changed from the year 2005 and it is continued till the end of the study period. Although, the trend of the
cash and bank balance is fluctuating during the study period but ultimately it has grown from Rs.66.00
Crore in 2011 to Rs. 3152.35 Crore in 2010. On the other hand, total operating expenses shows the
increasing trend throughout the study period. It has been reached to Rs.1386.26 Crore in 2010 from
Rs.409.95 Crore in 2001. Total operating expenses is higher than the cash and bank balance during 2001
to 2004. Table depicts that most of the time cash balance shows good position of the company to meet its
operating expenses.
Regression Analysis
The least square estimate of the equation CASH=a+bTOE+e
Where, CASH = Cash and Bank Balance and TOE = Total Operating Expenses
Table 2: Regression Analysis
Co-efficient
Variable Coefficient Std. Error t-value p-value
of Correlation
Constant -1272.68 823.07 1.5463 0.0803
TOE 3.7643 0.9803 3.8399 0.0025 0.805157
Standard error of estimate (SEE) 990.3241
Coefficient of determination (R-squared) 0.6483
The table 2 shows that the co efficient of correlation between Cash and Bank Balance and Total
Operating Expenses show high degree of co-relation of 0.81. The impact of total operating expenses on
cash and bank balance is shown with the help of regression analysis. The table shows that for a unit
change in total operating expenses, cash and bank balance changes 3.76 units, which is statistically
significant at 5% level. Total Operating Expenses explain 64 % of the variation in the Cash and Bank
Balance in the NALCO. The table shows the satisfactory table, thus the null hypothesis has been rejected.
55
5. International Journal of Management Research and Development (IJMRD), ISSN 2248 – 938X(Print) ISSN
2248 – 9398(Online), Volume 2, Number 1, July-December (2012)
Analysis of Receivables
H0= NALCO does not create the provision for doubtful debts according to size of receivables which is not
affective to company’s credit policy.
Structure of Receivables
Table 3: Structure of Receivables in NALCO
Less: Provision Total Debt
Debts Over Six
Year For Doubtful Over Six Others Total Change
Months
Debts Months in Times
2001 198.18 42.29 155.89 107.18 263.07
2002 186.41 42.30 144.11 113.72 257.83 -0.02
2003 70.73 42.66 28.07 73.76 101.83 -0.61
2004 97.57 42.83 54.74 47.50 102.24 0.00
2005 55.31 40.62 14.69 78.12 92.81 -0.09
2006 40.77 40.63 0.14 29.28 29.42 -0.68
2007 41.03 40.63 0.40 33.73 34.13 0.16
2008 40.96 40.56 0.40 60.25 60.65 0.78
2009 39.56 39.12 0.44 26.06 26.50 -0.56
2010 39.22 39.10 0.12 181.66 181.78 5.86
Average 80.97 41.07 39.90 75.13 115.03 0.54
Source: computed from annual reports of National Aluminium Company
Table 3 depicts that Debt over Six Months reduced over the period from Rs.198.18 Crore in 2001 to
Rs.39.22 Crore in 2010. Total size of receivables is fluctuated throughout the study period but finally it
reduced to Rs.181.78 Crore in 2010 from Rs.263.07 Crore in 2001. Reduction in receivables shows the
rigid credit policy of the company.
Regression Analysis:
The least square estimate of the equation RCBL=a+bPDD+e
Where, RCBL=Receivables and PDD= Provision for Doubtful Debts
Table 5: Regression Analysis
Coefficient of
Variables Coefficient Std. error t-value p-value
correlation
Intercept -997.72 856..76 1.1645 0.14
PDD 27.09 20.85 1.30 0.12 0.42
Standard Error of Estimate (SEE) 86.36
Coefficient of determination (R-squared) 0.17
Table 5 shows that one unit change in Provision for Doubtful Debts changes 27.09 units in total
Receivables, which is statistically not significant at the level of 10 percent. The result also shows
moderate degree of correlation of 0.42 between these two variables. This result is not satisfactory, thus, it
is proved that size of receivables and provision for doubtful debts are not affected by their change in
value, this is the result of company’s rigid credit policy.
56
6. International Journal of Management Research and Development (IJMRD), ISSN 2248 – 938X(Print) ISSN
2248 – 9398(Online), Volume 2, Number 1, July-December (2012)
Analysis of Inventory
H0= Level of inventory in the company does not affect its sales.
Table 7: Structure of Inventory in NALCO
Year Raw Stock In Trade Stores Etc. Total Gross
Materials change Sales Change
2001 48.25 144.88 214.07 407.20
2406.32
2002 57.52 164.33 262.47 484.32
0.19 2385.74 -0.01
2003 71.61 137.60 280.04 489.25
0.01 2739.67 0.15
2004 48.08 148.85 283.55 480.48
-0.02 3338.87 0.22
2005 56.17 175.41 297.48 529.06
0.10 4439.99 0.33
2006 50.48 235.35 305.75 591.58
0.12 5287.36 0.19
2007 82.45 246.60 305.91 634.96
0.07 6514.51 0.23
2008 65.59 266.93 354.13 686.65
0.08 5474.45 -0.16
2009 68.38 362.90 410.62 841.90
0.23 5517.52 0.01
2010 64.57 351.00 529.35 944.92
0.12 5311.4 -0.04
Average 61.31 223.39 324.34 609.03
0.10 4341.58 0.10
Source: computed from annual reports of National Aluminium Company
Table 7 shows that the size of inventory is increasing every year except 2004 while it is reduced slightly
i.e. .02 times, total inventory reached to Rs.944.92 Crore in 2010 from Rs.407.20 Crore in 2001. Average
change in inventory is .10 times increase every year.
In the total inventory, the stores and spares etc. has bigger portion as compared to raw materials and stock
in trade. The average stores, spares etc. is Rs.324.34 crore, while raw material and stock in trade are
Rs.61.31 Crore and Rs.223.39 Crore respectively, which shows that company keeps low volume of raw
material.
Impact of Inventory to Sales of NALCO
The least square estimate of the equation SALE=a+b INV+e
Where, SALE = Gross Sales of the company and INV = Total Inventory
Table 8: Regression Analysis
Variable Coefficient Std. error t-value p-value Coefficient of
correlation
Intercept 530.06 1355.64 0.39 0.35
INV 6.26 2.15 2.91 0.01 0.72
Standard error of estimate (SEE) 1,112.06
Coefficient of determination (R-squared) 0.51
Source: computed from annual reports of National Aluminium Company
Table 8 shows the impact of size of inventory on Gross Sales of NALCO. The result shows that one unit
change in inventory increases sales by 6.26 units which is statistically significant at 5 percent level. The
coefficient of correlation between both variables, Sales and Inventory are high degree of positive
correlated of 0.72.
57
7. International Journal of Management Research and Development (IJMRD), ISSN 2248 – 938X(Print) ISSN
2248 – 9398(Online), Volume 2, Number 1, July-December (2012)
The independent variable explains 51 percent variation in gross sales of the company. The result rejects
the null hypothesis and gives satisfactory outcome.
Table 9 Structure of Gross Working Capital in NALCO
Year Inventories Sundry Debtors Cash And Bank Other Current Loans And CA/Gross
Balance Assets Advances Working
Capital
2001 407.20 (38.85) 263.07 (25.10) 66.00 (6.30) 49.88 (4.76) 262.09 (25.00) 1048.24
2002 484.32 (42.54) 257.83 (22.65) 114.23 (10.03) 41.54 (3.65) 240.53 (21.13) 1138.45
2003 489.25 (48.61) 101.83 (10.12) 49.56 (4.92) 89.80 (8.92) 276.06 (27.43) 1006.50
2004 480.48 (48.51) 102.24 (10.32) 98.36 (9.93) 86.51 (8.73) 222.92 (22.51) 990.51
2005 529.06 (29.21) 92.81 (5.12) 755.21 (41.70) 82.01 (4.53) 351.95 (19.43) 1811.04
2006 591.58 (17.94) 29.42 (0.89) 2193.71 (66.52) 118.62 (3.60) 364.55 (11.05) 3297.88
2007 634.96 (12.77) 34.13 (0.69) 3686.53 (74.11) 212.04 (4.26) 406.42 (8.17) 4974.08
2008 686.65 (13.62) 60.65 (1.20) 3516.46 (69.75) 236.47 (4.69) 541.10 (10.73) 5041.33
2009 841.90 (18.59) 26.50 (0.59) 2869.04 (63.35) 175.35 (3.87) 616.02 (13.60) 4528.81
2010 944.92 (18.14) 181.78 (3.49) 3152.35 (60.51) 145.00 (2.78) 785.59 (15.08) 5209.64
Average 609.03 (28.88) 115.03 (8.02) 1650.15 (40.71) 123.72 (4.98) 406.72 (17.41) 2904.65
Source: computed from annual reports of National Aluminium Company
Note: Values in Brackets Show percentage in Total Current Assets
Table 9 shows the position of current assets in NALCO, i.e. Net Current Assets. During the
whole study period cash balance keeps higher proportion than the other component of current
assets with 40.71 percent.
Total Current Assets increased from Rs. 1048.24 Crore in 2001 to Rs. 5209.64 Crore, which
shows five times increase. The lowest value of current assets is in the year 2004 when it is just
Rs. 990.51 Crore and it is highest in the year 2010 at Rs. 5209.64 Crore.
Trend of Working Capital
Working capital trends provide a base to judge whether the practice and prevailing policy of the
management with regard to working capital is good enough or an improvement is to be made in
managing the working capital funds.
The trend of working capital of National Aluminium Company is presented in table 10. It is
evident from the table that the working capital of NALCO marked a fluctuating trend during the
period under review. The net working capital of NALCO increased to Rs. 2989.71 Crore in 2010
from Rs. 243.23 in 2001. The linear least square trend values of working capital in NALCO are
shown in table. The yearly increase in working capital comes to Rs. 422.55 Crore. The difference
between actual and trend values are negative in the years 2003 to 2005 and 2009 to 2010 while
they were positive in the remaining years.
58
8. International Journal of Management Research and Development (IJMRD), ISSN 2248 – 938X(Print) ISSN
2248 – 9398(Online), Volume 2, Number 1, July-December (2012)
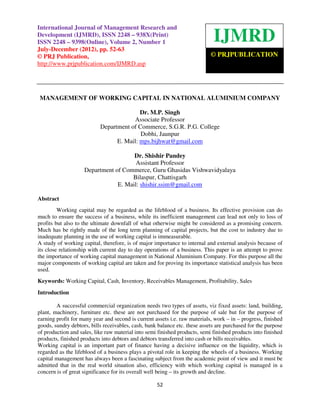
Table 10: Trend of Working Capital
Years Working Capital Trend Value Difference
2001 243.23 -202.77 446.00
2002 419.25 219.79 199.46
2003 -5.10 642.34 -647.44
2004 126.23 1064.89 -938.66
2005 1004.65 1487.44 -482.79
2006 2357.73 1910.00 447.73
2007 3755.47 2332.55 1422.92
2008 3500.45 2755.10 745.35
2009 2595.57 3177.65 -582.08
2010 2989.71 3600.20 -610.49
Source: computed from annual reports of National Aluminium Company
4000.00
3500.00
3000.00
2500.00
2000.00
1500.00
1000.00
500.00
0.00
-500.00 2001 2002 2003 2004 2005 2006 2007 2008 2009 2010
Original Net Working Capital Trend Value
From the figure1, it is easy to assess that working capital of NALCO decreased in 2003 and after
that it increased till the year 2007 and again it decreased. It shows that company having big
variation in working capital during the whole study period.
59
9. International Journal of Management Research and Development (IJMRD), ISSN 2248 – 938X(Print) ISSN
2248 – 9398(Online), Volume 2, Number 1, July-December (2012)
Financing of Working Capital
Table 11: Financing of Working Capital
Long Term
Short Term % of Long Term
years Gross Working Capital Sources of
Sources of Fund Source
Fund
2001 1048.24 805.01 243.23 23.20
2002 1138.45 719.2 419.25 36.83
2003 1006.50 1011.6 -5.10 -0.51
2004 990.51 864.28 126.23 12.74
2005 1811.04 806.39 1004.65 55.47
2006 3297.88 940.15 2357.73 71.49
2007 4974.08 1218.61 3755.47 75.50
2008 5041.33 1540.88 3500.45 69.44
2009 4528.81 1933.24 2595.57 57.31
2010 5209.64 2219.93 2989.71 57.39
Source: computed from annual reports of National Aluminium Company
A business firm has various sources to meet its financial requirements. Normally, the current assets of a
firm are supported by a combination of long – term and short – term sources of financing. In table 11, an
attempt has been made to explain the relative importance of long – term and short – term debt in
financing working capital. It is evident from the table that the percentage of the long – term funds used for
financing the working capital has shown the fluctuating trend during the period under study. It increased
from 23.20 percent in 2001 to 57.39 percent in 2010. During the study period, long term source for
working capital has been fluctuating in nature, it was at peak during 2007, which was 75.50% and lowest
during 2003 when it was completely financed by short term sources of fund.
Impact of Working Capital on Profitability
Table 12: Impact of Working Capital
PBT to
Year CR LR WTR ITR RTR CTR WC/TA
TA
2001 1.30 0.80 9.29 5.55 8.59 34.23 0.06 0.19
2002 1.58 0.91 5.31 4.59 8.63 19.48 0.08 0.10
2003 0.99 0.51 -502.80 5.24 25.18 51.74 0.00 0.13
2004 1.15 0.59 24.67 6.48 30.46 31.66 0.02 4.66
2005 2.25 1.59 4.10 7.79 44.43 5.46 0.17 0.32
2006 3.51 2.88 2.06 8.20 164.92 2.21 0.38 0.39
2007 4.08 3.56 1.58 9.36 174.05 1.61 0.50 0.48
2008 3.27 2.83 1.43 7.27 82.26 1.42 0.37 0.26
2009 2.34 1.91 1.96 6.05 192.25 1.78 0.24 0.17
2010 2.35 1.92 1.69 5.35 27.81 1.60 0.24 0.09
Average 2.28 1.75 -45.07 6.59 75.86 15.12 0.21 0.68
Source: computed from annual reports of National Aluminium Company
60
10. International Journal of Management Research and Development (IJMRD), ISSN 2248 – 938X(Print) ISSN
2248 – 9398(Online), Volume 2, Number 1, July-December (2012)
CR – Current Ratio, LR – Liquid Ratio, WTR – Working Capital Ratio, ITR – Inventory Turnover Ratio,
RTR – Receivables Turnover Ratio, CTR – Cash Turnover Ratio, WC/TA – Working Capital to Total
Assets, PBT to TA – Profit before Tax to Total Assets.
In the judgment of the liquidity position and its impact on profitability, it is necessary to analyze the
different working capital ratios as exhibit in the table 12. It appears from the table that current ratio of
NALCO has moved between 0.99 to 4.08 during the period of the study. Conventionally, a standard of
2:1 is considered satisfactory. It is thus, discerned, that the liquidity of NALCO, as measured by current
ratio is satisfactory. This signifies that the margin of safety available to short term creditors is relatively
high i.e., for every rupee of current liability the cushion available is Rs. 1.28.
The liquid ratio of the NALCO has moved between 0.51 to 2.88 during the entire period of the study
which is moderately good, as compared to the standard norm of 1:1, except in the years 2001 to 2004.
Table 13: Regression Analysis
Variables Coefficient Std. Error t-value p-value Coefficient
of
Correlation
Intercept -1.7604 9.1113 0.1932 0.4323
CR -4.1282 8.6960 0.4747 0.3409 -0.31
LR -6.7180 25.7663 0.2607 0.4093 -0.31
WTR 0.0062 0.0088 0.6984 0.2786 0.18
ITR 0.6886 1.2249 0.5622 0.3153 0.06
RTR 0.0036 0.0167 0.2176 0.4240 -0.16
CTR 0.0367 0.1095 0.3353 0.3846 0.28
WC/TA -24.2074 145.5006 0.1664 0.4416 -0.31
Standard Error of Estimate (SEE) 1.9894
Coefficient of Determination (R-squared) 0.5543
(adjusted for degree of freedom) 0.0000
Table 13 shows the result of regression analysis of impact of working capital. The co – efficient of
correlation between the profitability ratio and Current Ratio and Liquid Ratio of NALCO is -0.31. This
indicates that there is low degree of negative correlation between these two variables.
The co – efficient of correlation between the two variables, the correlation between profitability ratio and
working capital turnover, inventory turnover and cash turnover ratio indicates low degree of positive
correlation of 0.18, 0.06 and 0.28 respectively, whereas the correlation between profitability ratio and
receivables turnover ratio of -0.16 and working capital to total assets of -0.31 indicate low degree
negative co – efficient correlation. Thus, the correlation analysis show that CR, LR, RTR, and WC/TA
have shown negative correlation with profitability ratio and WTR, ITR and CTR have shown positive
correlation with profitability ratio.
The impact of working capital ratios on profitability of NALCO are shown with the help of multiple
regression analysis. Table shows that one unit increase in current ratio decreases 4.1282 units of
profitability, one unit increase in liquid ratio decreases 6.718 units and one unit increase in working
capital to total assets decreases 24.2074 units, whereas one unit increase in working capital increases
0.0062 unit, one unit increase in inventory turnover ratio increases 0.6886 unit, one unit increase in
receivables turnover ratio increases 0.0036 unit and one unit increase in cash turnover ratio increases
0.0367 unit of profitability ratio.
From the table it is found that no variable is statistically significant at 5 percent level. The independent
variables explain 55 percent of the variations in the profitability of the NALCO. Thus, the overall results
presented in the table are not satisfactory and it is proved that there is no impact of working capital on the
profitability.
61
11. International Journal of Management Research and Development (IJMRD), ISSN 2248 – 938X(Print) ISSN
2248 – 9398(Online), Volume 2, Number 1, July-December (2012)
Summary of findings & Suggestions
Cash Management: In the first four year of the study period, the cash and bank balance of the
company is lower than the total operating expenses, but from the year 2005 it keeps bigger
volume than operating expenses. The average cash and bank balance of the company is more
than double of average total operating expenses. Study depicts that most of the time cash balance
shows good position of the company to meet its operating expenses. The regression analysis
between these two variables has given satisfactory result as the co efficient of correlation
between Cash and Bank Balance and Total Operating Expenses show high degree of co-relation
of 0.81 and it is statistically significant at 5 percent level.
Receivable Management: in the company, total size of receivables is fluctuated throughout the
study period. The debt over six month has reduced to one fifth (1/5 approx.) of the debts over six
month from starting of the study to end of the study period, which shows company rigid credit
policy, although, provision for doubtful debts has been maintained around its average throughout
the study period. Total receivables reduced to Rs.181.78 Crore in 2010 from Rs.263.07 Crore in
2001. Reduction in receivables shows the rigid credit policy of the company. The regression
analysis does not show the satisfactory result, as the result shows moderate degree of correlation
of 0.42 between these two variables and also shows that it is not statistically significant at 5
percent level.
Inventory Management: Study shows small movement in the size of total inventory at an
average of 10 percent increase every year. The biggest proportion is retained in the form of store
and spares etc. Trend of sales is also similar as inventory. The average increase in sales is also 10
percent every year. It is found from the regression analysis that Sales and Inventory are highly
correlated positively of 0.72 and the result is statistically significant at 5 percent level. The
result of inventory management is satisfactory.
Working Capital Management: From the study, it is revealed that company has maintained big
portion of cash and bank of 40.71 percent which is higher than the normal size. Usually, it is
found that inventory keeps the larger proportion in the total current assets, which is near about
half of the total assets, but in NALCO average inventory is just 28.88 percent. In the first five
years of the study it is 41.54 percent but it is just 16.21 percent in the last five year, this is not an
ideal feature of size of inventory. Trend of the working capital shows fluctuating in nature. There
is no consistency in growth of the working capital. Such type of fluctuation is not good for
company. After the year 2004, bigger portion of gross working capital is financed by long term
sources of fund, which is less risky approach of financing of working capital. Only in the year
2003, the whole working capital is financed by the short term sources of fund.
Impact of working Capital: From the study it is found that NALCO’s current ratio and liquid
ratio is higher than the standard size, which shows company’s strong liquidity position. Other
turnover ratios show the satisfactory result, but when the impact of all ratios on the profitability
is tested through correlation and regression analysis, it is found that no variable is statistically
significant. The analysis does not give satisfactory result.
62
12. International Journal of Management Research and Development (IJMRD), ISSN 2248 – 938X(Print) ISSN
2248 – 9398(Online), Volume 2, Number 1, July-December (2012)
Suggestions
i. Size of cash is bigger as it should be near about 25 percent of total current assets. Therefore,
company should hold only the required amount of cash, because useless cash reduces
opportunity costs.
ii. NALCO creates provision for doubtful debts higher than the required size, which is charged
from the gross profit of the company. Therefore company should reduce its charge up to the
required size.
iii. NALCO should increase size of inventory, because company keeps less size of inventory as
its standard size should be half of the total current assets.
iv. Company uses long term source for financing working capital, this may be reason behind the
insignificant result of impact of working capital on the profitability. Therefore company
should use short term source of financing working capital.
Materialization of the above suggestions is expected to increase the profitability by maintaining
appropriate capital structure and leverage thereupon. The suggestions and recommendations will
also ensure proper inventory level, cash level and efficient working capital.
References
• Agarwal, N.K., “Management of Working Capital in India, A Research in Commerce and
Management”, Vol. 3, March 1990, pp 213-16.
• De, A.K. & Chakroborty, P.K., “Cash Management in ECL-A Case Study”, Indian
Journal of Public Enterprises, Vol. 7, No. 13., Dec. 1992, pp. 88-100.
• Series of Articles by Magee, J.F., “Guides of Inventory Policy”I-III, Harward Business
Reviews, 34 (Jan-Feb, 1956)P. 49-60, (Mar-Apr, 1956) p.103-116 and (May-June, 1956),
p.57-70.
• Hyderabad, R.L., “Evaluation of Working Capital Investment and Financing Policies of
Large Public Limited Companies in India”, Finance India, Vol. XIII, No. 3, September
1999, pp. 837-847.
• Mallick, Amit K. & Sur, Debasish, “Working Capital Management: A Case Study of
Hindustan Lever Ltd.”, Finance India, Vol. XIII No. 3, September.
• Vijaykumar, A. & Venkatchalam, A., “Responsiveness of Working Capital Management-
A Case Study of Tamilnadu Sugar Corporation”, Finance India, Vol. X, No. 3 September
1996, pp.647-655.
• Vijay, A. & Venkatchalam, A., “Demand for Working Capital in Private Sector Sugar
Industries of Tamilnadu-An Empirical Analysis”, Finance India, Vol.X, No. 2, June
1996, pp. 379-384.
• Annual Reports, NALCO
• Economic Survey
• www.nalco.com
63