SlideShare uma empresa Scribd logo
1 de 408
CONTENTS
Sect. Page
How to Proceed A-B
Foreword 1M 1-2
Basic Law 2M 1-4
Judging the Market by Its Own Action 3M 1-4
Forms oí Charts 4M 1-27
Buying and Selling Waves 5M 1-3
Chart Records 6M 1-4
Determining the Trend oí the Market - Composite. Averages 7M 1-35
Comparing Strength and Weakness - Group Averages 8M 1-25
How a Campaign is Conducted - Individual- Chart Studies - Part I 9M 1-10
How the OperatorIs Intentions may be Detected - Chart Studies II 10M 1-13
Figure Charts - Individual Chart Studies - Part III 11M 1-13
Figure Chart Studies - Individual Stocks - Part IV 12M 1-9
Figure Charts - N. Y. Times Average - Chart Studies Part V 13M 1-10
Market Technique - Volume Studies 14M 1-14
Signiíicance oí Trend Lines 15M 1-20
Vertical Line Charts - Chart Studies Part VI 16M 1-34
Vertical Line Charts - Chart Studies Part VII 17M 1-26
Selecting the Best Stocks - Position Sheet - Barometer 18M 1-19
How to Determine the Position oí an Individual Stock 19M 1-14
Buying and Selling Tests 20M 1-7
Reíinements 21M 1-10
The Wave Chart 22M 1-39
Stop Orders 23W 1-17
General Instructions - Cautionary Suggestions 24M 1-18
Market Philosophy - Cautionary Suggestions (Cont.) 25M 1-11
Addenda A1-A7
Copyright 1937 by Wyckoff Associates, Inc. Page A
HOW TO PROCEED WITH THE STUDY OF THE
RICHARD D. WYCKOFF COURSE OF INSTRUCTION
The following is recommended as a plan of study which should facilitate
your progress and enable you to get the most out of this Instruction:
1. Read through the entire Course casually without attempting to study any
part of it. YOU will find numerous cross-references in the text. Disregard
these for the present. Let your, first casual reading be for the purpose of
gaining a general idea of the scope and presentation of the subject matter.
2. Read through the entire Course a second time, again, ignoring the cross-
references. This time, weigh the meaning of each paragraph more care-
fully, but do not attempt to dwell upon any part or section for more than
a few minutes yet. Let the purpose of this second reading merely be to
impress upon your mind more firmly the ideas you absorb as you go
along.
If necessary, read the whole Course through a third time before you begin
to concentrate on any particular part. By these repeated readings you will
find that your memory will retain more firmly the ideas that are
presented in each section. Then, when you do begin to study and analyze
each paragraph intensively, you will have a clear understanding of the
way in which the various parts, fit into, the complete philosophy of this
Instruction.
Bear in mind that everything in the Course is important. Nothing is
superficial. Do not neglect those sections which are necessarily shorter,
than others. Every paragraph is as much an integral part of the Course
as any other paragraph.
3. On your second or third reading, mark any paragraphs that may not be
clear to you.
4. Now study carefully Sections 4M and 6M and practice making vertical line
and figure charts, as explained in Section 4M, until you are sure that you
understand how to construct them properly. Should you have any dif-
ficulty or doubts concerning the method of making the 1 or 3 point figure
charts or the vertical charts, consult our Coaching Staff - that is send us
samples of the charts you have made in accordance with your un-
derstanding of the instructions and we shall be glad to check your work.
5. Next, study and analyze carefully Sections 5M to 25M, inclusive, again
marking any portions of the text which may not be clear to you. Make full
use of all cross-references and - footnotes as you go along. .The cross-
references are indicated thus: "Sect. -, Pg. -, Par. -," which means that
when you come to one of - these references you should turn to the
Indicated section, page and paragraph and study it in conjunction with the
text in the part of the Course where you are at the moment. Note that
paragraph one begins on any given page, with the first indentation on
that page.
For instance, turn to Page 2, Section 3M. Paragraph 1 begins with the
Copyright 1937 by Wyckoff Associates, Inc. Page B
fifth line from the top of the page, which reads "No one can deny, etc.";
Paragraph 2 begins with the words "Tape Reading and Chart Reading,
etc." The first four lines on the top of the page are the run-over from
paragraph 5 on the preceding page.
In all cases where charts are discussed, follow the instructions given in
Section 7M CPg. 2, Par. 3) for studying them alongside of the reading
matter in the Course.
6. Review the portions of the text you may have marked as suggested in
items 3 and 5, above. If you still find that you do not understand them,
send us a list of these questions Creferring to the proper section, page
and paragraph number) and any other questions, that I are puzzling
you, so we may clear up your difficulties.
7. Next, practice making up a Position Sheet and the Technical Position
Barometer, consulting freely the instructions contained in Sections 1BM
and 19M.
B. You will now be ready to test your ability to apply the principles you
have learned from this Course by making a series of paper trades.
9. After you have completed the above steps, one by one, if you have troub-
le, in applying any of the principles, or if your paper trades do not de-
velop according to expectations, you are urged to select a paper trade,
that illustrates your difficulty and submit it to us. Be sure to include a
statement showing when and at what price you bought or sold; where
you placed your stop, the technical position of the stock as you
understood it at the time you entered the trade; and an outline of the
reasoning you employed in arriving at your decision to make the trade.
10. It will be advisable also for you to send us copies of your Position
Sheets and Records of Paper Trades for review and criticism. Please use
the short forms of these records which are furnished you for the
purpose of securing this additional instruction. Do not fail to accompany
these records with full outline of your own reasons for your decisions.
11. As you gain proficiency in the application of this Instruction and ac-
quire experience in the interpretation of market action, you will find an
occasional review of your Course extremely beneficial. As your
knowledge of stock market technique increases, your Course will acquire
increasing value as a reference work. Therefore, do not lay it away -
but consult it often. It not only will refresh your memory of vital
principles, but by constant review will awaken you to the discovery of
refinements and principles that may have escaped your notice on earlier
occasions.
WARNING
Every paragraph - every line - in
this Course is vital - it was put for a
very definite purpose.
Do not negleet any part of it and
do not attempt to operate in the market
by this Method until you have
thoroughly learned the whole of it.
Copyright 1931 by Wyckoff Associates, Inc. Section 1M Page 1
FOREWORD
This is a method of judging the stock market by its own action.
It is intended for investors as well as for traders.
It has been planned and prepared for those who desire to safeguard their
investment capital against, and to make money from, the fluctuations in the
priced of stocks dealt in on the New York Stock Exchange or any other organized
exchange.
It is applicable as well to bonds, preferred stocks and the leading com-
modity markets.
Anyone who buys or sells a stock, a bond or a commodity for profit is
speculating if he employs intelligent foresight.
If he does not, he is gambling.
Your purpose should be to become intelligent, scientific and successful
investor and trader.
This Method is for those who have had either little or no experience
operating in the stock market, or for those who have had much experience but
who have never been shown the real rules of the game.
Out of the very limited number who really understand the inner workings
of the stock market, practically no one has been willing to show the public the
real inside. I believe it is time for someone to step forward and do this.
The appalling losses, in securities, suffered annually by millions of people,
are enough to make the angels weep.
These losses are the direct result of stock market plunging by people,
most of whom do not realize what they are risking, and who have an amazingly
small knowledge of the market.
That the American public needs help in its security market operations
there can be no question. I believe the best way to help people is to show
Copyright 1931 by Wyckoff Associates, 1nc. Section 1M Page 2
them how to help themselves; and so 1 am here offering the cream of what 1 have
learned in forty years of active experience in Wall Street.
By the methods herein explained, 1 have made a great deal of money for
myself and my clients and subscribers who numbered in excess of 200,000. By
making this available to those who desire to learn the business or trading and
investing in stocks - for it is a business just like law, medicine, or any other - 1
hope to be of still greater service, not only to my former patrons, but to others
who have not had an opportunity to invest under favorable conditions.
After you have learned this Method, you can devote half an hour, an
hour, all day or as much time, as you like, to forecasting the market, selecting
the best stocks in which to make commitments and the best time to buy and sell.
You can learn from this how to develop independent judgment, so that you
need never ask anyone's opinion or listen to anyone's tips, or take anybody's
advice. You can so train your judgment that you will know just what to do and
when to do it. When you are in doubt you will do nothing.
1 do not claim that you can be invariably right. No one could. What 1 aim
to do is to show you how to be right in the majority of instances. This will require
close study and self-training on your part.
1 will teach you how to read the market from your daily newspaper; from
the tape of the stock ticker; from your charts, or any or all combined.
1 will teach you to plan your stock market campaigns just as a general
plans his battles.
eopyright 1931 by Richard D. Wyckoff Section 2M Page 1
THE BAS1e LAW OF SUPPLy AND DEMAND
1 had been in Wall Street 20 years when 1 discovered that it was possible
to judge the future course of the market by its own action. 1n my book, "Wall
Street Ventures and Adventures Through Forty years" (pg. 168) 1 stated my
experience and observations in 1909 as follows:
"1 saw more and more that the action of .stocks reflected the plans and
purposes of those who dominated them. 1 began to see possibilities of judging from
the very tape what these master minds were doing. My editorial work was proving
a most valuable means of self-education. 1n gathering material that would benefit
my readers, 1 was actively searching out the stuff that would aid me personally.
While my subscribers were given the best of what 1 collected, there was much in
material discarded which helped to build up what 1 might call a code of enlightened
procedure for use in this greatest of all the worldIs games.
"1 had a friend who had been a member of the Exchange and who was well
up on the technique of the market from the standpoint of the floor trader. We
often discussed the difference between reading the tape simply to follow price
changes (as most clients did) and reading the tape in order to judge the probable
action of stocks in the immediate future.
"Starting from the simple ground that the logical, action of a stock was to
decline when offerings exceeded the number of shares bid for and to advance when
the amount bid for was greater than the amount offered, we agreed that the
quantity or volume of stock changing hands in each succeeding transaction was of
great importance. Anyone who undertook to read the minds of the momentary buy-
ers and sellers was able to measure, to a certain degree, their eagerness or anxiety
to buy or sell; also to measure the force of the buying power or selling power as
shown by the number of shares; and to judge of the purpose behind the action,
Copyright 1931 by Richard D. Wyckoff Section 2M Page 2
whether it was to buy without advancing the price, or to force the price up, or to
mark it down, or to discourage buying or selling by others, as the case might be.
"Each transaction carried with it certain evidence, although it was not
always possible to interpret that evidence. All stocks no matter by whom they
were owned, bought or sold, looked alike on the tape. But the purposes behind this
buying and this selling were different and these might be fairly clear to those who
understood market psychology.
"Each transaction, although recorded only once, represented a meeting of
minds; those of a buyer and a seller. This meeting of minds took place at a certain
post on the floor of the Stock Exchange, even though the buyer might be in the far
west and the seller in Europe.
"Not all transactions were significant, but the interpreter must detect those
which were. He must see that some indicated a purpose. Some one or some group
was carrying, or attempting to carry, something through. He must take advantage
of that."
Continuing my studies of the tape, 1 realized, that the Basic Law of Supply
and Demand governed all price changes; that the best indicator of the future
course of the market was the relation of supply to demand.
The Law of Supply and Demand operates in all markets in every part of the
world. When demand exceeds supply, prices rise, and when supply is greater than
demand, prices decline. This is true not only of stocks; it is constantly being
demonstrated in markets for wheat, com, cotton, sugar and every other commodity
that is bought and sold; also in other markets such as real estate, labor, etc.
1 demonstrated this further in a series of articles entitled: "Studies in Tape
Reading" which attracted wide attention as the first of their kind ever published
anywhere, so far as 1 knew.
My basic idea in this series was that the stock market, by its own action,
Copyright 1931 by Richard D. Wyckoff Section 2M Page 3
continually indicates the probable direction of its immediate and future trend, and
anyone able to determine this with accuracy should attain success in trading and
investing.
Coming events, I claimed, were foreshadowed on the tape because large
interests there disclosed their anticipation of advances or declines by their
purchases or sales. So, too, with the manipulator who was endeavoring to raise or
depress prices. If one were to become sufficiently expert, he could judge by the
action of stocks what was in the minds of these large interests and follow them.
The trend was simply the line of least resistance. When a stock met op-
position in its rise, it must either be strong enough to overcome this resistance
(selling) or it must inevitably turn downward, and when, in its downward course,
sufficient buying was encountered to halt the decline, it would turn upward. The
critical moments in all these various phases of the market were these minor and
major turning points, or else the points where the price broke through the
opposition into a new field.
Further development of this method of judging the market from its own
action resulted in my using it as a basis for predicting the probable course-of-the
market, and this eventually led to my issuing weekly, "The Trend Letter" (first
published in 1911) which had a most successful career for many years. In fact,
the forecasts contained in this Letter were so accurate that a large following was
developed. As a result of a series of successful campaigns we were not only
overwhelmed with business but brokerage houses throughout the country passed
along these advices to their clients. So many followers were thus gained that an
undue effect was had on the quotations for the stocks in which we traded, and in
certain cases the effect on the market was important.
All of the above in much more detail, is described in my book "Wall Street
Ventures and Adventures Through Forty Years" which it is advisable for you to
Copyright 1931 by Richard D. Wyckoff Section 2M Page 4
read. My reason for mentioning these facts is to show that this method of judging
the market by its own action was highly successful, from the standpoint of profits
realized for subscribers who followed my advices, as well as for many thousands
of people who were not subscribers but who bought and sold when we did.
From the above you may judge how vital it is, in the stock market, as in
every other field, to get down to the right principles.
Copyright 1931 by Richard D. Wyckoff Section 3M Page 1
JUDGING THE MARKET BY ITS OWN ACTION
The business of Wall Street is to finance corporations and to sell the
securities - stocks and bonds - which result from this financing. Some secur-
ities are good; others not so good. Those who manufacture and sell them to the
public know their value best. The public has comparatively little idea of their
real value, except seasoned securities - those which have been on the market
for a long time and which, therefore, have established earning power and intrin-
sic value.
In every case the banker who does the financing and the dealers who help
him distribute, have paid for their securities either in cash or in services, or
underwritten them. The object is to market these stocks and bonds at as high
prices as possible. This marketing is done through distributing houses and syn-
dicates, by private sale, by public offering, and by means of listing on the stock
exchanges.
In the latter case, the stock is advertised by making it active on the tape.
If the price be advanced, and the transactions made large, the activity attracts
buyers, and those who are handling the stock are thus able to dispose of their
shares.
Sponsorship is continued after the market is thus made for a company's
shares. The bankers operate for themselves, or others operate for them. After a
stock is floated, its sponsors try to create a stable market and support the price
as well as they can without taking back too much stock. When it is thoroughly
distributed and enough people are interested in the stock to make a market which
takes care of itself, under ordinary conditions, the original banker, syndicate or
sponsor may discontinue operations and turn attention to some other which
affords a new opportunity for money-making.
Other interests may begin operations in that stock. Generally speaking,
Copyright 1931 by Richard D. Wyckoff Section 3M Page 2
there are usually one or more sponsors or large operators working in every
stock. Sometimes there are many. These interests see opportunities for profit,
accumulate a line, mark up the price when conditions are favorable, and then
sell out. Or they may sell short, depress the price and cover.
No one can deny that in Wall Street the, big fish eat the little ones.
Large operators could not operate successfully without the large number of
people making up the public; that is, if there were only ten big interests in the
market and no public, these ten could only make a profit by dealing with each
other. It would be difficult for one crowd to deceive any of the nine others. But
when the public enters the stock market, the large operatorIs game becomes
easier for him.
Tape Reading and Chart Reading, enable one to detect and profit by
these inside operations or manipulation; to judge the future course of stocks,
by weighing the relation of supply and demand. This sometimes can be done
from price movement alone, but if you consider also the volume of the
transactions you gain an additional and vitally important helpful factor.
By accurately judging this supply and demand, you are able to decide
the trend of the whole market and of certain stocks; also which stocks to buy
or sell, and, what is even more important, when to do so.
You always aim to select the most promising opportunities; that is, the
stocks which are likely to move soonest, fastest and farthest. You make no
commitments without sound reasons, and you avoid undue risks.
Whenever you study the tape or a chart, consider what you see there
as an expression of the forces that lift and depress prices. Study your charts
not with an eye to comparing the shapes of the formations, but from the
viewpoint of the behavior of the stock; the motives of those who are dominant
in it; and the successes and failures of the buyers and sellers as they struggle
for mastery on every move.
Copyright 1931 by Richard D. Wyckoff Section 3M Page 3
The struggle is continuous. The tape shows all this in detail. The charts
enable you to pick the market apart and study whatever portion or phase of it
you choose.
Supply and demand may be studied on the tape of the stock ticker, and
to even better advantage from charts.
The tape is like a moving picture film. Every minute of the day it is
demonstrating whether supply or demand is the greater. Prices are constantly
showing strength or weakness: strength when buyers predominate and
weakness when the offerings overpower the buyers. All the various phases
from dullness to activity; from strength to weakness; from depression to
boom, and from the top of the market down to the bottom - all these are
faithfully recorded on the tape. All these movements, small or great,
demonstrate the workings of the law of supply and demand. By transferring to
the charts portions of what appears on the tape, for study and forecasting
purposes, one is more readily enabled to make deductions with accuracy.
And now that you are undertaking to learn this Method it is best that
you prepare your mind for it by discarding most of the factors that you have
heretofore employed in forming your judgment and making your decisions,
such as: tips, rumors, news items, newspaper and magazine articles, analyses,
reports, dividend rates, politics and fundamental statistics; and especially the
half-baked trading theories which are expounded in boardrooms and popular
books on the stock market.
It is not necessary for you to consider any of these factors because the
effect of all of them is boiled down for you on the tape. Thus the tape does for
you what you are unable to do for yourself: it concentrates all these elements
(that other people use as a basis for their stock market actions) into the com-
bined effect of their buying and selling. You draw from the tape or from your
charts the comparatively few facts which you require for your purpose. These
facts are: (l) price movement, (2) volume, or the intensity of the trading, (3)
Copyright 1931 by Richard D. Wyckoff Section 3M Page 4
the relationships between price movement and volume and (4) the time required
for all the movements to run their respective courses.
You are thus far better equipped than the man who is supplied with all
the financial news, statistics, etc. from the whole world.
I, therefore, claim that:
You need never read anything on the financial page of your newspaper
except the table of stock prices and volumes.
You need pay no attention to the news, earnings, dividend rates or
statem ents of corporations.
You need never study the financial or the business situation.
You need not understand railroad or industrial statistics, the money
market, the crop situation, the bank statements, foreign trade or the political
situation.
You can absolutely ignore all the thousands of tips, rumors, reports and
especially the so-called inside information that flood Wall Street.
You can discard all of these completely and finally.
UNLESS YOU DO THIS YOU WILL BE UNABLE TO GET THE BEST RESULTS
FROM YOUR MARKET OPERATIONS.
Copyright 1931 by Richard D. Wyckoff Section 4M Page 1
FORMS OF CHARTS
Most of the principal moves in the market are made by large operators,
well informed insiders, bankers and pools, whose work we must detect and fol-
low. Practicably every stock has market sponsorship, although a stock's spon-
sors may not always be active in it (Sect. 14M, Pg. 12).
When important interests are accumulating a line of stock, a study of the
transactions will frequently disclose the fact; not in every case, but in the
majority. The more important the operations, the more easily are they discov-
ered by studying the price movement, the volume, the activity and the behavior
of stocks as the transactions appear on the tape.
An experienced tape reader can, without memoranda of any sort, carry
in his head the movements of a number of stocks over many weeks and months
and is able to give an opinion as to the present stage of the principal sponsor's
operations. But there is a better way than this - an easier, more accurate and
more reliable method of tracing these large, inside operations, so as to derive a
profit and capital appreciation for the individual investor. 1 refer to the use of
charts, or graphs, as some call them.
Charts are merely the tape transactions in graphic form. They record
market history. All transactions appear first on the ticker tape, from which
they are tabulated by the newspapers and printed in the morning and evening
editions. You, can, from the tape, or preferably from the newspapers and your
charts, secure all the information you need to study the market, and operate in
it effectively and profitably.
Charts have actual forecasting value because they indicate supply and
demand (pressure and support), the volume of trading and the time factor.
They form a concrete record of the forces lifting and depressing prices. There
is nothing so good for this purpose as charts. All the large interests in the
Copyright 1931 by Richard D. Wyckoff
Copyright 1937 by Wyckoff Associates, Inc.
Section 4M Page 2
Street for decades back have kept records of the market and of individual stocks
in chart form. Whenever anyone says it is foolish to keep charts, or to use them
in judging the market, you may put that person down as uninformed and either
unwilling to learn or incapable of interpreting chart records intelligently.
Most of the popular prejudice against charts undoubtedly is due to the fact
that many people mistakenly attempt to use charts mechanically - without
judgment. They endeavor to draw diagrams or imaginary geometrical patterns on
their charts, or apply arbitrary rules or systems such as "oscillators" and other
impractical notions. Such methods are wrong. They lead only to errors, losses
and discouragement. Therefore, you must remember this:- When you study charts
look for the motive behind the action which the chart portrays. Aim to interpret
the behavior of the market and of stocks not the fanciful patterns ("gaps,"
"horns," "flags," "pennants," etc.) which the charts may accidentally form.
One who understands how to interpret charts correctly can usually decide
whether the whole market, or any single stock, or group of stocks, is most likely
to advance, decline or stand still. Every market and every stock is always in a
bullish, bearish or neutral position (Sect. 18M, Pg. 4, Par. 3). The person who
can determine, with a high percentage of accuracy, the position in which the
market, or a group, or a certain stock stands, holds the key to success in trading
and investing.
Selecting the Charts Best Suited to Your Purpose: It may seem at first that
an unnecessary number of charts are herein suggested, but remember that I am
explaining this Method, without knowing just what experience, knowledge and
practice you have had in the market.
I am describing to you all of the records that may be used, and depending
upon your selecting therefrom what you find of most value for your individual
requirem ents.
Copyright 1931 by Richard D. Wyckoff
Copyright 1937 by Wyckoff Associates, Inc.
Section 4M Page 3
It has always been my rule to reduce the number, of my own charts to the
minimum. When I was doing by best work I discarded everything but a vertical
line chart of the daily average of 50 stocks, with volumes, and the figure charts
of about 150 leading stocks, depending for the balance of my deductions upon
study of the stock ticker tape.
After you have studied and practiced with some or all of the charts I have
suggested, you can select those you need for your individual purpose. If you do
not have access to a stock ticker and desire to invest for the intermediate and
major moves, it would be best for you to keep both types of charts mentioned
below, together with the Wave chart of Tape Readings described in a later section.
In this Method we use three kinds of charts: Vertical Line Charts, Figure
Charts and a Wave Chart.
VERTICAL CHARTS are made by drawing a vertical line to indicate the
range of a stock, from high to low, in a single Stock Exchange session. This
includes fractions; that is, the exact high and low points are recorded on the
chart (see illustrations on pages 4 and 5).
The closing price for the day should be indicated by a short horizontal
line, and each day's closing line may or may not be joined to that of the pre-
ceding day. The day's transactions represent all the pulling and hauling between
bulls and bears for that session, and the closing price indicates the net result of
the day's battle - a gain or a loss, therefore the closing marks (or lines joined,
so that they make a continuous line) indicate the net progress of the market.
Volumes for each day's trading are recorded by a vertical line extending
up from the bottom of the sheet, with a scale at the side. (See illustrations). On
Saturdays the letter S may be placed above the volume for that day so that the
volume of transactions for the two hour session may be distinguished from
DAILY PRICE RANGE AND VOLUME - U.S. STEEL
Date High Low Last Volume
Jan. 2 49 7/8 48 1/8 49 3/8 31,000
3 49 3/4 49 49 5/8 21,100
4 49 1/2 48 5/8 48 3/4 9,900
6 49 3/8 47 5/8 48 3/8 18,900
7 49 5/8 47 1/2 49 5/8 20,200
8 50 1/4 49 1/2 49 7/8 37,100
9 49 5/4 48 1/4 48 5/8 14,500
10 50 48 3/4 49 5/8 20,600
11 49 7/8 48 1/2 48 5/8 5,800
13 49 48 1/4 48 1/2 9,900
14 48 3/4 48 48 5/8 13,400
15 48 7/8 47 3/4 48 1/4 17,800
16 49 47 3/4 48 3/8 16,600
17 48 1/2 47 3/4 48 1/8 10,600
18 48 47 5/8 47 3/4 5,300
20 47 3/8 46 1/2 46 1/2 13,000
21 47 1/8 46 3/8 46 1/2 10,600
22 48 1/2 47 1/8 48 1/2 13,100
23 49 48 1/4 49 18,000
24 48 3/4 47 1/2 47 5/4 12,000
25 48 5/8 47 1/8 48 1/2 10,500
27 48 5/8 47 7/8 48 12,500
28 48 3/8 47 5/8 47 3/4 8,800
29 48 7/8 47 7/8 48 1/2 15,800
30 49 1/2 48 5/8 48 5/4 31,100
31 50 5/8 48 3/8 50 3/8 47,200
Feb. 1 51 1/4 50 3/8 50 3/8 25,600
3 51 5/8 49 5/8 51 5/8 36,400
4 52 51 3/8 51 7/8 21,700
5 52 l/4 50 7/8 511/8 36,000
6 51 7/8 50 7/8 51 12,100
7 51 7/8 50 3/4 51 18,600
8 51 7/8 51 1/8 51 7/8 9,700
10 55 5/8 51 7/8 55 3/8 66,200
11 50 1/2 56 5/8 58 І/2 82,400
13 59 1/2 58 5/8 59 44,400
14 59 57 3/4 58 3/8 30,300
15 59 3/4 58 59 5/8 19,000
Copyright1936byWyekoffAssoeiates,Ine.Seetion4MPage4
DAILY PRICE RANGE AND VOLUME Volume
Week Ended High Low Last (-000)
Feb. 4 58.81 54.30 54.8O 5,618
11 57.90 53.92 56.65 4,130
18 55.68 51.47 52.86 4,327
25 52.43 47.02 47.63 4,935
Mar. 3 51.63 47.03 50.50 5,365
18 59.93 55.32 57.04 8,671
25 57.92 52.92 54.07 4,977
Apr. 1 54.08 50.44 51.06 3,682
8 53.52 50.19 52.95 5,087
15 56.93 53.75 56.02 6,562
22 64.03 54.14 63.47 22,147
29 68.63 61.36 67.90 18,659
May 6 73.01 67.60 69.53 26,280
13 75.41 67.80 73.14 22,255
20 76.43 71.43 72.82 19,924
27 83.86 71.42 82.86 22,741
June 5 86.30 80.66 83.12 28,250
10 86.70 82.23 85.39 32,320
17 89.60 78.46 81.10 29,837
24 88.43 82.47 86.03 24,306
July 1 91.27 85.82 90.68 26,737
8 97.94 91.00 94.82 29,054
15 97.86 92.37 94.81 50,184
22 98.O5 76.53 79.90 42,336
28 86.60 81.42 84.31 12,849
Aug. 4 85.51 78.57 83.08 8,609
11 89.11 82.24 87.06 8,728
18 88.65 82.76 86.61 8,495
25 93.14 86.79 92.96 11,165
Sept. 1 93.79 89.55 91.51 20,939
9 91.03 85.96 87.12 5,761
16 92.76 86.87 90.99 11,246
23 92.68 82.29 86.16 15,933
30 86.31 79.15 81.58 9,158
Oct. 7 84.49 78.99 83.67 7,741
14 85.62 80.38 81.82 5,476
21 81.38 71.91 72.97 13,738
28 81.20 75.06 79.71 9,829
Copyright1936byWyekoffAssoeiates,Ine.Seetion4MPage5
Copyright 1931 by Richard D. Wyckoíí Section 4M Page 6
the volume oí the íive hour sessions. (Sect. 19M, Pg. 6, Footnote.)
Advantages oí a Vertical Chart: It is easily made írom the transactions
in your newspaper or írom the data recorded on our Daily Stock Chart Reports.
These show the price movement - highest, lowest and closing, and the volume.
From this -price movement alone we are able to judge the supply and demand,
the points oí resistance and support, and the trend. The volume (number oí
shares dealt in) indicates the intensity oí the trading and the quality oí the
buying and selling, and is a íurther essential aid in judging supply and demand.
The Time Factor is also important because it enables us to estimate the
speed oí the advances and declines - whether the buying or selling is urgent or
leisurely; whether it is slow or rapid accumulation, or distribution. The studies
which íollow in succeeding sections will explain this in a practical way.
From the volume and the price movement we íind the greatest aid: (a) in
determining the direction oí coming moves; (b)deciding when to buy or sell, when
to go long or short; (c) when a stock is on the springboard, and (d) when a move
is culminating.
Daily Vertical Charts are made to record the daily movements and
volume oí the averages, or groups or individual stocks. By the use oí these
charts, we are better able, to discern accumulation, distribution and other
phases oí manipulative (controlled) or uncontrolled moves in the market. By
condensing them into weekly, and monthly vertical charts we are able to
visualize the long time trend and to keep our perspective oí the long range
moves. However, the daily chart is most generally used because oí its greater
sensitivity and immediate historical value. In other words, weakly and monthly
vertical charts aid us to judge the marketIs present position in relation to the
general trend, that is, the major bull and bear cycles; but daily charts are more
eííective íor timing commitments advantageously and íor recognizing turning
points.
FlGURE CHARTS are equally valuable, but it is best to use these in com-
bination with vertical charts, so that all obtainable deductions may be made
Copyright 1931 by Richard D. Wyckoff Section 4M Page 7
therefrom. Figure charts take no account of fractions, nor do they take account
of time or volume. They represent the movement of a stock from one full figure
to the next full figure above or below, such as from 35 to 36 or 34. (See in-
structions for making figure charts, pages 9 to 14.) They are of great value in
estimating the probable extent of supply and demand and the points of resistance
and support.
From the general formations (not so-called patterns such as "saucers,"
"baskets," "fulcrums," etc., which are popular with some purely theoretical tech-
nicians) on the figure charts we are able to detect accumulation or distribution,
and we see clearly marked, the lines of support and supply. We can also identify
the marking up and marking down periods to excellent advantage by means of
these charts.
The most valuable feature of Figure Charts, however, is their horizontal
formations, which, in many cases forecast the approximate number of points a
stock, or a group, or the average should move. (Sections 10M to 13M.)
It is in these horizontal formations, or congestion areas, on the figure
chart that we find the greatest aid: (a) in determining how far a stock should
go; (b) when it meets opposition, viz., when it has about reached the end of
its move; and with the help of the vertical chart (c) determining the trend,
and (d) when a stock is on the springboard.
Figure Charts may be made:
(1) From the fluctuations as they appear on the ticker tape.
(2) From the Report of Stock Sales on the New York Stock Exchange, a
sheet that is published after the close of each session.
(3) From the Daily Stock Chart Reports which we will mail, to you each
day, containing the one point fluctuations of more than 200 leading, active
stocks. This service will be furnished gratis for six months.
(4) From the opening, highest, lowest and closing prices which appear in
your daily newspaper; or from vertical charts.
Copyright 1931 by Richard D. Wyckoff
Copyright 1937 by Wyckoff Associates, Inc.
Section 4M Page 8
The Tape shows every transaction that takes place on the Stock Exchange
floor. In order to build figure charts therefrom it is necessary to watch the
tape continuously for five hours on five days a week, and two hours on Satur-
days, so that every fluctuation in the full figures will be recorded on your
figure chart. This is an easy matter if one is watching only a few stocks, but
as the number increases, you may find it necessary to have some assistance.
The Sales Sheet, or Report of Stock Sale's, can be procured from Francis
Emory Fitch, Inc. under authorization of a New York Stock Exchange member; it
is available about 2 1/2 to 3 hours after the market closes. These sheets contain
all the transactions that appear on the tape during the day, arranged so that one
can easily run through the different prices at which all the stocks on the list are
dealt in, beginning with the opening transaction and including all those that
follow, in the order in which they occur. This is the equivalent of reading the
tape one stock at a time. It requires but a few moments for each stock, to record
the full figure transactions for a day. These sales sheets serve the same purpose
as the tape when it comes to building figure charts. One can find them in his
broker's offices in New York and he can stop in and get what he wants from
them early the next morning following publication. Or, his broker will subscribe
to these Sales Sheets for him and mail them to him.
Our Daily Stock Chart Reports contain every one point fluctuation in a
selected list of more than 200 leading, active stocks; the New York Times, the
New York Herald Tribune and the Dow-Jones averages; the Wyckoff Group
Averages; and the principal commodities; together with the volume and daily
price range data. This makes it possible for you to keep Vertical and Figure
Charts on all or any number of the most representative stocks and averages with
little trouble and expense. A further advantage of these reports is their accuracy
and the prompt correction of errors which may occasionally occur but which gen-
erally are not corrected in other sources.
Copyright 1931 by Richard D. Wyckoff
Copyright 1937 by Wyckoff Associates, Inc.
Section 4M Page 9
52
51 51
50 50
49 49
48 48
47 47
46 46
45
The Figure Chart, as we have stated, takes no account of anything except
the full figures. Fractions are discarded, as they are of no value in these cal-
culations. If you start with a stock which is selling at 50, you pay no attention
to any fluctuations except those of a full point or more from that figure. Your
next entry after 50 would be either 51 or 49, and after the latter figure is
recorded, you would record nothing until the stock sells at 50 or 48. When any
full figure is skipped, that is, when there are no sales between say 50 and 53,
you would record 51, 52 and 53 just as though there were sales at each of
these full figures. But if it rose to only 52 7/8 you would not record 53 until it
sold there.
To Make a 1 Point Figure Chart, your procedure should be as follows:
The stock stands at 50. It goes to 52. You would, therefore, enter the 51 and 52
in the same vertical column as, and above, the 50, thus:
52
51
50
It then declines to 45, or even to 44 1/8, but does not touch 44. You would
enter in the next column to the right 51, 50, 49, 48, 47, 46 and 45, thus:
52
51 51
50 50
49
48
47
46
45
It rallies to 49 or to 49 7/8, but does not reach 50 therefore, you would
enter in the third right-hand column 46, 47, 48 and 49, thus:
Copyright 1931 by Richard D. Wyckoff
Copyright 1937 by Wyckoff Associates, Inc.
Section 4M Page 10
A dip to 48 would call for an entry at that figure in the fourth right-hand col-
umn and a ral1y to 49 an entry of that figure just about the 48 thus:
52
51 51
50 50
49 49 49
48 48 48
47 47
46 46
45
Next a dip to 46 1/4, which calls for an entry of 48 and 47 in the fifth
column. A rally to 48 3/4 and another dip to 46 l/8 requires two entries in the
sixth column. And so on as per the illustration below, and in the charts shown
elsewhere in this volume:
52
51 51
50 50
49 49 49
48 48 48 48 48
47 47 47 47
46 46
45
The dotted lines drawn through the figures show the course of the market.
These lines, therefore, indicate how the chart should be made and how it should
be read.
Dates are indicated on figure charts as follows: On the last day of each
month a circle is put around the last entry which appears on the chart for that
month, and the initial of the following month is entered a few spaces below the
circle in the same vertical column. For example, turn to the 1 point figure chart
of Bethlehem Steel on Page 12, Section 11M, and you will see that a circle is
marked around the figure 69 in the second column which means that this was
the last entry for the month of October, and just below that the letter N
indicates that November begins here. A little further on there is another
circle with D under it. The circle indicates the end of November and the letter D
indicates that December begins here. Then the figure 51 is circled and below is an
entry J-31, which means that 51 was the last entry in December, 1930 and
January, 1931 begins here. The other months follow in the course.
When a stock sells ex-dividend this may be indicated by making all of the
entries for that day in red, or some such distinguishing color. The amount of the
dividend is then entered in the same vertical column below the graph. If no full
figure change occurs on the day the stock sells ex-dividend, the list entry on the
chart should be retraced in red, or some other distinguishing color.
To make a 1 point Figure Chart from your newspaper: Suppose you take a
stock which closed on Monday at 50. That would be your first figure on the figure
chart. Your newspaper records the fact that this stock opened today, Tuesday, let
us say, at 50 3/4 and went as high as 51 7/8; so you must record 51 on the
figure chart.. It does not go to 52. The lowest for the day was 45 3/4; hence after
it made the high at 51 it must have passed 46. You record on your figure chart
50, 49, 48, 47 and 46. The stick closed at 48 1/4, therefore it must have rallied
from the low of 46 to 48 and you would record 47 and 48 on your figureI chart
which would then look like this:
51
50 50
49 49
48 48
47 47
46
Assume that WednesdayIs transactions will show that the stock opened at 46
1/2, made a high of 49 1/8, a low of 45 and closed at 47. Your figure chart
would call for an entry at 47 because the stock closed on Tuesday at 48, and to
open at 46 1/2 it must have passed 47, which is the same as selling there. You
find that the high of Wednesday was 49 1/8, the low 45, but you do not know
which occurred first unless you watched the tape sufficiently to tell whether the
high point of Wednesday occurred before the low point or vice versa. If you
Copyright 1931 by Richard D. Wyckoff Section 4M Page 11
Copyright 1931 by Richard D. Wyckoff
Copyright 1937 by Wyckoff Associates, Inc.
Section 4M Page 12
have not watched the tape, it would be well for you to ask your broker to look at
his Sales Sheet and tell you when the stock was highest or lowest. Suppose the
high point of the market Wednesday was in the morning. You must assume that
your stock went to 49 1/2 after it touched 47. In this case you would make
entries on the figure chart as follows: 48, 49. Then as the low of the day was 45,
you must record 48 again, then 47, 46 and 45. And as the stock closed at 47 you
would record 46 and 47.
When completed, your two-daysI figure chart would look like this:
51
50 50
49 49
48 48 48 48
47 47 47 47 47
46 46 46
45
This is not so accurate a method as watching the tape, or using the Sales
Sheet, or our Daily Stock Chart Reports; for your newspaper does not give you all
of the fluctuations back and forth when a stock is oscillating, say between 45 and
47, once or twice in the dayIs session. But it is a reasonably good method if other
means are not available.
How to make a 3 Point Figure Chart. The 3 point figure chart condenses the
history recorded on the 1 point chart-by discarding all reversals of less than three
points.
The following explanation will make this clear: Suppose we begin with a small
section of a 1 point chart which shows a stock rising from 25 to 31, reacting to
30, then moving upward again to 32, as in Example A. In this, illustration, the
rise from 25 to 32 is interrupted by a reversal of only one point.
Therefore, this reversal must be disregarded in making the 3 point chart
which will simply show the net or total rise from 26 to 32 in one vertical column
as in Example B.
Copyright 1931 by Richard D. Wyckoff
Copyright 1937 by Wyckoff Associates, Inc.
Section 4M Page 13
Example A
1 Point Chart
Example B
3 Point Chart
32 32
31 31 31
30 30 30
29 29
28 28
27 27
26 26
25 25
Or suppose that the stock has moved straight up from 25 to 31, when its rise
is interrupted by a reaction of two points to 29, after which it recovers and goes to
a new high of 52, as in Example C. This reaction to 29 must be disregarded on the
3 point chart because it is a reversal of less than three points, so the 5 point chart
CExample D) should show only the full movement from 25 to 32, the same as in
Example B:
Example C
1 Point Chart
Example D
3 Point Chart
32 32
31 31 31
30 30 30 30
29 29 29
28 28
27 27
26 26
25 25
Developing our 1 point figure chart a little further, let us say it appears
as shown in Example E. Our 3 point chart would then appear as shown in
Example F, because after the stock has moved up from 25 to 31 and reacted to
29, its advance to 32 is followed by a three point reversal which forces us to
move over to the next right-hand vertical column on our 3 point chart.
Copyright 1931 by Richard D. Wyckoff
Copyright 1937 by Wyckoff Associates, Inc.
Section 4M Page 14
Example E
1 Point Chart
Example F
3 Point Chart
32 32
31 31 31 31 31
30 30 30 30 30 30
29 29 29 29 29
28 28
27 27
26 26
25 25
Should the decline from 32 continue on the 1 point chart, without a swing
of three points, or more in the opposite direction, we must continue to extend our
entries in the second column of our 3 point chart until such a reversal of three
points or more does occur, when we would move over to the next right - hand
column, as in the following illustrations:
Example G
1 Point Chart
Example H
3 Point Chart
32 32
31 31 31 31 31
30 30 30 30 30 30
29 29 29 29 29
28 28 28 28
27 27 27 27
26 26
25 25
Example J Example J Example J
1 Point Chart 3 Point Chart 5 Point Chart
32 32 32
31 31 31 31 31 31 31 31 31
30 30 30 30 30 30 30 30 30 30 30 30
29 29 29 29 29 29 29 29 29 29 29 29 29
28 28 28 28 28 28 28 28 28 28 28 28 28
27 27 27 27 27 27 27 27 27
26 26 26 26 26 26
25 25 25
Copyright 1931 by Richard D. Wyckoff
Copyright 1937 by Wyckoff Associates, Inc.
Section 4M Page 15
For additional illustrations of the distinction between the 1 point and the 3
point chart compare the two graphs on Page 8, Section 9M, or remove Page 10,
Section 13M from your binder and compare it with Pages 7, 8 and 9.
The 5 Point Figure Chart is constructed in the same manner by disregard-
ing all reversals of less than five points. A 10 point chart would disregard all
reversals of less than ten points.
It is VERY IMPORTANT that you learn how to make, read and fully under-
stand a 1 point and a 3 point chart before you go any further with your studies,
because if you do not understand these forms of charts, you will not get the full
benefit from the forecasts that are possible under this Method.
We also wish to impress on you the importance of using your 3 point fig-
ure chart forecast to compare with your 1 point, especially in studying the more
important, that is, the long range moves.
The purpose of the 1 Point Chart is to indicate immediate or shorter
swing objectives. The 3 Point Chart is designed primarily as a guide to the
general trend - to give you a broad perspective of the market and of individual
stocks and to indicate the probable objectives of the large swings.
As the small swings eventually build up into large ones (Sect. 5M, Pg. 1,
Par. 4), the objectives of the 1 point and of the 3 point charts frequently tend to
confirm each other, but hot in all cases. When you find a marked difference
between the indications of the two charts it is best to be guided by the more
conservative indication.
The 3 Point Chart is most generally used in conjunction with the 1 Point
Chart, but for very high priced or extremely volatile stocks, that is, the fast
movers, the 5 Point Chart may prove more satisfactory.
The Volume of Sales is not recorded on Figure Charts.
TREND CHARTS: The purpose of a Trend Chart is to enable you to keep in
harmony with the trend.
Copyright 1931 by Richard D. Wyckoff
Copyright 1937 by Wyckoff Associates, Inc.
Section 4M Page 16
There are two Trends to be considered in trading, as here advocated:
(1) the Immediate Trend for active traders who endeavor to get in and out on the
email swings, and traders on the floor of the New York Stock Exchange who, not
paying any commissions, sometimes can make turns several times a day;
(2) the Trend of the Intermediate Swings of 5 to 30 or more points; these in-
clude most of the managed campaigns.
Trend Charts that is, vertical charts of the leading composite averages,
may be kept in such a way as to show, on separate sheets, the daily and weekly
or monthly movements in whatever group of average figures you may select. If
one lives in New York, or near enough to secure the New York Herald Tribune or
the New York Times every day, he will find his Trend Chart already made for
him each morning in the financial page of these papers. The Wall Street Journal
and other financial and daily papers in different parts of the country regularly or
frequently carry similar charts. But there is a distinct advantage in keeping
oneIs own records in a loose-leaf binder (this size or pocket size). As each entry
is made on the Trend Charts and others, you can study the effect of the change
you are recording - their relation to the smaller and larger movements that are
under way and more particularly what they forecast.
The Trend is the line of least resistance.
It is the most important thing to know about the market or an individual
stock.
A bull market, or an upward trend, begins at the very bottom level of a
panic or depression. A bear market starts at the topmost point of a boom. This of
course, refers to the long trend, or the main swing in prices which, from bottom
to top and from top to bottom makes a complete cycle. The cycles since 1911 are
shown on the monthly Vertical (Trend) Chart of the hew York Times Average
herewith.
Copyright 1931 by Richard D. Wyckoff Section 4M Page 17
Copyright 1937 by Wyckoff Associates, Inc.
Copyright 1931 by Richard D. Wyckoff Section 4M Page 18
Copyright 1937 by Wyckoff Associates, Inc.
Copyright 1931 by Richard D. Wyckoff Section 4M Page 19
Copyright 1937 by Wyckoff Associates, Inc.
Copyright 1931 by Richard D. Wyckoff
Copyright 1937 by Wyckoff Associates, Inc.
Section 4M Page 20
In between these extreme tops and bottoms of the main moves, there
occur a number of intermediate swings of 5 to 30 or more points. It is these
intermediate swings which afford excellent opportunities for trading and
investment profits; hence it is very important to know, first of all, whether a bull
market (Uptrend) or a bear market (Downtrend) is under way, and, second,
whether we are at the beginning, in the middle, or at the end of one of these
intermediate swings, or in a period of transition between the main swings.
The best way to ascertain the above is to keep a Trend Chart (vertical
chart of the averages), which is made up of the movements of a large number of
stocks, such as the following:
Industrials Rails Utilities Total
New York Times 25 25 * 50
New York Herald Tribune 70 30 * 100
Dow-Jones & Co.Is
Wall Street Journal 30 20 20 70
Standard Statistics Corp. 50 20 20 20
In addition, it is desirable to keep a Wave Chart (as described in Section
22M) to enable you to make a detailed daily analysis of what you see on your
Trend Charts.
In a bull market most of your trades should be on the long side and in a
bear market on the short side. If this rule be generally followed, it should
considerably increase your chances for profit. If, in an up trend, you purchase a
stock on a bulge and it afterward goes against you, the chances are the upward
trend will give you a profit if you have patience. But if you go long in a down
trend, and the market continues to decline, you are likely to have, an increasing
loss.
There are, of course, exceptions to this rule. As is explained in Section
8M, all stocks do not move upward or downward together. Months before the
*
The Times and Tribune Industrial Averages include a number of
Public Utility stocks.
Copyright 1931 by Richard D. Wyckoff
Copyright 1937 by Wyckoff Associates, Inc.
Section 4M Page 21
market-of 1929 culminated in September, many individual stocks began to de-
cline; so that while the main trend was upward judging by the averages of a large
number of stocks, certain issues were being liquidated while others were making
new highs. These stocks which started down early were the forerunners of the
main turning point. Their down trends were clearly shown on the individual
charts and by the action of the various group averages. In much the same
manner, when a bear market is ending, some stocks and some groups of stocks
stabilize and start upward ahead of others, moving much faster and farther than
the average. Generally, however, stocks tend to move much more uniformly
downward in declining markets, than upward in advancing cycles. (Sect. 8M, Pg,
6, Pars. 1-3.)
My claim that the market itself tells you what it is going to do is made good
in the illustrations which follow in later Sections. By using the Figure Charts to
record the movements of the popular averages, such as the New York Times 50,
the Dow-Jones 30 Industrials, etc., we are able frequently to estimate how far the
whole market is likely to move. And by using the Trend (Vertical) Charts we are
able to judge what direction it will take. This claim is substantiated herein.
We gain an added advantage in estimating the direction and the probable
distance of the more important moves of the market, or of individual stocks, or
groups of stocks by condensing the figure chart movements into nothing less than
3 point reversals (Pg. 12, Par. 3).
The advantage of using these is especially illustrated in the 3 Point Figure
Chart which indicates the 1929 turning point in the market (Sect. 13M, Pg. 10)
Your charts from which you study the Trend should be made, first in the
form of vertical charts with volumes, then in the form of figure charts. Both
are good by themselves but they are much better used in combination. Both may
be on transparent paper, so that they can be laid over other charts when
studying the comparative strength and weakness (explained in Section 8M) of
groups or
Copyright 1931 by Richard D. Wyckoff
Copyright 1937 by Wyckoff Associates, Inc.
Section 4M Page 22
individual stocks; or you may easily compare them by laying one chart above an-
other on your table or desk.
Individual stocks should be recorded on both vertical and figure charts, but
if your time is limited and it is necessary to reduce the number of your re- cords,
then a good plan is to keep the bulk of your graphs in figure chart form together
with a permanent file of your daily newspaper or our Daily Stock Chart Reports.
By filing these reports in order, as you receive them, it is a simple matter to run
back through the sheets for several days or weeks, scanning the price range and
volume data to observe significant changes in the volume of trad- ing. This
procedure is the same as building a vertical chart in your mind. Thus, when you
see that an interesting situation may be developing on one of your figure charts,
you can readily bring the equivalent of a vertical chart to bear on
it and thereby materially increase the accuracy of your deductions.
To give you a clear idea of the above method of forming mental pictures
of vertical charts, we suggest you turn back to the table on Page 4. Cover the
figures in the table (under the heading "Daily Price Range and Volume") with a
sheet of paper so that only the first line is visible. Make a mental note of the
price range and volume for this day, January 2nd. Then slide your paper down
so the next line of figures can be read. By continuing in this manner, making
mental note the impression you receive whenever there is a significant change in
the price and the volume, or both, you will presently discover that you are able
to visualize the action of the stock almost as clearly as you can by studying the
chart at the left which was made from the figures in the table. For instance,
observe in the table how the daily volume builds up while the price is rising from
January 29th to 51st and how volume promptly shrinks on the reaction of
February 6th to 8th. A little practice in scanning your newspaper or your Daily
Report sheets in this way will enable you readily to detect such significant
changes of behavior.
If the above procedure does not meet your requirements, another way of
Copyright 1931 by Richard D. Wyckoff
Copyright 1937 by Wyckoff Associates, Inc.
Section 4M Page 23
conserving time is to keep as many figure charts as you can handle conveniently,
together with a file of your daily newspaper or Daily Stock Chart Reports as
previously indicated. You can then quickly and at any time make up a vertical
chart of any stock in your list, maintaining the chart until your interest in that
stock ceased or it may have completed its indicated move. Should you follow this
procedure you must record the history of the stock back for two or preferably
three months; or for a period sufficient to show its action- around the last
important supply or support level, in order to have an adequate background.
Vertical charts are essential for the proper timing of commitments and
especially for detecting the minor turning points because there are times when
figure charts may be unchanged, while the vertical charts at the same time show
persistent supply or demand within a small range. Or the vertical charts may
show an exceptionally large volume of shares changing hands, indicating the
completion of a move. Or the volume might be shrinking, which under I certain
conditions would indicate, at the top of the swing, a lessening of demand, or, at
the bottom of a decline, a lessening of pressure. None of these indications is
shown on the figure charts.
On the other hand, the figure chart may show many fluctuations on the
full figures, while the verticals are unchanged. For example, if the high full
figure of a stock on a certain day were 45 and the low 40, there might be sever
al fluctuations back and forth between 42 and 43 on the figure chart, but no in-
dication of this would appear on the vertical chart.
For these reasons it is vital to keep both forms of charts.
To define the trend of the market or a single stock, therefore, both the
figure and the vertical chart (or its equivalent as suggested on the preceding
page) should be used.
In deciding when to act, the tape or the Wave Chart of Tape Readings is
the best guide. As indicated in "Buying and Selling Waves" (Sect. 5M), and as
Copyright 1931 by Richard D. Wyckoff
Copyright 1937 by Wyckoff Associates, Inc.
Section 4M Page 24
fully explained in Section 22M, the tape shows the psychological moment to buy
or sell. If you cannot watch the tape, then you may use the Wave Chart to do this
work for you.
THE WAVE CHART OF TAPE READINGS wag designed and originated by
me, in 1916 in connection with my personal operations in the stock market. It is
made to provide a condensed picture of every vital development in every stock
market session. It gives a graphic representation of the dayIs tape action which
enables us to study the marketIs behavior at leisure, just as if we were watching
the ticker continuously and setting down every essential impression.
Thus, the Wave Chart is an invaluable aid whereby we may detect chan-
ges from technical weakness to strength, and vice versa, and so determine the
tumbling points not only of the minor but also of the intermediate swings,
frequently several days before the indications are given by the less sensitive
popular averages.
The method of constructing and interpreting the Wave Chart will be taken
up in a later section, as you must first complete your study of the next several
chapters in order properly to understand the principles of the Wave Chart.
GROUP CHARTS: In the selection of the best stocks in which to trade, and
invest Group Charts are of material assistance. These are made of about five
(more or less) leading stocks in each industry - Oil, Steel, Motor, Copper, Sugar,
Tobacco,. Retail Trade (merchandising), Building, Railroad Equipment, etc. There
are so many different lines of business represented on the New York Stock
Exchange that these groupings can be made to include as many as you like.
The purpose of these charts is to show which industries promise to im-
prove or deteriorate, and to warn you to search in those groups for opportunities.
A better or poorer outlook for the steel industry or the motors, utilities or
others, is immediately forecast by important operations of insiders, their
bankers, and the large operators having affiliations with them. If the
Copyright 1931 by Richard D. Wyckoff
Copyright 1937 by Wyckoff Associates, Inc.
Section 4M Page 25
oil business, for example, has been very bad for a long time and the outlook be-
gins to improve, these Group Charts will give you the cue. They tell you, in
advance, whether ;
or not the big interests are shaping their stock market posi-
tions for higher or lower prices in these stocks. When large interests begin to
accumulate or distribute, you can and should do the same.
You can get along without these group charts if you prefer, as our method
of detecting stocks in a bullish or bearish position (see "Position Sheet," Section
18M) covers the ground. A glance at the "Position Sheet" will show you whether
the Steels, Motors, Oils or others are lining up for a small or a large advance or
decline. This should serve your purpose.
The keeping of group averages involves quite a little clerical labor.
Therefore, if your time is limited, you may find it more expedient to make up
your group charts from the computations which you will find ready-made for you
each day on our Daily Stock Chart Report, List #2. (See sample yellow, sheet
supplied with your Course.)
However, if you wish to make these tip yourself, you have only to select
the leading stocks in each group, enter their highest, lowest and closing prices,
and volumes, each day in separate vertical columns. Add up the prices and divide
by the number of stocks in the group. This will give you the average highest,
lowest and closing price for the group. The volumes should merely be added
together. They should not be divided or averaged.
Both Vertical and Figure Charts are used to record changes in the groups.
The Vertical Group Charts may be placed one above another, on your desk or
table, for purposes of comparison. Likewise, these Group Charts may be laid
above any individual Stock Chart and its comparative strength or weakness
instantly ascertained. (See illustrations, Section 8M.)
If some groups show greater weakness; than others, search these for the
stocks to sell short. Those groups which indicate the greatest cooperative
Copyright 1931 by Richard D. Wyckoff
Copyright 1937 by Wyckoff Associates, Inc.
Section 4M Page 26
strength will show you where to look among the individual stock charts for the
best stocks to buy when the right time comes.
These few suggestions will suffice for the present to indicate how these
charts may be used to advantage.
For convenience and future ready reference, we summarize what has
been set forth in the preceding pages, as follows:
VERTICAL CHARTS
What is Recorded Deductions Therefrom Indication
Supply and Demand.
Points of Resistance and Support.
Price Movement (high-
est, lowest, closing;
and opening if desired)
Volum e
Marking Up and Marking Down.
Lines of Supply and Support.
Changes of Stride and Progress
of Movement.
Comparative Strength and Weakness.
Intensity of Trading.
Increasing or Diminishing Pressure
of Supply and Demand.
Buying and Selling Climaxes.
THE TREND, i.e.,
the direction of
the price
movement
WHEN to BUY.
WHEN to SELL.
WHEN to CLOSE
OUT.
Time
Speed of Advances and Declines.
Duration of Accumulation or
Distribution.
WHERE to place
Stop Orders
Closing Prices Net Gain or Loss.
Changes in Pressure Up or Down.
FIGURE CHARTS
Supply and Demand.
Price Movement Points Of Resistance and Support.
Marking Up and Marking Down.
The best op-
portunities.
General Formations Accumulation or Distribution.
Lines of Supply and Support.
Marking Up and Marking Down.
Horizontal Formations Probable Extent or Importance of
Accumulation or Distribution.
Probable DIS-
TANCE a stock,
or a group, or
the market
should move.
Copyright 1931 by Richard D. Wyckoíí
Copyright 1937 by Wyckoíí Associates, Inc.
Section 4M Page 27
WAVE CHART OF TAPE READINGS
Price Movement oí the
Market - Using Sen-
sitive Leaders as an
Index
Volume oí Trading on
Alternate Buying
and Selling Waves.
Activity or Intensity oí
Supply and Demand.
Sentiment oí Important Interests.
Toward the Market. Critical
Points oí Resistance
and Support.
Development oí Accumulation and
Distribution Areas.
Changes in Pressure Up or Down.
Quality and Urgency oí Supply
and Demand (by comparing Vol-
ume with Activity and Time) .
BEHAVIOR oí the
market at
CRITICAL points
in the Minor,
INTERMEDIATE,
and MAJOR
Trends.
TURNING POINTS
in the Minor,
INTERMEDIATE,
Trading.
Ability oí Bull or Bear Forces to At-
tract Following on Advances and
Declines, Rallies and Reactions.
and MAJOR
Trends,
Time Or Duration oí
Small Buying and
Selling Waves.
Price Changes írom
Wave to Wave.
Speed oí Advances and Declines,
Rallies and Reactions.
Character oí Supply and Demand,
Whether Urgent, Leisurely, Timid
or Aggressive.
Net Gain or Loss.
Changes in Pressure Up or Down.
RESPONSIVENESS
oí the Market to
Buying and
Selling Impulses.
Copyright 1934 by Richard D. Wyckoff Section 5M Page 1
BUYING AND SELLING WAVES
Every upward or downward swing in the market, whether it amounts to
many points, only a few points, or fractions of a point, consists of numerous buy-
ing and selling waves. These have a certain duration; they run just so long as they
can attract a following. When this following is exhausted for the time being, that
wave comes to an end and a contrary wave sets in. The latter may attract more of
a following than the former. By studying the relationships between these upward
and downward waves, their duration, speed and extent, and comparing them with
each other, we are able to judge the relative strength of the bulls and bears as the
price movement progresses.
All stock market movements, however large or small, are made up of
buying and selling waves. The market does not rise and fall like the water in a
tank which is being filled or emptied. It moves to a higher or lower level by a se-
ries of surges - a good deal like an incoming or outgoing tide, with successive
waves higher or lower than those preceding.
The small buying and selling waves which occur during every stock market
session run so many minutes (see Wave Charts, Sect. 22M). They are caused large-
ly by the restlessness of active professional traders, much like the ripples
produced by the wind upon the ocean. Traders must have activity; they make their
livelihood by trading on fluctuations. Therefore, they engage in a ceaseless tug of
war, trying to put prices up whenever the condition of the market is favorable, or
drive them down when they find that the bulls are weak or have overextended
themselves. The degree of success or failure attending their efforts enables us
determine whether the market is growing stronger or weaker.
These small waves are part of the larger waves which run several days,
and eventually make up movements of 3 to about 5 points. The 10 and 20 point
moves are made up of 3 to 5 point waves, and the bull and bear markets are com-
Copyright 1934 by Richard D. Wyckoff Section 5M Page 2
posed of many swings of 1O to 2O points or more.
You can easily confirm the above by examining any chart. It is important
that you do this so as to impress upon your mind these numerous waves of vari-
ous sizes, inasmuch as this will help you to understand the market. You will
thereafter think in waves.
When you are looking for an opportunity to buy, watch for the down waves
in the market and in your stock. After you have bought, you sit through a number
of small, medium and good-sized waves, until finally you observe that it is about
flood tide in that stock. Then watch for an especially strong up-wave and give your
broker an order to sell your stock at the market.
The waves of the market furnish a clear insight into changes in supply and
demand. By learning to judge all sizes of market waves, you will gradually learn to
spot the time when a rising market or a rally, and the time when a declining
market or a reaction has halted and is about to reverse. These are the turning
points.
To be able to say when these turning points are occurring - at the bottom
of a bear market, or at any important rallying point on the way down to the
bottom, or at the top of a bull market, or at any important reactionary point on
the way up, - is a mark of ability in an investor as well as a trader.
Remember: The market itself tells us everything we need to know about its
probable future action. Every significant change in supply or demand is registered
on the tape. When you have learned to analyze the market by its own action, as
recorded on the tape or on your charts, then you will be proficient in the art of
operating in stocks.
Of all the things that are most desirable to know about the stock market,
these two are the most important:
(1) First, to be able to determine the final top of a bull market; and
second, to determine the top of the intermediate swings, and finally
the top of the minor moves.
Copyright 1934 by Richard D. Wyckoff Section 5M Page 3
(2) To be able to determine the final low in a bear market; the bottom of
the intermediate swings, and the end of the minor moves.
Master this branch of the subject thoroughly, it is vital.
But there is one step more: Your education will not be complete until you
can cover all your shorts and go long at the bottom of a panic, a depression or of
an intermediate swing, and sell out all long stocks and go short at the top of a
boom or an intermediate bull movement. This will be the result of practice,
training, and experience. It requires great flexibility of mind and absolute control
of your emotions. You can learn to do it if you will study and faithfully practice
this Method.
Copyright 1937 by Richard D. Wyckoff Section 6M Page 1
CHART RECORDS
For the purpose of studying the Buying and Selling Waves referred to in
Section 5M, we require a Trend Chart, or vertical chart of some representative
general market average each as the New York Times 60 stocks (illustrated in Sec-
tion 7M), "supplemented by a Wave Chart (fully explained in Sect. 22M). Our
Trend Chart of a general market average is the medium through which we are
enabled to study the larger raves of the market. It is our large scale road map
from which we judge the marketIs present position in relation to its probable
ultimate destination. The Wave Chart is our local map which shows the detail of
the marketIs position in relation to these larger swings. Therefore, the Wave Chart
helps us to detect the approach of turning points of the large waves, (intermediate
swings) frequently two to four days in advanced
We cannot very well trade or invest in a total of 50 to 100 stocks simul-
taneously, and since all stocks do not move in complete harmony nor with equal
speed at all times, we require some means of breaking down our large scale mar-
ket map (general market average) into its component parts so that we may deter-
mine which sections or groups afford the most promising opportunities. For this
purpose we must either employ the Position Sheet described in Section 18M, or we
must use Group Charts as explained in Section 4M (Pgs. 24 and 25) and more
fully explained in "Comparing Strength and Weakness" (Section 8M). Then, after
we have decided which groups offer the greatest promise, we aim to select out of
these groups the most desirable individual stocks.
In brief, we aim usually to trade in harmony with the trend of the market
as a whole and in the most promising groups of stocks (Sect. 9M, Pg. l,. Pars. 1 &
2). Having narrowed our choice down to the most desirable group, we next must
have facilities, for selecting the best opportunities from a large number of
individual stocks. These will enable us to operate in the stocks that will
Copyright 1937 by Richard D. Wyckoff Section 6M Page 2
move soonest, fastest and farthest, and to avoid being tied up in dull, dead
stocks.
The amount of time at your disposal for stock market purposes will, of
course, control the amount of work which you can do without over-working or
interfering with your regular business or profession. In general, it is much better
to limit your chart work so that the bulk of your time may be devoted to the
study and interpretation of your records, than to keep too many charts. In other
words, it is better to keep charts of 20stocks and study them thoroughly than to
try to keep 200 charts and consume all your spare time in merely posting entries
on them.
In any case, while you are acquainting yourself with the principles of this
Method, it would be best for you to confine your chart records to the 20 charts
supplied with your Course. As you gain experience and acquire proficiency in
reading charts, you will find that you can readily expand the number you are able
to maintain and interpret quickly.
For the average, and more advanced students, the following is recommend-
ed as a very satisfactory layout:
TYPE OF CHART IN THE FOLLOWING F0RMS
N. Y. Times 50 or Herald Tribune 100
Dow-Jones 30 Industrials
Dow-Jones 20 Railroads
Dow-Jones 20 Utilities
Wyckoff Group Averages
One Point Figure
Three Point Figure
Daily Vertical Line With
Volumes
25 to 200 Individual Stocks One Point Figure
Three Point Figure
One Point Figure*
Wave Chart of Tape Readings Three Point Figure*
Ten Point Figure*
Continuous Line*
* The nature and method of keeping these charts are explained in Sect. 22M.
Copyright 1937 by Richard D. Wyckoff Section 6M Page 3
The above portfolio can be expanded either by increasing the number of
individual 1 point and 3 point figure charts from the minimum suggested number
of 25, to 200 or more, and by keeping part or all of these individual stocks in the
form of vertical charts also. At the start, however, if you will make up and
maintain vertical charts of a Trend Chart and the various most important group
averages such as the Rails, Industrials, Utilities, Steels, Oils, Motors, etc., you can
use these far the purpose of determining the trend of the market and of the
several groups. Then, when you find from your vertical Group Charts, a group that
offers promising opportunities, you may refer to your figure charts of the
individual stocks in that group to decide which of these appear to be in the best
position. Next, when you have narrowed your selection to the one or two most
promising stocks in the group, it will be a simple matter to make up a vertical
chart of those stocks, which you can study in order to time your purchases or sales
to the best advantage. When you find the move in the group and in your individual
stocks has been completed you may discontinue keeping the vertical charts of these
stocks until a new opportunity appears to present itself to invest in those stocks
(Sect. 4M, Pgs. 22 & 23).
In this way you can, if your time is limited and if you wish, save much of
the work that would be required to maintain vertical charts every day for a large
number of stocks.
However, the larger the number of charts you can keep., the greater will be
the variety from which to make your selections and the broader your perspective
of the whole market. Therefore, another good plan, if you can arrange it, is to hive
someone else do your chart work for you - though you can learn more from your
charts if you make most of them yourself.
The keeping of charts is a clerical job which calls for painstaking ac-
curacy, but it is not difficult work for any bright boy or girl after the purely
mechanical part has been explained. A student who is beginning to learn
Copyright 1937 by Richard D. Wyckoff Section 6M Page 4
mechanical drawing, for example, is receiving training in a school which demands
that he be mathematically accurate. You will find such students highly satisfactory
for chart work. They can be had at very small salaries.
If you have the time or the assistance, you may wish to keep your chart
records on a more elaborate scale. In that case, you may find it helpful to add the
following to your list:
Vertical Charts, with Volumes, showing weekly movements.
Vertical Charts, without Volumes, showing monthly movements.
The above should not be used exclusively (without daily charts) since they
are not sufficiently sensitive to permit accurate timing. Too much vital detail may
be lost in the condensation of the daily price movement and volume behavior in the
weekly chart. The principal value of the weekly and monthly vertical charts lies in
the historical background, that is, the perspective they afford of the long range
move and old points of resistance and support. But even for these purposes, the 1
point and the 3 or 5 point figure charts are quite satisfactory.
Both the vertical and figure charts may be kept in a loose-leaf note book, of
the size of this volume, or pocket size, or on larger sheets, say 11 by 16 1/2
inches, according to your individual preference. Far most students, charts of the
size accommodated by a three ring loose-leaf binder holding sheets 8 1/2 by 11
inches, are most convenient.
Copyright 1937 by Richard D. Wyckoff Section 7M Page 1
DETERMINING THE TREND OF THE MARKET BY THE DAILY
VERTICAL CHART
of the
New York Times Average of 50 Stocks
As previously explained (Sec. 4M, Pg. 16, Par. 3, and Sec. 6M, Pg. 1, Pars.
1 & 3), the most important thing to know about the market is the trend. Since we
aim usually to operate in harmony with this trend, a study of our Daily Trend
Chart (daily vertical chart of a composite stock average) should be the starting
point of all our deductions.
No one has yet succeeded in devising a perfect average - one which un-
failingly represents the action of the market as a whole at all times. In other
words, it cannot be said that one average is consistently better than another.
Investing and trading is an art rather than, a science, hence you must not under-
take to make precise calculations nor expect precision in a general market aver-
age. It is important for you to know this so you will exercise judgment at all times
in reading your Trend Chart, and so you will remember that the deductions you
draw from it must frequently be adjusted to conform with what you see in the
behavior of your Wave Chart, your Group Charts (or Position Sheet) and your
charts of individual stocks.
Subject to the above qualifications, you will find the New York Times
Average of 50 Stocks a generally satisfactory guide to the trend and position of the
market as a whole. The New York Herald Tribune Average of 100 Stocks is an-
other good average. You may prefer to keep both. If neither is available, you will
find that almost any popular average, such as is printed in leading newspapers
throughout the country, will suffice. Or, if necessary, you can make your own
composite average by combining the three Dow-Jones averages (Industrials, Rails
and Utilities) into a total of 70 stocks, provided you are located at a place where
these averages are printed daily. To do this properly requires some adjustment of
the figures which we shall be glad to explain on written request.
Copyright 1931 by Richard D. Wyckoff
Copyright 1937 by Wyckoff Associates, Inc.
Section 7M Page 2
Regardless of what average you use, the same line of reasoning as that ex-
plained herein should be followed in reading the indications given.
The accompanying chart (Pgs. 33, 34 & 35) includes the total volume of
transactions of all stocks dealt in daily, as indicated by the vertical lines rising
from the bottom of the sheet. These volumes must be considered in conjunction
with a study of the price movement. The element of time, as previously explained,
is represented by the daily additions to the chart from left to right. The closing
figure of each day is indicated by a horizontal line across each of the vertical lines
which represent the range from high to low.
A good way to impress upon your mind the principles involved in reading
the chart is to take the pages out of the binder and place them beside the text.
Then, with another sheet of paper, cover all but the extreme left side of the chart,
exposing only the first few days plotting. As you read the instructions which
follow, gradually slide the paper toward the right, revealing the price movement
and volume one day at a time. This will have the same effect as reading the
market just as if it were being recorded on the chart today and as if you didn"t
know what was coming next.
The story told by this chart is as follows: We use the period from December
8th to December 17th as our starting point, and without regard to the market
history previously recorded. This interval of nine days marked a sharp
acceleration of the previous major decline, culminating in a widening spread of the
daily price range and a very marked expansion in the daily volume of trading as
the market reached its low point - thus reflecting the panicky selling which takes
place under such conditions. (See Sect. 4M, Pg. 23, Par. 1, 4th Line; Sect. 8M, Pg,
6, Par. 3; Sect. 16M, Pg. 4, Par. 1; and Footnote on next page.)
The volume on the 8th was around 2,000,000. This increases to 5,000,000
on the day of the low point. Tape observers would have noted the fact that a large
part of this volume occurred as the market recorded the extreme low and on the
rally from the lows. This confirms the fact that the climax of the downward
Copyright 1931 by Richard D. Wyckoff
Copyright 1937 by Wyckoff Associates, Inc.
Section 7M Page 3
movement (*) has actually been passed, and gives us the starting point for our
next forecast. (A Wave Chart would show the details of this tape action, including
the feverish activity around the dayIs low point.)
We must now assume, in view of the above, that the trend is tentatively
upward; but this is subject to confirmation by the appearance of higher support on
the next reaction; that is, if on the next down swing, prices should break
through the turning point of 135 1/2 recorded on December 17th, it would be
* The phenomenon of the Selling Climax is caused by the panicky unloading
of stocks (supply) by the public and other weak holders which is matched against
buying (demand) of (l) experienced operators; (2) the large interests and sponsors
of various stocks who now either see an excellent opportunity to replace at low
prices the stocks they sold higher up, or wish to prevent further demoralization by
giving the market support temporarily; and (3) short covering by the bears who
sense a turn.
Stocks thus become either temporarily or more lastingly lodged in strong
hands. An abnormal increase in volume is one of the characteristic symptoms of a
selling climax, since supply and demand must both expand sharply under these
conditions. But the supply is now of poor, and the demand of good quality; and
since the force of supply now will have been exhausted, a technical rally ensues.
If buying on the break (i.e., during the Selling Climax) was principally for
the purpose of supporting prices temporarily and checking a panic, or relieving a
panicky situation, this support stock will be thrown back on the market at the
first favorable opportunity, usually on the technical rebound which customarily
follows a selling climax. This, and other selling on the rebound, may increase
supply sufficiently to drive prices through the lows of the climax day and bring
about a new decline, that is, a resumption of liquidation.
On the other hand, should a secondary reaction occur after the technical
rally above referred to, and prices hold around or above the climax lows while
volume at the same time shrinks appreciably, we have an indication that liquida-
tion was completed and, support is again coming into the market. Therefore, the
marketIs behavior on these secondary reactions is usually indicative of the next
important move.
In this connection, it should be noted that the same principles which apply
to the large swings also apply to the smaller moves and to the day-to-day buying
and selling waves. Thus, a careful examination of your Trend Charts, Group
Charts and charts of individual stocks over a period of time, will reveal numerous
examples of the above phenomena. These will appear on a small as well as a large
scale. However, you must allow for variations. That is, do not expect one selling
climax to look exactly like another. The same basic characteristics may be
observed; but the time and magnitude of price movement and volume, and the
extent and sequence of price movements almost invariably will differ.
For example, the abnormal volume may last either one or several days; or
the abnormal volume may precede the recording of the extreme low point one or
more days. In other words, a selling climax may be completed in one day or be
spread over a few days, and volume may reach unusual proportions on the day
the low point is made or some days ahead of the final low.
Copyright 1931 by Richard D. Wyckoff
Copyright 1937 by Wyckoff Associates, Inc.
Section 7M Page 4
evidence that liquidation was not completed and that support which turned the
market upward on the 17th has been withdrawn. (See Footnote, Pg. 3, Par. 3.) On
the other hand, if, as happened to be the case, the buying support comes in around
or at a higher level than 135 1/2, we may conclude that demand is beginning to
overcome supply, (Footnote, Pg. 3, Par. 4) and that the next logical development
for final confirmation of an important reversal will be the marketIs ability to rise
above the top of the last rally, which was around 150, Dec. 18th.
On January 3rd these averages rise above 152, which gives final confirma-
tion of an upward swing which might develop into a rise of substantial proportions.
In taking a position in the market, which, of course, would be a long
position, we have had, up to now, three opportunities:
(1) On December 17th when the market gave indications of having
completed a selling climax, and at the same time, as shown by the
entry on our vertical chart for that day, was able to rally vigorously
on increasing volume. This was the first time it had shown ability to
rally aggressively and the first time increasing volume had been shown
on an advance for sometime past. On the basis of these tentatively
bullish indications we are justified in establishing long positions if we
can get in near enough to the lows so that, when we place stop orders
(Sect. 23M, Pg. 3, Par. 1) on our commitments two or three points
under our purchase prices, our stops will be about 1 to 1 1/2 or 2
points under the danger level, that is, the lows of the climax day.
(Sect. 23M, Pg. 1, Par. 2 and Pg. 14, Par. 2.)
(2) Our next buying opportunity is on December 29th when the market
completes three days of lower support but the closing prices on each of
these days are between 140 and 141, showing that the selling pressure
is losing its force, since the net result of these three days' pulling and
hauling is to leave the average almost unchanged following a
considerable reaction.
Copyright 1931 by Richard D. Wyckoff
Copyright 1937 by Wyckoff Associates, Inc.
Section 7M Page 5
At the same time, lower volume on the reaction from the December
18th high, compared with the volume of the mid-December decline,
confirms the inference that selling pressure is losing its force; buying
power is overcoming it. As it now appears that the market has
completed a typical secondary reaction (see Footnote, Pg. 3) which has
the effect of broadening the zone of support around the 136-140 level
to sustain a proportionately more substantial advance than the first
recovery, we either buy on this reaction if we missed our first
opportunity, or add to our holdings; with stops on these new positions,
as before, under the danger, point, that is, the lows of December 17th.
The average is now "on the springboard" - (see Sect. 14M, Last Par.
Pg. 4 and Pg. 5).
(3) On January 3rd the average goes into new high ground, overcoming
the previous tops of December 18th, 19th, 20th and January 2nd.
Volume tends to increase on the rally days, December 30th to January
3rd, an indication that is characteristic of a bullish trend. However,
this is the least favorable of our three buying opportunities so far,
since we would now be purchasing on an up wave, thereby, materially
increasing our risk, whereas previous commitments were established
on down waves, close to the danger point. (Sect. 5M, Pg. 2, Par. 2.)
Remember that we are now studying the average or composite price of 50
stocks, which is our chief guide as to the direction of the trend. It is impractical for
us to operate in all of these fifty stocks at the same time; therefore, we must
select, when we wish to trade or invest, the individual issues which are showing the
greatest technical strength at the time. For this reason we must turn to our Group
Averages or our Position Sheet which enables us to select the best out of our list of
individual stocks, in order to find the one, five, ten or more stocks which promise
to yield the largest profits in the shortest time. (Sect. 6M, Pg. 1, Pars. 2 &
3.)
Copyright 1931 by Richard D. Wyckoff
Copyright 1937 by Wyckoff Associates, Inc.
Section 7M Page 6
Having decided that the trend of the market is upward we must thereafter
continue to trade on the long side until there are indications of a change in trend,
or until the trend is in doubt. We must always be on our guard against such
changes; and when the trend is in doubt we must take a neutral position, that is,
be out of the market.
For the next several days, until January 9th, the market makes further
progress an the bull side, recording 156 1/2 on that day; but observe that the
closing figured on the 6th, 7th, 8th, 9th and 10th are all within a range of about
one point. That means the market made no upward progress as a net result of four
daysI activities following the 6th. The daily volume shows a tendency to taper off,
which may mean a lessening of demand at the top of the swing to January 8th.
(Sect. 4M, Pg. 25, Par. 1, 6th Line.) This conclusion is partly confirmed by the
shortening of the upward thrusts from the 3rd to the 7th, indicating that it was
hard work advancing the market from 150 to 155. Buyers now seem reluctant to
follow prices upward. On the day when the high of 156 1/2 is recorded, the
volume increases abruptly compared with the volume of the preceding sessions at
the same time that the price runs up to a new high only to close near the dayIs
low (*) and actually below, that of the previous session. All of the foregoing is
evidence of the approach of a corrective reaction, but we still hold our long
position because, as yet, we have had no indications of important distribution.
Such a reaction begins on the 12th and the low point of it occurs on the
* The action of the 9th is an illustration of a typical buying climax, which is
the reverse of a selling climax. On this day, a poor quality of demand is being
promptly overwhelmed by the superior force of supply of good quality. In other
words, the bulls, realizing that they are encountering resistance to the advance,
break the stalemate of the 6th to 8th by bidding prices up to attract those buyers
who were too timid to come in before the advance to 155, but who now fear that
the market may get away from them because it is "making a new high." Thus,
there is a concerted rush of public demand which gives the larger and shrewder
operators their opportunity to dump part of their lines on a broad and active
buying wave, made to order for the purpose.
Copyright 1931 by Richard D. Wyckoff
Copyright 1937 by Wyckoff Associates, Inc.
Section 7M Page 7
16th. Volume on the reaction diminishes appreciably compared with volume on the
rise from the December 29th low, a bullish indication, showing that the selling
pressure is light. On the 16th, the closing is nearly at the high point of the day -
a bullish indication which is the reverse of the bearish indication on the 9th. This
is our first sign that the reaction is nearly over. (*) So here we have a now buying
opportunity in expectation that the advance will be resumed. (**) Further
confirmation of this comes in higher support on the 17th and in an almost
complete drying-up in volume on a dip to the same low level on the 19th. The
closing prices on the 15th, 16th, 17th and 19th show support within a narrow
zone, mostly around 147-8. We must, therefore; look for the advancing tendency to
be resumed.
Then follow four days, in each of which we see higher tops, higher bottoms
and higher closing levels, accompanied by gradually increasing volumes - bullish
behavior. This brings the market up within a fraction of the high figure of January
9th where, on the 23rd, a volume surge after four days almost perpendicular
advance warns us of a buying climax. But here, in any case, we way expect hesi-
tation or reaction, due to the influence of the previous top - January 9th.
Now observe that for the next thirteen sessions following the 23rd the mar-
ket fluctuates within the range of 156-151, a very narrow range for the average.
This is because it is called upon to absorb offerings representing stock purchased
by over-anxious bulls who got hooked around the high level of January 9th, and
perhaps other quantities bought on the way down in 1930 during the period not
shown on this chart - purchases made by people who are now eager to get out
even.
* Note that there is also an indication of a minor selling climax in the
somewhat marked increase of volume on the 15th.
** To insure proper limitation of risk on purchases made at this level, our
stops should be placed a point or so under the supporting points (lows) of the
16th. The stops on these new, and any previous, long commitments, should be
raised to within a point or so of the January 16th to 19th supporting level after
the rally of January 20th.
Copyright 1931 by Richard D. Wyckoff
Copyright 1937 by Wyckoff Associates, Inc.
Section 7M Page 8
Such absorption is evidently completed by February 9th when after closing
almost at the top on the previous Saturday, an advance into new high ground, 160
5/8, is recorded. (*) Note how the speed of the advance tends to increase, the
average gaining 9 points in two sessions - 9th and 10th. (This is the mark-up
forecast by item 3 in the footnote below.) See also how the volume increases to
4,000,000 shares and over on these two days, compared with a previous volume
of 1,000,000 or 2,000,000 a day for thirteen days past. The exceptionally large
volume of the 10th and 11th, plus the failure to record any material further gain
on the high volume of the 11th, as usual, is an indication of some distribution and
a setback. On the 11th the average makes a high of only 1 point above that of the
10th and closes at only a small fractional gain, on large volume - a large supply
overcoming demand.
Now, as we watch the supporting points for the next five sessions (13th
to 19th), we find that they are all around the 160-162 mark. Meanwhile, volume
decreases promptly on the dip to 160. This says there is another advance coming;
the market is not ready to turn downward yet. On the 17th there is an attempt to
run the average up to a new high, which fails. The closing is almost on the
bottom and volume increases noticeably over that of the three previous sessions.
It looks at first as if this might be a buying climax (Footnote, Pg. 6), preceding
the end of the rise, so we bring the stops on our long trades up" within
* The probability that this lateral movement, or trading range, between
156-151 is an area of absorption rather than one of distribution may be deter-
mined: (1) from the fact that volume remains low on the reaction to January 29th
and takers off promptly on the reaction to February 2nd; (2) from the tendency of
the price movement to narrow into a comparatively small range instead of reacting
as much as halfway back to the January 19th low, which implies that stocks are
not being pressed on the market; and (3) from the fact that after the recession to
February 2nd, volume tends to build up consistently at the same time that there is
a lifting of the supporting points from February 5th to 7th - behavior typical of
the completion of a period of accumulation or absorption prior to a mark-up. (Sect.
10, Pg, 9, Par. 1 and Sect. 16M, Pg. 28, Par. 3 & Pg. 29, par. 1).
After the mark-up of February 9th, we raise the stops on our long commit-
ments; to a figure within a point or so of the lows of the Jan. 23 - Feb. 7 trading
zone, inasmuch as the Feb. 9th rise enables us clearly to define the 151 level as a
new and critical line of support.
Wyckoff
Wyckoff
Wyckoff
Wyckoff
Wyckoff
Wyckoff
Wyckoff
Wyckoff
Wyckoff
Wyckoff
Wyckoff
Wyckoff
Wyckoff
Wyckoff
Wyckoff
Wyckoff
Wyckoff
Wyckoff
Wyckoff
Wyckoff
Wyckoff
Wyckoff
Wyckoff
Wyckoff
Wyckoff
Wyckoff
Wyckoff
Wyckoff
Wyckoff
Wyckoff
Wyckoff
Wyckoff
Wyckoff
Wyckoff
Wyckoff
Wyckoff
Wyckoff
Wyckoff
Wyckoff
Wyckoff
Wyckoff
Wyckoff
Wyckoff
Wyckoff
Wyckoff
Wyckoff
Wyckoff
Wyckoff
Wyckoff
Wyckoff
Wyckoff
Wyckoff
Wyckoff
Wyckoff
Wyckoff
Wyckoff
Wyckoff
Wyckoff
Wyckoff
Wyckoff
Wyckoff
Wyckoff
Wyckoff
Wyckoff
Wyckoff
Wyckoff
Wyckoff
Wyckoff
Wyckoff
Wyckoff
Wyckoff
Wyckoff
Wyckoff
Wyckoff
Wyckoff
Wyckoff
Wyckoff
Wyckoff
Wyckoff
Wyckoff
Wyckoff
Wyckoff
Wyckoff
Wyckoff
Wyckoff
Wyckoff
Wyckoff
Wyckoff
Wyckoff
Wyckoff
Wyckoff
Wyckoff
Wyckoff
Wyckoff
Wyckoff
Wyckoff
Wyckoff
Wyckoff
Wyckoff
Wyckoff
Wyckoff
Wyckoff
Wyckoff
Wyckoff
Wyckoff
Wyckoff
Wyckoff
Wyckoff
Wyckoff
Wyckoff
Wyckoff
Wyckoff
Wyckoff
Wyckoff
Wyckoff
Wyckoff
Wyckoff
Wyckoff
Wyckoff
Wyckoff
Wyckoff
Wyckoff
Wyckoff
Wyckoff
Wyckoff
Wyckoff
Wyckoff
Wyckoff
Wyckoff
Wyckoff
Wyckoff
Wyckoff
Wyckoff
Wyckoff
Wyckoff
Wyckoff
Wyckoff
Wyckoff
Wyckoff
Wyckoff
Wyckoff
Wyckoff
Wyckoff
Wyckoff
Wyckoff
Wyckoff
Wyckoff
Wyckoff
Wyckoff
Wyckoff
Wyckoff
Wyckoff
Wyckoff
Wyckoff
Wyckoff
Wyckoff
Wyckoff
Wyckoff
Wyckoff
Wyckoff
Wyckoff
Wyckoff
Wyckoff
Wyckoff
Wyckoff
Wyckoff
Wyckoff
Wyckoff
Wyckoff
Wyckoff
Wyckoff
Wyckoff
Wyckoff
Wyckoff
Wyckoff
Wyckoff
Wyckoff
Wyckoff
Wyckoff
Wyckoff
Wyckoff
Wyckoff
Wyckoff
Wyckoff
Wyckoff
Wyckoff
Wyckoff
Wyckoff
Wyckoff
Wyckoff
Wyckoff
Wyckoff
Wyckoff
Wyckoff
Wyckoff
Wyckoff
Wyckoff
Wyckoff
Wyckoff
Wyckoff
Wyckoff
Wyckoff
Wyckoff
Wyckoff
Wyckoff
Wyckoff
Wyckoff
Wyckoff
Wyckoff
Wyckoff
Wyckoff
Wyckoff
Wyckoff
Wyckoff
Wyckoff
Wyckoff
Wyckoff
Wyckoff
Wyckoff
Wyckoff
Wyckoff
Wyckoff
Wyckoff
Wyckoff
Wyckoff
Wyckoff
Wyckoff
Wyckoff
Wyckoff
Wyckoff
Wyckoff
Wyckoff
Wyckoff
Wyckoff
Wyckoff
Wyckoff
Wyckoff
Wyckoff
Wyckoff
Wyckoff
Wyckoff
Wyckoff
Wyckoff
Wyckoff
Wyckoff
Wyckoff
Wyckoff
Wyckoff
Wyckoff
Wyckoff
Wyckoff
Wyckoff
Wyckoff
Wyckoff
Wyckoff
Wyckoff
Wyckoff
Wyckoff
Wyckoff
Wyckoff
Wyckoff
Wyckoff
Wyckoff
Wyckoff
Wyckoff
Wyckoff
Wyckoff
Wyckoff
Wyckoff
Wyckoff
Wyckoff
Wyckoff
Wyckoff
Wyckoff
Wyckoff
Wyckoff
Wyckoff
Wyckoff
Wyckoff
Wyckoff
Wyckoff
Wyckoff
Wyckoff
Wyckoff
Wyckoff
Wyckoff
Wyckoff
Wyckoff
Wyckoff
Wyckoff
Wyckoff
Wyckoff
Wyckoff
Wyckoff
Wyckoff
Wyckoff
Wyckoff
Wyckoff
Wyckoff
Wyckoff
Wyckoff
Wyckoff
Wyckoff
Wyckoff
Wyckoff
Wyckoff
Wyckoff
Wyckoff
Wyckoff
Wyckoff
Wyckoff
Wyckoff
Wyckoff
Wyckoff
Wyckoff
Wyckoff
Wyckoff
Wyckoff
Wyckoff
Wyckoff
Wyckoff
Wyckoff
Wyckoff
Wyckoff
Wyckoff
Wyckoff
Wyckoff
Wyckoff
Wyckoff
Wyckoff
Wyckoff
Wyckoff
Wyckoff
Wyckoff
Wyckoff
Wyckoff
Wyckoff
Wyckoff
Wyckoff
Wyckoff
Wyckoff
Wyckoff
Wyckoff
Wyckoff
Wyckoff
Wyckoff
Wyckoff
Wyckoff
Wyckoff
Wyckoff

Mais conteúdo relacionado

Mais procurados

Fibonacci retracement level
Fibonacci retracement levelFibonacci retracement level
Fibonacci retracement levelpipsumo traderfx
 
Chart patterns final handout
Chart patterns   final handoutChart patterns   final handout
Chart patterns final handoutwijitha gayan
 
High Probability Trading Setups
High Probability Trading SetupsHigh Probability Trading Setups
High Probability Trading Setupsbtrader
 
Magic Breakout Forex Trading Strategy PDF eBook
Magic Breakout Forex Trading Strategy PDF eBookMagic Breakout Forex Trading Strategy PDF eBook
Magic Breakout Forex Trading Strategy PDF eBookeforexcourse web
 
Hanzo Shawdow Codes.pdf
Hanzo Shawdow Codes.pdfHanzo Shawdow Codes.pdf
Hanzo Shawdow Codes.pdfHungLe593957
 
Binary Option For FX Traders
Binary Option For FX TradersBinary Option For FX Traders
Binary Option For FX Tradersnokiandopod
 
Candle stick bible
Candle stick bibleCandle stick bible
Candle stick bibleChris134449
 
Understanding Japanese Candlesticks in Forex Trading by valentino heavens
Understanding Japanese Candlesticks in Forex Trading by valentino heavensUnderstanding Japanese Candlesticks in Forex Trading by valentino heavens
Understanding Japanese Candlesticks in Forex Trading by valentino heavensValentino Heavens
 
Fibonacci analysis
Fibonacci analysisFibonacci analysis
Fibonacci analysisypendharkar
 
ORDER BLOCK ENTRY.pptx
ORDER BLOCK ENTRY.pptxORDER BLOCK ENTRY.pptx
ORDER BLOCK ENTRY.pptxTan Ngoc
 
Forex lesson 1 forex overview
Forex lesson 1   forex overviewForex lesson 1   forex overview
Forex lesson 1 forex overviewpipsumo traderfx
 
The simple scalping strategy rules
The simple scalping strategy rules  The simple scalping strategy rules
The simple scalping strategy rules Nasir Tareen
 
Profit from trapped traders with 2 simple setups
Profit from trapped traders with 2 simple setupsProfit from trapped traders with 2 simple setups
Profit from trapped traders with 2 simple setupsNetpicksTrading
 
Forex Trading For Beginners
Forex Trading For BeginnersForex Trading For Beginners
Forex Trading For BeginnersSyrous Pejman
 
The candlestick trading bible(1)
The candlestick trading bible(1)The candlestick trading bible(1)
The candlestick trading bible(1)Ashley915859
 
Breakout trading strategies
Breakout trading strategiesBreakout trading strategies
Breakout trading strategiesmgeek007
 
Follow the Money and short names.pdf
Follow the Money and short names.pdfFollow the Money and short names.pdf
Follow the Money and short names.pdfHungLe593957
 

Mais procurados (20)

The day trader's bible, wyckoff
The day trader's bible, wyckoffThe day trader's bible, wyckoff
The day trader's bible, wyckoff
 
5 Day Trading Techniques
5 Day Trading Techniques5 Day Trading Techniques
5 Day Trading Techniques
 
Fibonacci retracement level
Fibonacci retracement levelFibonacci retracement level
Fibonacci retracement level
 
Chart patterns final handout
Chart patterns   final handoutChart patterns   final handout
Chart patterns final handout
 
High Probability Trading Setups
High Probability Trading SetupsHigh Probability Trading Setups
High Probability Trading Setups
 
Magic Breakout Forex Trading Strategy PDF eBook
Magic Breakout Forex Trading Strategy PDF eBookMagic Breakout Forex Trading Strategy PDF eBook
Magic Breakout Forex Trading Strategy PDF eBook
 
Hanzo Shawdow Codes.pdf
Hanzo Shawdow Codes.pdfHanzo Shawdow Codes.pdf
Hanzo Shawdow Codes.pdf
 
Binary Option For FX Traders
Binary Option For FX TradersBinary Option For FX Traders
Binary Option For FX Traders
 
Candle stick bible
Candle stick bibleCandle stick bible
Candle stick bible
 
Understanding Japanese Candlesticks in Forex Trading by valentino heavens
Understanding Japanese Candlesticks in Forex Trading by valentino heavensUnderstanding Japanese Candlesticks in Forex Trading by valentino heavens
Understanding Japanese Candlesticks in Forex Trading by valentino heavens
 
Fibonacci analysis
Fibonacci analysisFibonacci analysis
Fibonacci analysis
 
ORDER BLOCK ENTRY.pptx
ORDER BLOCK ENTRY.pptxORDER BLOCK ENTRY.pptx
ORDER BLOCK ENTRY.pptx
 
Forex lesson 1 forex overview
Forex lesson 1   forex overviewForex lesson 1   forex overview
Forex lesson 1 forex overview
 
The simple scalping strategy rules
The simple scalping strategy rules  The simple scalping strategy rules
The simple scalping strategy rules
 
Profit from trapped traders with 2 simple setups
Profit from trapped traders with 2 simple setupsProfit from trapped traders with 2 simple setups
Profit from trapped traders with 2 simple setups
 
Forex Trading For Beginners
Forex Trading For BeginnersForex Trading For Beginners
Forex Trading For Beginners
 
The candlestick trading bible(1)
The candlestick trading bible(1)The candlestick trading bible(1)
The candlestick trading bible(1)
 
The Technical Analysis Guidebook
The Technical Analysis GuidebookThe Technical Analysis Guidebook
The Technical Analysis Guidebook
 
Breakout trading strategies
Breakout trading strategiesBreakout trading strategies
Breakout trading strategies
 
Follow the Money and short names.pdf
Follow the Money and short names.pdfFollow the Money and short names.pdf
Follow the Money and short names.pdf
 

Destaque

Revista Conalvias al dia N° 26 de 2012
Revista Conalvias al dia N° 26 de 2012Revista Conalvias al dia N° 26 de 2012
Revista Conalvias al dia N° 26 de 2012Conalvías
 
S10454144 w4 p4_cl_powerpoint_15 apr 13
S10454144 w4 p4_cl_powerpoint_15 apr 13S10454144 w4 p4_cl_powerpoint_15 apr 13
S10454144 w4 p4_cl_powerpoint_15 apr 13hkkwok
 
Camilo Andres Jaramillo Conalvias
Camilo Andres Jaramillo ConalviasCamilo Andres Jaramillo Conalvias
Camilo Andres Jaramillo ConalviasConalvías
 
Andres Jaramillo Lopez
Andres Jaramillo LopezAndres Jaramillo Lopez
Andres Jaramillo LopezConalvías
 
Avviso vendita pubblico incanto attrezzature comunali
Avviso vendita pubblico incanto attrezzature comunaliAvviso vendita pubblico incanto attrezzature comunali
Avviso vendita pubblico incanto attrezzature comunaliPaola Merighi
 
Benamor.belgacemالسلفية الشيعية والسنية بحث في تأثيرها على الاندماج الاجتم...
 Benamor.belgacemالسلفية الشيعية والسنية   بحث في تأثيرها على الاندماج الاجتم... Benamor.belgacemالسلفية الشيعية والسنية   بحث في تأثيرها على الاندماج الاجتم...
Benamor.belgacemالسلفية الشيعية والسنية بحث في تأثيرها على الاندماج الاجتم...benamor belgacem
 
Vague gravitational forces in the conventional swimming pools
Vague gravitational forces in the conventional swimming pools  Vague gravitational forces in the conventional swimming pools
Vague gravitational forces in the conventional swimming pools syed ahmed
 
التوضيح و التكميل Benamor.belgacem
التوضيح و التكميل Benamor.belgacemالتوضيح و التكميل Benamor.belgacem
التوضيح و التكميل Benamor.belgacembenamor belgacem
 
Benamor.belgacemحوارات ما بعد الثورة
 Benamor.belgacemحوارات ما بعد الثورة Benamor.belgacemحوارات ما بعد الثورة
Benamor.belgacemحوارات ما بعد الثورةbenamor belgacem
 
web Turismo villaprado web
 web Turismo villaprado web web Turismo villaprado web
web Turismo villaprado webzengrojas
 
السياسة والدولة Benamor.begacem
السياسة والدولة Benamor.begacemالسياسة والدولة Benamor.begacem
السياسة والدولة Benamor.begacembenamor belgacem
 
Prospectiva estratégica
Prospectiva estratégicaProspectiva estratégica
Prospectiva estratégicaJorge Bleichner
 
final year project1
final year project1final year project1
final year project1Kushal Patel
 
Enfermedades de transmisión sexual (ETS)
Enfermedades de transmisión sexual (ETS)Enfermedades de transmisión sexual (ETS)
Enfermedades de transmisión sexual (ETS)Sabrina Farias
 
الدفاع عن الصحيحين Benamor.belgacem
الدفاع عن الصحيحين Benamor.belgacemالدفاع عن الصحيحين Benamor.belgacem
الدفاع عن الصحيحين Benamor.belgacembenamor belgacem
 
Benamor.belgacemحق الإنسان في الحرية الدينية دراسة تأصيلية على ضوء الاتفاق...
 Benamor.belgacemحق الإنسان في الحرية الدينية   دراسة تأصيلية على ضوء الاتفاق... Benamor.belgacemحق الإنسان في الحرية الدينية   دراسة تأصيلية على ضوء الاتفاق...
Benamor.belgacemحق الإنسان في الحرية الدينية دراسة تأصيلية على ضوء الاتفاق...benamor belgacem
 

Destaque (20)

Revista Conalvias al dia N° 26 de 2012
Revista Conalvias al dia N° 26 de 2012Revista Conalvias al dia N° 26 de 2012
Revista Conalvias al dia N° 26 de 2012
 
S10454144 w4 p4_cl_powerpoint_15 apr 13
S10454144 w4 p4_cl_powerpoint_15 apr 13S10454144 w4 p4_cl_powerpoint_15 apr 13
S10454144 w4 p4_cl_powerpoint_15 apr 13
 
Jokes...;)
Jokes...;)Jokes...;)
Jokes...;)
 
Great ancient indians
Great ancient indiansGreat ancient indians
Great ancient indians
 
Camilo Andres Jaramillo Conalvias
Camilo Andres Jaramillo ConalviasCamilo Andres Jaramillo Conalvias
Camilo Andres Jaramillo Conalvias
 
Andres Jaramillo Lopez
Andres Jaramillo LopezAndres Jaramillo Lopez
Andres Jaramillo Lopez
 
Avviso vendita pubblico incanto attrezzature comunali
Avviso vendita pubblico incanto attrezzature comunaliAvviso vendita pubblico incanto attrezzature comunali
Avviso vendita pubblico incanto attrezzature comunali
 
Ova yira
Ova yiraOva yira
Ova yira
 
Benamor.belgacemالسلفية الشيعية والسنية بحث في تأثيرها على الاندماج الاجتم...
 Benamor.belgacemالسلفية الشيعية والسنية   بحث في تأثيرها على الاندماج الاجتم... Benamor.belgacemالسلفية الشيعية والسنية   بحث في تأثيرها على الاندماج الاجتم...
Benamor.belgacemالسلفية الشيعية والسنية بحث في تأثيرها على الاندماج الاجتم...
 
Vague gravitational forces in the conventional swimming pools
Vague gravitational forces in the conventional swimming pools  Vague gravitational forces in the conventional swimming pools
Vague gravitational forces in the conventional swimming pools
 
التوضيح و التكميل Benamor.belgacem
التوضيح و التكميل Benamor.belgacemالتوضيح و التكميل Benamor.belgacem
التوضيح و التكميل Benamor.belgacem
 
Benamor.belgacemحوارات ما بعد الثورة
 Benamor.belgacemحوارات ما بعد الثورة Benamor.belgacemحوارات ما بعد الثورة
Benamor.belgacemحوارات ما بعد الثورة
 
web Turismo villaprado web
 web Turismo villaprado web web Turismo villaprado web
web Turismo villaprado web
 
السياسة والدولة Benamor.begacem
السياسة والدولة Benamor.begacemالسياسة والدولة Benamor.begacem
السياسة والدولة Benamor.begacem
 
Prospectiva estratégica
Prospectiva estratégicaProspectiva estratégica
Prospectiva estratégica
 
final year project1
final year project1final year project1
final year project1
 
Enfermedades de transmisión sexual (ETS)
Enfermedades de transmisión sexual (ETS)Enfermedades de transmisión sexual (ETS)
Enfermedades de transmisión sexual (ETS)
 
الدفاع عن الصحيحين Benamor.belgacem
الدفاع عن الصحيحين Benamor.belgacemالدفاع عن الصحيحين Benamor.belgacem
الدفاع عن الصحيحين Benamor.belgacem
 
Benamor.belgacemحق الإنسان في الحرية الدينية دراسة تأصيلية على ضوء الاتفاق...
 Benamor.belgacemحق الإنسان في الحرية الدينية   دراسة تأصيلية على ضوء الاتفاق... Benamor.belgacemحق الإنسان في الحرية الدينية   دراسة تأصيلية على ضوء الاتفاق...
Benamor.belgacemحق الإنسان في الحرية الدينية دراسة تأصيلية على ضوء الاتفاق...
 
4° básico b
4° básico b4° básico b
4° básico b
 

Semelhante a Wyckoff

ALL ABOUT CANDLESTICKS PATTERENS ZERODHA
ALL ABOUT CANDLESTICKS PATTERENS ZERODHAALL ABOUT CANDLESTICKS PATTERENS ZERODHA
ALL ABOUT CANDLESTICKS PATTERENS ZERODHAssuser61b3bf
 
tristan de gouvion saint cyr tristan de gouvion saint cyr
tristan de gouvion saint cyr tristan de gouvion saint cyrtristan de gouvion saint cyr tristan de gouvion saint cyr
tristan de gouvion saint cyr tristan de gouvion saint cyrTristan de Gouvion Saint Cyr
 
Trt pov module 12 building a trading system
Trt pov module 12 building a trading systemTrt pov module 12 building a trading system
Trt pov module 12 building a trading systemThe Responsible Trader
 
Swing trading for beginners transcript
Swing trading for beginners  transcriptSwing trading for beginners  transcript
Swing trading for beginners transcriptMarketgeekschannel
 
Forex trading secrets
Forex trading secretsForex trading secrets
Forex trading secretsMd Tazwar
 
Forex fortunes guide
Forex fortunes guideForex fortunes guide
Forex fortunes guidealimAbdul5
 
Forex fortunes guide
Forex fortunes guideForex fortunes guide
Forex fortunes guideOmRatna1
 
Forex Fortunes Guide eBook
Forex Fortunes Guide eBook Forex Fortunes Guide eBook
Forex Fortunes Guide eBook Isabella
 
How to Become a Professional Trader
How to Become a Professional TraderHow to Become a Professional Trader
How to Become a Professional Trader My Trading Skills
 
Trade Forex From Home - 10 Biggest Mistakes New Forex Traders Make (And How T...
Trade Forex From Home - 10 Biggest Mistakes New Forex Traders Make (And How T...Trade Forex From Home - 10 Biggest Mistakes New Forex Traders Make (And How T...
Trade Forex From Home - 10 Biggest Mistakes New Forex Traders Make (And How T...ForexTraining
 
Forex fortunes guide
Forex fortunes guideForex fortunes guide
Forex fortunes guideFasasi Shay
 
Take Ownership of Your Trading
Take Ownership of Your TradingTake Ownership of Your Trading
Take Ownership of Your TradingNetpicksTrading
 
Forex fortunes guide
Forex fortunes guideForex fortunes guide
Forex fortunes guideRS Chauhan
 

Semelhante a Wyckoff (20)

ALL ABOUT CANDLESTICKS PATTERENS ZERODHA
ALL ABOUT CANDLESTICKS PATTERENS ZERODHAALL ABOUT CANDLESTICKS PATTERENS ZERODHA
ALL ABOUT CANDLESTICKS PATTERENS ZERODHA
 
tristan de gouvion saint cyr tristan de gouvion saint cyr
tristan de gouvion saint cyr tristan de gouvion saint cyrtristan de gouvion saint cyr tristan de gouvion saint cyr
tristan de gouvion saint cyr tristan de gouvion saint cyr
 
Trt pov module 12 building a trading system
Trt pov module 12 building a trading systemTrt pov module 12 building a trading system
Trt pov module 12 building a trading system
 
Swing trading for beginners transcript
Swing trading for beginners  transcriptSwing trading for beginners  transcript
Swing trading for beginners transcript
 
Forex trading secrets
Forex trading secretsForex trading secrets
Forex trading secrets
 
Introduction to Scalping Futures
Introduction to Scalping FuturesIntroduction to Scalping Futures
Introduction to Scalping Futures
 
Forex fortunes guide
Forex fortunes guideForex fortunes guide
Forex fortunes guide
 
Forex fortunes guide
Forex fortunes guideForex fortunes guide
Forex fortunes guide
 
Forex Fortunes Guide eBook
Forex Fortunes Guide eBook Forex Fortunes Guide eBook
Forex Fortunes Guide eBook
 
Trading Strategy
Trading Strategy Trading Strategy
Trading Strategy
 
forix
forixforix
forix
 
Why Day Trading Doesn't Work
Why Day Trading Doesn't WorkWhy Day Trading Doesn't Work
Why Day Trading Doesn't Work
 
How to Become a Professional Trader
How to Become a Professional TraderHow to Become a Professional Trader
How to Become a Professional Trader
 
Trade Forex From Home - 10 Biggest Mistakes New Forex Traders Make (And How T...
Trade Forex From Home - 10 Biggest Mistakes New Forex Traders Make (And How T...Trade Forex From Home - 10 Biggest Mistakes New Forex Traders Make (And How T...
Trade Forex From Home - 10 Biggest Mistakes New Forex Traders Make (And How T...
 
Forex fortunes guide
Forex fortunes guideForex fortunes guide
Forex fortunes guide
 
Forex Fortunes Guide.
Forex Fortunes Guide.Forex Fortunes Guide.
Forex Fortunes Guide.
 
Take Ownership of Your Trading
Take Ownership of Your TradingTake Ownership of Your Trading
Take Ownership of Your Trading
 
Forex fortunes guide
Forex fortunes guideForex fortunes guide
Forex fortunes guide
 
Trading Outside of Your Comfort Zone
Trading Outside of Your Comfort ZoneTrading Outside of Your Comfort Zone
Trading Outside of Your Comfort Zone
 
Forex Fortune Guide
Forex Fortune Guide Forex Fortune Guide
Forex Fortune Guide
 

Último

Stock Market Brief Deck for "this does not happen often".pdf
Stock Market Brief Deck for "this does not happen often".pdfStock Market Brief Deck for "this does not happen often".pdf
Stock Market Brief Deck for "this does not happen often".pdfMichael Silva
 
Financial Leverage Definition, Advantages, and Disadvantages
Financial Leverage Definition, Advantages, and DisadvantagesFinancial Leverage Definition, Advantages, and Disadvantages
Financial Leverage Definition, Advantages, and Disadvantagesjayjaymabutot13
 
Quantitative Analysis of Retail Sector Companies
Quantitative Analysis of Retail Sector CompaniesQuantitative Analysis of Retail Sector Companies
Quantitative Analysis of Retail Sector Companiesprashantbhati354
 
House of Commons ; CDC schemes overview document
House of Commons ; CDC schemes overview documentHouse of Commons ; CDC schemes overview document
House of Commons ; CDC schemes overview documentHenry Tapper
 
Stock Market Brief Deck FOR 4/17 video.pdf
Stock Market Brief Deck FOR 4/17 video.pdfStock Market Brief Deck FOR 4/17 video.pdf
Stock Market Brief Deck FOR 4/17 video.pdfMichael Silva
 
The Triple Threat | Article on Global Resession | Harsh Kumar
The Triple Threat | Article on Global Resession | Harsh KumarThe Triple Threat | Article on Global Resession | Harsh Kumar
The Triple Threat | Article on Global Resession | Harsh KumarHarsh Kumar
 
NO1 Certified Ilam kala Jadu Specialist Expert In Bahawalpur, Sargodha, Sialk...
NO1 Certified Ilam kala Jadu Specialist Expert In Bahawalpur, Sargodha, Sialk...NO1 Certified Ilam kala Jadu Specialist Expert In Bahawalpur, Sargodha, Sialk...
NO1 Certified Ilam kala Jadu Specialist Expert In Bahawalpur, Sargodha, Sialk...Amil Baba Dawood bangali
 
PMFBY , Pradhan Mantri Fasal bima yojna
PMFBY , Pradhan Mantri  Fasal bima yojnaPMFBY , Pradhan Mantri  Fasal bima yojna
PMFBY , Pradhan Mantri Fasal bima yojnaDharmendra Kumar
 
Monthly Market Risk Update: April 2024 [SlideShare]
Monthly Market Risk Update: April 2024 [SlideShare]Monthly Market Risk Update: April 2024 [SlideShare]
Monthly Market Risk Update: April 2024 [SlideShare]Commonwealth
 
fca-bsps-decision-letter-redacted (1).pdf
fca-bsps-decision-letter-redacted (1).pdffca-bsps-decision-letter-redacted (1).pdf
fca-bsps-decision-letter-redacted (1).pdfHenry Tapper
 
government_intervention_in_business_ownership[1].pdf
government_intervention_in_business_ownership[1].pdfgovernment_intervention_in_business_ownership[1].pdf
government_intervention_in_business_ownership[1].pdfshaunmashale756
 
Vp Girls near me Delhi Call Now or WhatsApp
Vp Girls near me Delhi Call Now or WhatsAppVp Girls near me Delhi Call Now or WhatsApp
Vp Girls near me Delhi Call Now or WhatsAppmiss dipika
 
Governor Olli Rehn: Dialling back monetary restraint
Governor Olli Rehn: Dialling back monetary restraintGovernor Olli Rehn: Dialling back monetary restraint
Governor Olli Rehn: Dialling back monetary restraintSuomen Pankki
 
Call Girls Near Golden Tulip Essential Hotel, New Delhi 9873777170
Call Girls Near Golden Tulip Essential Hotel, New Delhi 9873777170Call Girls Near Golden Tulip Essential Hotel, New Delhi 9873777170
Call Girls Near Golden Tulip Essential Hotel, New Delhi 9873777170Sonam Pathan
 
(中央兰开夏大学毕业证学位证成绩单-案例)
(中央兰开夏大学毕业证学位证成绩单-案例)(中央兰开夏大学毕业证学位证成绩单-案例)
(中央兰开夏大学毕业证学位证成绩单-案例)twfkn8xj
 
SBP-Market-Operations and market managment
SBP-Market-Operations and market managmentSBP-Market-Operations and market managment
SBP-Market-Operations and market managmentfactical
 
Bladex 1Q24 Earning Results Presentation
Bladex 1Q24 Earning Results PresentationBladex 1Q24 Earning Results Presentation
Bladex 1Q24 Earning Results PresentationBladex
 
Classical Theory of Macroeconomics by Adam Smith
Classical Theory of Macroeconomics by Adam SmithClassical Theory of Macroeconomics by Adam Smith
Classical Theory of Macroeconomics by Adam SmithAdamYassin2
 
(办理学位证)加拿大萨省大学毕业证成绩单原版一比一
(办理学位证)加拿大萨省大学毕业证成绩单原版一比一(办理学位证)加拿大萨省大学毕业证成绩单原版一比一
(办理学位证)加拿大萨省大学毕业证成绩单原版一比一S SDS
 
How Automation is Driving Efficiency Through the Last Mile of Reporting
How Automation is Driving Efficiency Through the Last Mile of ReportingHow Automation is Driving Efficiency Through the Last Mile of Reporting
How Automation is Driving Efficiency Through the Last Mile of ReportingAggregage
 

Último (20)

Stock Market Brief Deck for "this does not happen often".pdf
Stock Market Brief Deck for "this does not happen often".pdfStock Market Brief Deck for "this does not happen often".pdf
Stock Market Brief Deck for "this does not happen often".pdf
 
Financial Leverage Definition, Advantages, and Disadvantages
Financial Leverage Definition, Advantages, and DisadvantagesFinancial Leverage Definition, Advantages, and Disadvantages
Financial Leverage Definition, Advantages, and Disadvantages
 
Quantitative Analysis of Retail Sector Companies
Quantitative Analysis of Retail Sector CompaniesQuantitative Analysis of Retail Sector Companies
Quantitative Analysis of Retail Sector Companies
 
House of Commons ; CDC schemes overview document
House of Commons ; CDC schemes overview documentHouse of Commons ; CDC schemes overview document
House of Commons ; CDC schemes overview document
 
Stock Market Brief Deck FOR 4/17 video.pdf
Stock Market Brief Deck FOR 4/17 video.pdfStock Market Brief Deck FOR 4/17 video.pdf
Stock Market Brief Deck FOR 4/17 video.pdf
 
The Triple Threat | Article on Global Resession | Harsh Kumar
The Triple Threat | Article on Global Resession | Harsh KumarThe Triple Threat | Article on Global Resession | Harsh Kumar
The Triple Threat | Article on Global Resession | Harsh Kumar
 
NO1 Certified Ilam kala Jadu Specialist Expert In Bahawalpur, Sargodha, Sialk...
NO1 Certified Ilam kala Jadu Specialist Expert In Bahawalpur, Sargodha, Sialk...NO1 Certified Ilam kala Jadu Specialist Expert In Bahawalpur, Sargodha, Sialk...
NO1 Certified Ilam kala Jadu Specialist Expert In Bahawalpur, Sargodha, Sialk...
 
PMFBY , Pradhan Mantri Fasal bima yojna
PMFBY , Pradhan Mantri  Fasal bima yojnaPMFBY , Pradhan Mantri  Fasal bima yojna
PMFBY , Pradhan Mantri Fasal bima yojna
 
Monthly Market Risk Update: April 2024 [SlideShare]
Monthly Market Risk Update: April 2024 [SlideShare]Monthly Market Risk Update: April 2024 [SlideShare]
Monthly Market Risk Update: April 2024 [SlideShare]
 
fca-bsps-decision-letter-redacted (1).pdf
fca-bsps-decision-letter-redacted (1).pdffca-bsps-decision-letter-redacted (1).pdf
fca-bsps-decision-letter-redacted (1).pdf
 
government_intervention_in_business_ownership[1].pdf
government_intervention_in_business_ownership[1].pdfgovernment_intervention_in_business_ownership[1].pdf
government_intervention_in_business_ownership[1].pdf
 
Vp Girls near me Delhi Call Now or WhatsApp
Vp Girls near me Delhi Call Now or WhatsAppVp Girls near me Delhi Call Now or WhatsApp
Vp Girls near me Delhi Call Now or WhatsApp
 
Governor Olli Rehn: Dialling back monetary restraint
Governor Olli Rehn: Dialling back monetary restraintGovernor Olli Rehn: Dialling back monetary restraint
Governor Olli Rehn: Dialling back monetary restraint
 
Call Girls Near Golden Tulip Essential Hotel, New Delhi 9873777170
Call Girls Near Golden Tulip Essential Hotel, New Delhi 9873777170Call Girls Near Golden Tulip Essential Hotel, New Delhi 9873777170
Call Girls Near Golden Tulip Essential Hotel, New Delhi 9873777170
 
(中央兰开夏大学毕业证学位证成绩单-案例)
(中央兰开夏大学毕业证学位证成绩单-案例)(中央兰开夏大学毕业证学位证成绩单-案例)
(中央兰开夏大学毕业证学位证成绩单-案例)
 
SBP-Market-Operations and market managment
SBP-Market-Operations and market managmentSBP-Market-Operations and market managment
SBP-Market-Operations and market managment
 
Bladex 1Q24 Earning Results Presentation
Bladex 1Q24 Earning Results PresentationBladex 1Q24 Earning Results Presentation
Bladex 1Q24 Earning Results Presentation
 
Classical Theory of Macroeconomics by Adam Smith
Classical Theory of Macroeconomics by Adam SmithClassical Theory of Macroeconomics by Adam Smith
Classical Theory of Macroeconomics by Adam Smith
 
(办理学位证)加拿大萨省大学毕业证成绩单原版一比一
(办理学位证)加拿大萨省大学毕业证成绩单原版一比一(办理学位证)加拿大萨省大学毕业证成绩单原版一比一
(办理学位证)加拿大萨省大学毕业证成绩单原版一比一
 
How Automation is Driving Efficiency Through the Last Mile of Reporting
How Automation is Driving Efficiency Through the Last Mile of ReportingHow Automation is Driving Efficiency Through the Last Mile of Reporting
How Automation is Driving Efficiency Through the Last Mile of Reporting
 

Wyckoff

  • 1.
  • 2.
  • 3. CONTENTS Sect. Page How to Proceed A-B Foreword 1M 1-2 Basic Law 2M 1-4 Judging the Market by Its Own Action 3M 1-4 Forms oí Charts 4M 1-27 Buying and Selling Waves 5M 1-3 Chart Records 6M 1-4 Determining the Trend oí the Market - Composite. Averages 7M 1-35 Comparing Strength and Weakness - Group Averages 8M 1-25 How a Campaign is Conducted - Individual- Chart Studies - Part I 9M 1-10 How the OperatorIs Intentions may be Detected - Chart Studies II 10M 1-13 Figure Charts - Individual Chart Studies - Part III 11M 1-13 Figure Chart Studies - Individual Stocks - Part IV 12M 1-9 Figure Charts - N. Y. Times Average - Chart Studies Part V 13M 1-10 Market Technique - Volume Studies 14M 1-14 Signiíicance oí Trend Lines 15M 1-20 Vertical Line Charts - Chart Studies Part VI 16M 1-34 Vertical Line Charts - Chart Studies Part VII 17M 1-26 Selecting the Best Stocks - Position Sheet - Barometer 18M 1-19 How to Determine the Position oí an Individual Stock 19M 1-14 Buying and Selling Tests 20M 1-7 Reíinements 21M 1-10 The Wave Chart 22M 1-39 Stop Orders 23W 1-17 General Instructions - Cautionary Suggestions 24M 1-18 Market Philosophy - Cautionary Suggestions (Cont.) 25M 1-11 Addenda A1-A7
  • 4. Copyright 1937 by Wyckoff Associates, Inc. Page A HOW TO PROCEED WITH THE STUDY OF THE RICHARD D. WYCKOFF COURSE OF INSTRUCTION The following is recommended as a plan of study which should facilitate your progress and enable you to get the most out of this Instruction: 1. Read through the entire Course casually without attempting to study any part of it. YOU will find numerous cross-references in the text. Disregard these for the present. Let your, first casual reading be for the purpose of gaining a general idea of the scope and presentation of the subject matter. 2. Read through the entire Course a second time, again, ignoring the cross- references. This time, weigh the meaning of each paragraph more care- fully, but do not attempt to dwell upon any part or section for more than a few minutes yet. Let the purpose of this second reading merely be to impress upon your mind more firmly the ideas you absorb as you go along. If necessary, read the whole Course through a third time before you begin to concentrate on any particular part. By these repeated readings you will find that your memory will retain more firmly the ideas that are presented in each section. Then, when you do begin to study and analyze each paragraph intensively, you will have a clear understanding of the way in which the various parts, fit into, the complete philosophy of this Instruction. Bear in mind that everything in the Course is important. Nothing is superficial. Do not neglect those sections which are necessarily shorter, than others. Every paragraph is as much an integral part of the Course as any other paragraph. 3. On your second or third reading, mark any paragraphs that may not be clear to you. 4. Now study carefully Sections 4M and 6M and practice making vertical line and figure charts, as explained in Section 4M, until you are sure that you understand how to construct them properly. Should you have any dif- ficulty or doubts concerning the method of making the 1 or 3 point figure charts or the vertical charts, consult our Coaching Staff - that is send us samples of the charts you have made in accordance with your un- derstanding of the instructions and we shall be glad to check your work. 5. Next, study and analyze carefully Sections 5M to 25M, inclusive, again marking any portions of the text which may not be clear to you. Make full use of all cross-references and - footnotes as you go along. .The cross- references are indicated thus: "Sect. -, Pg. -, Par. -," which means that when you come to one of - these references you should turn to the Indicated section, page and paragraph and study it in conjunction with the text in the part of the Course where you are at the moment. Note that paragraph one begins on any given page, with the first indentation on that page. For instance, turn to Page 2, Section 3M. Paragraph 1 begins with the
  • 5. Copyright 1937 by Wyckoff Associates, Inc. Page B fifth line from the top of the page, which reads "No one can deny, etc."; Paragraph 2 begins with the words "Tape Reading and Chart Reading, etc." The first four lines on the top of the page are the run-over from paragraph 5 on the preceding page. In all cases where charts are discussed, follow the instructions given in Section 7M CPg. 2, Par. 3) for studying them alongside of the reading matter in the Course. 6. Review the portions of the text you may have marked as suggested in items 3 and 5, above. If you still find that you do not understand them, send us a list of these questions Creferring to the proper section, page and paragraph number) and any other questions, that I are puzzling you, so we may clear up your difficulties. 7. Next, practice making up a Position Sheet and the Technical Position Barometer, consulting freely the instructions contained in Sections 1BM and 19M. B. You will now be ready to test your ability to apply the principles you have learned from this Course by making a series of paper trades. 9. After you have completed the above steps, one by one, if you have troub- le, in applying any of the principles, or if your paper trades do not de- velop according to expectations, you are urged to select a paper trade, that illustrates your difficulty and submit it to us. Be sure to include a statement showing when and at what price you bought or sold; where you placed your stop, the technical position of the stock as you understood it at the time you entered the trade; and an outline of the reasoning you employed in arriving at your decision to make the trade. 10. It will be advisable also for you to send us copies of your Position Sheets and Records of Paper Trades for review and criticism. Please use the short forms of these records which are furnished you for the purpose of securing this additional instruction. Do not fail to accompany these records with full outline of your own reasons for your decisions. 11. As you gain proficiency in the application of this Instruction and ac- quire experience in the interpretation of market action, you will find an occasional review of your Course extremely beneficial. As your knowledge of stock market technique increases, your Course will acquire increasing value as a reference work. Therefore, do not lay it away - but consult it often. It not only will refresh your memory of vital principles, but by constant review will awaken you to the discovery of refinements and principles that may have escaped your notice on earlier occasions.
  • 6. WARNING Every paragraph - every line - in this Course is vital - it was put for a very definite purpose. Do not negleet any part of it and do not attempt to operate in the market by this Method until you have thoroughly learned the whole of it.
  • 7. Copyright 1931 by Wyckoff Associates, Inc. Section 1M Page 1 FOREWORD This is a method of judging the stock market by its own action. It is intended for investors as well as for traders. It has been planned and prepared for those who desire to safeguard their investment capital against, and to make money from, the fluctuations in the priced of stocks dealt in on the New York Stock Exchange or any other organized exchange. It is applicable as well to bonds, preferred stocks and the leading com- modity markets. Anyone who buys or sells a stock, a bond or a commodity for profit is speculating if he employs intelligent foresight. If he does not, he is gambling. Your purpose should be to become intelligent, scientific and successful investor and trader. This Method is for those who have had either little or no experience operating in the stock market, or for those who have had much experience but who have never been shown the real rules of the game. Out of the very limited number who really understand the inner workings of the stock market, practically no one has been willing to show the public the real inside. I believe it is time for someone to step forward and do this. The appalling losses, in securities, suffered annually by millions of people, are enough to make the angels weep. These losses are the direct result of stock market plunging by people, most of whom do not realize what they are risking, and who have an amazingly small knowledge of the market. That the American public needs help in its security market operations there can be no question. I believe the best way to help people is to show
  • 8. Copyright 1931 by Wyckoff Associates, 1nc. Section 1M Page 2 them how to help themselves; and so 1 am here offering the cream of what 1 have learned in forty years of active experience in Wall Street. By the methods herein explained, 1 have made a great deal of money for myself and my clients and subscribers who numbered in excess of 200,000. By making this available to those who desire to learn the business or trading and investing in stocks - for it is a business just like law, medicine, or any other - 1 hope to be of still greater service, not only to my former patrons, but to others who have not had an opportunity to invest under favorable conditions. After you have learned this Method, you can devote half an hour, an hour, all day or as much time, as you like, to forecasting the market, selecting the best stocks in which to make commitments and the best time to buy and sell. You can learn from this how to develop independent judgment, so that you need never ask anyone's opinion or listen to anyone's tips, or take anybody's advice. You can so train your judgment that you will know just what to do and when to do it. When you are in doubt you will do nothing. 1 do not claim that you can be invariably right. No one could. What 1 aim to do is to show you how to be right in the majority of instances. This will require close study and self-training on your part. 1 will teach you how to read the market from your daily newspaper; from the tape of the stock ticker; from your charts, or any or all combined. 1 will teach you to plan your stock market campaigns just as a general plans his battles.
  • 9. eopyright 1931 by Richard D. Wyckoff Section 2M Page 1 THE BAS1e LAW OF SUPPLy AND DEMAND 1 had been in Wall Street 20 years when 1 discovered that it was possible to judge the future course of the market by its own action. 1n my book, "Wall Street Ventures and Adventures Through Forty years" (pg. 168) 1 stated my experience and observations in 1909 as follows: "1 saw more and more that the action of .stocks reflected the plans and purposes of those who dominated them. 1 began to see possibilities of judging from the very tape what these master minds were doing. My editorial work was proving a most valuable means of self-education. 1n gathering material that would benefit my readers, 1 was actively searching out the stuff that would aid me personally. While my subscribers were given the best of what 1 collected, there was much in material discarded which helped to build up what 1 might call a code of enlightened procedure for use in this greatest of all the worldIs games. "1 had a friend who had been a member of the Exchange and who was well up on the technique of the market from the standpoint of the floor trader. We often discussed the difference between reading the tape simply to follow price changes (as most clients did) and reading the tape in order to judge the probable action of stocks in the immediate future. "Starting from the simple ground that the logical, action of a stock was to decline when offerings exceeded the number of shares bid for and to advance when the amount bid for was greater than the amount offered, we agreed that the quantity or volume of stock changing hands in each succeeding transaction was of great importance. Anyone who undertook to read the minds of the momentary buy- ers and sellers was able to measure, to a certain degree, their eagerness or anxiety to buy or sell; also to measure the force of the buying power or selling power as shown by the number of shares; and to judge of the purpose behind the action,
  • 10. Copyright 1931 by Richard D. Wyckoff Section 2M Page 2 whether it was to buy without advancing the price, or to force the price up, or to mark it down, or to discourage buying or selling by others, as the case might be. "Each transaction carried with it certain evidence, although it was not always possible to interpret that evidence. All stocks no matter by whom they were owned, bought or sold, looked alike on the tape. But the purposes behind this buying and this selling were different and these might be fairly clear to those who understood market psychology. "Each transaction, although recorded only once, represented a meeting of minds; those of a buyer and a seller. This meeting of minds took place at a certain post on the floor of the Stock Exchange, even though the buyer might be in the far west and the seller in Europe. "Not all transactions were significant, but the interpreter must detect those which were. He must see that some indicated a purpose. Some one or some group was carrying, or attempting to carry, something through. He must take advantage of that." Continuing my studies of the tape, 1 realized, that the Basic Law of Supply and Demand governed all price changes; that the best indicator of the future course of the market was the relation of supply to demand. The Law of Supply and Demand operates in all markets in every part of the world. When demand exceeds supply, prices rise, and when supply is greater than demand, prices decline. This is true not only of stocks; it is constantly being demonstrated in markets for wheat, com, cotton, sugar and every other commodity that is bought and sold; also in other markets such as real estate, labor, etc. 1 demonstrated this further in a series of articles entitled: "Studies in Tape Reading" which attracted wide attention as the first of their kind ever published anywhere, so far as 1 knew. My basic idea in this series was that the stock market, by its own action,
  • 11. Copyright 1931 by Richard D. Wyckoff Section 2M Page 3 continually indicates the probable direction of its immediate and future trend, and anyone able to determine this with accuracy should attain success in trading and investing. Coming events, I claimed, were foreshadowed on the tape because large interests there disclosed their anticipation of advances or declines by their purchases or sales. So, too, with the manipulator who was endeavoring to raise or depress prices. If one were to become sufficiently expert, he could judge by the action of stocks what was in the minds of these large interests and follow them. The trend was simply the line of least resistance. When a stock met op- position in its rise, it must either be strong enough to overcome this resistance (selling) or it must inevitably turn downward, and when, in its downward course, sufficient buying was encountered to halt the decline, it would turn upward. The critical moments in all these various phases of the market were these minor and major turning points, or else the points where the price broke through the opposition into a new field. Further development of this method of judging the market from its own action resulted in my using it as a basis for predicting the probable course-of-the market, and this eventually led to my issuing weekly, "The Trend Letter" (first published in 1911) which had a most successful career for many years. In fact, the forecasts contained in this Letter were so accurate that a large following was developed. As a result of a series of successful campaigns we were not only overwhelmed with business but brokerage houses throughout the country passed along these advices to their clients. So many followers were thus gained that an undue effect was had on the quotations for the stocks in which we traded, and in certain cases the effect on the market was important. All of the above in much more detail, is described in my book "Wall Street Ventures and Adventures Through Forty Years" which it is advisable for you to
  • 12. Copyright 1931 by Richard D. Wyckoff Section 2M Page 4 read. My reason for mentioning these facts is to show that this method of judging the market by its own action was highly successful, from the standpoint of profits realized for subscribers who followed my advices, as well as for many thousands of people who were not subscribers but who bought and sold when we did. From the above you may judge how vital it is, in the stock market, as in every other field, to get down to the right principles.
  • 13. Copyright 1931 by Richard D. Wyckoff Section 3M Page 1 JUDGING THE MARKET BY ITS OWN ACTION The business of Wall Street is to finance corporations and to sell the securities - stocks and bonds - which result from this financing. Some secur- ities are good; others not so good. Those who manufacture and sell them to the public know their value best. The public has comparatively little idea of their real value, except seasoned securities - those which have been on the market for a long time and which, therefore, have established earning power and intrin- sic value. In every case the banker who does the financing and the dealers who help him distribute, have paid for their securities either in cash or in services, or underwritten them. The object is to market these stocks and bonds at as high prices as possible. This marketing is done through distributing houses and syn- dicates, by private sale, by public offering, and by means of listing on the stock exchanges. In the latter case, the stock is advertised by making it active on the tape. If the price be advanced, and the transactions made large, the activity attracts buyers, and those who are handling the stock are thus able to dispose of their shares. Sponsorship is continued after the market is thus made for a company's shares. The bankers operate for themselves, or others operate for them. After a stock is floated, its sponsors try to create a stable market and support the price as well as they can without taking back too much stock. When it is thoroughly distributed and enough people are interested in the stock to make a market which takes care of itself, under ordinary conditions, the original banker, syndicate or sponsor may discontinue operations and turn attention to some other which affords a new opportunity for money-making. Other interests may begin operations in that stock. Generally speaking,
  • 14. Copyright 1931 by Richard D. Wyckoff Section 3M Page 2 there are usually one or more sponsors or large operators working in every stock. Sometimes there are many. These interests see opportunities for profit, accumulate a line, mark up the price when conditions are favorable, and then sell out. Or they may sell short, depress the price and cover. No one can deny that in Wall Street the, big fish eat the little ones. Large operators could not operate successfully without the large number of people making up the public; that is, if there were only ten big interests in the market and no public, these ten could only make a profit by dealing with each other. It would be difficult for one crowd to deceive any of the nine others. But when the public enters the stock market, the large operatorIs game becomes easier for him. Tape Reading and Chart Reading, enable one to detect and profit by these inside operations or manipulation; to judge the future course of stocks, by weighing the relation of supply and demand. This sometimes can be done from price movement alone, but if you consider also the volume of the transactions you gain an additional and vitally important helpful factor. By accurately judging this supply and demand, you are able to decide the trend of the whole market and of certain stocks; also which stocks to buy or sell, and, what is even more important, when to do so. You always aim to select the most promising opportunities; that is, the stocks which are likely to move soonest, fastest and farthest. You make no commitments without sound reasons, and you avoid undue risks. Whenever you study the tape or a chart, consider what you see there as an expression of the forces that lift and depress prices. Study your charts not with an eye to comparing the shapes of the formations, but from the viewpoint of the behavior of the stock; the motives of those who are dominant in it; and the successes and failures of the buyers and sellers as they struggle for mastery on every move.
  • 15. Copyright 1931 by Richard D. Wyckoff Section 3M Page 3 The struggle is continuous. The tape shows all this in detail. The charts enable you to pick the market apart and study whatever portion or phase of it you choose. Supply and demand may be studied on the tape of the stock ticker, and to even better advantage from charts. The tape is like a moving picture film. Every minute of the day it is demonstrating whether supply or demand is the greater. Prices are constantly showing strength or weakness: strength when buyers predominate and weakness when the offerings overpower the buyers. All the various phases from dullness to activity; from strength to weakness; from depression to boom, and from the top of the market down to the bottom - all these are faithfully recorded on the tape. All these movements, small or great, demonstrate the workings of the law of supply and demand. By transferring to the charts portions of what appears on the tape, for study and forecasting purposes, one is more readily enabled to make deductions with accuracy. And now that you are undertaking to learn this Method it is best that you prepare your mind for it by discarding most of the factors that you have heretofore employed in forming your judgment and making your decisions, such as: tips, rumors, news items, newspaper and magazine articles, analyses, reports, dividend rates, politics and fundamental statistics; and especially the half-baked trading theories which are expounded in boardrooms and popular books on the stock market. It is not necessary for you to consider any of these factors because the effect of all of them is boiled down for you on the tape. Thus the tape does for you what you are unable to do for yourself: it concentrates all these elements (that other people use as a basis for their stock market actions) into the com- bined effect of their buying and selling. You draw from the tape or from your charts the comparatively few facts which you require for your purpose. These facts are: (l) price movement, (2) volume, or the intensity of the trading, (3)
  • 16. Copyright 1931 by Richard D. Wyckoff Section 3M Page 4 the relationships between price movement and volume and (4) the time required for all the movements to run their respective courses. You are thus far better equipped than the man who is supplied with all the financial news, statistics, etc. from the whole world. I, therefore, claim that: You need never read anything on the financial page of your newspaper except the table of stock prices and volumes. You need pay no attention to the news, earnings, dividend rates or statem ents of corporations. You need never study the financial or the business situation. You need not understand railroad or industrial statistics, the money market, the crop situation, the bank statements, foreign trade or the political situation. You can absolutely ignore all the thousands of tips, rumors, reports and especially the so-called inside information that flood Wall Street. You can discard all of these completely and finally. UNLESS YOU DO THIS YOU WILL BE UNABLE TO GET THE BEST RESULTS FROM YOUR MARKET OPERATIONS.
  • 17. Copyright 1931 by Richard D. Wyckoff Section 4M Page 1 FORMS OF CHARTS Most of the principal moves in the market are made by large operators, well informed insiders, bankers and pools, whose work we must detect and fol- low. Practicably every stock has market sponsorship, although a stock's spon- sors may not always be active in it (Sect. 14M, Pg. 12). When important interests are accumulating a line of stock, a study of the transactions will frequently disclose the fact; not in every case, but in the majority. The more important the operations, the more easily are they discov- ered by studying the price movement, the volume, the activity and the behavior of stocks as the transactions appear on the tape. An experienced tape reader can, without memoranda of any sort, carry in his head the movements of a number of stocks over many weeks and months and is able to give an opinion as to the present stage of the principal sponsor's operations. But there is a better way than this - an easier, more accurate and more reliable method of tracing these large, inside operations, so as to derive a profit and capital appreciation for the individual investor. 1 refer to the use of charts, or graphs, as some call them. Charts are merely the tape transactions in graphic form. They record market history. All transactions appear first on the ticker tape, from which they are tabulated by the newspapers and printed in the morning and evening editions. You, can, from the tape, or preferably from the newspapers and your charts, secure all the information you need to study the market, and operate in it effectively and profitably. Charts have actual forecasting value because they indicate supply and demand (pressure and support), the volume of trading and the time factor. They form a concrete record of the forces lifting and depressing prices. There is nothing so good for this purpose as charts. All the large interests in the
  • 18. Copyright 1931 by Richard D. Wyckoff Copyright 1937 by Wyckoff Associates, Inc. Section 4M Page 2 Street for decades back have kept records of the market and of individual stocks in chart form. Whenever anyone says it is foolish to keep charts, or to use them in judging the market, you may put that person down as uninformed and either unwilling to learn or incapable of interpreting chart records intelligently. Most of the popular prejudice against charts undoubtedly is due to the fact that many people mistakenly attempt to use charts mechanically - without judgment. They endeavor to draw diagrams or imaginary geometrical patterns on their charts, or apply arbitrary rules or systems such as "oscillators" and other impractical notions. Such methods are wrong. They lead only to errors, losses and discouragement. Therefore, you must remember this:- When you study charts look for the motive behind the action which the chart portrays. Aim to interpret the behavior of the market and of stocks not the fanciful patterns ("gaps," "horns," "flags," "pennants," etc.) which the charts may accidentally form. One who understands how to interpret charts correctly can usually decide whether the whole market, or any single stock, or group of stocks, is most likely to advance, decline or stand still. Every market and every stock is always in a bullish, bearish or neutral position (Sect. 18M, Pg. 4, Par. 3). The person who can determine, with a high percentage of accuracy, the position in which the market, or a group, or a certain stock stands, holds the key to success in trading and investing. Selecting the Charts Best Suited to Your Purpose: It may seem at first that an unnecessary number of charts are herein suggested, but remember that I am explaining this Method, without knowing just what experience, knowledge and practice you have had in the market. I am describing to you all of the records that may be used, and depending upon your selecting therefrom what you find of most value for your individual requirem ents.
  • 19. Copyright 1931 by Richard D. Wyckoff Copyright 1937 by Wyckoff Associates, Inc. Section 4M Page 3 It has always been my rule to reduce the number, of my own charts to the minimum. When I was doing by best work I discarded everything but a vertical line chart of the daily average of 50 stocks, with volumes, and the figure charts of about 150 leading stocks, depending for the balance of my deductions upon study of the stock ticker tape. After you have studied and practiced with some or all of the charts I have suggested, you can select those you need for your individual purpose. If you do not have access to a stock ticker and desire to invest for the intermediate and major moves, it would be best for you to keep both types of charts mentioned below, together with the Wave chart of Tape Readings described in a later section. In this Method we use three kinds of charts: Vertical Line Charts, Figure Charts and a Wave Chart. VERTICAL CHARTS are made by drawing a vertical line to indicate the range of a stock, from high to low, in a single Stock Exchange session. This includes fractions; that is, the exact high and low points are recorded on the chart (see illustrations on pages 4 and 5). The closing price for the day should be indicated by a short horizontal line, and each day's closing line may or may not be joined to that of the pre- ceding day. The day's transactions represent all the pulling and hauling between bulls and bears for that session, and the closing price indicates the net result of the day's battle - a gain or a loss, therefore the closing marks (or lines joined, so that they make a continuous line) indicate the net progress of the market. Volumes for each day's trading are recorded by a vertical line extending up from the bottom of the sheet, with a scale at the side. (See illustrations). On Saturdays the letter S may be placed above the volume for that day so that the volume of transactions for the two hour session may be distinguished from
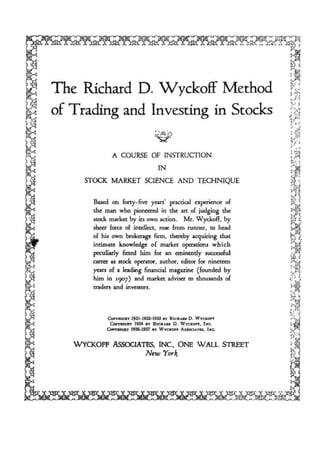
  • 20. DAILY PRICE RANGE AND VOLUME - U.S. STEEL Date High Low Last Volume Jan. 2 49 7/8 48 1/8 49 3/8 31,000 3 49 3/4 49 49 5/8 21,100 4 49 1/2 48 5/8 48 3/4 9,900 6 49 3/8 47 5/8 48 3/8 18,900 7 49 5/8 47 1/2 49 5/8 20,200 8 50 1/4 49 1/2 49 7/8 37,100 9 49 5/4 48 1/4 48 5/8 14,500 10 50 48 3/4 49 5/8 20,600 11 49 7/8 48 1/2 48 5/8 5,800 13 49 48 1/4 48 1/2 9,900 14 48 3/4 48 48 5/8 13,400 15 48 7/8 47 3/4 48 1/4 17,800 16 49 47 3/4 48 3/8 16,600 17 48 1/2 47 3/4 48 1/8 10,600 18 48 47 5/8 47 3/4 5,300 20 47 3/8 46 1/2 46 1/2 13,000 21 47 1/8 46 3/8 46 1/2 10,600 22 48 1/2 47 1/8 48 1/2 13,100 23 49 48 1/4 49 18,000 24 48 3/4 47 1/2 47 5/4 12,000 25 48 5/8 47 1/8 48 1/2 10,500 27 48 5/8 47 7/8 48 12,500 28 48 3/8 47 5/8 47 3/4 8,800 29 48 7/8 47 7/8 48 1/2 15,800 30 49 1/2 48 5/8 48 5/4 31,100 31 50 5/8 48 3/8 50 3/8 47,200 Feb. 1 51 1/4 50 3/8 50 3/8 25,600 3 51 5/8 49 5/8 51 5/8 36,400 4 52 51 3/8 51 7/8 21,700 5 52 l/4 50 7/8 511/8 36,000 6 51 7/8 50 7/8 51 12,100 7 51 7/8 50 3/4 51 18,600 8 51 7/8 51 1/8 51 7/8 9,700 10 55 5/8 51 7/8 55 3/8 66,200 11 50 1/2 56 5/8 58 І/2 82,400 13 59 1/2 58 5/8 59 44,400 14 59 57 3/4 58 3/8 30,300 15 59 3/4 58 59 5/8 19,000 Copyright1936byWyekoffAssoeiates,Ine.Seetion4MPage4
  • 21. DAILY PRICE RANGE AND VOLUME Volume Week Ended High Low Last (-000) Feb. 4 58.81 54.30 54.8O 5,618 11 57.90 53.92 56.65 4,130 18 55.68 51.47 52.86 4,327 25 52.43 47.02 47.63 4,935 Mar. 3 51.63 47.03 50.50 5,365 18 59.93 55.32 57.04 8,671 25 57.92 52.92 54.07 4,977 Apr. 1 54.08 50.44 51.06 3,682 8 53.52 50.19 52.95 5,087 15 56.93 53.75 56.02 6,562 22 64.03 54.14 63.47 22,147 29 68.63 61.36 67.90 18,659 May 6 73.01 67.60 69.53 26,280 13 75.41 67.80 73.14 22,255 20 76.43 71.43 72.82 19,924 27 83.86 71.42 82.86 22,741 June 5 86.30 80.66 83.12 28,250 10 86.70 82.23 85.39 32,320 17 89.60 78.46 81.10 29,837 24 88.43 82.47 86.03 24,306 July 1 91.27 85.82 90.68 26,737 8 97.94 91.00 94.82 29,054 15 97.86 92.37 94.81 50,184 22 98.O5 76.53 79.90 42,336 28 86.60 81.42 84.31 12,849 Aug. 4 85.51 78.57 83.08 8,609 11 89.11 82.24 87.06 8,728 18 88.65 82.76 86.61 8,495 25 93.14 86.79 92.96 11,165 Sept. 1 93.79 89.55 91.51 20,939 9 91.03 85.96 87.12 5,761 16 92.76 86.87 90.99 11,246 23 92.68 82.29 86.16 15,933 30 86.31 79.15 81.58 9,158 Oct. 7 84.49 78.99 83.67 7,741 14 85.62 80.38 81.82 5,476 21 81.38 71.91 72.97 13,738 28 81.20 75.06 79.71 9,829 Copyright1936byWyekoffAssoeiates,Ine.Seetion4MPage5
  • 22. Copyright 1931 by Richard D. Wyckoíí Section 4M Page 6 the volume oí the íive hour sessions. (Sect. 19M, Pg. 6, Footnote.) Advantages oí a Vertical Chart: It is easily made írom the transactions in your newspaper or írom the data recorded on our Daily Stock Chart Reports. These show the price movement - highest, lowest and closing, and the volume. From this -price movement alone we are able to judge the supply and demand, the points oí resistance and support, and the trend. The volume (number oí shares dealt in) indicates the intensity oí the trading and the quality oí the buying and selling, and is a íurther essential aid in judging supply and demand. The Time Factor is also important because it enables us to estimate the speed oí the advances and declines - whether the buying or selling is urgent or leisurely; whether it is slow or rapid accumulation, or distribution. The studies which íollow in succeeding sections will explain this in a practical way. From the volume and the price movement we íind the greatest aid: (a) in determining the direction oí coming moves; (b)deciding when to buy or sell, when to go long or short; (c) when a stock is on the springboard, and (d) when a move is culminating. Daily Vertical Charts are made to record the daily movements and volume oí the averages, or groups or individual stocks. By the use oí these charts, we are better able, to discern accumulation, distribution and other phases oí manipulative (controlled) or uncontrolled moves in the market. By condensing them into weekly, and monthly vertical charts we are able to visualize the long time trend and to keep our perspective oí the long range moves. However, the daily chart is most generally used because oí its greater sensitivity and immediate historical value. In other words, weakly and monthly vertical charts aid us to judge the marketIs present position in relation to the general trend, that is, the major bull and bear cycles; but daily charts are more eííective íor timing commitments advantageously and íor recognizing turning points. FlGURE CHARTS are equally valuable, but it is best to use these in com- bination with vertical charts, so that all obtainable deductions may be made
  • 23. Copyright 1931 by Richard D. Wyckoff Section 4M Page 7 therefrom. Figure charts take no account of fractions, nor do they take account of time or volume. They represent the movement of a stock from one full figure to the next full figure above or below, such as from 35 to 36 or 34. (See in- structions for making figure charts, pages 9 to 14.) They are of great value in estimating the probable extent of supply and demand and the points of resistance and support. From the general formations (not so-called patterns such as "saucers," "baskets," "fulcrums," etc., which are popular with some purely theoretical tech- nicians) on the figure charts we are able to detect accumulation or distribution, and we see clearly marked, the lines of support and supply. We can also identify the marking up and marking down periods to excellent advantage by means of these charts. The most valuable feature of Figure Charts, however, is their horizontal formations, which, in many cases forecast the approximate number of points a stock, or a group, or the average should move. (Sections 10M to 13M.) It is in these horizontal formations, or congestion areas, on the figure chart that we find the greatest aid: (a) in determining how far a stock should go; (b) when it meets opposition, viz., when it has about reached the end of its move; and with the help of the vertical chart (c) determining the trend, and (d) when a stock is on the springboard. Figure Charts may be made: (1) From the fluctuations as they appear on the ticker tape. (2) From the Report of Stock Sales on the New York Stock Exchange, a sheet that is published after the close of each session. (3) From the Daily Stock Chart Reports which we will mail, to you each day, containing the one point fluctuations of more than 200 leading, active stocks. This service will be furnished gratis for six months. (4) From the opening, highest, lowest and closing prices which appear in your daily newspaper; or from vertical charts.
  • 24. Copyright 1931 by Richard D. Wyckoff Copyright 1937 by Wyckoff Associates, Inc. Section 4M Page 8 The Tape shows every transaction that takes place on the Stock Exchange floor. In order to build figure charts therefrom it is necessary to watch the tape continuously for five hours on five days a week, and two hours on Satur- days, so that every fluctuation in the full figures will be recorded on your figure chart. This is an easy matter if one is watching only a few stocks, but as the number increases, you may find it necessary to have some assistance. The Sales Sheet, or Report of Stock Sale's, can be procured from Francis Emory Fitch, Inc. under authorization of a New York Stock Exchange member; it is available about 2 1/2 to 3 hours after the market closes. These sheets contain all the transactions that appear on the tape during the day, arranged so that one can easily run through the different prices at which all the stocks on the list are dealt in, beginning with the opening transaction and including all those that follow, in the order in which they occur. This is the equivalent of reading the tape one stock at a time. It requires but a few moments for each stock, to record the full figure transactions for a day. These sales sheets serve the same purpose as the tape when it comes to building figure charts. One can find them in his broker's offices in New York and he can stop in and get what he wants from them early the next morning following publication. Or, his broker will subscribe to these Sales Sheets for him and mail them to him. Our Daily Stock Chart Reports contain every one point fluctuation in a selected list of more than 200 leading, active stocks; the New York Times, the New York Herald Tribune and the Dow-Jones averages; the Wyckoff Group Averages; and the principal commodities; together with the volume and daily price range data. This makes it possible for you to keep Vertical and Figure Charts on all or any number of the most representative stocks and averages with little trouble and expense. A further advantage of these reports is their accuracy and the prompt correction of errors which may occasionally occur but which gen- erally are not corrected in other sources.
  • 25. Copyright 1931 by Richard D. Wyckoff Copyright 1937 by Wyckoff Associates, Inc. Section 4M Page 9 52 51 51 50 50 49 49 48 48 47 47 46 46 45 The Figure Chart, as we have stated, takes no account of anything except the full figures. Fractions are discarded, as they are of no value in these cal- culations. If you start with a stock which is selling at 50, you pay no attention to any fluctuations except those of a full point or more from that figure. Your next entry after 50 would be either 51 or 49, and after the latter figure is recorded, you would record nothing until the stock sells at 50 or 48. When any full figure is skipped, that is, when there are no sales between say 50 and 53, you would record 51, 52 and 53 just as though there were sales at each of these full figures. But if it rose to only 52 7/8 you would not record 53 until it sold there. To Make a 1 Point Figure Chart, your procedure should be as follows: The stock stands at 50. It goes to 52. You would, therefore, enter the 51 and 52 in the same vertical column as, and above, the 50, thus: 52 51 50 It then declines to 45, or even to 44 1/8, but does not touch 44. You would enter in the next column to the right 51, 50, 49, 48, 47, 46 and 45, thus: 52 51 51 50 50 49 48 47 46 45 It rallies to 49 or to 49 7/8, but does not reach 50 therefore, you would enter in the third right-hand column 46, 47, 48 and 49, thus:
  • 26. Copyright 1931 by Richard D. Wyckoff Copyright 1937 by Wyckoff Associates, Inc. Section 4M Page 10 A dip to 48 would call for an entry at that figure in the fourth right-hand col- umn and a ral1y to 49 an entry of that figure just about the 48 thus: 52 51 51 50 50 49 49 49 48 48 48 47 47 46 46 45 Next a dip to 46 1/4, which calls for an entry of 48 and 47 in the fifth column. A rally to 48 3/4 and another dip to 46 l/8 requires two entries in the sixth column. And so on as per the illustration below, and in the charts shown elsewhere in this volume: 52 51 51 50 50 49 49 49 48 48 48 48 48 47 47 47 47 46 46 45 The dotted lines drawn through the figures show the course of the market. These lines, therefore, indicate how the chart should be made and how it should be read. Dates are indicated on figure charts as follows: On the last day of each month a circle is put around the last entry which appears on the chart for that month, and the initial of the following month is entered a few spaces below the circle in the same vertical column. For example, turn to the 1 point figure chart of Bethlehem Steel on Page 12, Section 11M, and you will see that a circle is marked around the figure 69 in the second column which means that this was the last entry for the month of October, and just below that the letter N indicates that November begins here. A little further on there is another
  • 27. circle with D under it. The circle indicates the end of November and the letter D indicates that December begins here. Then the figure 51 is circled and below is an entry J-31, which means that 51 was the last entry in December, 1930 and January, 1931 begins here. The other months follow in the course. When a stock sells ex-dividend this may be indicated by making all of the entries for that day in red, or some such distinguishing color. The amount of the dividend is then entered in the same vertical column below the graph. If no full figure change occurs on the day the stock sells ex-dividend, the list entry on the chart should be retraced in red, or some other distinguishing color. To make a 1 point Figure Chart from your newspaper: Suppose you take a stock which closed on Monday at 50. That would be your first figure on the figure chart. Your newspaper records the fact that this stock opened today, Tuesday, let us say, at 50 3/4 and went as high as 51 7/8; so you must record 51 on the figure chart.. It does not go to 52. The lowest for the day was 45 3/4; hence after it made the high at 51 it must have passed 46. You record on your figure chart 50, 49, 48, 47 and 46. The stick closed at 48 1/4, therefore it must have rallied from the low of 46 to 48 and you would record 47 and 48 on your figureI chart which would then look like this: 51 50 50 49 49 48 48 47 47 46 Assume that WednesdayIs transactions will show that the stock opened at 46 1/2, made a high of 49 1/8, a low of 45 and closed at 47. Your figure chart would call for an entry at 47 because the stock closed on Tuesday at 48, and to open at 46 1/2 it must have passed 47, which is the same as selling there. You find that the high of Wednesday was 49 1/8, the low 45, but you do not know which occurred first unless you watched the tape sufficiently to tell whether the high point of Wednesday occurred before the low point or vice versa. If you Copyright 1931 by Richard D. Wyckoff Section 4M Page 11
  • 28. Copyright 1931 by Richard D. Wyckoff Copyright 1937 by Wyckoff Associates, Inc. Section 4M Page 12 have not watched the tape, it would be well for you to ask your broker to look at his Sales Sheet and tell you when the stock was highest or lowest. Suppose the high point of the market Wednesday was in the morning. You must assume that your stock went to 49 1/2 after it touched 47. In this case you would make entries on the figure chart as follows: 48, 49. Then as the low of the day was 45, you must record 48 again, then 47, 46 and 45. And as the stock closed at 47 you would record 46 and 47. When completed, your two-daysI figure chart would look like this: 51 50 50 49 49 48 48 48 48 47 47 47 47 47 46 46 46 45 This is not so accurate a method as watching the tape, or using the Sales Sheet, or our Daily Stock Chart Reports; for your newspaper does not give you all of the fluctuations back and forth when a stock is oscillating, say between 45 and 47, once or twice in the dayIs session. But it is a reasonably good method if other means are not available. How to make a 3 Point Figure Chart. The 3 point figure chart condenses the history recorded on the 1 point chart-by discarding all reversals of less than three points. The following explanation will make this clear: Suppose we begin with a small section of a 1 point chart which shows a stock rising from 25 to 31, reacting to 30, then moving upward again to 32, as in Example A. In this, illustration, the rise from 25 to 32 is interrupted by a reversal of only one point. Therefore, this reversal must be disregarded in making the 3 point chart which will simply show the net or total rise from 26 to 32 in one vertical column as in Example B.
  • 29. Copyright 1931 by Richard D. Wyckoff Copyright 1937 by Wyckoff Associates, Inc. Section 4M Page 13 Example A 1 Point Chart Example B 3 Point Chart 32 32 31 31 31 30 30 30 29 29 28 28 27 27 26 26 25 25 Or suppose that the stock has moved straight up from 25 to 31, when its rise is interrupted by a reaction of two points to 29, after which it recovers and goes to a new high of 52, as in Example C. This reaction to 29 must be disregarded on the 3 point chart because it is a reversal of less than three points, so the 5 point chart CExample D) should show only the full movement from 25 to 32, the same as in Example B: Example C 1 Point Chart Example D 3 Point Chart 32 32 31 31 31 30 30 30 30 29 29 29 28 28 27 27 26 26 25 25 Developing our 1 point figure chart a little further, let us say it appears as shown in Example E. Our 3 point chart would then appear as shown in Example F, because after the stock has moved up from 25 to 31 and reacted to 29, its advance to 32 is followed by a three point reversal which forces us to move over to the next right-hand vertical column on our 3 point chart.
  • 30. Copyright 1931 by Richard D. Wyckoff Copyright 1937 by Wyckoff Associates, Inc. Section 4M Page 14 Example E 1 Point Chart Example F 3 Point Chart 32 32 31 31 31 31 31 30 30 30 30 30 30 29 29 29 29 29 28 28 27 27 26 26 25 25 Should the decline from 32 continue on the 1 point chart, without a swing of three points, or more in the opposite direction, we must continue to extend our entries in the second column of our 3 point chart until such a reversal of three points or more does occur, when we would move over to the next right - hand column, as in the following illustrations: Example G 1 Point Chart Example H 3 Point Chart 32 32 31 31 31 31 31 30 30 30 30 30 30 29 29 29 29 29 28 28 28 28 27 27 27 27 26 26 25 25 Example J Example J Example J 1 Point Chart 3 Point Chart 5 Point Chart 32 32 32 31 31 31 31 31 31 31 31 31 30 30 30 30 30 30 30 30 30 30 30 30 29 29 29 29 29 29 29 29 29 29 29 29 29 28 28 28 28 28 28 28 28 28 28 28 28 28 27 27 27 27 27 27 27 27 27 26 26 26 26 26 26 25 25 25
  • 31. Copyright 1931 by Richard D. Wyckoff Copyright 1937 by Wyckoff Associates, Inc. Section 4M Page 15 For additional illustrations of the distinction between the 1 point and the 3 point chart compare the two graphs on Page 8, Section 9M, or remove Page 10, Section 13M from your binder and compare it with Pages 7, 8 and 9. The 5 Point Figure Chart is constructed in the same manner by disregard- ing all reversals of less than five points. A 10 point chart would disregard all reversals of less than ten points. It is VERY IMPORTANT that you learn how to make, read and fully under- stand a 1 point and a 3 point chart before you go any further with your studies, because if you do not understand these forms of charts, you will not get the full benefit from the forecasts that are possible under this Method. We also wish to impress on you the importance of using your 3 point fig- ure chart forecast to compare with your 1 point, especially in studying the more important, that is, the long range moves. The purpose of the 1 Point Chart is to indicate immediate or shorter swing objectives. The 3 Point Chart is designed primarily as a guide to the general trend - to give you a broad perspective of the market and of individual stocks and to indicate the probable objectives of the large swings. As the small swings eventually build up into large ones (Sect. 5M, Pg. 1, Par. 4), the objectives of the 1 point and of the 3 point charts frequently tend to confirm each other, but hot in all cases. When you find a marked difference between the indications of the two charts it is best to be guided by the more conservative indication. The 3 Point Chart is most generally used in conjunction with the 1 Point Chart, but for very high priced or extremely volatile stocks, that is, the fast movers, the 5 Point Chart may prove more satisfactory. The Volume of Sales is not recorded on Figure Charts. TREND CHARTS: The purpose of a Trend Chart is to enable you to keep in harmony with the trend.
  • 32. Copyright 1931 by Richard D. Wyckoff Copyright 1937 by Wyckoff Associates, Inc. Section 4M Page 16 There are two Trends to be considered in trading, as here advocated: (1) the Immediate Trend for active traders who endeavor to get in and out on the email swings, and traders on the floor of the New York Stock Exchange who, not paying any commissions, sometimes can make turns several times a day; (2) the Trend of the Intermediate Swings of 5 to 30 or more points; these in- clude most of the managed campaigns. Trend Charts that is, vertical charts of the leading composite averages, may be kept in such a way as to show, on separate sheets, the daily and weekly or monthly movements in whatever group of average figures you may select. If one lives in New York, or near enough to secure the New York Herald Tribune or the New York Times every day, he will find his Trend Chart already made for him each morning in the financial page of these papers. The Wall Street Journal and other financial and daily papers in different parts of the country regularly or frequently carry similar charts. But there is a distinct advantage in keeping oneIs own records in a loose-leaf binder (this size or pocket size). As each entry is made on the Trend Charts and others, you can study the effect of the change you are recording - their relation to the smaller and larger movements that are under way and more particularly what they forecast. The Trend is the line of least resistance. It is the most important thing to know about the market or an individual stock. A bull market, or an upward trend, begins at the very bottom level of a panic or depression. A bear market starts at the topmost point of a boom. This of course, refers to the long trend, or the main swing in prices which, from bottom to top and from top to bottom makes a complete cycle. The cycles since 1911 are shown on the monthly Vertical (Trend) Chart of the hew York Times Average herewith.
  • 33. Copyright 1931 by Richard D. Wyckoff Section 4M Page 17 Copyright 1937 by Wyckoff Associates, Inc.
  • 34. Copyright 1931 by Richard D. Wyckoff Section 4M Page 18 Copyright 1937 by Wyckoff Associates, Inc.
  • 35. Copyright 1931 by Richard D. Wyckoff Section 4M Page 19 Copyright 1937 by Wyckoff Associates, Inc.
  • 36. Copyright 1931 by Richard D. Wyckoff Copyright 1937 by Wyckoff Associates, Inc. Section 4M Page 20 In between these extreme tops and bottoms of the main moves, there occur a number of intermediate swings of 5 to 30 or more points. It is these intermediate swings which afford excellent opportunities for trading and investment profits; hence it is very important to know, first of all, whether a bull market (Uptrend) or a bear market (Downtrend) is under way, and, second, whether we are at the beginning, in the middle, or at the end of one of these intermediate swings, or in a period of transition between the main swings. The best way to ascertain the above is to keep a Trend Chart (vertical chart of the averages), which is made up of the movements of a large number of stocks, such as the following: Industrials Rails Utilities Total New York Times 25 25 * 50 New York Herald Tribune 70 30 * 100 Dow-Jones & Co.Is Wall Street Journal 30 20 20 70 Standard Statistics Corp. 50 20 20 20 In addition, it is desirable to keep a Wave Chart (as described in Section 22M) to enable you to make a detailed daily analysis of what you see on your Trend Charts. In a bull market most of your trades should be on the long side and in a bear market on the short side. If this rule be generally followed, it should considerably increase your chances for profit. If, in an up trend, you purchase a stock on a bulge and it afterward goes against you, the chances are the upward trend will give you a profit if you have patience. But if you go long in a down trend, and the market continues to decline, you are likely to have, an increasing loss. There are, of course, exceptions to this rule. As is explained in Section 8M, all stocks do not move upward or downward together. Months before the * The Times and Tribune Industrial Averages include a number of Public Utility stocks.
  • 37. Copyright 1931 by Richard D. Wyckoff Copyright 1937 by Wyckoff Associates, Inc. Section 4M Page 21 market-of 1929 culminated in September, many individual stocks began to de- cline; so that while the main trend was upward judging by the averages of a large number of stocks, certain issues were being liquidated while others were making new highs. These stocks which started down early were the forerunners of the main turning point. Their down trends were clearly shown on the individual charts and by the action of the various group averages. In much the same manner, when a bear market is ending, some stocks and some groups of stocks stabilize and start upward ahead of others, moving much faster and farther than the average. Generally, however, stocks tend to move much more uniformly downward in declining markets, than upward in advancing cycles. (Sect. 8M, Pg, 6, Pars. 1-3.) My claim that the market itself tells you what it is going to do is made good in the illustrations which follow in later Sections. By using the Figure Charts to record the movements of the popular averages, such as the New York Times 50, the Dow-Jones 30 Industrials, etc., we are able frequently to estimate how far the whole market is likely to move. And by using the Trend (Vertical) Charts we are able to judge what direction it will take. This claim is substantiated herein. We gain an added advantage in estimating the direction and the probable distance of the more important moves of the market, or of individual stocks, or groups of stocks by condensing the figure chart movements into nothing less than 3 point reversals (Pg. 12, Par. 3). The advantage of using these is especially illustrated in the 3 Point Figure Chart which indicates the 1929 turning point in the market (Sect. 13M, Pg. 10) Your charts from which you study the Trend should be made, first in the form of vertical charts with volumes, then in the form of figure charts. Both are good by themselves but they are much better used in combination. Both may be on transparent paper, so that they can be laid over other charts when studying the comparative strength and weakness (explained in Section 8M) of groups or
  • 38. Copyright 1931 by Richard D. Wyckoff Copyright 1937 by Wyckoff Associates, Inc. Section 4M Page 22 individual stocks; or you may easily compare them by laying one chart above an- other on your table or desk. Individual stocks should be recorded on both vertical and figure charts, but if your time is limited and it is necessary to reduce the number of your re- cords, then a good plan is to keep the bulk of your graphs in figure chart form together with a permanent file of your daily newspaper or our Daily Stock Chart Reports. By filing these reports in order, as you receive them, it is a simple matter to run back through the sheets for several days or weeks, scanning the price range and volume data to observe significant changes in the volume of trad- ing. This procedure is the same as building a vertical chart in your mind. Thus, when you see that an interesting situation may be developing on one of your figure charts, you can readily bring the equivalent of a vertical chart to bear on it and thereby materially increase the accuracy of your deductions. To give you a clear idea of the above method of forming mental pictures of vertical charts, we suggest you turn back to the table on Page 4. Cover the figures in the table (under the heading "Daily Price Range and Volume") with a sheet of paper so that only the first line is visible. Make a mental note of the price range and volume for this day, January 2nd. Then slide your paper down so the next line of figures can be read. By continuing in this manner, making mental note the impression you receive whenever there is a significant change in the price and the volume, or both, you will presently discover that you are able to visualize the action of the stock almost as clearly as you can by studying the chart at the left which was made from the figures in the table. For instance, observe in the table how the daily volume builds up while the price is rising from January 29th to 51st and how volume promptly shrinks on the reaction of February 6th to 8th. A little practice in scanning your newspaper or your Daily Report sheets in this way will enable you readily to detect such significant changes of behavior. If the above procedure does not meet your requirements, another way of
  • 39. Copyright 1931 by Richard D. Wyckoff Copyright 1937 by Wyckoff Associates, Inc. Section 4M Page 23 conserving time is to keep as many figure charts as you can handle conveniently, together with a file of your daily newspaper or Daily Stock Chart Reports as previously indicated. You can then quickly and at any time make up a vertical chart of any stock in your list, maintaining the chart until your interest in that stock ceased or it may have completed its indicated move. Should you follow this procedure you must record the history of the stock back for two or preferably three months; or for a period sufficient to show its action- around the last important supply or support level, in order to have an adequate background. Vertical charts are essential for the proper timing of commitments and especially for detecting the minor turning points because there are times when figure charts may be unchanged, while the vertical charts at the same time show persistent supply or demand within a small range. Or the vertical charts may show an exceptionally large volume of shares changing hands, indicating the completion of a move. Or the volume might be shrinking, which under I certain conditions would indicate, at the top of the swing, a lessening of demand, or, at the bottom of a decline, a lessening of pressure. None of these indications is shown on the figure charts. On the other hand, the figure chart may show many fluctuations on the full figures, while the verticals are unchanged. For example, if the high full figure of a stock on a certain day were 45 and the low 40, there might be sever al fluctuations back and forth between 42 and 43 on the figure chart, but no in- dication of this would appear on the vertical chart. For these reasons it is vital to keep both forms of charts. To define the trend of the market or a single stock, therefore, both the figure and the vertical chart (or its equivalent as suggested on the preceding page) should be used. In deciding when to act, the tape or the Wave Chart of Tape Readings is the best guide. As indicated in "Buying and Selling Waves" (Sect. 5M), and as
  • 40. Copyright 1931 by Richard D. Wyckoff Copyright 1937 by Wyckoff Associates, Inc. Section 4M Page 24 fully explained in Section 22M, the tape shows the psychological moment to buy or sell. If you cannot watch the tape, then you may use the Wave Chart to do this work for you. THE WAVE CHART OF TAPE READINGS wag designed and originated by me, in 1916 in connection with my personal operations in the stock market. It is made to provide a condensed picture of every vital development in every stock market session. It gives a graphic representation of the dayIs tape action which enables us to study the marketIs behavior at leisure, just as if we were watching the ticker continuously and setting down every essential impression. Thus, the Wave Chart is an invaluable aid whereby we may detect chan- ges from technical weakness to strength, and vice versa, and so determine the tumbling points not only of the minor but also of the intermediate swings, frequently several days before the indications are given by the less sensitive popular averages. The method of constructing and interpreting the Wave Chart will be taken up in a later section, as you must first complete your study of the next several chapters in order properly to understand the principles of the Wave Chart. GROUP CHARTS: In the selection of the best stocks in which to trade, and invest Group Charts are of material assistance. These are made of about five (more or less) leading stocks in each industry - Oil, Steel, Motor, Copper, Sugar, Tobacco,. Retail Trade (merchandising), Building, Railroad Equipment, etc. There are so many different lines of business represented on the New York Stock Exchange that these groupings can be made to include as many as you like. The purpose of these charts is to show which industries promise to im- prove or deteriorate, and to warn you to search in those groups for opportunities. A better or poorer outlook for the steel industry or the motors, utilities or others, is immediately forecast by important operations of insiders, their bankers, and the large operators having affiliations with them. If the
  • 41. Copyright 1931 by Richard D. Wyckoff Copyright 1937 by Wyckoff Associates, Inc. Section 4M Page 25 oil business, for example, has been very bad for a long time and the outlook be- gins to improve, these Group Charts will give you the cue. They tell you, in advance, whether ; or not the big interests are shaping their stock market posi- tions for higher or lower prices in these stocks. When large interests begin to accumulate or distribute, you can and should do the same. You can get along without these group charts if you prefer, as our method of detecting stocks in a bullish or bearish position (see "Position Sheet," Section 18M) covers the ground. A glance at the "Position Sheet" will show you whether the Steels, Motors, Oils or others are lining up for a small or a large advance or decline. This should serve your purpose. The keeping of group averages involves quite a little clerical labor. Therefore, if your time is limited, you may find it more expedient to make up your group charts from the computations which you will find ready-made for you each day on our Daily Stock Chart Report, List #2. (See sample yellow, sheet supplied with your Course.) However, if you wish to make these tip yourself, you have only to select the leading stocks in each group, enter their highest, lowest and closing prices, and volumes, each day in separate vertical columns. Add up the prices and divide by the number of stocks in the group. This will give you the average highest, lowest and closing price for the group. The volumes should merely be added together. They should not be divided or averaged. Both Vertical and Figure Charts are used to record changes in the groups. The Vertical Group Charts may be placed one above another, on your desk or table, for purposes of comparison. Likewise, these Group Charts may be laid above any individual Stock Chart and its comparative strength or weakness instantly ascertained. (See illustrations, Section 8M.) If some groups show greater weakness; than others, search these for the stocks to sell short. Those groups which indicate the greatest cooperative
  • 42. Copyright 1931 by Richard D. Wyckoff Copyright 1937 by Wyckoff Associates, Inc. Section 4M Page 26 strength will show you where to look among the individual stock charts for the best stocks to buy when the right time comes. These few suggestions will suffice for the present to indicate how these charts may be used to advantage. For convenience and future ready reference, we summarize what has been set forth in the preceding pages, as follows: VERTICAL CHARTS What is Recorded Deductions Therefrom Indication Supply and Demand. Points of Resistance and Support. Price Movement (high- est, lowest, closing; and opening if desired) Volum e Marking Up and Marking Down. Lines of Supply and Support. Changes of Stride and Progress of Movement. Comparative Strength and Weakness. Intensity of Trading. Increasing or Diminishing Pressure of Supply and Demand. Buying and Selling Climaxes. THE TREND, i.e., the direction of the price movement WHEN to BUY. WHEN to SELL. WHEN to CLOSE OUT. Time Speed of Advances and Declines. Duration of Accumulation or Distribution. WHERE to place Stop Orders Closing Prices Net Gain or Loss. Changes in Pressure Up or Down. FIGURE CHARTS Supply and Demand. Price Movement Points Of Resistance and Support. Marking Up and Marking Down. The best op- portunities. General Formations Accumulation or Distribution. Lines of Supply and Support. Marking Up and Marking Down. Horizontal Formations Probable Extent or Importance of Accumulation or Distribution. Probable DIS- TANCE a stock, or a group, or the market should move.
  • 43. Copyright 1931 by Richard D. Wyckoíí Copyright 1937 by Wyckoíí Associates, Inc. Section 4M Page 27 WAVE CHART OF TAPE READINGS Price Movement oí the Market - Using Sen- sitive Leaders as an Index Volume oí Trading on Alternate Buying and Selling Waves. Activity or Intensity oí Supply and Demand. Sentiment oí Important Interests. Toward the Market. Critical Points oí Resistance and Support. Development oí Accumulation and Distribution Areas. Changes in Pressure Up or Down. Quality and Urgency oí Supply and Demand (by comparing Vol- ume with Activity and Time) . BEHAVIOR oí the market at CRITICAL points in the Minor, INTERMEDIATE, and MAJOR Trends. TURNING POINTS in the Minor, INTERMEDIATE, Trading. Ability oí Bull or Bear Forces to At- tract Following on Advances and Declines, Rallies and Reactions. and MAJOR Trends, Time Or Duration oí Small Buying and Selling Waves. Price Changes írom Wave to Wave. Speed oí Advances and Declines, Rallies and Reactions. Character oí Supply and Demand, Whether Urgent, Leisurely, Timid or Aggressive. Net Gain or Loss. Changes in Pressure Up or Down. RESPONSIVENESS oí the Market to Buying and Selling Impulses.
  • 44. Copyright 1934 by Richard D. Wyckoff Section 5M Page 1 BUYING AND SELLING WAVES Every upward or downward swing in the market, whether it amounts to many points, only a few points, or fractions of a point, consists of numerous buy- ing and selling waves. These have a certain duration; they run just so long as they can attract a following. When this following is exhausted for the time being, that wave comes to an end and a contrary wave sets in. The latter may attract more of a following than the former. By studying the relationships between these upward and downward waves, their duration, speed and extent, and comparing them with each other, we are able to judge the relative strength of the bulls and bears as the price movement progresses. All stock market movements, however large or small, are made up of buying and selling waves. The market does not rise and fall like the water in a tank which is being filled or emptied. It moves to a higher or lower level by a se- ries of surges - a good deal like an incoming or outgoing tide, with successive waves higher or lower than those preceding. The small buying and selling waves which occur during every stock market session run so many minutes (see Wave Charts, Sect. 22M). They are caused large- ly by the restlessness of active professional traders, much like the ripples produced by the wind upon the ocean. Traders must have activity; they make their livelihood by trading on fluctuations. Therefore, they engage in a ceaseless tug of war, trying to put prices up whenever the condition of the market is favorable, or drive them down when they find that the bulls are weak or have overextended themselves. The degree of success or failure attending their efforts enables us determine whether the market is growing stronger or weaker. These small waves are part of the larger waves which run several days, and eventually make up movements of 3 to about 5 points. The 10 and 20 point moves are made up of 3 to 5 point waves, and the bull and bear markets are com-
  • 45. Copyright 1934 by Richard D. Wyckoff Section 5M Page 2 posed of many swings of 1O to 2O points or more. You can easily confirm the above by examining any chart. It is important that you do this so as to impress upon your mind these numerous waves of vari- ous sizes, inasmuch as this will help you to understand the market. You will thereafter think in waves. When you are looking for an opportunity to buy, watch for the down waves in the market and in your stock. After you have bought, you sit through a number of small, medium and good-sized waves, until finally you observe that it is about flood tide in that stock. Then watch for an especially strong up-wave and give your broker an order to sell your stock at the market. The waves of the market furnish a clear insight into changes in supply and demand. By learning to judge all sizes of market waves, you will gradually learn to spot the time when a rising market or a rally, and the time when a declining market or a reaction has halted and is about to reverse. These are the turning points. To be able to say when these turning points are occurring - at the bottom of a bear market, or at any important rallying point on the way down to the bottom, or at the top of a bull market, or at any important reactionary point on the way up, - is a mark of ability in an investor as well as a trader. Remember: The market itself tells us everything we need to know about its probable future action. Every significant change in supply or demand is registered on the tape. When you have learned to analyze the market by its own action, as recorded on the tape or on your charts, then you will be proficient in the art of operating in stocks. Of all the things that are most desirable to know about the stock market, these two are the most important: (1) First, to be able to determine the final top of a bull market; and second, to determine the top of the intermediate swings, and finally the top of the minor moves.
  • 46. Copyright 1934 by Richard D. Wyckoff Section 5M Page 3 (2) To be able to determine the final low in a bear market; the bottom of the intermediate swings, and the end of the minor moves. Master this branch of the subject thoroughly, it is vital. But there is one step more: Your education will not be complete until you can cover all your shorts and go long at the bottom of a panic, a depression or of an intermediate swing, and sell out all long stocks and go short at the top of a boom or an intermediate bull movement. This will be the result of practice, training, and experience. It requires great flexibility of mind and absolute control of your emotions. You can learn to do it if you will study and faithfully practice this Method.
  • 47. Copyright 1937 by Richard D. Wyckoff Section 6M Page 1 CHART RECORDS For the purpose of studying the Buying and Selling Waves referred to in Section 5M, we require a Trend Chart, or vertical chart of some representative general market average each as the New York Times 60 stocks (illustrated in Sec- tion 7M), "supplemented by a Wave Chart (fully explained in Sect. 22M). Our Trend Chart of a general market average is the medium through which we are enabled to study the larger raves of the market. It is our large scale road map from which we judge the marketIs present position in relation to its probable ultimate destination. The Wave Chart is our local map which shows the detail of the marketIs position in relation to these larger swings. Therefore, the Wave Chart helps us to detect the approach of turning points of the large waves, (intermediate swings) frequently two to four days in advanced We cannot very well trade or invest in a total of 50 to 100 stocks simul- taneously, and since all stocks do not move in complete harmony nor with equal speed at all times, we require some means of breaking down our large scale mar- ket map (general market average) into its component parts so that we may deter- mine which sections or groups afford the most promising opportunities. For this purpose we must either employ the Position Sheet described in Section 18M, or we must use Group Charts as explained in Section 4M (Pgs. 24 and 25) and more fully explained in "Comparing Strength and Weakness" (Section 8M). Then, after we have decided which groups offer the greatest promise, we aim to select out of these groups the most desirable individual stocks. In brief, we aim usually to trade in harmony with the trend of the market as a whole and in the most promising groups of stocks (Sect. 9M, Pg. l,. Pars. 1 & 2). Having narrowed our choice down to the most desirable group, we next must have facilities, for selecting the best opportunities from a large number of individual stocks. These will enable us to operate in the stocks that will
  • 48. Copyright 1937 by Richard D. Wyckoff Section 6M Page 2 move soonest, fastest and farthest, and to avoid being tied up in dull, dead stocks. The amount of time at your disposal for stock market purposes will, of course, control the amount of work which you can do without over-working or interfering with your regular business or profession. In general, it is much better to limit your chart work so that the bulk of your time may be devoted to the study and interpretation of your records, than to keep too many charts. In other words, it is better to keep charts of 20stocks and study them thoroughly than to try to keep 200 charts and consume all your spare time in merely posting entries on them. In any case, while you are acquainting yourself with the principles of this Method, it would be best for you to confine your chart records to the 20 charts supplied with your Course. As you gain experience and acquire proficiency in reading charts, you will find that you can readily expand the number you are able to maintain and interpret quickly. For the average, and more advanced students, the following is recommend- ed as a very satisfactory layout: TYPE OF CHART IN THE FOLLOWING F0RMS N. Y. Times 50 or Herald Tribune 100 Dow-Jones 30 Industrials Dow-Jones 20 Railroads Dow-Jones 20 Utilities Wyckoff Group Averages One Point Figure Three Point Figure Daily Vertical Line With Volumes 25 to 200 Individual Stocks One Point Figure Three Point Figure One Point Figure* Wave Chart of Tape Readings Three Point Figure* Ten Point Figure* Continuous Line* * The nature and method of keeping these charts are explained in Sect. 22M.
  • 49. Copyright 1937 by Richard D. Wyckoff Section 6M Page 3 The above portfolio can be expanded either by increasing the number of individual 1 point and 3 point figure charts from the minimum suggested number of 25, to 200 or more, and by keeping part or all of these individual stocks in the form of vertical charts also. At the start, however, if you will make up and maintain vertical charts of a Trend Chart and the various most important group averages such as the Rails, Industrials, Utilities, Steels, Oils, Motors, etc., you can use these far the purpose of determining the trend of the market and of the several groups. Then, when you find from your vertical Group Charts, a group that offers promising opportunities, you may refer to your figure charts of the individual stocks in that group to decide which of these appear to be in the best position. Next, when you have narrowed your selection to the one or two most promising stocks in the group, it will be a simple matter to make up a vertical chart of those stocks, which you can study in order to time your purchases or sales to the best advantage. When you find the move in the group and in your individual stocks has been completed you may discontinue keeping the vertical charts of these stocks until a new opportunity appears to present itself to invest in those stocks (Sect. 4M, Pgs. 22 & 23). In this way you can, if your time is limited and if you wish, save much of the work that would be required to maintain vertical charts every day for a large number of stocks. However, the larger the number of charts you can keep., the greater will be the variety from which to make your selections and the broader your perspective of the whole market. Therefore, another good plan, if you can arrange it, is to hive someone else do your chart work for you - though you can learn more from your charts if you make most of them yourself. The keeping of charts is a clerical job which calls for painstaking ac- curacy, but it is not difficult work for any bright boy or girl after the purely mechanical part has been explained. A student who is beginning to learn
  • 50. Copyright 1937 by Richard D. Wyckoff Section 6M Page 4 mechanical drawing, for example, is receiving training in a school which demands that he be mathematically accurate. You will find such students highly satisfactory for chart work. They can be had at very small salaries. If you have the time or the assistance, you may wish to keep your chart records on a more elaborate scale. In that case, you may find it helpful to add the following to your list: Vertical Charts, with Volumes, showing weekly movements. Vertical Charts, without Volumes, showing monthly movements. The above should not be used exclusively (without daily charts) since they are not sufficiently sensitive to permit accurate timing. Too much vital detail may be lost in the condensation of the daily price movement and volume behavior in the weekly chart. The principal value of the weekly and monthly vertical charts lies in the historical background, that is, the perspective they afford of the long range move and old points of resistance and support. But even for these purposes, the 1 point and the 3 or 5 point figure charts are quite satisfactory. Both the vertical and figure charts may be kept in a loose-leaf note book, of the size of this volume, or pocket size, or on larger sheets, say 11 by 16 1/2 inches, according to your individual preference. Far most students, charts of the size accommodated by a three ring loose-leaf binder holding sheets 8 1/2 by 11 inches, are most convenient.
  • 51. Copyright 1937 by Richard D. Wyckoff Section 7M Page 1 DETERMINING THE TREND OF THE MARKET BY THE DAILY VERTICAL CHART of the New York Times Average of 50 Stocks As previously explained (Sec. 4M, Pg. 16, Par. 3, and Sec. 6M, Pg. 1, Pars. 1 & 3), the most important thing to know about the market is the trend. Since we aim usually to operate in harmony with this trend, a study of our Daily Trend Chart (daily vertical chart of a composite stock average) should be the starting point of all our deductions. No one has yet succeeded in devising a perfect average - one which un- failingly represents the action of the market as a whole at all times. In other words, it cannot be said that one average is consistently better than another. Investing and trading is an art rather than, a science, hence you must not under- take to make precise calculations nor expect precision in a general market aver- age. It is important for you to know this so you will exercise judgment at all times in reading your Trend Chart, and so you will remember that the deductions you draw from it must frequently be adjusted to conform with what you see in the behavior of your Wave Chart, your Group Charts (or Position Sheet) and your charts of individual stocks. Subject to the above qualifications, you will find the New York Times Average of 50 Stocks a generally satisfactory guide to the trend and position of the market as a whole. The New York Herald Tribune Average of 100 Stocks is an- other good average. You may prefer to keep both. If neither is available, you will find that almost any popular average, such as is printed in leading newspapers throughout the country, will suffice. Or, if necessary, you can make your own composite average by combining the three Dow-Jones averages (Industrials, Rails and Utilities) into a total of 70 stocks, provided you are located at a place where these averages are printed daily. To do this properly requires some adjustment of the figures which we shall be glad to explain on written request.
  • 52. Copyright 1931 by Richard D. Wyckoff Copyright 1937 by Wyckoff Associates, Inc. Section 7M Page 2 Regardless of what average you use, the same line of reasoning as that ex- plained herein should be followed in reading the indications given. The accompanying chart (Pgs. 33, 34 & 35) includes the total volume of transactions of all stocks dealt in daily, as indicated by the vertical lines rising from the bottom of the sheet. These volumes must be considered in conjunction with a study of the price movement. The element of time, as previously explained, is represented by the daily additions to the chart from left to right. The closing figure of each day is indicated by a horizontal line across each of the vertical lines which represent the range from high to low. A good way to impress upon your mind the principles involved in reading the chart is to take the pages out of the binder and place them beside the text. Then, with another sheet of paper, cover all but the extreme left side of the chart, exposing only the first few days plotting. As you read the instructions which follow, gradually slide the paper toward the right, revealing the price movement and volume one day at a time. This will have the same effect as reading the market just as if it were being recorded on the chart today and as if you didn"t know what was coming next. The story told by this chart is as follows: We use the period from December 8th to December 17th as our starting point, and without regard to the market history previously recorded. This interval of nine days marked a sharp acceleration of the previous major decline, culminating in a widening spread of the daily price range and a very marked expansion in the daily volume of trading as the market reached its low point - thus reflecting the panicky selling which takes place under such conditions. (See Sect. 4M, Pg. 23, Par. 1, 4th Line; Sect. 8M, Pg, 6, Par. 3; Sect. 16M, Pg. 4, Par. 1; and Footnote on next page.) The volume on the 8th was around 2,000,000. This increases to 5,000,000 on the day of the low point. Tape observers would have noted the fact that a large part of this volume occurred as the market recorded the extreme low and on the rally from the lows. This confirms the fact that the climax of the downward
  • 53. Copyright 1931 by Richard D. Wyckoff Copyright 1937 by Wyckoff Associates, Inc. Section 7M Page 3 movement (*) has actually been passed, and gives us the starting point for our next forecast. (A Wave Chart would show the details of this tape action, including the feverish activity around the dayIs low point.) We must now assume, in view of the above, that the trend is tentatively upward; but this is subject to confirmation by the appearance of higher support on the next reaction; that is, if on the next down swing, prices should break through the turning point of 135 1/2 recorded on December 17th, it would be * The phenomenon of the Selling Climax is caused by the panicky unloading of stocks (supply) by the public and other weak holders which is matched against buying (demand) of (l) experienced operators; (2) the large interests and sponsors of various stocks who now either see an excellent opportunity to replace at low prices the stocks they sold higher up, or wish to prevent further demoralization by giving the market support temporarily; and (3) short covering by the bears who sense a turn. Stocks thus become either temporarily or more lastingly lodged in strong hands. An abnormal increase in volume is one of the characteristic symptoms of a selling climax, since supply and demand must both expand sharply under these conditions. But the supply is now of poor, and the demand of good quality; and since the force of supply now will have been exhausted, a technical rally ensues. If buying on the break (i.e., during the Selling Climax) was principally for the purpose of supporting prices temporarily and checking a panic, or relieving a panicky situation, this support stock will be thrown back on the market at the first favorable opportunity, usually on the technical rebound which customarily follows a selling climax. This, and other selling on the rebound, may increase supply sufficiently to drive prices through the lows of the climax day and bring about a new decline, that is, a resumption of liquidation. On the other hand, should a secondary reaction occur after the technical rally above referred to, and prices hold around or above the climax lows while volume at the same time shrinks appreciably, we have an indication that liquida- tion was completed and, support is again coming into the market. Therefore, the marketIs behavior on these secondary reactions is usually indicative of the next important move. In this connection, it should be noted that the same principles which apply to the large swings also apply to the smaller moves and to the day-to-day buying and selling waves. Thus, a careful examination of your Trend Charts, Group Charts and charts of individual stocks over a period of time, will reveal numerous examples of the above phenomena. These will appear on a small as well as a large scale. However, you must allow for variations. That is, do not expect one selling climax to look exactly like another. The same basic characteristics may be observed; but the time and magnitude of price movement and volume, and the extent and sequence of price movements almost invariably will differ. For example, the abnormal volume may last either one or several days; or the abnormal volume may precede the recording of the extreme low point one or more days. In other words, a selling climax may be completed in one day or be spread over a few days, and volume may reach unusual proportions on the day the low point is made or some days ahead of the final low.
  • 54. Copyright 1931 by Richard D. Wyckoff Copyright 1937 by Wyckoff Associates, Inc. Section 7M Page 4 evidence that liquidation was not completed and that support which turned the market upward on the 17th has been withdrawn. (See Footnote, Pg. 3, Par. 3.) On the other hand, if, as happened to be the case, the buying support comes in around or at a higher level than 135 1/2, we may conclude that demand is beginning to overcome supply, (Footnote, Pg. 3, Par. 4) and that the next logical development for final confirmation of an important reversal will be the marketIs ability to rise above the top of the last rally, which was around 150, Dec. 18th. On January 3rd these averages rise above 152, which gives final confirma- tion of an upward swing which might develop into a rise of substantial proportions. In taking a position in the market, which, of course, would be a long position, we have had, up to now, three opportunities: (1) On December 17th when the market gave indications of having completed a selling climax, and at the same time, as shown by the entry on our vertical chart for that day, was able to rally vigorously on increasing volume. This was the first time it had shown ability to rally aggressively and the first time increasing volume had been shown on an advance for sometime past. On the basis of these tentatively bullish indications we are justified in establishing long positions if we can get in near enough to the lows so that, when we place stop orders (Sect. 23M, Pg. 3, Par. 1) on our commitments two or three points under our purchase prices, our stops will be about 1 to 1 1/2 or 2 points under the danger level, that is, the lows of the climax day. (Sect. 23M, Pg. 1, Par. 2 and Pg. 14, Par. 2.) (2) Our next buying opportunity is on December 29th when the market completes three days of lower support but the closing prices on each of these days are between 140 and 141, showing that the selling pressure is losing its force, since the net result of these three days' pulling and hauling is to leave the average almost unchanged following a considerable reaction.
  • 55. Copyright 1931 by Richard D. Wyckoff Copyright 1937 by Wyckoff Associates, Inc. Section 7M Page 5 At the same time, lower volume on the reaction from the December 18th high, compared with the volume of the mid-December decline, confirms the inference that selling pressure is losing its force; buying power is overcoming it. As it now appears that the market has completed a typical secondary reaction (see Footnote, Pg. 3) which has the effect of broadening the zone of support around the 136-140 level to sustain a proportionately more substantial advance than the first recovery, we either buy on this reaction if we missed our first opportunity, or add to our holdings; with stops on these new positions, as before, under the danger, point, that is, the lows of December 17th. The average is now "on the springboard" - (see Sect. 14M, Last Par. Pg. 4 and Pg. 5). (3) On January 3rd the average goes into new high ground, overcoming the previous tops of December 18th, 19th, 20th and January 2nd. Volume tends to increase on the rally days, December 30th to January 3rd, an indication that is characteristic of a bullish trend. However, this is the least favorable of our three buying opportunities so far, since we would now be purchasing on an up wave, thereby, materially increasing our risk, whereas previous commitments were established on down waves, close to the danger point. (Sect. 5M, Pg. 2, Par. 2.) Remember that we are now studying the average or composite price of 50 stocks, which is our chief guide as to the direction of the trend. It is impractical for us to operate in all of these fifty stocks at the same time; therefore, we must select, when we wish to trade or invest, the individual issues which are showing the greatest technical strength at the time. For this reason we must turn to our Group Averages or our Position Sheet which enables us to select the best out of our list of individual stocks, in order to find the one, five, ten or more stocks which promise to yield the largest profits in the shortest time. (Sect. 6M, Pg. 1, Pars. 2 & 3.)
  • 56. Copyright 1931 by Richard D. Wyckoff Copyright 1937 by Wyckoff Associates, Inc. Section 7M Page 6 Having decided that the trend of the market is upward we must thereafter continue to trade on the long side until there are indications of a change in trend, or until the trend is in doubt. We must always be on our guard against such changes; and when the trend is in doubt we must take a neutral position, that is, be out of the market. For the next several days, until January 9th, the market makes further progress an the bull side, recording 156 1/2 on that day; but observe that the closing figured on the 6th, 7th, 8th, 9th and 10th are all within a range of about one point. That means the market made no upward progress as a net result of four daysI activities following the 6th. The daily volume shows a tendency to taper off, which may mean a lessening of demand at the top of the swing to January 8th. (Sect. 4M, Pg. 25, Par. 1, 6th Line.) This conclusion is partly confirmed by the shortening of the upward thrusts from the 3rd to the 7th, indicating that it was hard work advancing the market from 150 to 155. Buyers now seem reluctant to follow prices upward. On the day when the high of 156 1/2 is recorded, the volume increases abruptly compared with the volume of the preceding sessions at the same time that the price runs up to a new high only to close near the dayIs low (*) and actually below, that of the previous session. All of the foregoing is evidence of the approach of a corrective reaction, but we still hold our long position because, as yet, we have had no indications of important distribution. Such a reaction begins on the 12th and the low point of it occurs on the * The action of the 9th is an illustration of a typical buying climax, which is the reverse of a selling climax. On this day, a poor quality of demand is being promptly overwhelmed by the superior force of supply of good quality. In other words, the bulls, realizing that they are encountering resistance to the advance, break the stalemate of the 6th to 8th by bidding prices up to attract those buyers who were too timid to come in before the advance to 155, but who now fear that the market may get away from them because it is "making a new high." Thus, there is a concerted rush of public demand which gives the larger and shrewder operators their opportunity to dump part of their lines on a broad and active buying wave, made to order for the purpose.
  • 57. Copyright 1931 by Richard D. Wyckoff Copyright 1937 by Wyckoff Associates, Inc. Section 7M Page 7 16th. Volume on the reaction diminishes appreciably compared with volume on the rise from the December 29th low, a bullish indication, showing that the selling pressure is light. On the 16th, the closing is nearly at the high point of the day - a bullish indication which is the reverse of the bearish indication on the 9th. This is our first sign that the reaction is nearly over. (*) So here we have a now buying opportunity in expectation that the advance will be resumed. (**) Further confirmation of this comes in higher support on the 17th and in an almost complete drying-up in volume on a dip to the same low level on the 19th. The closing prices on the 15th, 16th, 17th and 19th show support within a narrow zone, mostly around 147-8. We must, therefore; look for the advancing tendency to be resumed. Then follow four days, in each of which we see higher tops, higher bottoms and higher closing levels, accompanied by gradually increasing volumes - bullish behavior. This brings the market up within a fraction of the high figure of January 9th where, on the 23rd, a volume surge after four days almost perpendicular advance warns us of a buying climax. But here, in any case, we way expect hesi- tation or reaction, due to the influence of the previous top - January 9th. Now observe that for the next thirteen sessions following the 23rd the mar- ket fluctuates within the range of 156-151, a very narrow range for the average. This is because it is called upon to absorb offerings representing stock purchased by over-anxious bulls who got hooked around the high level of January 9th, and perhaps other quantities bought on the way down in 1930 during the period not shown on this chart - purchases made by people who are now eager to get out even. * Note that there is also an indication of a minor selling climax in the somewhat marked increase of volume on the 15th. ** To insure proper limitation of risk on purchases made at this level, our stops should be placed a point or so under the supporting points (lows) of the 16th. The stops on these new, and any previous, long commitments, should be raised to within a point or so of the January 16th to 19th supporting level after the rally of January 20th.
  • 58. Copyright 1931 by Richard D. Wyckoff Copyright 1937 by Wyckoff Associates, Inc. Section 7M Page 8 Such absorption is evidently completed by February 9th when after closing almost at the top on the previous Saturday, an advance into new high ground, 160 5/8, is recorded. (*) Note how the speed of the advance tends to increase, the average gaining 9 points in two sessions - 9th and 10th. (This is the mark-up forecast by item 3 in the footnote below.) See also how the volume increases to 4,000,000 shares and over on these two days, compared with a previous volume of 1,000,000 or 2,000,000 a day for thirteen days past. The exceptionally large volume of the 10th and 11th, plus the failure to record any material further gain on the high volume of the 11th, as usual, is an indication of some distribution and a setback. On the 11th the average makes a high of only 1 point above that of the 10th and closes at only a small fractional gain, on large volume - a large supply overcoming demand. Now, as we watch the supporting points for the next five sessions (13th to 19th), we find that they are all around the 160-162 mark. Meanwhile, volume decreases promptly on the dip to 160. This says there is another advance coming; the market is not ready to turn downward yet. On the 17th there is an attempt to run the average up to a new high, which fails. The closing is almost on the bottom and volume increases noticeably over that of the three previous sessions. It looks at first as if this might be a buying climax (Footnote, Pg. 6), preceding the end of the rise, so we bring the stops on our long trades up" within * The probability that this lateral movement, or trading range, between 156-151 is an area of absorption rather than one of distribution may be deter- mined: (1) from the fact that volume remains low on the reaction to January 29th and takers off promptly on the reaction to February 2nd; (2) from the tendency of the price movement to narrow into a comparatively small range instead of reacting as much as halfway back to the January 19th low, which implies that stocks are not being pressed on the market; and (3) from the fact that after the recession to February 2nd, volume tends to build up consistently at the same time that there is a lifting of the supporting points from February 5th to 7th - behavior typical of the completion of a period of accumulation or absorption prior to a mark-up. (Sect. 10, Pg, 9, Par. 1 and Sect. 16M, Pg. 28, Par. 3 & Pg. 29, par. 1). After the mark-up of February 9th, we raise the stops on our long commit- ments; to a figure within a point or so of the lows of the Jan. 23 - Feb. 7 trading zone, inasmuch as the Feb. 9th rise enables us clearly to define the 151 level as a new and critical line of support.