The Impact of Decentralization in Northern Mindanao
•Transferir como PPT, PDF•
0 gostou•385 visualizações

The content of the video is the presentation made by Mr. Philip Camara during the thematic forum in Cagayan de Oro, May 14, 2011.

Recomendados
Mais conteúdo relacionado
Mais procurados
Mais procurados (20)
Destaque
Destaque (16)
Semelhante a The Impact of Decentralization in Northern Mindanao
Semelhante a The Impact of Decentralization in Northern Mindanao (20)
Último
Último (20)
The Impact of Decentralization in Northern Mindanao
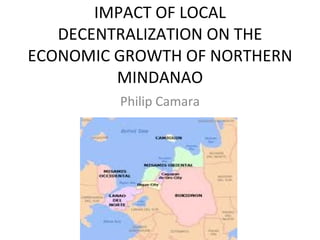
- 1. IMPACT OF LOCAL DECENTRALIZATION ON THE ECONOMIC GROWTH OF NORTHERN MINDANAO Philip Camara
- 2. Net of IRA of P146,591.95 million **Inclusive of IRA of P146,591.95 million Sources: Philippine Commission on Audit 2007 Financial Reports; National Bureau of Statistics of China Comparative Philippine and China Central and Local Government Share in Revenue and Expenditure The Philippines (2007; in Million Pesos ) China (2004 ; 100M Yuan ) Central* Local** Central Local Revenue 1,096,875 234,760 14,503 11,893 % to Total 82.37% 17.63% 54.90% 45.10% Expenditure 1,029,377 194,736 7,894 20,592 % to Total 84.09% 15.91% 27.70% 72.30%
- 3. Philippine Central and Local Government Revenue Breakdown (in percent) * Central-Net of IRA Source: Philippine Commission on Audit 2007 Financial Reports Central Local T otal Revenue 82.37% 17.63% Tax Revenue* 93.08% 6.92% General Income Permits and Licenses 77.03% 22.97% Service Income 94.24% 5.76% Business Income 68.65% 31.35% Other Income 94.65% 5.35% Gain on Forex 100.00% 0.00%
- 6. United States : Sources of State Revenue Source: Tax Foundation Report : stateline.org Source Percentage (US Average) General Sales Tax 23.5% Selective Sales Tax 10.9% Property Taxes 30.1% License and Other Fees 8.2% Corporate Income Taxes 4.7% Individual Income Taxes 22.6%
- 9. Philippine LGU Total Income vs Central Govt. Expenditure per Region *Inclusive of IRA Source: Figures are from the Philippine Commission on Audit 2007 Financial Reports Local Government Total* Central Central P000 Income Government Government Expenditure Expenditure % to LG Total Income Grand Total 234,642,572.58 762,534,007.59 324.98% National Capital Region 46,778,401.48 560,070,716.35 1197.28% Region 1 11,410,059.53 14,371,248.27 125.95% CAR 6,223,710.33 7,499,513.73 120.50% Region 2 9,160,569.36 10,132,758.94 110.61% Region 3 20,888,920.59 21,590,013.29 103.36% Region 4 35,866,590.31 27,646,932.60 77.08% Region 5 10,993,973.34 15,101,341.54 137.36% Region 6 16,679,840.96 18,419,954.59 110.43% Region 7 15,555,455.12 14,027,680.75 90.18% Region 8 8,687,321.73 98,317,599.17 1131.74% Region 9 7,781,531.08 9,821,773.23 126.22% Region 10 11,300,406.23 11,512,490.21 101.88% Region 11 10,170,596.06 10,980,183.03 107.96% Region 12 8,285,249.49 8,623,777.18 104.09% Region 13 7,545,245.07 7,146,537.05 94.72% ARMM 7,354,701.68 8,753,883.18 119.02%
- 18. “ WHAT DOES GDP HAVE TO DO WITH ME?” Results of PINATULO OR SUPERIORITY PRINCIPLE
- 26. Subsidiarity’s Unit of Org is the HH
- 27. Then from HH to Community
Notas do Editor
- Based on analyzed data the budget for example of Dept. of Agri as a percent to the total budget is the same prior to and after devolution of agri services