
Recomendados
Mais conteúdo relacionado
Mais procurados
Mais procurados (16)
Destaque
Semelhante a Crown Research Institute Stats: Surplus Falls
Semelhante a Crown Research Institute Stats: Surplus Falls (20)
Mais de petergnz
Mais de petergnz (20)
Último
Último (20)
Crown Research Institute Stats: Surplus Falls
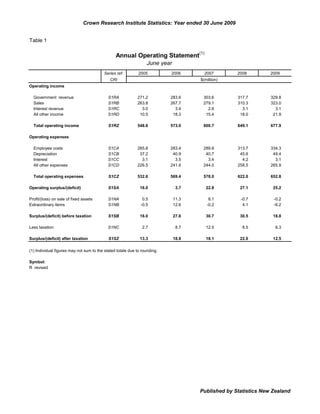
- 1. Crown Research Institute Statistics: Year ended 30 June 2009 Table 1 Annual Operating Statement(1) June year Series ref: 2005 2006 2007 2008 2009 CRI $(million) Operating income Government revenue S1RA 271.2 283.6 303.6 317.7 329.8 Sales S1RB 263.8 267.7 279.1 310.3 323.0 Interest revenue S1RC 3.0 3.4 2.6 3.1 3.1 All other income S1RD 10.5 18.3 15.4 18.0 21.9 Total operating income S1RZ 548.6 573.0 600.7 649.1 677.9 Operating expenses Employee costs S1CA 265.8 283.4 289.8 313.7 334.3 Depreciation S1CB 37.2 40.9 40.7 45.6 49.4 Interest S1CC 3.1 3.5 3.4 4.2 3.1 All other expenses S1CD 226.5 241.6 244.0 258.5 265.9 Total operating expenses S1CZ 532.6 569.4 578.0 622.0 652.8 Operating surplus/(deficit) S1SA 16.0 3.7 22.8 27.1 25.2 Profit/(loss) on sale of fixed assets S1NA 0.5 11.3 8.1 -0.7 -0.2 Extraordinary items S1NB -0.5 12.6 -0.2 4.1 -6.2 Surplus/(deficit) before taxation S1SB 16.0 27.6 30.7 30.5 18.8 Less taxation S1NC 2.7 8.7 12.5 8.5 6.3 Surplus/(deficit) after taxation S1SZ 13.3 18.8 18.1 22.0 12.5 (1) Individual figures may not sum to the stated totals due to rounding. Symbol: R revised Published by Statistics New Zealand
- 2. Crown Research Institute Statistics: Year ended 30 June 2009 Table 2 Statement of Financial Position(1) June year Series ref: 2005 2006 2007 2008 2009 CRI $(million) Equity and liabilities Equity S2EA 320.1 323.7 343.4 485.2 R 498.4 Current liabilities S2EB 113.1 121.8 124.2 131.0 R 155.1 Long-term liabilities S2EC 38.8 35.9 51.1 52.4 R 48.4 Total equity and liabilities S2EZ 472.1 481.4 518.8 668.7 R 701.9 Assets Current assets S2AA 137.2 140.3 142.0 164.3 R 174.5 Investments S2AB 20.7 5.4 14.7 9.8 14.6 Fixed assets S2AC 299.4 311.8 341.1 476.8 R 499.3 Other assets S2AD 14.8 23.9 21.0 17.8 R 13.5 Total assets S2AZ 472.1 481.4 518.8 668.7 R 701.9 Additions to fixed assets S2BA 38.5 67.6 74.8 58.9 72.9 Disposals of fixed assets S2BC 2.9 20.1 11.4 0.8 4.3 (1) Individual figures may not sum to the stated totals due to rounding. Symbol: R revised Published by Statistics New Zealand