Performics Life on Demand 2012 Infographic
•
4 gostaram•1,677 visualizações

Participant Behaviors and Social Engagement
Recomendados

Recomendados
Mais conteúdo relacionado
Semelhante a Performics Life on Demand 2012 Infographic
Semelhante a Performics Life on Demand 2012 Infographic (7)
Mais de Performics
Mais de Performics (20)
Último
Último (20)
Performics Life on Demand 2012 Infographic
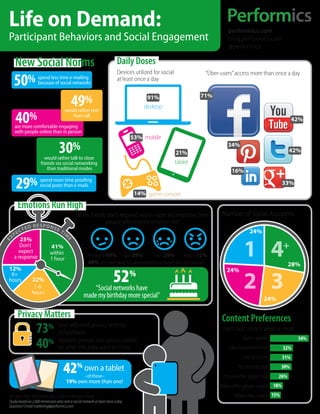
- 1. Life on Demand: performics.com Participant Behaviors and Social Engagement blog.performics.com @performics New Social Norms Daily Doses Devices utilized for social “Über-users” access more than once a day 50% spend less time e-mailing because of social networks at least once a day 49% 91% 71% desktop 40% would rather text than call 42% are more comfortable engaging with people online than in person 53% mobile 30% would rather talk to close 21% 34% 42% friends via social networking tablet than traditional modes 16% 29% spendposts than e-mails social more time proofing 14% game console 33% Emotions Run High When friends don’t respond within expected response time, Number of Social Accounts people who express emotion feel: ESPONS T ED R E EC TI M 24% X P 25% 1 4 E E Don’t expect 41% + within Annoyed 49% Sad 39% Hurt 29% Angry 12% a response 1 hour 40% are more likely to Like/comment to friends who reciprocate 28% 52 have 12% 24% 2 3 6+ hours 22% 1-6 “Social networks hours made my birthday more special” 24% Privacy Matters Content Preferences 73% have adjusted privacy settings in Facebook Users post once a week or more: 40% separate people into groups based Status updates 54% on what info they want to share Jokes/cartoons/memes 32% Links to articles 31% own a tablet Pictures they took 30% –of these– Pictures other people took 26% 19% own more than one! Videos other people created 18% All data from Performics 2012 Life on Demand Study Videos they created 15% Study based on 2,000 Americans who visit a social network at least once a day Question? Email marketing@performics.com