Mais conteúdo relacionado
Semelhante a X2 t07 07 other graphs (2013) (7)
Mais de Nigel Simmons (20)
X2 t07 07 other graphs (2013)
- 1. (J) Other Graphs
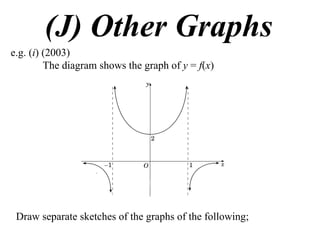
e.g. (i) (2003)
The diagram shows the graph of y = f(x)
Draw separate sketches of the graphs of the following;
- 8. xfxfyii
1
-1
- 9. xfxfyii
1
-1
- 10. xfxfyii
1
-1
4
- 11. xfxfyii
1
-1
4
- 12. xfxfyii
1
-1
4
- 13. 2
xfyiii
1
-1
- 14. 2
xfyiii
1
-1
4
- 15. 2
xfyiii
1
-1
4
- 16. 2
xfyiii
1
-1
4
- 17. xf
eyiv
1
-1
- 18. xf
eyiv
1
-1
xf
exfy
- 19. xf
eyiv
1
-1
xf
exfy
i.e. stationary
points remain
- 20. xf
eyiv
1
-1
xf
exfy
i.e. stationary
points remain
2
e
- 21. xf
eyiv
1
-1
xf
exfy
i.e. stationary
points remain
2
e
- 22. xf
eyiv
1
-1
xf
exfy
i.e. stationary
points remain
2
e
- 23. xf
eyiv
1
-1
xf
exfy
i.e. stationary
points remain
2
e
- 24. xf
eyiv
1
-1
xf
exfy
i.e. stationary
points remain
2
e
- 25. e.g. (ii) (2002)
The diagram shows the graph of y = f(x)
Draw separate sketches of the graphs of the following;
- 48. Exercise 1A; 9, 10, 11a, 12
Exercise 1B; 2bd, 9egh, 11ace, 13af, 14abf, 30, 32e, 34