SlideShare uma empresa Scribd logo
1 de 6
Baixar para ler offline
Nonprofit Finance Fund’s fourth annual


                                                               2012 State of the Sector Survey
                                                                                                 survey of nonprofits nationwide reveals
                                                                                                 that rising service demand is overwhelming
                                                                                                 a sector still coping with a brittle economy
                               ®
                                                                                                 and a barrage of funding cuts.
                           ®


                                                                                                 While there are hints that some organizations
                                                                                                 may have navigated through the worst of
                                                                                                 the recession, the ever-increasing need for
                                                                                                 services suggests that our communities have
                                                                                                 not. The 4,607 respondents tell a story of a
                                                                                                 sector still stretched thin, with organizations
                                                                                                 feeling distant from their funders and boards,
                                                                                                 and staff facing more work with less money
                                                                                                 and fewer benefits to take home. This is a
                                                                                                 wake-up call to funders, government, board
                                                                                                 members, advocates and all of us who care
                                                                                                 about the critical work nonprofits do to build a
                                                                                                 just and vibrant society. The recession may be
                                                                                                 over, but the nonprofit financial crisis is not.


 Demand for Services 2008-2011                                                                   A remarkable 85% of respondents reported
                                                               Need Keeps Rising


 For years 2008, 2009, 2010, 2011                                                                an overall rise in demand, with 4 consecutive years of
                                                                                                 growth in those experiencing "significant increases."
                                                                                                 For many individual nonprofits, this reflects compound
                                                                                                 increases, a sign of deepening community need.
        44%
      41%   42%        41%                                                                       For those who self-identified as providing critical
                     36%                                                                         “lifeline” services (42%), responses were starker:
  35%              36%                                                                           90% of these organizations noted an overall increase
                                                                                                 in demand, with 57% noting a "significant increase."
31%                                                                                              That same percentage of organizations, 57%, was
                                                                                                 unable to meet demand and forced to turn away some
                                                                                                 of the most vulnerable members of our society.
                                   21%                                                           Were Nonprofits Able to Meet
                                      20%
                                                                                                 Demand for Services?
                                        16%                                                 2009 No: 44%                      Yes: 56%
                                          12%                                               2010 No: 49%                      Yes: 51%
                                                   10%
                                                      7%                                    2011 No: 48%                      Yes: 52%
                                                 5%     4%    2012 Expected No: 50%                                           Yes: 50%

 Significantly
  Increased
                    Slightly
                  Increased
                                    Stayed the
                                      Same
                                                  Decreased                                      nonprofitfinancefund.org/survey
                                                                                                 NFF's 2012 Survey is generously supported by
                                                                                                 The Bank of America Charitable Foundation
About the 4,607                    Government Support Is Not Reliable
Respondents
                                   1,927 respondents received funding or contracts from the                    Over 60% of those experiencing any government delays
We more than doubled the           federal government. Among these organizations, 50%                          used reserves to make it through. For some, bridging
response rate from last            experienced payment delays. Of the 2,395 organizations                      the gap caused by payment delays also meant service
year, as more organizations        receiving state or local contracts, the situation was even                  cutbacks, staff cuts, lost interest income, and loans that
chose to add their stories         worse, with 60% experiencing delays.                                        could have been avoided.
to the collective voice of
                           1
the nonprofit community.
                                               Receive Federal         Does It Pay for the                                         When Do You Receive

                                 Federal
The distribution across                                                Full Cost of Services?
                                               Funding or Contracts?                                                               Federal Payment?
sectors remained similar
to previous years. Human                                                                                       Ahead of schedule 2%
Services organizations,                          Yes                       No                                       On schedule                                               48%
the keystone of our                              45%      No               79%                                    1-30 days late                     21%
                                                          55%                      Yes                           31-90 days late                      22%
social safety net,                                                                 21%
were particularly well-                                                                                           > 90 days late    7%
represented.
                                               Receive State/Local     Does It Pay for the                                         When Do You Receive
                                 State/Local


By Sector                                      Contracts?              Full Cost of Services?                                      State/Local Payment?

    Human Services                                                                                             Ahead of schedule 1%
    38%                                                                    No                                       On schedule                                        39%
                                                 Yes      No               75%                                    1-30 days late                       23%
                                                 57%      43%                      Yes                           31-90 days late                          27%
                                                                                   25%
                                                                                                                  > 90 days late             10%


    Arts, Culture, Humanities                                                                                                      •	 From 2007 to 2010, the number of
    18%                            Why We Need Government Funding                                                                     Americans living below the poverty
                                                                                                                                      line increased from 44.4 million to 47.3
    Education                      Across the country, state budget deficits and a trend in dis-investment                                    5
                                                                                                          2                           million.
    15%                            in social services on the state level continue to shred the safety net.
                                                                                                                                   •	 Without government assistance, the
                                   After the recession began, the federal government stepped in to help,
    Public/Societal Benefit                                                                                                           poverty rate would have been almost
                                   through programs such as Temporary Assistance for Needy Families
    15%                                                                                        3                                      twice as high in 2010: that's 40 million
                                   (TANF) and the American Recovery and Reinvestment Act.                                                           6
    Health: 7%                                                                                                                        more people.
    Environment/Animals: 3%        Many of these temporary programs are set to expire soon or have already                         •	 1 in 45 children in the US was
                                           4                                                                                                              7
    Other: 3%*                     expired. Without them, we face an even more dire future: an ever-                                  homeless in 2010.
*Other includes Mutual/            widening income gap, and rising poverty, hunger, and homelessness.                              •	 The Supplemental Nutrition Assistance
Membership Benefit (1%),                                                                                                              Program (SNAP) lifted 2 million children
International, Foreign Affairs                                                                                                                               8
                                                                                                                                      out of poverty in 2010.
(1%), Miscellaneous (1%)


By Annual Expense                  Are Boards Rising to the Challenge?                                            The right amount             Not enough
                                                                                                                  Not at all                   N/A
    $0-50K: 6%
    $50-100K: 4%                   We asked a series of new questions this year
                                                                                                               Makes donations
                                                                                                Our Board...


    $100K-250K: 10%                exploring the role boards play in the financial
                                   and organizational health of nonprofits. How do                             34%                  54%                                8% 4%
    $250K-500K: 13%                boards help noprofits deliver on mission? And                               Leverages relationships to directly solicit funds
                                   what could they do better?
                                                                                                               24%           62%                                    11% 3%
                                   While more than half of respondents                                         Contributes to fundraising (introductions, referrals)
    $500K-2M: 32%                  believed their boards knew enough about the                                 34%                  56%                                7% 3%
                                   organization’s finances, over 60% felt that
                                                                                                               Understands/uses financial data to help us make decisions
                                   they could not depend enough on their boards
                                   for financial support, whether through direct                               67%                                      28%                 3%2%
    $2M-5M: 16%                    contributions or help with fundraising.                                     Understands/can explain our revenue model
                                                                                                               58%                                37%                  4%2%
    $5M-10M: 8%
                                                                                                               Can represent our financial state in external conversations
    $10M-20M: 6%
    $20M+: 5%                                                                                                  51%                            41%                       5%2%
Organizations Show Signs of Coping
    How Many Months of Cash Do Nonprofits Have on Hand?                                                 There are small signs of greater financial stability this year,
    For years 2009, 2010, 2011, 2012                                                                    surprising in light of the seemingly ubiquitous funding cuts.
                                                                                                        Overall, respondents had slightly more months of cash on hand to
                                                                                                        cover expenses. As in 2010, 44% of organizations had surpluses
                                                    32% 32%                                             at the close of the fiscal year and, in a slight increase over last
                                      31% 31%
                                                                                                        year, 25% of organizations broke even.

                                                                                                        Could these be signs that nonprofits are recovering, or are they
                                                                                                        merging with stronger organizations in their communities? Or
                                                              21% 22%                                   have nonprofits gone out of business, leaving their clients to find
                                                        19%19%                20%19% 21%
                                                                           19%                          services elsewhere? In part, this might explain continuing upward
                           18%18%
                        17%      16%                                                                    surges in demand for the organizations still standing.
14%
             12%                                                                                                              Deficit         Surplus        Break-Even
               10%
                 9%                                                                            2008                           32%               40%              28%
                                                                                               2009                           36%               35%              29%
                                                                                               2010                           34%               44%              22%
                                                                                               2011                           31%               44%              25%
         None               1 month       2-3 months      4-6 months         > 6 months


                     "The greatest challenge continues to be meeting...                                                          "Our greatest challenge is creating programs
 Delays and Demand


                                                                                                    Living Within Our Means
                     demand for services with shrinking resources and the                                                        that add to the cash-flow of the organization.
                     on-going uncertainty that exists for the sector... The                                                      It is difficult to compete for grants that allow
                     exceedingly late payments by government have added                                                          little support (up to 10%) for operations with
                     additional strain on an already spread too thin budget                                                      a reduced staff. All staff members have
                     cash flow. Year after year of cuts with year after year of                                                  accepted extra duties with reduced pay in
                     growing demand have created not only a 'new normal'                                                         2012 to allow us to live within our means..."
                     but also quite a bit of fatigue and strain on morale."                                                      Human Services NPO, GA
                     Public/Societal Benefit NPO, NY


    Reserves Still Hard to Discuss
    Nonprofits continue to feel they cannot start conversations about many financial issues with their funders. Like last year, organizations
    felt that funders were most willing to talk about program expansion (54%), while very few believed their funders were open to
    discussions on facility reserves (12%) or operating reserves (21%). Given that a significant percentage of organizations used reserves
    to fill the gap in government payment delays, it’s more critical than ever that we help organizations build their own financial safety net.

    My Nonprofit Can Have an Open Dialogue with Funders About...
                            Facility Reserves 12%
                                                                                      Cash Flow 20%                                      Operating Reserves 21%

                     Program Expansion 54%
                                                          Debt Burden 6%


                                                                                                                                                    Working Capital
         No Open Dialogue 22%                                              Facility Needs 31%                                                       Needs 23%
Nonprofits React to Change
                                                                                                              Actions Taken 2011              Actions Planned 2012
    Management strategies nonprofits used this year were
    generally in line with last year. There were a few variations                                         Added/expanded programs or services


                                                                       Service-Related Actions
                                                                                                    55%
    that could suggest signs of financial improvement:                                              58%
    •	 50% of respondents hired staff for new positions this year,                                        Reduced/cut programs or services
       compared to 44% last year.                                                                   20%
                                                                                                    12%
    •	 The number of respondents that reduced or eliminated                                               Expanded geographies served
       programs decreased, from 26% last year to 20% this year.                                     20%
                                                                                                    28%
    •	 Fewer organizations tapped into reserve funds: 27%, down                                           Reduced/significantly restructured geographies
       from 34% last year.                                                                          3%
                                                                                                    3%
                                                                                                          Collaborated with another NPO to provide programs
    Respondents who partnered with another organization to                                          49%
    improve or increase services declined from 47% to 38%. With                                     56%
    service demand continuing to rise, are there ways that we                                             Increased number of people served
                                                                                                    52%
    can better support collaboration in the sector?                                                 63%
                                                                                                          Decreased number of people served
                                                                                                    6%
    41% of respondents engaged closely with their board this                                        4%
    year, down from 51% last year. This may be another sign that                                          Increased amount of service per client
    nonprofits feel their boards are not sufficiently supporting                                    18%
                                                                                                    22%
    them through financial hardship. Or it may suggest that fewer                                         Decreased amount of service per client
    organizations rely on boards to achieve their goals.                                            5%
                                                                                                    3%
                                                                                                          Partnered with another NPO to improve/increase services
                                                                                                    38%
                                                                                                    48%

                       "[Our greatest challenge is] finding quality
Personnel Challenges


                                                                                                          Hired staff for new positions
                                                                       Management-Related Actions


                                                                                                    50%
                       staff to work with our clients, given we have                                40%
                                                                                                          Cut staff
                       reduced our staff benefits... Doing more                                     23%
                                                                                                    10%
                       with less, we have cut our clerical support                                        Made replacement hires
                                                                                                    46%
                       staff, have no development department and                                    35%
                                                                                                          Froze all replacement hires
                                                                                                    6%
                       outsource some of our grant writing, but                                     3%
                       the administrative staff have been wearing                                         Retained existing personnel
                                                                                                    39%
                                                                                                    45%
                       many different hats since 2009."                                                   Gave raises
                                                                                                    42%
                       Human Services NPO, CA                                                       40%
                                                                                                          Froze/reduced salaries
                                                                                                    21%
                                                                                                    13%
                                                                                                          Improved/increased staff benefits
                                                                                                    12%
    Human Services NPOs See Staff Changes                                                           13%
                                                                                                          Reduced staff benefits
    Human Services organizations, representing the largest                                          11%
                                                                                                    6%
    portion of respondents, may be experiencing more staffing                                             Relied more on volunteers
    changes than other sectors. Staff volatility was greater and                                    38%
                                                                                                    44%
    accompanied by slightly higher benefit and salary freezes
                                                                                                          Cut staff hours (short weeks, furloughs)
    or reductions. Interestingly, despite these staff fluctuations,                                 10%
    their finances were comparable to non-Human Services                                            5%
                                                                                                          Engaged more closely with board
    organizations.                                                                                  41%
                                                                                                    43%
      Actions Taken 2011        Human                Non-Human                                            Collaborated to reduce administrative costs
                                                                                                    17%
                                Services             Services                                       24%
      Reduced staff             29%                  20%                                                  Merged with another NPO
                                                                                                    2%
      Made replacement hires 52%                     42%                                            3%
      Froze/reduced salaries    24%                  19%                                                  Added to reserves
                                                                                                    23%
      Reduced staff benefits    15%                  9%                                             34%
      Relied more on volunteers 42%                  35%                                                  Used reserves
                                                                                                    27%
                                                                                                    18%
An Optimistic Sector                                                                                          Most Recent Year
                                                                                                                   Organizations Felt
                                                                                                                   Financially Stable
     In addition to gathering quantitative data about financial health and service                                  Pre-2007 7%
     demand, we also ask questions that capture the perceptions and outlooks                                                                   Financial State
     of nonprofit respondents. Every year, qualitative data suggests that people                                        2007 7%                    of the 47%
     have an innate optimism and dedication to mission that moves these                                                2008 10%                   Deficit
     organizations forward despite the financial hurdles in their way.                                                                            12%
                                                                                                                       2009 11%
     But in some cases, their optimism may be writing checks their balance
     sheets can’t cash. 47%, or 1,654 organizations, reported that the most
                                                                                                                       2010 13%
     recent year they felt financially stable was 2011. While this subset of
     respondents did in fact have higher percentages of surplus (63% vs. 44%                                                                      Surplus
     for overall respondents), 12% of them actually reported a 2011 deficit.                                                                      63%
     Among this 12% with deficits, 34% had a 2011 deficit that was greater                                             2011 47%
     than 5% of their annual expense.

     In part, this discrepancy between actual financial condition and
     perception of financial health may be due to the spirit of resilience so                                                                     Break-
     common in the sector. It may also be that our perception of health is                                                                        Even
     relative to what it has been in the past, suggesting that some nonprofits                                                                    25%
     feel lucky to even be in business.                                                                                 2012 5%


                           "We have ambitious revenue targets as we seek to                                        "[Our biggest challenge is] making up for
                                                                                         Filling the Funding Gap
Challenged but Resilient


                           increase our operating revenue and plug our... deficit.                                 reduction in federal funding. We have been
                           This requires increasing donations and ticket sales                                     informed that we are not eligible to apply for a
                           as the economy continues to stagnate. Additionally,                                     couple of grants that we have previously been
                           our endowment has not yet recovered from the stock                                      funded with for the provision of prevention
                           market crash of 2008. Because we base our 5% draw                                       services. In response, we plan to seek alternative
                           on a 3-year rolling average, the "down" years are still                                 funding through private sources as well as
                           impacting the available balance we can draw on..."                                      consider other government opportunities..."
                           Arts, Culture, Humanities NPO, MO                                                       Human Services, TX


     Endnotes
     1. While there were 4,607 total respondents overall, the number of respondents          <http://www.cbpp.org/cms/?fa=view&id=3610>.
     varied for each question. Percentages for each data point are based on these            4. Ibid.
     varying totals. See survey.nonprofitfinancefund.org for respondents per question.       5. Ibid.
     2. Oliff, Phil. "Long and Uncertain Recovery for State Budgets." Off the Charts         6. Sherman, Arloc. "Taking Stock of the Safety Net, Part 1: Overview." Off the
     Blog. Center on Budget and Policy Priorities, 9 Jan. 2012. Web. 15 Mar. 2012.           Charts Blog. Center on Budget and Policy Priorities, 14 Dec. 2011. Web. 15 Mar.
     <http://www.offthechartsblog.org/long-and-uncertain-recovery-for-state-                 2012. <http://www.offthechartsblog.org/taking-stock-of-the-safety-net-part-1-
     budgets/>.                                                                              overview/>.
     Gais, Thomas L. "Financing the Safety Net: Before, During, and After the Great          7. Bassuk, MD, Ellen L. et al. State Report Card on Child Homelessness:
     Recession." Proc. of 2011 Annual Workshop of the National Association for               America's Youngest Outcasts 2010. The National Center on Family
     Welfare Research and Statistics, Vail, Colorado. Nelson A. Rockefeller Institute        Homelessness, Dec. 2011. Web. 15 Mar. 2012. <http://www.
     of Government. 13 Sept. 2011. Web. 15 Mar. 2012. <http://www.rockinst.org/              homelesschildrenamerica.org/media/NCFH_AmericaOutcast2010_web.pdf>.
     pdf/workforce_welfare_and_social_services/2011-09-13-Gais_NAWRS.pdf>.                   8. Dean, Stacy. "Taking Stock of the Safety Net, Part 4: Helping Families Afford
     3. Sherman, Arloc. "Poverty and Financial Distress Would Have Been                      an Adequate Diet." Off the Charts Blog. Center on Budget and Policy Priorities,
     Substantially Worse in 2010 Without Government Action, New Census Data                  19 Dec. 2011. Web. 15 Mar. 2012. <http://www.offthechartsblog.org/taking-
     Show." Center on Budget and Policy Priorities. 7 Nov. 2011. Web. 15 Mar. 2012.          stock-of-the-safety-net-part-4-helping-families-afford-an-adequate-diet/>.
New! Filter the Data Yourself Online                                                About Us
                    Visit nonprofitfinancefund.org/survey to learn                     As a nonprofit 501(c)(3), NFF pushes for improvement in how money is
                    more about the 2012 State of the Sector Survey                     given and used in the sector. Since 1980, we’ve worked to connect money
                    and to see results from previous years. We’ve also                 to mission effectively so that nonprofits can keep doing what they do so
                    created an interactive database of 2012 data that                  well. We provide financing, consulting, and advocacy services to nonprofits
                    you can explore yourself. You can filter results by                and funders nationwide. Our services help great organizations stay in
   geographic areas, sub-sectors, or expenses. We hope you’ll share your               balance, so that they’re able to successfully adapt to changing financial
   thoughts with the community by posting your results on Facebook or                  circumstances and grow and innovate when they’re ready.
   Twitter. Questions? Email us at research@nffusa.org.
                                                                                       In addition to providing millions of dollars in loans and lines of credit, we
                                                                                       organize financial training workshops, perform business analyses, and
   Thank You
                                                                                       offer customized consulting services. For funders, we provide support
                                                                                       with structuring of philanthropic capital and program-related investments,
   Our fourth annual survey was our largest yet. We are grateful to all of the
                                                                                       manage capital for guided investment in programs, and provide advice and
   participants, who spent an average of fourteen minutes each on the survey
                                                                                       research to help maximize the impact of grants.
   and took the time to share some of their innovations and stories this year.
   This, on its own, is an enormous voluntary contribution to improving our
                                                                                       nonprofitfinancefund.org
   understanding of the trends affecting the sector.
                                                                                       nonprofitfinancefund.org/survey
                                                                                       survey.nonprofitfinancefund.org
   We couldn’t have marshalled this enormous undertaking without the
                                                                                       twitter.com/nff_news
   considerable help of our friends, colleagues, and partners, and also want to
                                                                                       facebook.com/nonprofitfinancefund
   thank the many who helped spread the word about the survey.


                   "Families pay fees that cover approximately 25% of                                     “The need for health care services for the
Making Ends Meet


                                                                                   Stretching Resources


                   our costs, and we must find other sources of income                                    uninsured is growing faster than we can
                   to cover the balance... The economy has affected                                       help people. There are so many people in
                   both the ability of the families to pay their portion and                              our area looking for health care that we
                   the ability of our donors to support us at the same                                    will never be able to meet the entire need.
                   or higher level than in the past. We merged with                                       Through the use of volunteers we have been
                   another (smaller) organization in 2010/11, and we are                                  able to increase the numbers of patients we
                   working to retain or re-engage their donors..."                                        treat and decrease our cost per patient.”
                   Education NPO, IL                                                                      Health NPO, VA


   National Headquarters                     San Francisco                             New Jersey                                Detroit
   70 West 36th St., 11th Floor              28 Second St., Suite 600                  59 Lincoln Park, Suite 350                645 Griswold St., Suite 2202
   New York, NY 10018                        San Francisco, CA 94105                   Newark, NJ 07102                          Detroit, MI 48226
   212 868 6710                              415 255 4849                              973 642 2500                              313 965 9145
   NY@nffusa.org                             SF@nffusa.org                             NJ@nffusa.org                             Detroit@nffusa.org
   New England                               Los Angeles                               Greater Philadelphia
   89 South St., Suite 402                   626 Wilshire Blvd., Suite 510             1528 Walnut St., Suite 310
   Boston, MA 02111                          Los Angeles, CA 90017                     Philadelphia, PA 19102
   617 204 9772                              213 623 7001                              215 546 9426
   NE@nffusa.org                             LA@nffusa.org                             Philadelphia@nffusa.org


   Nonprofit Finance Fund is a nonprofit 501(c)(3) Community Development Financial Institution (CDFI)
   © 2012, Nonprofit Finance Fund®

Mais conteúdo relacionado

Semelhante a Nonprofit Finance Fund 2012 State of the Nonprofit Sector Survey

Charity Survey 2012 Result
Charity Survey 2012 ResultCharity Survey 2012 Result
Charity Survey 2012 ResultVDS001
 
MCI\'s Association Masterclass White Paper 2009
MCI\'s Association Masterclass White Paper 2009MCI\'s Association Masterclass White Paper 2009
MCI\'s Association Masterclass White Paper 2009Jean_Evans
 
Nyu presentation 3 1-13 - final
Nyu presentation 3 1-13 - finalNyu presentation 3 1-13 - final
Nyu presentation 3 1-13 - finalCharityNav
 
GWI East Africa - Research
GWI East Africa - ResearchGWI East Africa - Research
GWI East Africa - ResearchCARE Water Team
 
MACE Compensation & Benefits Results - Iowa
MACE Compensation & Benefits Results - IowaMACE Compensation & Benefits Results - Iowa
MACE Compensation & Benefits Results - Iowaiowachamberexecs
 
GC Looking to a brighter future
GC Looking to a brighter futureGC Looking to a brighter future
GC Looking to a brighter futureDavid A.A. Ross
 
Youth and agriculture
Youth and agricultureYouth and agriculture
Youth and agricultureDhananjaya Bn
 
Thriving in Turbulent Times: Maximizing Your Success in the New Social Enviro...
Thriving in Turbulent Times: Maximizing Your Success in the New Social Enviro...Thriving in Turbulent Times: Maximizing Your Success in the New Social Enviro...
Thriving in Turbulent Times: Maximizing Your Success in the New Social Enviro...Wellesley Institute
 
Havering Voluntary Sector Conference - State of the Sector Survey 2013
Havering Voluntary Sector Conference - State of the Sector Survey 2013Havering Voluntary Sector Conference - State of the Sector Survey 2013
Havering Voluntary Sector Conference - State of the Sector Survey 2013Havco Havering
 
Presentation For Baptist U Pr Summit 2009
Presentation For Baptist U Pr Summit 2009Presentation For Baptist U Pr Summit 2009
Presentation For Baptist U Pr Summit 2009Anita Ho
 
Weeks address at Global Women's Summit, 16 November 2001
Weeks address at Global Women's Summit, 16 November 2001Weeks address at Global Women's Summit, 16 November 2001
Weeks address at Global Women's Summit, 16 November 2001Womenable
 
2005 Summer Newsletter
2005 Summer Newsletter2005 Summer Newsletter
2005 Summer NewsletterDirect Relief
 
2005 Summer Newsletter
2005 Summer Newsletter2005 Summer Newsletter
2005 Summer NewsletterDirect Relief
 

Semelhante a Nonprofit Finance Fund 2012 State of the Nonprofit Sector Survey (20)

Pva analysis final 120412
Pva analysis final 120412Pva analysis final 120412
Pva analysis final 120412
 
2011 benchmarkingrprt
2011 benchmarkingrprt2011 benchmarkingrprt
2011 benchmarkingrprt
 
Charity Survey 2012 Result
Charity Survey 2012 ResultCharity Survey 2012 Result
Charity Survey 2012 Result
 
Vantage point-july-2011
Vantage point-july-2011Vantage point-july-2011
Vantage point-july-2011
 
MCI\'s Association Masterclass White Paper 2009
MCI\'s Association Masterclass White Paper 2009MCI\'s Association Masterclass White Paper 2009
MCI\'s Association Masterclass White Paper 2009
 
Nyu presentation 3 1-13 - final
Nyu presentation 3 1-13 - finalNyu presentation 3 1-13 - final
Nyu presentation 3 1-13 - final
 
GWI East Africa - Research
GWI East Africa - ResearchGWI East Africa - Research
GWI East Africa - Research
 
Impact matters - Serious Social Investing 2013
Impact matters - Serious Social Investing 2013Impact matters - Serious Social Investing 2013
Impact matters - Serious Social Investing 2013
 
MACE Compensation & Benefits Results - Iowa
MACE Compensation & Benefits Results - IowaMACE Compensation & Benefits Results - Iowa
MACE Compensation & Benefits Results - Iowa
 
MFI Presentation
MFI  PresentationMFI  Presentation
MFI Presentation
 
GC Looking to a brighter future
GC Looking to a brighter futureGC Looking to a brighter future
GC Looking to a brighter future
 
2023 state of the sector survey
2023 state of the sector survey2023 state of the sector survey
2023 state of the sector survey
 
Youth and agriculture
Youth and agricultureYouth and agriculture
Youth and agriculture
 
Thriving in Turbulent Times: Maximizing Your Success in the New Social Enviro...
Thriving in Turbulent Times: Maximizing Your Success in the New Social Enviro...Thriving in Turbulent Times: Maximizing Your Success in the New Social Enviro...
Thriving in Turbulent Times: Maximizing Your Success in the New Social Enviro...
 
Havering Voluntary Sector Conference - State of the Sector Survey 2013
Havering Voluntary Sector Conference - State of the Sector Survey 2013Havering Voluntary Sector Conference - State of the Sector Survey 2013
Havering Voluntary Sector Conference - State of the Sector Survey 2013
 
Presentation For Baptist U Pr Summit 2009
Presentation For Baptist U Pr Summit 2009Presentation For Baptist U Pr Summit 2009
Presentation For Baptist U Pr Summit 2009
 
Diversify Your Portfolio
Diversify Your PortfolioDiversify Your Portfolio
Diversify Your Portfolio
 
Weeks address at Global Women's Summit, 16 November 2001
Weeks address at Global Women's Summit, 16 November 2001Weeks address at Global Women's Summit, 16 November 2001
Weeks address at Global Women's Summit, 16 November 2001
 
2005 Summer Newsletter
2005 Summer Newsletter2005 Summer Newsletter
2005 Summer Newsletter
 
2005 Summer Newsletter
2005 Summer Newsletter2005 Summer Newsletter
2005 Summer Newsletter
 

Mais de Nonprofit Finance Fund

Nonprofit Finance Fund Self Assessment Worksheet
Nonprofit Finance Fund Self Assessment WorksheetNonprofit Finance Fund Self Assessment Worksheet
Nonprofit Finance Fund Self Assessment WorksheetNonprofit Finance Fund
 
Pay for success investing in what works pre-convening session-final
Pay for success   investing in what works pre-convening session-finalPay for success   investing in what works pre-convening session-final
Pay for success investing in what works pre-convening session-finalNonprofit Finance Fund
 
Pay for Success Projects and Social Impact Bonds: Structuring Considerations ...
Pay for Success Projects and Social Impact Bonds: Structuring Considerations ...Pay for Success Projects and Social Impact Bonds: Structuring Considerations ...
Pay for Success Projects and Social Impact Bonds: Structuring Considerations ...Nonprofit Finance Fund
 
Why Do Balance Sheets Matter? Rodney Christopher
Why Do Balance Sheets Matter? Rodney ChristopherWhy Do Balance Sheets Matter? Rodney Christopher
Why Do Balance Sheets Matter? Rodney ChristopherNonprofit Finance Fund
 
2011 Nonprofit Sector Survey Methodology
2011 Nonprofit Sector Survey Methodology2011 Nonprofit Sector Survey Methodology
2011 Nonprofit Sector Survey MethodologyNonprofit Finance Fund
 
On The Boards: Sustaining a Vibrant Seattle Arts Institutio
On The Boards: Sustaining a Vibrant Seattle Arts InstitutioOn The Boards: Sustaining a Vibrant Seattle Arts Institutio
On The Boards: Sustaining a Vibrant Seattle Arts InstitutioNonprofit Finance Fund
 
Telling Your School’s Story through Your Financial Statements: A Lender’s Poi...
Telling Your School’s Story through Your Financial Statements: A Lender’s Poi...Telling Your School’s Story through Your Financial Statements: A Lender’s Poi...
Telling Your School’s Story through Your Financial Statements: A Lender’s Poi...Nonprofit Finance Fund
 
hopeFound: Finding the Way Through Data, Discipline & Dialogue (case study)
hopeFound: Finding the Way Through Data, Discipline & Dialogue (case study)hopeFound: Finding the Way Through Data, Discipline & Dialogue (case study)
hopeFound: Finding the Way Through Data, Discipline & Dialogue (case study)Nonprofit Finance Fund
 

Mais de Nonprofit Finance Fund (20)

Nonprofit Finance Fund Self Assessment Worksheet
Nonprofit Finance Fund Self Assessment WorksheetNonprofit Finance Fund Self Assessment Worksheet
Nonprofit Finance Fund Self Assessment Worksheet
 
Pay for success investing in what works pre-convening session-final
Pay for success   investing in what works pre-convening session-finalPay for success   investing in what works pre-convening session-final
Pay for success investing in what works pre-convening session-final
 
Case for Capital Accounting
Case for Capital AccountingCase for Capital Accounting
Case for Capital Accounting
 
Case for Change Capital
Case for Change CapitalCase for Change Capital
Case for Change Capital
 
Change Capital
Change CapitalChange Capital
Change Capital
 
Working Capital
Working CapitalWorking Capital
Working Capital
 
Risk and Opportunity Capital
Risk and Opportunity CapitalRisk and Opportunity Capital
Risk and Opportunity Capital
 
Facilities and equipment capital
Facilities and equipment capitalFacilities and equipment capital
Facilities and equipment capital
 
Endowments
EndowmentsEndowments
Endowments
 
Recovery Capital
Recovery CapitalRecovery Capital
Recovery Capital
 
Financial Reporting Done Right
Financial Reporting Done RightFinancial Reporting Done Right
Financial Reporting Done Right
 
Case for Capitalization in the Arts
Case for Capitalization in the ArtsCase for Capitalization in the Arts
Case for Capitalization in the Arts
 
Pay for Success Projects and Social Impact Bonds: Structuring Considerations ...
Pay for Success Projects and Social Impact Bonds: Structuring Considerations ...Pay for Success Projects and Social Impact Bonds: Structuring Considerations ...
Pay for Success Projects and Social Impact Bonds: Structuring Considerations ...
 
Why Do Balance Sheets Matter? Rodney Christopher
Why Do Balance Sheets Matter? Rodney ChristopherWhy Do Balance Sheets Matter? Rodney Christopher
Why Do Balance Sheets Matter? Rodney Christopher
 
2011 Nonprofit Sector Survey Methodology
2011 Nonprofit Sector Survey Methodology2011 Nonprofit Sector Survey Methodology
2011 Nonprofit Sector Survey Methodology
 
On The Boards: Sustaining a Vibrant Seattle Arts Institutio
On The Boards: Sustaining a Vibrant Seattle Arts InstitutioOn The Boards: Sustaining a Vibrant Seattle Arts Institutio
On The Boards: Sustaining a Vibrant Seattle Arts Institutio
 
Saving Money while Getting Greener
Saving Money while Getting GreenerSaving Money while Getting Greener
Saving Money while Getting Greener
 
Telling Your School’s Story through Your Financial Statements: A Lender’s Poi...
Telling Your School’s Story through Your Financial Statements: A Lender’s Poi...Telling Your School’s Story through Your Financial Statements: A Lender’s Poi...
Telling Your School’s Story through Your Financial Statements: A Lender’s Poi...
 
hopeFound: Finding the Way Through Data, Discipline & Dialogue (case study)
hopeFound: Finding the Way Through Data, Discipline & Dialogue (case study)hopeFound: Finding the Way Through Data, Discipline & Dialogue (case study)
hopeFound: Finding the Way Through Data, Discipline & Dialogue (case study)
 
2011survey brochure
2011survey brochure2011survey brochure
2011survey brochure
 

Último

Call Girls Service Nagpur Maya Call 7001035870 Meet With Nagpur Escorts
Call Girls Service Nagpur Maya Call 7001035870 Meet With Nagpur EscortsCall Girls Service Nagpur Maya Call 7001035870 Meet With Nagpur Escorts
Call Girls Service Nagpur Maya Call 7001035870 Meet With Nagpur Escortsranjana rawat
 
The Economic History of the U.S. Lecture 23.pdf
The Economic History of the U.S. Lecture 23.pdfThe Economic History of the U.S. Lecture 23.pdf
The Economic History of the U.S. Lecture 23.pdfGale Pooley
 
Solution Manual for Financial Accounting, 11th Edition by Robert Libby, Patri...
Solution Manual for Financial Accounting, 11th Edition by Robert Libby, Patri...Solution Manual for Financial Accounting, 11th Edition by Robert Libby, Patri...
Solution Manual for Financial Accounting, 11th Edition by Robert Libby, Patri...ssifa0344
 
The Economic History of the U.S. Lecture 19.pdf
The Economic History of the U.S. Lecture 19.pdfThe Economic History of the U.S. Lecture 19.pdf
The Economic History of the U.S. Lecture 19.pdfGale Pooley
 
Call Girls Koregaon Park Call Me 7737669865 Budget Friendly No Advance Booking
Call Girls Koregaon Park Call Me 7737669865 Budget Friendly No Advance BookingCall Girls Koregaon Park Call Me 7737669865 Budget Friendly No Advance Booking
Call Girls Koregaon Park Call Me 7737669865 Budget Friendly No Advance Bookingroncy bisnoi
 
High Class Call Girls Nagpur Grishma Call 7001035870 Meet With Nagpur Escorts
High Class Call Girls Nagpur Grishma Call 7001035870 Meet With Nagpur EscortsHigh Class Call Girls Nagpur Grishma Call 7001035870 Meet With Nagpur Escorts
High Class Call Girls Nagpur Grishma Call 7001035870 Meet With Nagpur Escortsranjana rawat
 
Booking open Available Pune Call Girls Shivane 6297143586 Call Hot Indian Gi...
Booking open Available Pune Call Girls Shivane  6297143586 Call Hot Indian Gi...Booking open Available Pune Call Girls Shivane  6297143586 Call Hot Indian Gi...
Booking open Available Pune Call Girls Shivane 6297143586 Call Hot Indian Gi...Call Girls in Nagpur High Profile
 
The Economic History of the U.S. Lecture 21.pdf
The Economic History of the U.S. Lecture 21.pdfThe Economic History of the U.S. Lecture 21.pdf
The Economic History of the U.S. Lecture 21.pdfGale Pooley
 
03_Emmanuel Ndiaye_Degroof Petercam.pptx
03_Emmanuel Ndiaye_Degroof Petercam.pptx03_Emmanuel Ndiaye_Degroof Petercam.pptx
03_Emmanuel Ndiaye_Degroof Petercam.pptxFinTech Belgium
 
The Economic History of the U.S. Lecture 26.pdf
The Economic History of the U.S. Lecture 26.pdfThe Economic History of the U.S. Lecture 26.pdf
The Economic History of the U.S. Lecture 26.pdfGale Pooley
 
VVIP Pune Call Girls Katraj (7001035870) Pune Escorts Nearby with Complete Sa...
VVIP Pune Call Girls Katraj (7001035870) Pune Escorts Nearby with Complete Sa...VVIP Pune Call Girls Katraj (7001035870) Pune Escorts Nearby with Complete Sa...
VVIP Pune Call Girls Katraj (7001035870) Pune Escorts Nearby with Complete Sa...Call Girls in Nagpur High Profile
 
Stock Market Brief Deck (Under Pressure).pdf
Stock Market Brief Deck (Under Pressure).pdfStock Market Brief Deck (Under Pressure).pdf
Stock Market Brief Deck (Under Pressure).pdfMichael Silva
 
20240429 Calibre April 2024 Investor Presentation.pdf
20240429 Calibre April 2024 Investor Presentation.pdf20240429 Calibre April 2024 Investor Presentation.pdf
20240429 Calibre April 2024 Investor Presentation.pdfAdnet Communications
 
The Economic History of the U.S. Lecture 17.pdf
The Economic History of the U.S. Lecture 17.pdfThe Economic History of the U.S. Lecture 17.pdf
The Economic History of the U.S. Lecture 17.pdfGale Pooley
 
Call US 📞 9892124323 ✅ Kurla Call Girls In Kurla ( Mumbai ) secure service
Call US 📞 9892124323 ✅ Kurla Call Girls In Kurla ( Mumbai ) secure serviceCall US 📞 9892124323 ✅ Kurla Call Girls In Kurla ( Mumbai ) secure service
Call US 📞 9892124323 ✅ Kurla Call Girls In Kurla ( Mumbai ) secure servicePooja Nehwal
 
Independent Call Girl Number in Kurla Mumbai📲 Pooja Nehwal 9892124323 💞 Full ...
Independent Call Girl Number in Kurla Mumbai📲 Pooja Nehwal 9892124323 💞 Full ...Independent Call Girl Number in Kurla Mumbai📲 Pooja Nehwal 9892124323 💞 Full ...
Independent Call Girl Number in Kurla Mumbai📲 Pooja Nehwal 9892124323 💞 Full ...Pooja Nehwal
 
CALL ON ➥8923113531 🔝Call Girls Gomti Nagar Lucknow best sexual service
CALL ON ➥8923113531 🔝Call Girls Gomti Nagar Lucknow best sexual serviceCALL ON ➥8923113531 🔝Call Girls Gomti Nagar Lucknow best sexual service
CALL ON ➥8923113531 🔝Call Girls Gomti Nagar Lucknow best sexual serviceanilsa9823
 
The Economic History of the U.S. Lecture 25.pdf
The Economic History of the U.S. Lecture 25.pdfThe Economic History of the U.S. Lecture 25.pdf
The Economic History of the U.S. Lecture 25.pdfGale Pooley
 
Instant Issue Debit Cards - School Designs
Instant Issue Debit Cards - School DesignsInstant Issue Debit Cards - School Designs
Instant Issue Debit Cards - School Designsegoetzinger
 

Último (20)

Call Girls Service Nagpur Maya Call 7001035870 Meet With Nagpur Escorts
Call Girls Service Nagpur Maya Call 7001035870 Meet With Nagpur EscortsCall Girls Service Nagpur Maya Call 7001035870 Meet With Nagpur Escorts
Call Girls Service Nagpur Maya Call 7001035870 Meet With Nagpur Escorts
 
(INDIRA) Call Girl Mumbai Call Now 8250077686 Mumbai Escorts 24x7
(INDIRA) Call Girl Mumbai Call Now 8250077686 Mumbai Escorts 24x7(INDIRA) Call Girl Mumbai Call Now 8250077686 Mumbai Escorts 24x7
(INDIRA) Call Girl Mumbai Call Now 8250077686 Mumbai Escorts 24x7
 
The Economic History of the U.S. Lecture 23.pdf
The Economic History of the U.S. Lecture 23.pdfThe Economic History of the U.S. Lecture 23.pdf
The Economic History of the U.S. Lecture 23.pdf
 
Solution Manual for Financial Accounting, 11th Edition by Robert Libby, Patri...
Solution Manual for Financial Accounting, 11th Edition by Robert Libby, Patri...Solution Manual for Financial Accounting, 11th Edition by Robert Libby, Patri...
Solution Manual for Financial Accounting, 11th Edition by Robert Libby, Patri...
 
The Economic History of the U.S. Lecture 19.pdf
The Economic History of the U.S. Lecture 19.pdfThe Economic History of the U.S. Lecture 19.pdf
The Economic History of the U.S. Lecture 19.pdf
 
Call Girls Koregaon Park Call Me 7737669865 Budget Friendly No Advance Booking
Call Girls Koregaon Park Call Me 7737669865 Budget Friendly No Advance BookingCall Girls Koregaon Park Call Me 7737669865 Budget Friendly No Advance Booking
Call Girls Koregaon Park Call Me 7737669865 Budget Friendly No Advance Booking
 
High Class Call Girls Nagpur Grishma Call 7001035870 Meet With Nagpur Escorts
High Class Call Girls Nagpur Grishma Call 7001035870 Meet With Nagpur EscortsHigh Class Call Girls Nagpur Grishma Call 7001035870 Meet With Nagpur Escorts
High Class Call Girls Nagpur Grishma Call 7001035870 Meet With Nagpur Escorts
 
Booking open Available Pune Call Girls Shivane 6297143586 Call Hot Indian Gi...
Booking open Available Pune Call Girls Shivane  6297143586 Call Hot Indian Gi...Booking open Available Pune Call Girls Shivane  6297143586 Call Hot Indian Gi...
Booking open Available Pune Call Girls Shivane 6297143586 Call Hot Indian Gi...
 
The Economic History of the U.S. Lecture 21.pdf
The Economic History of the U.S. Lecture 21.pdfThe Economic History of the U.S. Lecture 21.pdf
The Economic History of the U.S. Lecture 21.pdf
 
03_Emmanuel Ndiaye_Degroof Petercam.pptx
03_Emmanuel Ndiaye_Degroof Petercam.pptx03_Emmanuel Ndiaye_Degroof Petercam.pptx
03_Emmanuel Ndiaye_Degroof Petercam.pptx
 
The Economic History of the U.S. Lecture 26.pdf
The Economic History of the U.S. Lecture 26.pdfThe Economic History of the U.S. Lecture 26.pdf
The Economic History of the U.S. Lecture 26.pdf
 
VVIP Pune Call Girls Katraj (7001035870) Pune Escorts Nearby with Complete Sa...
VVIP Pune Call Girls Katraj (7001035870) Pune Escorts Nearby with Complete Sa...VVIP Pune Call Girls Katraj (7001035870) Pune Escorts Nearby with Complete Sa...
VVIP Pune Call Girls Katraj (7001035870) Pune Escorts Nearby with Complete Sa...
 
Stock Market Brief Deck (Under Pressure).pdf
Stock Market Brief Deck (Under Pressure).pdfStock Market Brief Deck (Under Pressure).pdf
Stock Market Brief Deck (Under Pressure).pdf
 
20240429 Calibre April 2024 Investor Presentation.pdf
20240429 Calibre April 2024 Investor Presentation.pdf20240429 Calibre April 2024 Investor Presentation.pdf
20240429 Calibre April 2024 Investor Presentation.pdf
 
The Economic History of the U.S. Lecture 17.pdf
The Economic History of the U.S. Lecture 17.pdfThe Economic History of the U.S. Lecture 17.pdf
The Economic History of the U.S. Lecture 17.pdf
 
Call US 📞 9892124323 ✅ Kurla Call Girls In Kurla ( Mumbai ) secure service
Call US 📞 9892124323 ✅ Kurla Call Girls In Kurla ( Mumbai ) secure serviceCall US 📞 9892124323 ✅ Kurla Call Girls In Kurla ( Mumbai ) secure service
Call US 📞 9892124323 ✅ Kurla Call Girls In Kurla ( Mumbai ) secure service
 
Independent Call Girl Number in Kurla Mumbai📲 Pooja Nehwal 9892124323 💞 Full ...
Independent Call Girl Number in Kurla Mumbai📲 Pooja Nehwal 9892124323 💞 Full ...Independent Call Girl Number in Kurla Mumbai📲 Pooja Nehwal 9892124323 💞 Full ...
Independent Call Girl Number in Kurla Mumbai📲 Pooja Nehwal 9892124323 💞 Full ...
 
CALL ON ➥8923113531 🔝Call Girls Gomti Nagar Lucknow best sexual service
CALL ON ➥8923113531 🔝Call Girls Gomti Nagar Lucknow best sexual serviceCALL ON ➥8923113531 🔝Call Girls Gomti Nagar Lucknow best sexual service
CALL ON ➥8923113531 🔝Call Girls Gomti Nagar Lucknow best sexual service
 
The Economic History of the U.S. Lecture 25.pdf
The Economic History of the U.S. Lecture 25.pdfThe Economic History of the U.S. Lecture 25.pdf
The Economic History of the U.S. Lecture 25.pdf
 
Instant Issue Debit Cards - School Designs
Instant Issue Debit Cards - School DesignsInstant Issue Debit Cards - School Designs
Instant Issue Debit Cards - School Designs
 

Nonprofit Finance Fund 2012 State of the Nonprofit Sector Survey

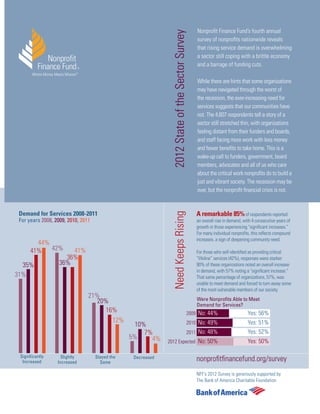
  • 1. Nonprofit Finance Fund’s fourth annual 2012 State of the Sector Survey survey of nonprofits nationwide reveals that rising service demand is overwhelming a sector still coping with a brittle economy ® and a barrage of funding cuts. ® While there are hints that some organizations may have navigated through the worst of the recession, the ever-increasing need for services suggests that our communities have not. The 4,607 respondents tell a story of a sector still stretched thin, with organizations feeling distant from their funders and boards, and staff facing more work with less money and fewer benefits to take home. This is a wake-up call to funders, government, board members, advocates and all of us who care about the critical work nonprofits do to build a just and vibrant society. The recession may be over, but the nonprofit financial crisis is not. Demand for Services 2008-2011 A remarkable 85% of respondents reported Need Keeps Rising For years 2008, 2009, 2010, 2011 an overall rise in demand, with 4 consecutive years of growth in those experiencing "significant increases." For many individual nonprofits, this reflects compound increases, a sign of deepening community need. 44% 41% 42% 41% For those who self-identified as providing critical 36% “lifeline” services (42%), responses were starker: 35% 36% 90% of these organizations noted an overall increase in demand, with 57% noting a "significant increase." 31% That same percentage of organizations, 57%, was unable to meet demand and forced to turn away some of the most vulnerable members of our society. 21% Were Nonprofits Able to Meet 20% Demand for Services? 16% 2009 No: 44% Yes: 56% 12% 2010 No: 49% Yes: 51% 10% 7% 2011 No: 48% Yes: 52% 5% 4% 2012 Expected No: 50% Yes: 50% Significantly Increased Slightly Increased Stayed the Same Decreased nonprofitfinancefund.org/survey NFF's 2012 Survey is generously supported by The Bank of America Charitable Foundation
  • 2. About the 4,607 Government Support Is Not Reliable Respondents 1,927 respondents received funding or contracts from the Over 60% of those experiencing any government delays We more than doubled the federal government. Among these organizations, 50% used reserves to make it through. For some, bridging response rate from last experienced payment delays. Of the 2,395 organizations the gap caused by payment delays also meant service year, as more organizations receiving state or local contracts, the situation was even cutbacks, staff cuts, lost interest income, and loans that chose to add their stories worse, with 60% experiencing delays. could have been avoided. to the collective voice of 1 the nonprofit community. Receive Federal Does It Pay for the When Do You Receive Federal The distribution across Full Cost of Services? Funding or Contracts? Federal Payment? sectors remained similar to previous years. Human Ahead of schedule 2% Services organizations, Yes No On schedule 48% the keystone of our 45% No 79% 1-30 days late 21% 55% Yes 31-90 days late 22% social safety net, 21% were particularly well- > 90 days late 7% represented. Receive State/Local Does It Pay for the When Do You Receive State/Local By Sector Contracts? Full Cost of Services? State/Local Payment? Human Services Ahead of schedule 1% 38% No On schedule 39% Yes No 75% 1-30 days late 23% 57% 43% Yes 31-90 days late 27% 25% > 90 days late 10% Arts, Culture, Humanities • From 2007 to 2010, the number of 18% Why We Need Government Funding Americans living below the poverty line increased from 44.4 million to 47.3 Education Across the country, state budget deficits and a trend in dis-investment 5 2 million. 15% in social services on the state level continue to shred the safety net. • Without government assistance, the After the recession began, the federal government stepped in to help, Public/Societal Benefit poverty rate would have been almost through programs such as Temporary Assistance for Needy Families 15% 3 twice as high in 2010: that's 40 million (TANF) and the American Recovery and Reinvestment Act. 6 Health: 7% more people. Environment/Animals: 3% Many of these temporary programs are set to expire soon or have already • 1 in 45 children in the US was 4 7 Other: 3%* expired. Without them, we face an even more dire future: an ever- homeless in 2010. *Other includes Mutual/ widening income gap, and rising poverty, hunger, and homelessness. • The Supplemental Nutrition Assistance Membership Benefit (1%), Program (SNAP) lifted 2 million children International, Foreign Affairs 8 out of poverty in 2010. (1%), Miscellaneous (1%) By Annual Expense Are Boards Rising to the Challenge? The right amount Not enough Not at all N/A $0-50K: 6% $50-100K: 4% We asked a series of new questions this year Makes donations Our Board... $100K-250K: 10% exploring the role boards play in the financial and organizational health of nonprofits. How do 34% 54% 8% 4% $250K-500K: 13% boards help noprofits deliver on mission? And Leverages relationships to directly solicit funds what could they do better? 24% 62% 11% 3% While more than half of respondents Contributes to fundraising (introductions, referrals) $500K-2M: 32% believed their boards knew enough about the 34% 56% 7% 3% organization’s finances, over 60% felt that Understands/uses financial data to help us make decisions they could not depend enough on their boards for financial support, whether through direct 67% 28% 3%2% $2M-5M: 16% contributions or help with fundraising. Understands/can explain our revenue model 58% 37% 4%2% $5M-10M: 8% Can represent our financial state in external conversations $10M-20M: 6% $20M+: 5% 51% 41% 5%2%
  • 3. Organizations Show Signs of Coping How Many Months of Cash Do Nonprofits Have on Hand? There are small signs of greater financial stability this year, For years 2009, 2010, 2011, 2012 surprising in light of the seemingly ubiquitous funding cuts. Overall, respondents had slightly more months of cash on hand to cover expenses. As in 2010, 44% of organizations had surpluses 32% 32% at the close of the fiscal year and, in a slight increase over last 31% 31% year, 25% of organizations broke even. Could these be signs that nonprofits are recovering, or are they merging with stronger organizations in their communities? Or 21% 22% have nonprofits gone out of business, leaving their clients to find 19%19% 20%19% 21% 19% services elsewhere? In part, this might explain continuing upward 18%18% 17% 16% surges in demand for the organizations still standing. 14% 12% Deficit Surplus Break-Even 10% 9% 2008 32% 40% 28% 2009 36% 35% 29% 2010 34% 44% 22% 2011 31% 44% 25% None 1 month 2-3 months 4-6 months > 6 months "The greatest challenge continues to be meeting... "Our greatest challenge is creating programs Delays and Demand Living Within Our Means demand for services with shrinking resources and the that add to the cash-flow of the organization. on-going uncertainty that exists for the sector... The It is difficult to compete for grants that allow exceedingly late payments by government have added little support (up to 10%) for operations with additional strain on an already spread too thin budget a reduced staff. All staff members have cash flow. Year after year of cuts with year after year of accepted extra duties with reduced pay in growing demand have created not only a 'new normal' 2012 to allow us to live within our means..." but also quite a bit of fatigue and strain on morale." Human Services NPO, GA Public/Societal Benefit NPO, NY Reserves Still Hard to Discuss Nonprofits continue to feel they cannot start conversations about many financial issues with their funders. Like last year, organizations felt that funders were most willing to talk about program expansion (54%), while very few believed their funders were open to discussions on facility reserves (12%) or operating reserves (21%). Given that a significant percentage of organizations used reserves to fill the gap in government payment delays, it’s more critical than ever that we help organizations build their own financial safety net. My Nonprofit Can Have an Open Dialogue with Funders About... Facility Reserves 12% Cash Flow 20% Operating Reserves 21% Program Expansion 54% Debt Burden 6% Working Capital No Open Dialogue 22% Facility Needs 31% Needs 23%
  • 4. Nonprofits React to Change Actions Taken 2011 Actions Planned 2012 Management strategies nonprofits used this year were generally in line with last year. There were a few variations Added/expanded programs or services Service-Related Actions 55% that could suggest signs of financial improvement: 58% • 50% of respondents hired staff for new positions this year, Reduced/cut programs or services compared to 44% last year. 20% 12% • The number of respondents that reduced or eliminated Expanded geographies served programs decreased, from 26% last year to 20% this year. 20% 28% • Fewer organizations tapped into reserve funds: 27%, down Reduced/significantly restructured geographies from 34% last year. 3% 3% Collaborated with another NPO to provide programs Respondents who partnered with another organization to 49% improve or increase services declined from 47% to 38%. With 56% service demand continuing to rise, are there ways that we Increased number of people served 52% can better support collaboration in the sector? 63% Decreased number of people served 6% 41% of respondents engaged closely with their board this 4% year, down from 51% last year. This may be another sign that Increased amount of service per client nonprofits feel their boards are not sufficiently supporting 18% 22% them through financial hardship. Or it may suggest that fewer Decreased amount of service per client organizations rely on boards to achieve their goals. 5% 3% Partnered with another NPO to improve/increase services 38% 48% "[Our greatest challenge is] finding quality Personnel Challenges Hired staff for new positions Management-Related Actions 50% staff to work with our clients, given we have 40% Cut staff reduced our staff benefits... Doing more 23% 10% with less, we have cut our clerical support Made replacement hires 46% staff, have no development department and 35% Froze all replacement hires 6% outsource some of our grant writing, but 3% the administrative staff have been wearing Retained existing personnel 39% 45% many different hats since 2009." Gave raises 42% Human Services NPO, CA 40% Froze/reduced salaries 21% 13% Improved/increased staff benefits 12% Human Services NPOs See Staff Changes 13% Reduced staff benefits Human Services organizations, representing the largest 11% 6% portion of respondents, may be experiencing more staffing Relied more on volunteers changes than other sectors. Staff volatility was greater and 38% 44% accompanied by slightly higher benefit and salary freezes Cut staff hours (short weeks, furloughs) or reductions. Interestingly, despite these staff fluctuations, 10% their finances were comparable to non-Human Services 5% Engaged more closely with board organizations. 41% 43% Actions Taken 2011 Human Non-Human Collaborated to reduce administrative costs 17% Services Services 24% Reduced staff 29% 20% Merged with another NPO 2% Made replacement hires 52% 42% 3% Froze/reduced salaries 24% 19% Added to reserves 23% Reduced staff benefits 15% 9% 34% Relied more on volunteers 42% 35% Used reserves 27% 18%
  • 5. An Optimistic Sector Most Recent Year Organizations Felt Financially Stable In addition to gathering quantitative data about financial health and service Pre-2007 7% demand, we also ask questions that capture the perceptions and outlooks Financial State of nonprofit respondents. Every year, qualitative data suggests that people 2007 7% of the 47% have an innate optimism and dedication to mission that moves these 2008 10% Deficit organizations forward despite the financial hurdles in their way. 12% 2009 11% But in some cases, their optimism may be writing checks their balance sheets can’t cash. 47%, or 1,654 organizations, reported that the most 2010 13% recent year they felt financially stable was 2011. While this subset of respondents did in fact have higher percentages of surplus (63% vs. 44% Surplus for overall respondents), 12% of them actually reported a 2011 deficit. 63% Among this 12% with deficits, 34% had a 2011 deficit that was greater 2011 47% than 5% of their annual expense. In part, this discrepancy between actual financial condition and perception of financial health may be due to the spirit of resilience so Break- common in the sector. It may also be that our perception of health is Even relative to what it has been in the past, suggesting that some nonprofits 25% feel lucky to even be in business. 2012 5% "We have ambitious revenue targets as we seek to "[Our biggest challenge is] making up for Filling the Funding Gap Challenged but Resilient increase our operating revenue and plug our... deficit. reduction in federal funding. We have been This requires increasing donations and ticket sales informed that we are not eligible to apply for a as the economy continues to stagnate. Additionally, couple of grants that we have previously been our endowment has not yet recovered from the stock funded with for the provision of prevention market crash of 2008. Because we base our 5% draw services. In response, we plan to seek alternative on a 3-year rolling average, the "down" years are still funding through private sources as well as impacting the available balance we can draw on..." consider other government opportunities..." Arts, Culture, Humanities NPO, MO Human Services, TX Endnotes 1. While there were 4,607 total respondents overall, the number of respondents <http://www.cbpp.org/cms/?fa=view&id=3610>. varied for each question. Percentages for each data point are based on these 4. Ibid. varying totals. See survey.nonprofitfinancefund.org for respondents per question. 5. Ibid. 2. Oliff, Phil. "Long and Uncertain Recovery for State Budgets." Off the Charts 6. Sherman, Arloc. "Taking Stock of the Safety Net, Part 1: Overview." Off the Blog. Center on Budget and Policy Priorities, 9 Jan. 2012. Web. 15 Mar. 2012. Charts Blog. Center on Budget and Policy Priorities, 14 Dec. 2011. Web. 15 Mar. <http://www.offthechartsblog.org/long-and-uncertain-recovery-for-state- 2012. <http://www.offthechartsblog.org/taking-stock-of-the-safety-net-part-1- budgets/>. overview/>. Gais, Thomas L. "Financing the Safety Net: Before, During, and After the Great 7. Bassuk, MD, Ellen L. et al. State Report Card on Child Homelessness: Recession." Proc. of 2011 Annual Workshop of the National Association for America's Youngest Outcasts 2010. The National Center on Family Welfare Research and Statistics, Vail, Colorado. Nelson A. Rockefeller Institute Homelessness, Dec. 2011. Web. 15 Mar. 2012. <http://www. of Government. 13 Sept. 2011. Web. 15 Mar. 2012. <http://www.rockinst.org/ homelesschildrenamerica.org/media/NCFH_AmericaOutcast2010_web.pdf>. pdf/workforce_welfare_and_social_services/2011-09-13-Gais_NAWRS.pdf>. 8. Dean, Stacy. "Taking Stock of the Safety Net, Part 4: Helping Families Afford 3. Sherman, Arloc. "Poverty and Financial Distress Would Have Been an Adequate Diet." Off the Charts Blog. Center on Budget and Policy Priorities, Substantially Worse in 2010 Without Government Action, New Census Data 19 Dec. 2011. Web. 15 Mar. 2012. <http://www.offthechartsblog.org/taking- Show." Center on Budget and Policy Priorities. 7 Nov. 2011. Web. 15 Mar. 2012. stock-of-the-safety-net-part-4-helping-families-afford-an-adequate-diet/>.
  • 6. New! Filter the Data Yourself Online About Us Visit nonprofitfinancefund.org/survey to learn As a nonprofit 501(c)(3), NFF pushes for improvement in how money is more about the 2012 State of the Sector Survey given and used in the sector. Since 1980, we’ve worked to connect money and to see results from previous years. We’ve also to mission effectively so that nonprofits can keep doing what they do so created an interactive database of 2012 data that well. We provide financing, consulting, and advocacy services to nonprofits you can explore yourself. You can filter results by and funders nationwide. Our services help great organizations stay in geographic areas, sub-sectors, or expenses. We hope you’ll share your balance, so that they’re able to successfully adapt to changing financial thoughts with the community by posting your results on Facebook or circumstances and grow and innovate when they’re ready. Twitter. Questions? Email us at research@nffusa.org. In addition to providing millions of dollars in loans and lines of credit, we organize financial training workshops, perform business analyses, and Thank You offer customized consulting services. For funders, we provide support with structuring of philanthropic capital and program-related investments, Our fourth annual survey was our largest yet. We are grateful to all of the manage capital for guided investment in programs, and provide advice and participants, who spent an average of fourteen minutes each on the survey research to help maximize the impact of grants. and took the time to share some of their innovations and stories this year. This, on its own, is an enormous voluntary contribution to improving our nonprofitfinancefund.org understanding of the trends affecting the sector. nonprofitfinancefund.org/survey survey.nonprofitfinancefund.org We couldn’t have marshalled this enormous undertaking without the twitter.com/nff_news considerable help of our friends, colleagues, and partners, and also want to facebook.com/nonprofitfinancefund thank the many who helped spread the word about the survey. "Families pay fees that cover approximately 25% of “The need for health care services for the Making Ends Meet Stretching Resources our costs, and we must find other sources of income uninsured is growing faster than we can to cover the balance... The economy has affected help people. There are so many people in both the ability of the families to pay their portion and our area looking for health care that we the ability of our donors to support us at the same will never be able to meet the entire need. or higher level than in the past. We merged with Through the use of volunteers we have been another (smaller) organization in 2010/11, and we are able to increase the numbers of patients we working to retain or re-engage their donors..." treat and decrease our cost per patient.” Education NPO, IL Health NPO, VA National Headquarters San Francisco New Jersey Detroit 70 West 36th St., 11th Floor 28 Second St., Suite 600 59 Lincoln Park, Suite 350 645 Griswold St., Suite 2202 New York, NY 10018 San Francisco, CA 94105 Newark, NJ 07102 Detroit, MI 48226 212 868 6710 415 255 4849 973 642 2500 313 965 9145 NY@nffusa.org SF@nffusa.org NJ@nffusa.org Detroit@nffusa.org New England Los Angeles Greater Philadelphia 89 South St., Suite 402 626 Wilshire Blvd., Suite 510 1528 Walnut St., Suite 310 Boston, MA 02111 Los Angeles, CA 90017 Philadelphia, PA 19102 617 204 9772 213 623 7001 215 546 9426 NE@nffusa.org LA@nffusa.org Philadelphia@nffusa.org Nonprofit Finance Fund is a nonprofit 501(c)(3) Community Development Financial Institution (CDFI) © 2012, Nonprofit Finance Fund®