Mineral Industry Statistics
•
0 gostou•378 visualizações

Mineral Industry Statistics MGB Philippines June19, 2012

Recomendados
Mais conteúdo relacionado
Semelhante a Mineral Industry Statistics
Semelhante a Mineral Industry Statistics (20)
Mais de No to mining in Palawan
Mais de No to mining in Palawan (20)
Mineral Industry Statistics
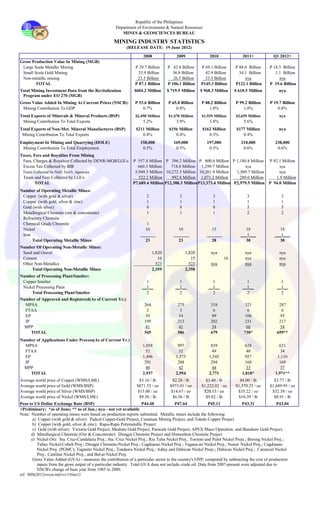
- 1. Republic of the Philippines Department of Environment & Natural Resources MINES & GEOSCIENCES BUREAU MINING INDUSTRY STATISTICS (RELEASE DATE: 19 June 2012) 2008 2009 2010 2011+ Q1 2012+ Gross Production Value In Mining (MGB) Large Scale Metallic Mining P 29.7 Billion P 42.8 Billion P 69.1 Billion P 88.0 Billion P 18.5 Billion Small Scale Gold Mining 33.9 Billion 36.8 Billion 42.9 Billion 34.1 Billion 1.1 Billion Non-metallic mining 23.5 Billion 26.5 Billion 33.3 Billion nya nya TOTAL P 87.1 Billion P 106.1 Billion P145.3 Billion P122.1 Billion P 19.6 Billion Total Mining Investment Data from the Revitalization $604.2 Million $ 719.5 Million $ 968.3 Million $ 618.5 Million nya Program under EO 270 (MGB) Gross Value Added In Mining At Current Prices (NSCB): P 53.6 Billion P 65.8 Billion P 88.2 Billion P 99.2 Billion P 19.7 Billion Mining Contribution To GDP 0.7% 0.8% 1.0% 1.0% 0.8% Total Exports of Minerals & Mineral Products (BSP) $2,498 Million $1,470 Million $1,929 Million $2,659 Million nya Mining Contribution To Total Exports 5.2% 3.9% 3.8% 5.6% Total Exports of Non-Met. Mineral Manufactures (BSP) $211 Million $156 Million $162 Million $177 Million nya Mining Contribution To Total Exports 0.4% 0.4% 0.3% 0.4% Employment In Mining and Quarrying (DOLE) 158,000 169,000 197,000 210,000 238,000 Mining Contribution To Total Employment 0.5% 0.5% 0.5% 0.6% 0.6% Taxes, Fees and Royalties From Mining Fees, Charges & Royalties Collected by DENR-MGB/LGUs P 557.4 Million P 396.2 Million P 800.6 Million P 1,180.8 Million P 92.1 Million Excise Tax Collected by BIR 660.3 Million 718.8 Million 1,299.7 Million nya nya Taxes Collected by Nat'l. Gov't. Agencies 5,949.5 Million 10,272.5 Million 10,201.9 Million 1,509.7 Million nya Taxes and Fees Collected by LGUs 522.2 Million 992.8 Million 1,071.2 Million 289.0 Million 1.9 Million TOTAL P7,689.4 Million P12,380.3 Million P13,373.4 Million P2,979.5 Million P 94.0 Million Number of Operating Metallic Mines: Copper (with gold & silver) 2 3 3 3 3 Copper (with gold, silver & zinc) 1 1 1 1 1 Gold (with silver) 8 8 8 5 5 Metallurgical Chromite (ore & concentrate) 1 1 1 2 2 Refractory Chromite Chemical Grade Chromite 1 Nickel 10 10 15 18 18 Iron _______ _______ _______ ___1___ ___1___ Total Operating Metallic Mines 23 23 28 30 30 Number Of Operating Non-Metallic Mines: Sand and Gravel 1,820 1,820 nya nya nya Cement 16 15 16 nya nya Other Non-Metallics 523 523 nya nya nya Total Operating Non-Metallic Mines 2,359 2,358 Number of Processing Plant/Smelter: Copper Smelter 1 1 1 1 1 Nickel Processing Plant __1__ __1__ __1__ __1__ __1__ Total Processing Plant/Smelter 2 2 2 2 2 Number of Approved and Registered(As of Current Yr.) MPSA 264 275 318 321 287 FTAA 2 3 6 6 6 EP 39 54 99 106 95 IP 199 213 202 231 217 MPP 41 41 54 66 54 TOTAL 545 586 679 730* 659** Number of Applications Under Process(As of Current Yr.) MPSA 1,058 997 839 628 621 FTAA 52 52 49 40 34 EP 1,496 1,575 1,545 957 1,110 IP 291 288 294 160 169 MPP 40 42 44 33 37 TOTAL 2,937 2,954 2,771 1,818* 1,971** Average world price of Copper (WMS/LME) $3.16 / lb $2.28 / lb $3.40 / lb $4.00 / lb $3.77 / lb Average world price of Gold (WMS/BSP) $871.52 / oz $973.01 / oz $1,222.02 / oz $1,570.25 / oz $1,689.95 / oz Average world price of Silver (WMS/BSP) $15.00 / oz $14.67 / oz $20.13 / oz $35.22 / oz $32.58 / oz Average world price of Nickel (WMS/LME) $9.58 / lb $6.56 / lb $9.82 / lb $10.39 / lb $8.91 / lb Peso to US Dollar Exchange Rate (BSP) P44.48 P47.64 P45.11 P43.31 P43.04 +Preliminary; *as of June; ** as of Jan.; nya - not yet available Note: Number of operating mines were based on production reports submitted. Metallic mines include the following: a) Copper (with gold & silver): Padcal Copper-Gold Project, Canatuan Mining Project, and Toledo Copper Project b) Copper (with gold, silver & zinc): Rapu-Rapu Polymetallic Project c) Gold (with silver): Victoria Gold Project, Masbate Gold Project, Paracale Gold Project, APEX Maco Operation, and Banahaw Gold Project, d) Metallurgical Chromite (Ore & Concentrate): Dinagat Chromite Project and Homonhon Chromite Project e) Nickel Ore: Sta. Cruz-Candelaria Proj.; Sta. Cruz Nickel Proj.; Rio Tuba Nickel Proj.; Toronto and Pulot Nickel Projs.; Berong Nickel Proj.; Tubay Nickel-Cobalt Proj.; Dinagat Chromite-Nickel Proj.; Cagdianao Nickel Proj.; Tagana-an Nickel Proj.; Nonoc Nickel Proj.; Cagdianao Nickel Proj. (PGMC); Taganito Nickel Proj.; Tandawa Nickel Proj.; Adlay and Dahican Nickel Projs.; Dahican Nickel Proj.; Carrascal Nickel Proj.; Cantilan Nickel Proj.; and Bel-at Nickel Proj. Gross Value Added (GVA) - measures the contribution of a particular sector to the country's GNP; computed by subtracting the cost of production inputs from the gross output of a particular industry. Total GVA does not include crude oil. Data from 2007-present were adjusted due to NSCB's change of base year from 1985 to 2000. ref: MIS(2012)/econ-ind/rvs/19Jun12