Las Vegas MarketBeat Office Q2 2012
•
0 gostou•214 visualizações

Las Vegas Commercial Real Estate Office quarterly Market report

Recomendados
Recomendados
Mais conteúdo relacionado
Destaque
Destaque (20)
Semelhante a Las Vegas MarketBeat Office Q2 2012
Semelhante a Las Vegas MarketBeat Office Q2 2012 (13)
Mais de Jessica Parrish
Mais de Jessica Parrish (7)
Las Vegas MarketBeat Office Q2 2012
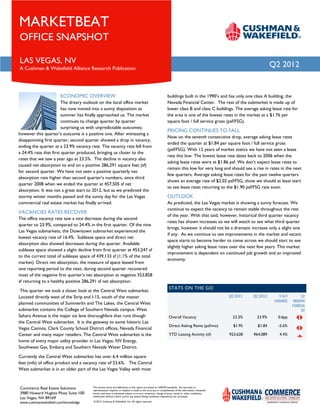
- 1. MARKETBEAT OFFICE SNAPSHOT LAS VEGAS, NV Q2 2012 A Cushman & Wakefield Alliance Research Publication ECONOMIC OVERVIEW buildings built in the 1990’s and has only one class A building, the The dreary outlook on the local office market Nevada Financial Center. The rest of the submarket is made up of has now moved into a sunny disposition as lower class B and class C buildings. The average asking lease rate for summer has finally approached us. The market the area is one of the lowest rates in the market at a $1.76 per continues to change quarter by quarter square foot / full service gross (psf/FSG). surprising us with unpredictable outcomes; PRICING CONTINUES TO FALL however this quarter’s outcome is a positive one. After witnessing a Now on the seventh consecutive drop, average asking lease rates disappointing first quarter, second quarter showed a drop in vacancy, ended the quarter at $1.84 per square foot / full service gross ending the quarter at a 23.9% vacancy rate. The vacancy rate fell from (psf/FSG). With 12 years of market statics we have not seen a lease a 24.4% rate that first quarter produced, bringing us closer to the rate this low. The lowest lease rate dates back to 2006 when the rates that we saw a year ago at 23.5%. The decline in vacancy also asking lease rates were at $1.86 psf. We don’t expect lease rates to caused net absorption to end on a positive 286,291 square feet (sf) remain this low for very long and should see a rise in rates in the next for second quarter. We have not seen a positive quarterly net few quarters. Average asking lease rates for the past twelve quarters absorption rate higher than second quarter’s numbers, since third shows an average rate of $2.02 psf/FSG, show we should at least start quarter 2008 when we ended the quarter at 457,505 sf net to see lease rates returning to the $1.90 psf/FSG rate soon. absorption. It was not a great start to 2012, but as we predicted the stormy winter months passed and the sunny day for the Las Vegas OUTLOOK commercial real estate market has finally arrived. As predicted, the Las Vegas market is showing a sunny forecast. We continue to expect the vacancy to remain stable throughout the rest VACANCIES RATES RECOVER of the year. With that said, however, historical third quarter vacancy The office vacancy rate saw a nice decrease during the second rates has shown increases so we will watch to see what third quarter quarter to 23.9%, compared to 24.4% in the first quarter. Of the nine brings, however it should not be a dramatic increase only a slight one Las Vegas submarkets, the Downtown submarket experienced the if any. As we continue to see improvements in the market and vacant lowest vacancy rate of 16.4%. Sublease space and direct net space starts to become harder to come across we should start to see absorption also showed decreases during the quarter. Available slightly higher asking lease rates over the next few years. This market sublease space showed a slight decline from first quarter at 453,247 sf improvement is dependent on continued job growth and an improved to the current total of sublease space of 439,133 sf (1.1% of the total economy. market). Direct net absorption, the measure of space leased from one reporting period to the next, during second quarter recovered most of the negative first quarter’s net absorption at negative 353,858 sf returning to a healthy positive 286,291 sf net absorption. STATS ON THE GO This quarter we took a closer look at the Central West submarket. Located directly west of the Strip and I-15, south of the master Q2 2011 Q2 2012 Y-O-Y 12 CHANGE MONTH planned communities of Summerlin and The Lakes, the Central West FORECA submarket contains the College of Southern Nevada campus. West ST Sahara Avenue is the major six lane thoroughfare that runs though Overall Vacancy 23.3% 23.9% 0.6pp the Central West submarket. It is the gateway to some historic Las Direct Asking Rents (psf/mo) $1.95 $1.84 -5.6% Vegas Casinos, Clark County School District offices, Nevada Financial Center and many major retailers. The Central West submarket is the YTD Leasing Activity (sf) 923,628 964,089 4.4% home of every major utility provider in Las Vegas; NV Energy, Southwest Gas, Embarq and Southern Nevada Water District. Currently the Central West submarket has over 6.4 million square feet (mfs) of office product and a vacancy rate of 23.6%. The Central West submarket is in an older part of the Las Vegas Valley with most Commerce Real Estate Solutions The market terms and definitions in this report are based on NAIOP standards. No warranty or representation, express or implied, is made to the accuracy or completeness of the information contained 3980 Howard Hughes Pkwy Suite 100 herein, and same is submitted subject to errors, omissions, change of price, rental or other conditions, withdrawal without notice, and to any special listing conditions imposed by our principals. Las Vegas, NV 89169 www.cushmanwakefield.com/knowledge © 2012 Cushman & Wakefield, Inc. All rights reserved.
- 2. DIRECT RENTAL VS. VACANCY RATES OVERALL OCCUPIER ACTIVITY $30.00 30.0% 5.0 4.0 25.0% $25.00 3.0 psf/yr msf 20.0% 2.0 $20.00 15.0% 1.0 3.5 0.4 3.9 0.3 3.1 0.4 3.1 0.2 1.2 0.2 $15.00 10.0% 0.0 2008 2009 2010 2011 Q2 12 2008 2009 2010 2011 2012 YTD DIRECT GROSS RENTAL RATE DIRECT VACANCY RATE LEASING ACTIVITY USER SALES ACTIVITY MARKET HIGHLIGHTS Significant Q2 2012 Lease Transactions SUBMARKET TENANT BUILDING CLASS SQUARE FEET 2301-2381 Renaissance Dr Central East Ballroom Addiction C 8,168 231-299 W Charleston Blvd Downtown MPR Corp C 12,890 6850 Bermuda Rd Airport ResortCom International C 23,306 Significant Q2 2012 Sale Transactions SUBMARKET BUYER PURCHASE PRICE / $PSF SQUARE FEET 2451 S Buffalo Dr West 2451 S Buffalo Drive LLC $2,000,000 / $55 psf 36,458 2975 S Rainbow Blvd West CMA VII LLC $1,850,000 / $48 psf 38,784 9260 W Sunset Rd Southwest Southern Hills Medical Center LLC $3,445,000 / $35 psf 97,425 Significant Q2 2012 Construction Completions SUBMARKET MAJOR TENANT COMPLETION DATE SQUARE FEET N/A Significant Projects Under Construction SUBMARKET MAJOR TENANT COMPLETION DATE SQUARE FEET N/A * RENEWAL - NOT INCLUDED IN LEASING ACTIVITY STATISTICS Commerce Real Estate Solutions The market terms and definitions in this report are based on NAIOP standards. No warranty or representation, express or implied, is made to the accuracy or completeness of the information contained 3980 Howard Hughes Pkwy Suite 100 herein, and same is submitted subject to errors, omissions, change of price, rental or other conditions, withdrawal without notice, and to any special listing conditions imposed by our principals. Las Vegas, NV 89169 www.cushmanwakefield.com/knowledge © 2012 Cushman & Wakefield, Inc. All rights reserved.
- 3. Commerce Real Estate Solutions a Cushman & Wakefield Alliance Las Vegas Office Market Report Q2 2012 Professional Buildings Inventory Vacancy Demand & Supply Pricing No. of Existing Under Const. Planned Vacancy Net Space Gross Space New Sub Asking Rent (FSG) Bldgs. SF SF SF SF Rate Occupied Leased Supply Lease W Avg. Northwest Class TTA 1 187,410 - - 187,410 100.00% - - - - $2.10 Class LTA - - - - - 0.00% - - - - Class TTB 1 49,532 - - 13,669 27.60% 2,500 2,500 - - $1.99 Class LTB 22 719,849 - - 211,957 29.44% 6,851 6,851 - - $1.99 Class TTC 83 1,293,051 - - 317,727 24.57% 18,850 36,146 - - $1.49 Class LTC - - - - - 0.00% - - - - Total 107 2,249,842 - - 730,763 32.48% 28,201 45,497 - - $1.89 Downtown Class TTA 3 655,254 - - 54,768 8.36% (4,342) - - 6,143 $2.67 Class LTA 1 103,951 - - 12,123 11.66% - - - - $2.35 Class TTB - - - - - 0.00% - - - - Class LTB 11 474,872 - - 117,061 24.65% 29,491 29,491 - 3,126 $2.25 Class TTC 7 215,154 - - 53,514 24.87% 25,308 25,308 - - $1.55 Class LTC 38 638,701 - - 104,669 16.39% 15,780 22,992 - - $1.72 Total 60 2,087,932 - - 342,135 16.39% 66,237 77,791 - 9,269 $2.11 Central East Class TTA 5 995,120 - - 156,736 15.75% 28,660 28,660 - 66,717 $2.70 Class LTA 5 387,590 - - 129,104 33.31% (9,755) 3,825 - 18,965 $2.64 Class TTB - - - - - 0.00% - - - - Class LTB 6 529,138 - - 194,626 36.78% 9,840 20,019 - - $1.26 Class TTC 83 2,725,930 - - 782,262 28.70% (9,636) 25,019 - 12,235 $1.23 Class LTC 48 1,149,789 - - 254,074 22.10% (84,654) - - 12,287 $1.17 Total 147 5,787,567 - - 1,516,802 26.21% (65,545) 77,523 - 110,204 $1.80 Central West Class TTA - - - - - 0.00% - - - - Class LTA 1 157,624 - - 17,514 11.11% (13,204) - - - $2.35 Class TTB - - - - - 0.00% - - - - Class LTB 66 2,879,574 - - 858,793 29.82% (25,928) 28,502 - 3,147 $1.48 Class TTC 138 2,703,092 - - 552,934 20.46% (8,248) 14,286 - 4,929 $1.54 Class LTC 49 696,046 - - 87,046 12.51% 19,096 19,096 - - $1.65 Total 254 6,436,336 - - 1,516,287 23.56% (28,284) 61,884 - 8,076 $1.76 West Class TTA 1 143,633 - - 15,896 11.07% 23,252 23,252 - 454 $2.85 Class LTA 5 627,780 - - 188,571 30.04% 86,901 89,209 - - $2.23 Class TTB 15 928,871 - - 235,535 25.36% 21,549 38,458 - 8,848 $2.03 Class LTB 60 1,750,332 - - 376,377 21.50% (34,922) 16,889 - 44,138 $1.70 Class TTC 261 3,184,795 - - 701,292 22.02% (857) 65,903 - 29,834 $1.38 Class LTC 8 166,229 - - 44,577 26.82% 9,363 9,869 - - $1.32 Total 350 6,801,640 - - 1,562,248 22.97% 105,286 243,580 - 83,274 $1.92 Southwest Class TTA 1 220,718 - - 121,999 55.27% - - - - $2.58 Class LTA 1 108,533 - - 47,734 43.98% - - - - $2.58 Class TTB 25 1,463,704 - - 353,015 24.12% (11,110) 12,363 - 46,519 $2.36 Class LTB 58 1,643,020 - - 237,912 14.48% 9,737 19,334 - 37,880 $1.91 Class TTC 145 1,581,074 - - 353,354 22.35% (9,730) 20,319 - 6,700 $1.41 Class LTC 6 115,851 - - 38,886 33.57% - - - - $1.66 Total 236 5,132,900 - - 1,152,900 22.46% (11,103) 52,016 - 91,099 $2.08 Airport Class TTA - - - - - 0.00% - - - - Class LTA 4 384,464 - - 118,515 30.83% (5,070) 35,836 - - $2.55 Class TTB 14 985,738 - - 157,388 15.97% 15,108 17,527 - 21,498 $1.64 Class LTB 34 1,668,364 - - 309,760 18.57% 14,995 47,453 - 40,121 $1.85 Class TTC 162 1,862,445 - - 460,748 24.74% 106,588 116,538 - - $1.00 Class LTC - - - - - 0.00% - - - - Total 214 4,901,011 - - 1,046,411 21.35% 131,621 217,354 - 61,619 $1.76 Southeast Class TTA - - - - - 0.00% - - - - Class LTA 4 405,796 - - 213,480 52.61% 4,875 5,945 - - $2.25 Class TTB 20 872,950 - - 166,076 19.02% 70,558 74,780 - 31,196 $1.88 Class LTB 57 1,793,651 - - 500,761 27.92% 12,169 45,620 - - $1.88 Class TTC 320 4,079,098 - - 973,062 23.85% 23,064 36,107 - 44,396 $1.45 Class LTC - - - - - 0.00% - - - - Total 401 7,151,495 - - 1,853,379 25.92% 110,666 162,452 - 75,592 $1.87 North Class TTA - - - - - 0.00% - - - - Class LTA - - - - - 0.00% - - - - Class TTB - - - - - 0.00% - - - - Class LTB 4 132,667 - - 98,003 73.87% (13,578) - - - $1.45 Class TTC 65 1,239,698 - - 269,320 21.72% (37,210) 25,992 - - $1.29 Class LTC 18 265,572 - - 21,914 8.25% - - - - $1.50 Total 87 1,637,937 - - 389,237 23.76% (50,788) 25,992 - - $1.41 Las Vegas Total Class TTA 11 2,202,135 - - 536,809 24.38% 47,570 51,912 - 73,314 $2.58 Class LTA 21 2,175,738 - - 727,041 33.42% 63,747 134,815 - 18,965 $2.42 Class TTB 75 4,300,795 - - 925,683 21.52% 98,605 145,628 - 108,061 $1.98 Class LTB 318 11,591,467 - - 2,905,250 25.06% 8,655 214,159 - 128,412 $1.75 Class TTC 1,264 18,884,337 - - 4,464,213 23.64% 108,129 365,618 - 98,094 $1.37 Class LTC 167 3,032,188 - - 551,166 18.18% (40,415) 51,957 - 12,287 $1.50 Total 1,856 42,186,660 - - 10,110,162 23.97% 286,291 964,089 - 439,133 $1.84 Commerce Real Estate Solutions The market terms and definitions in this report are based on NAIOP standards. No warranty or representation, express or implied, is made to the accuracy or completeness of the information contained 3980 Howard Hughes Pkwy Suite 100 herein, and same is submitted subject to errors, omissions, change of price, rental or other conditions, withdrawal without notice, and to any special listing conditions imposed by our principals. Las Vegas, NV 89169 www.cushmanwakefield.com/knowledge © 2012 Cushman & Wakefield, Inc. All rights reserved.
- 4. Las Vegas Professional Office Market Overview 2000-2012 YTD 12,000,000 30.00% 11,000,000 23.97% 10,000,000 23.08% 23.78% 25.00% 9,000,000 20.79% 8,000,000 20.00% 17.30% 7,000,000 15.77% 15.28% Square Feet Vacancy 14.42% 14.72% 6,000,000 13.61% 15.00% 5,000,000 11.48% 9.32% 4,000,000 10.00% 3,000,000 2,000,000 5.00% 1,000,000 - 0.00% 18,496,038 20,020,895 22,621,906 21,752,133 25,241,786 30,199,552 48,551,573 43,975,459 42,275,163 43,043,661 42,186,660 17,337,169 Base Ave. Lease Rate Sub $1.94 $1.88 $1.87 $1.91 $2.03 $1.86 $1.91 $2.34 $2.10 $2.10 $1.91 $1.84 Ave. Lease Rate DT $2.26 $2.23 $2.16 $2.22 $2.36 $2.27 $2.29 $2.70 $2.33 $2.33 $2.16 $2.11 Year 2001 2002 2003 2004 2005 2006 2007 2008 2009 2010 2011 2012 Built Net Absorption Vacant Inventory Vacancy Commerce Real Estate Solutions The market terms and definitions in this report are based on NAIOP standards. No warranty or representation, express or implied, is made to the accuracy or completeness of the information contained 3980 Howard Hughes Pkwy Suite 100 herein, and same is submitted subject to errors, omissions, change of price, rental or other conditions, withdrawal without notice, and to any special listing conditions imposed by our principals. Las Vegas, NV 89169 www.cushmanwakefield.com/knowledge © 2012 Cushman & Wakefield, Inc. All rights reserved.